


Características


¿Tienes alguna pregunta?
Recomendar


22 diapositivas
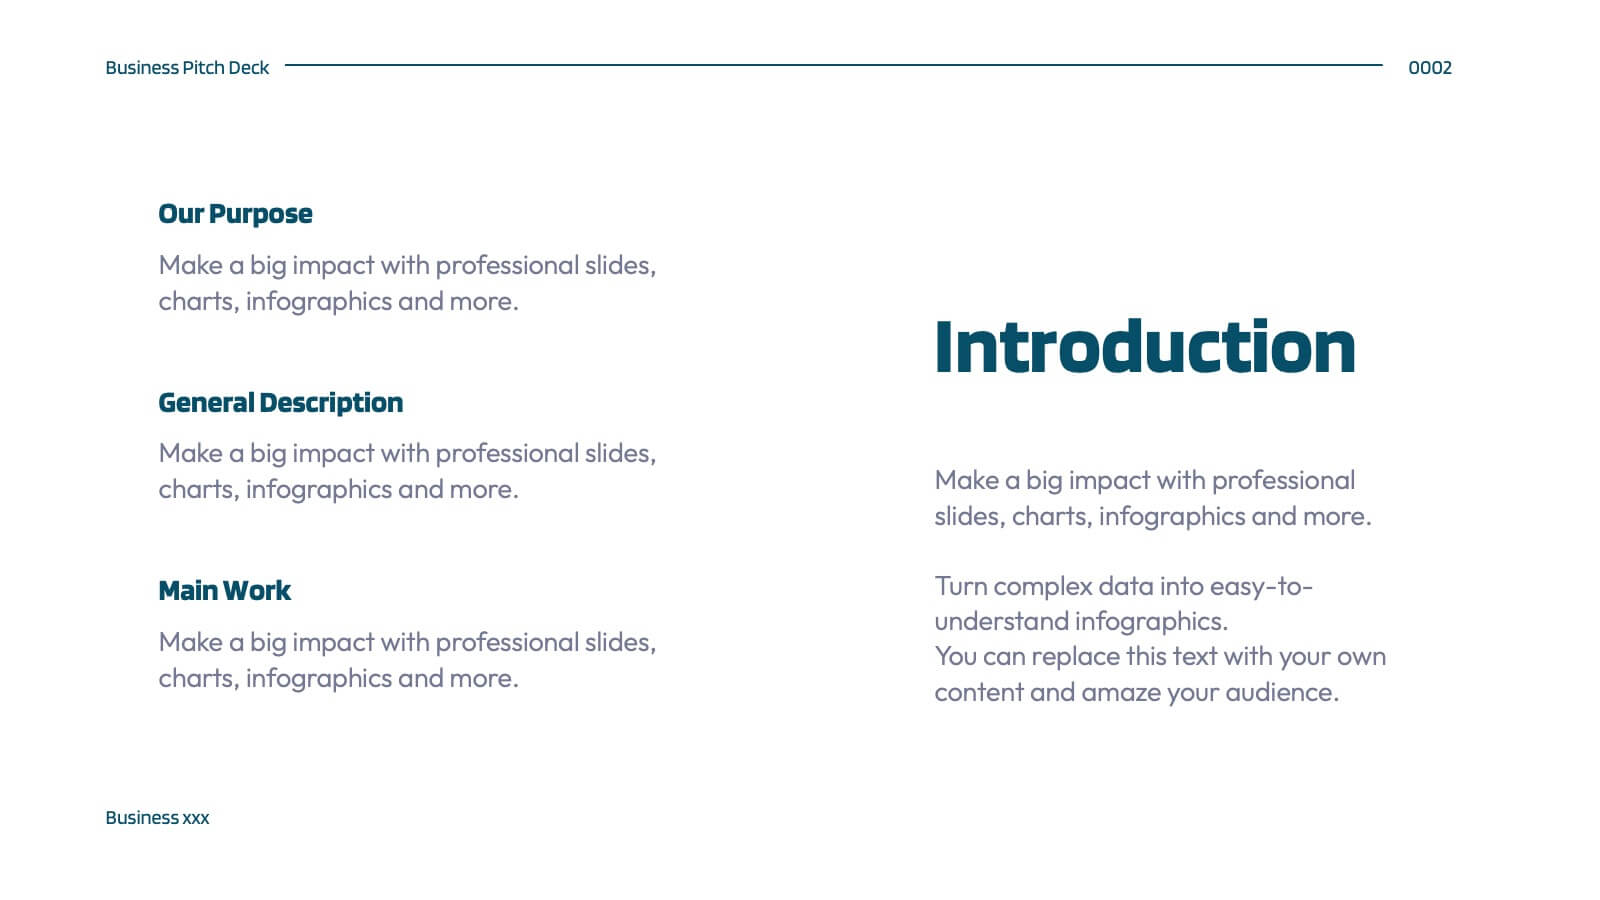
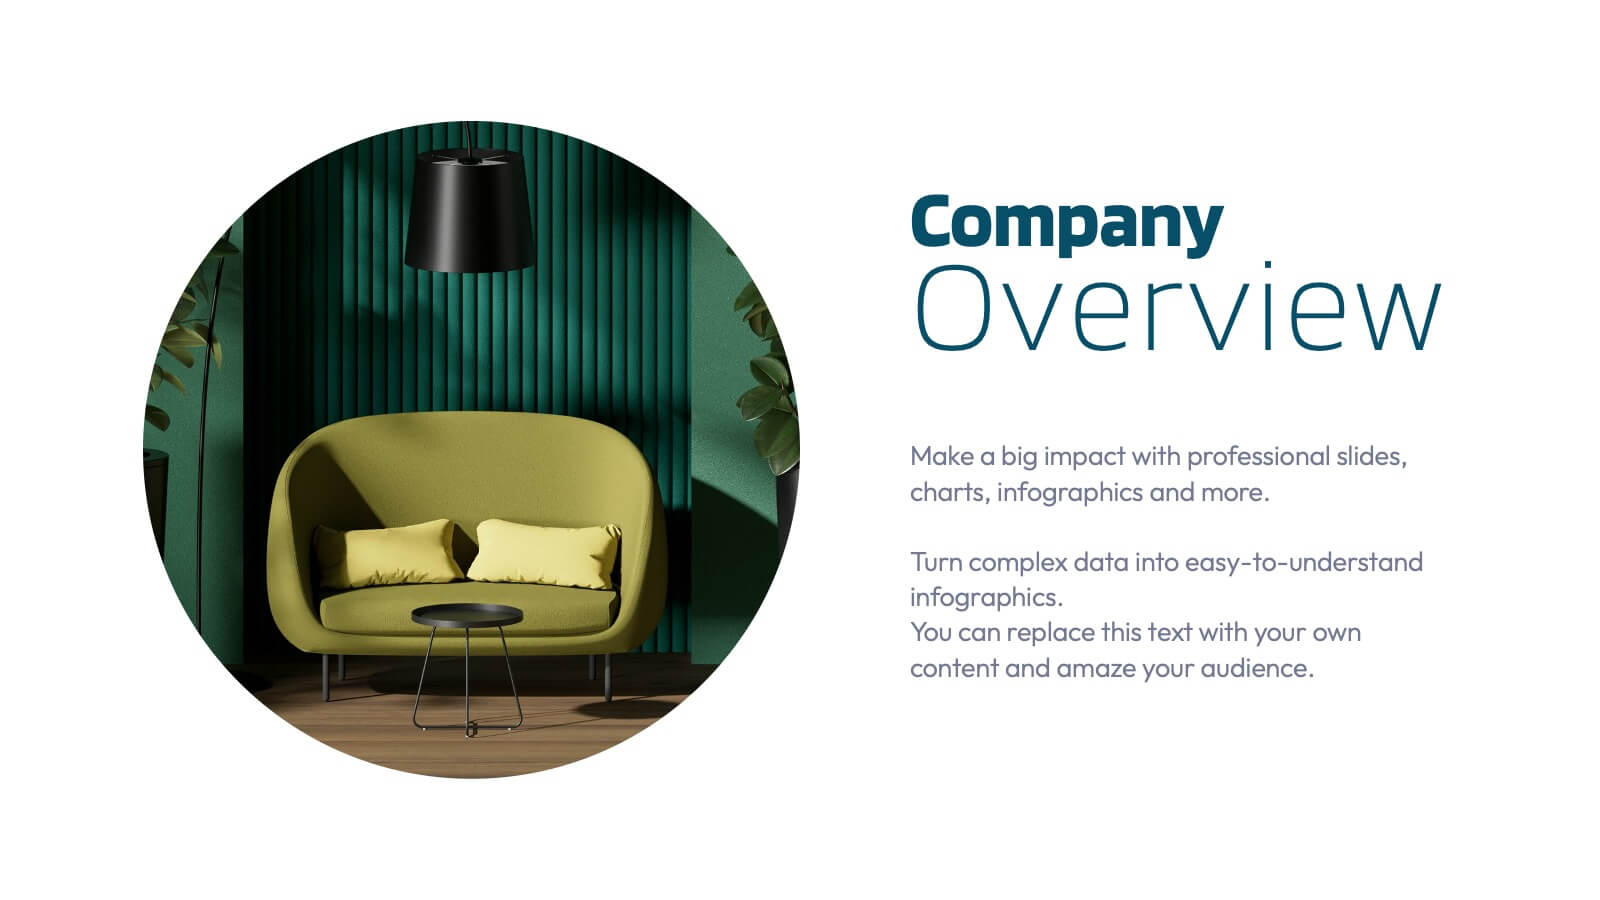
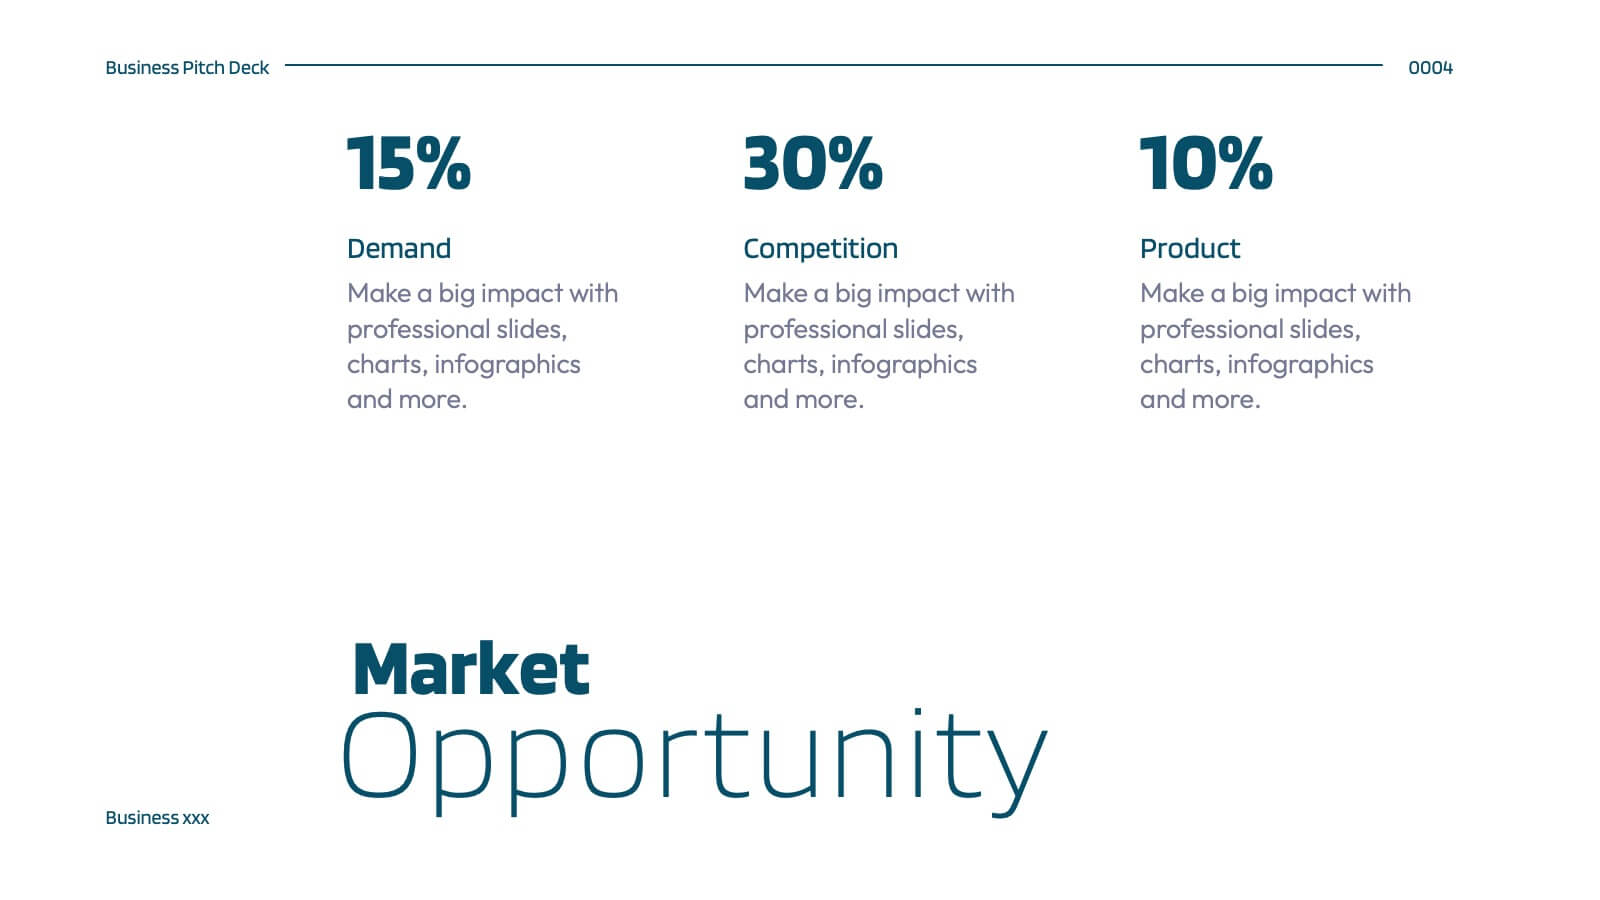
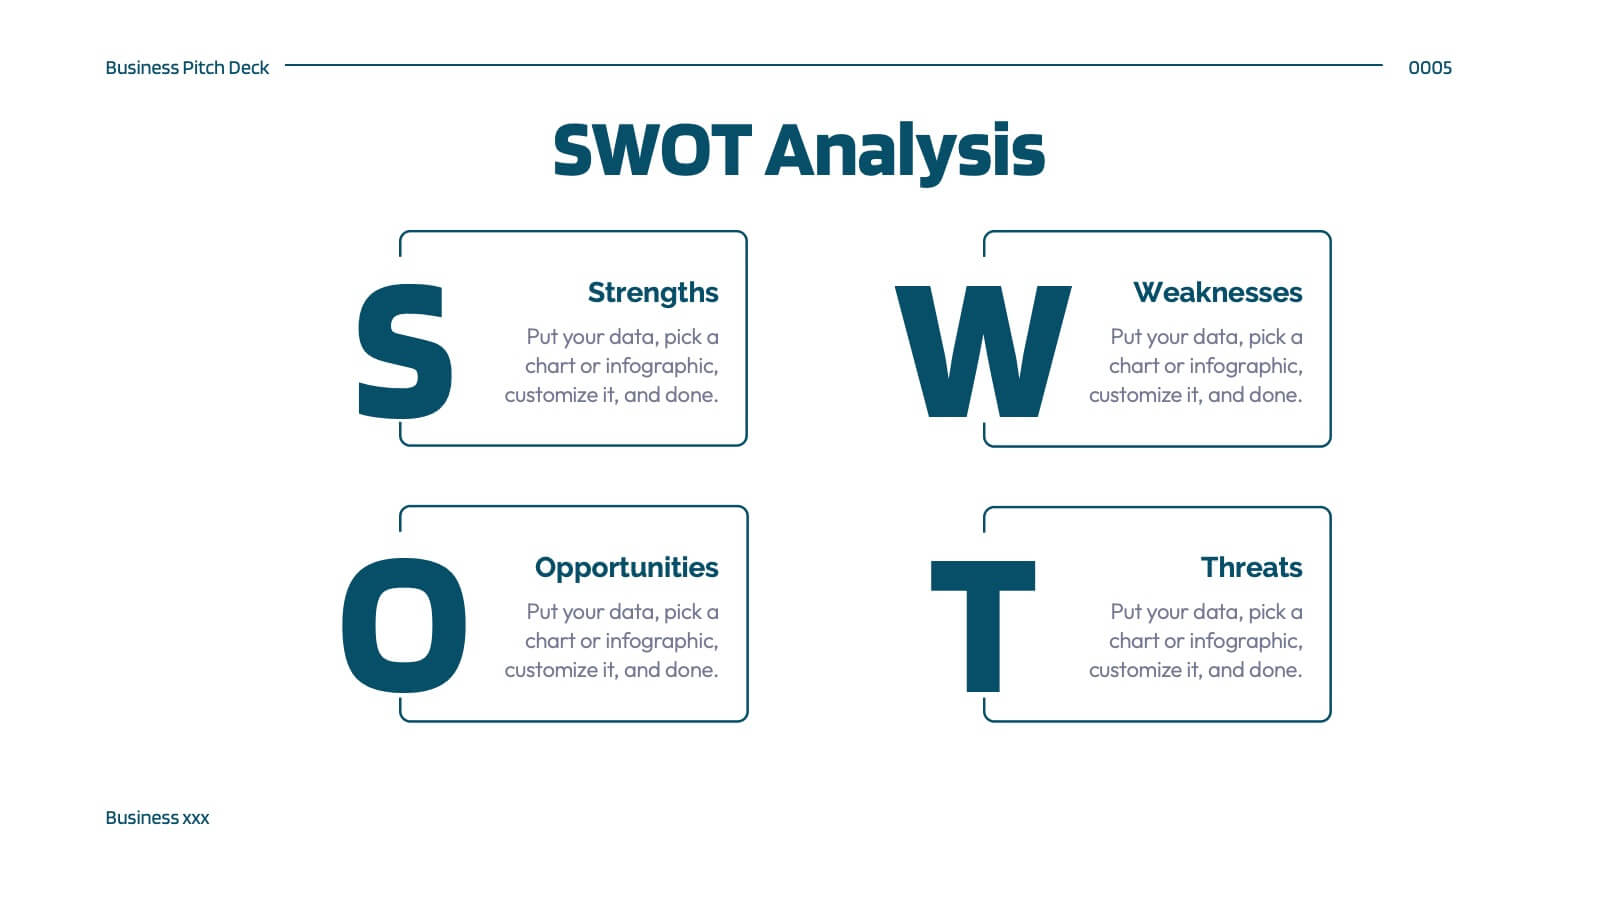
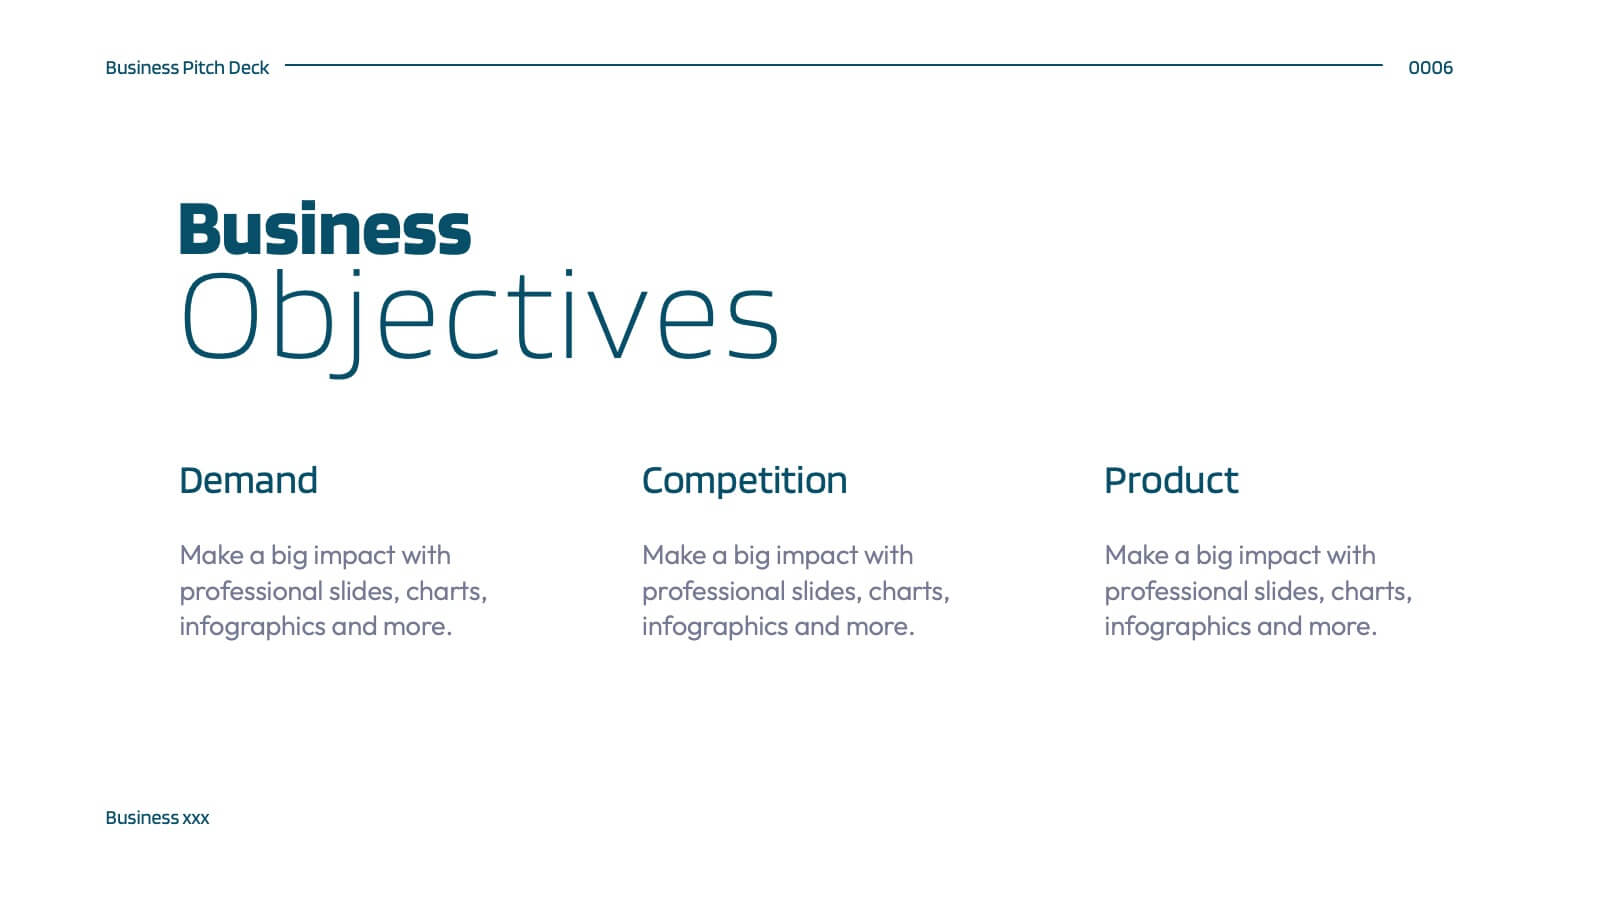
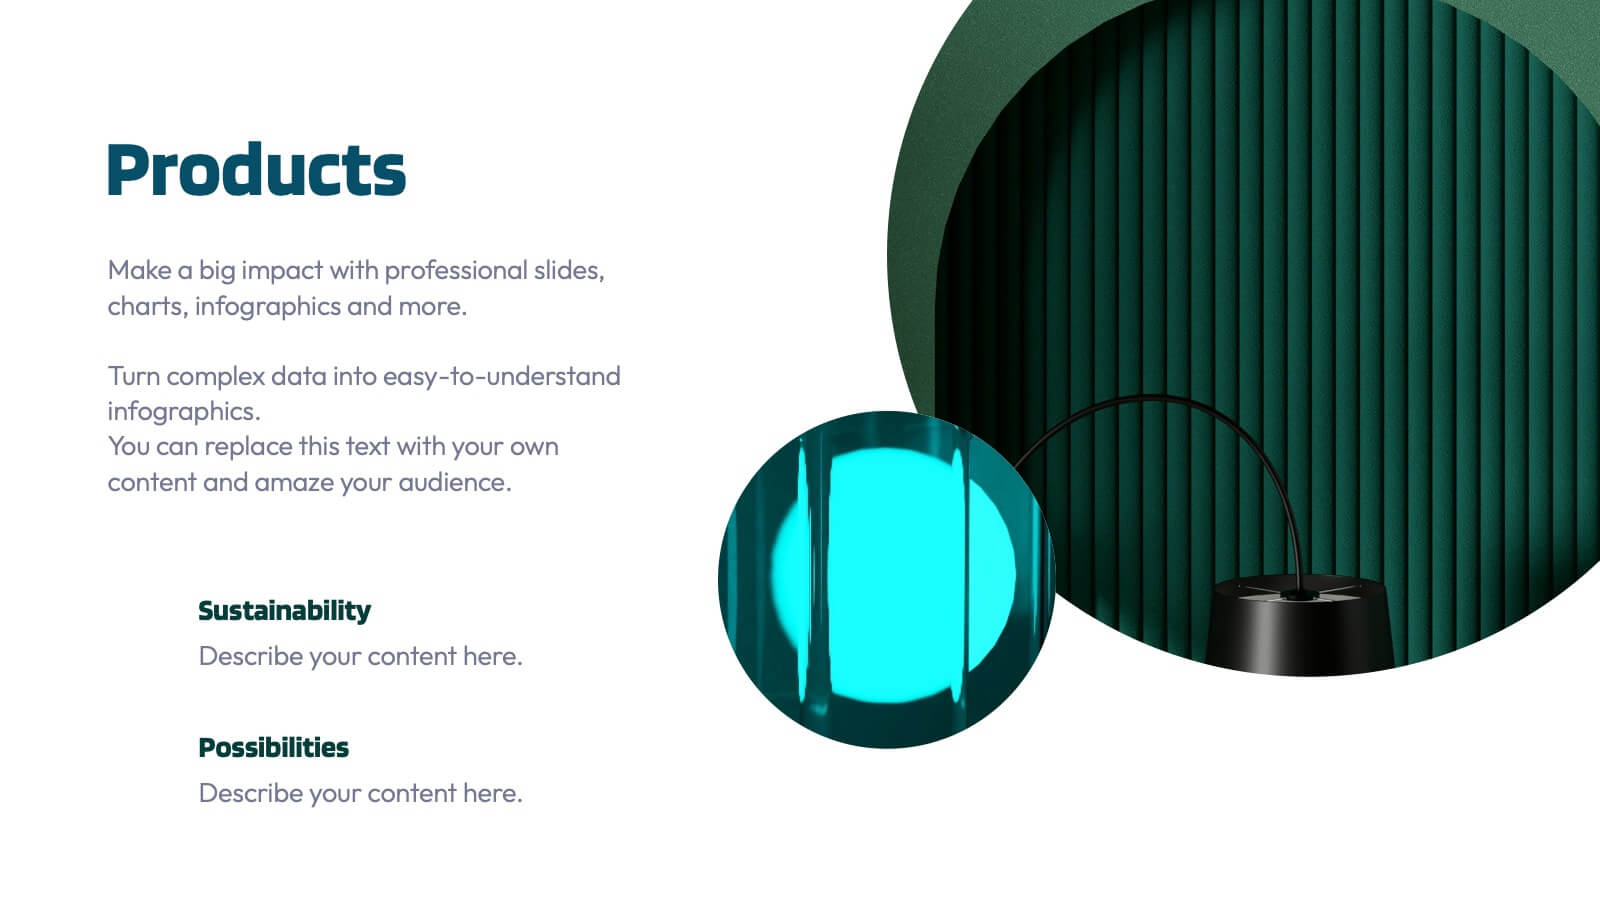
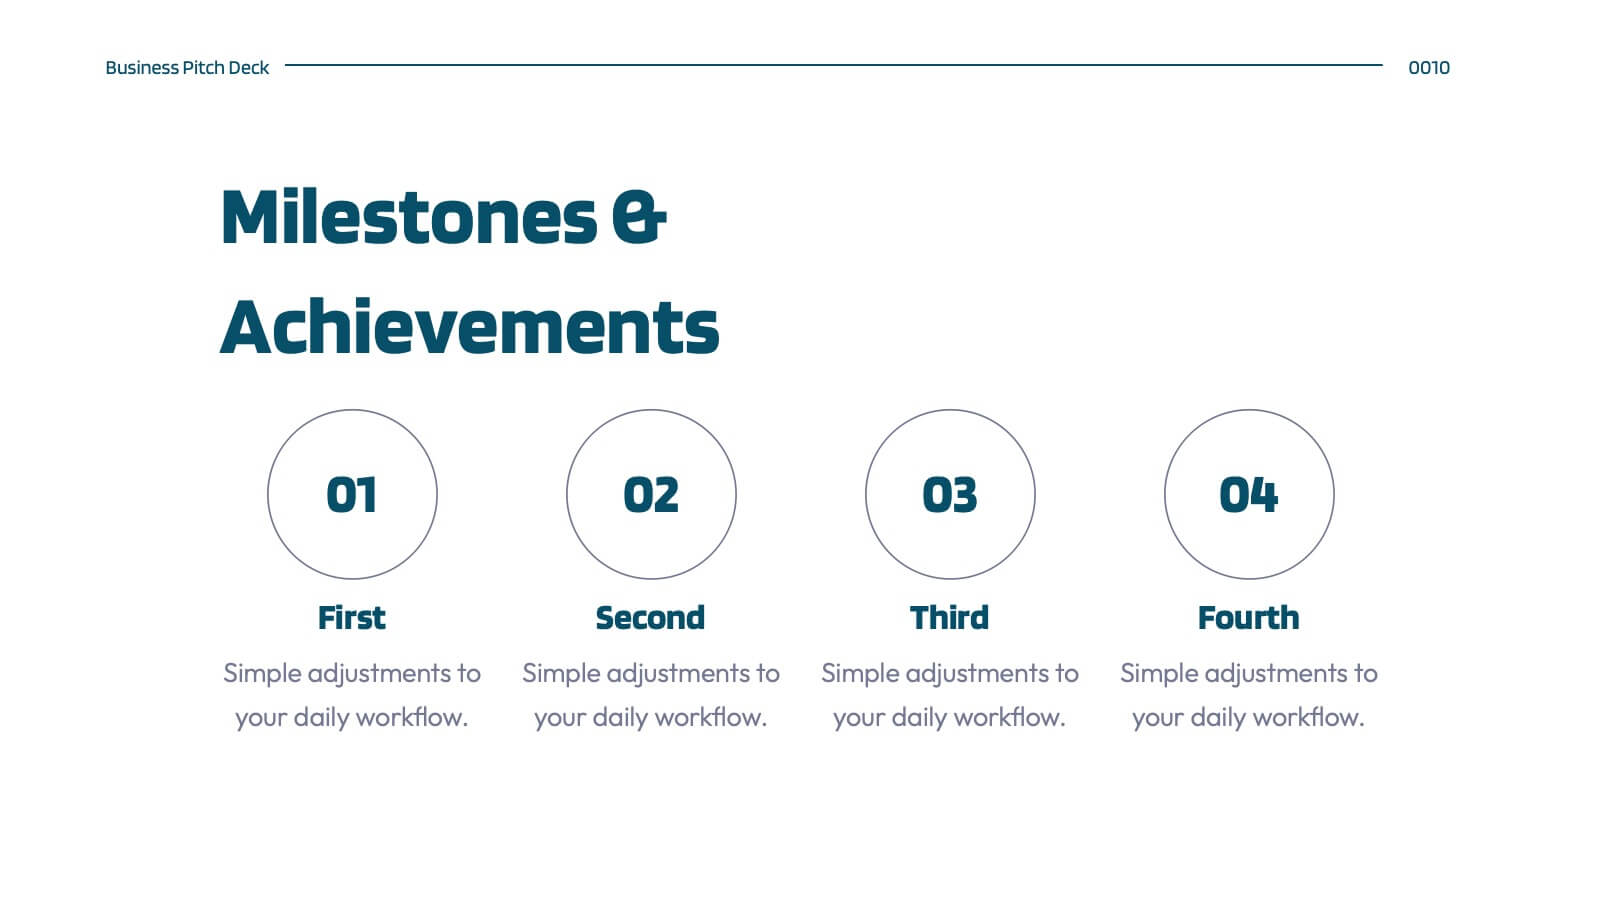
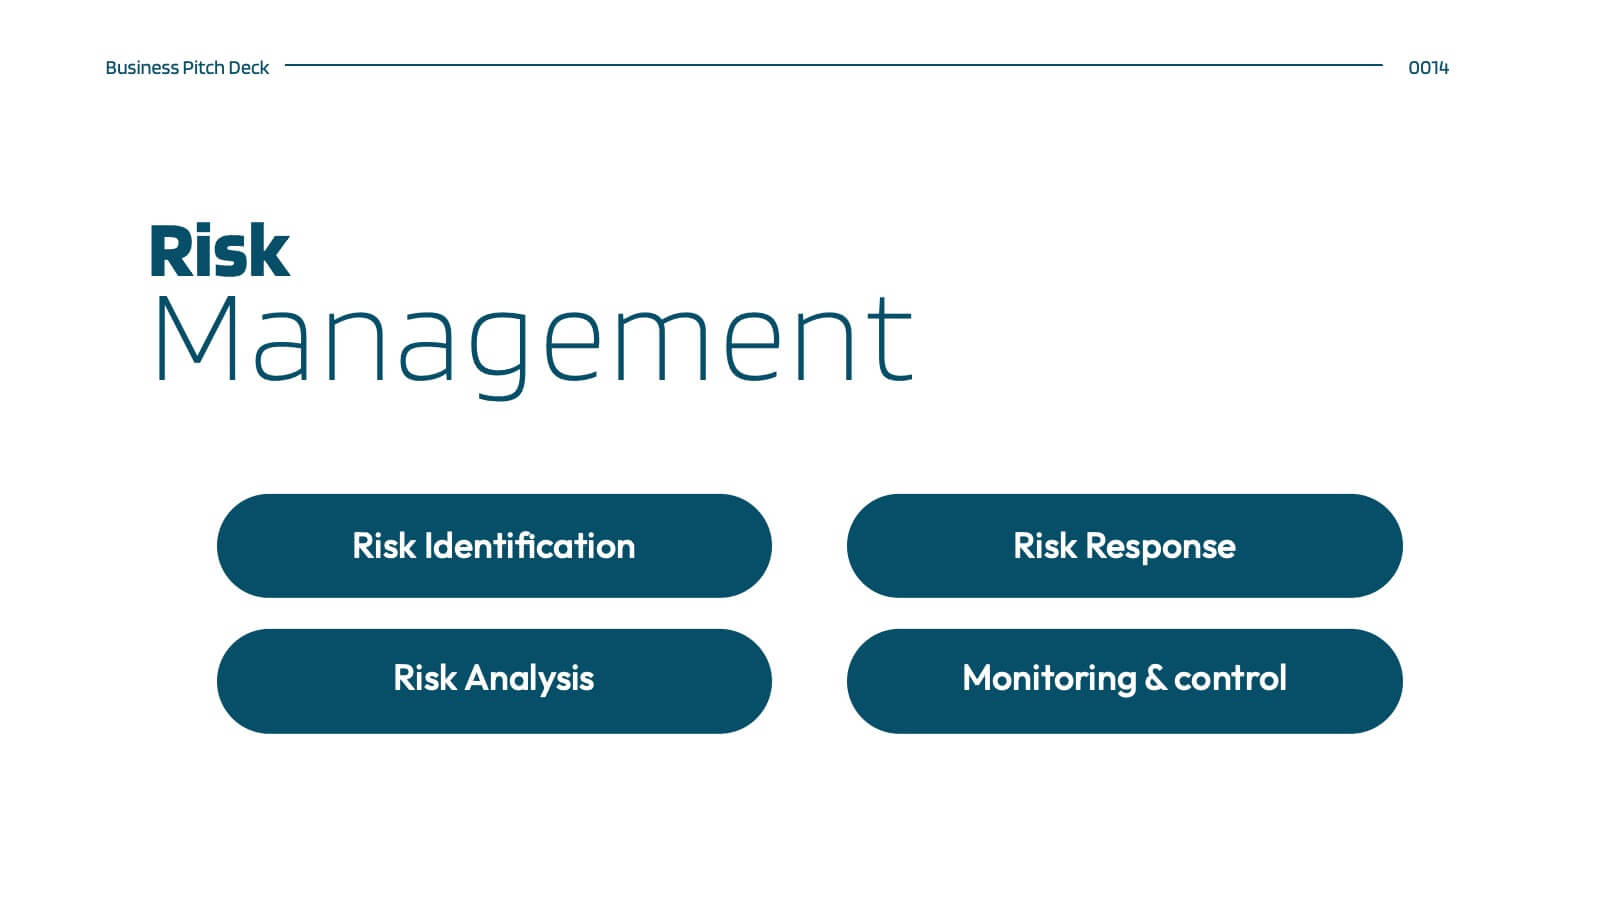
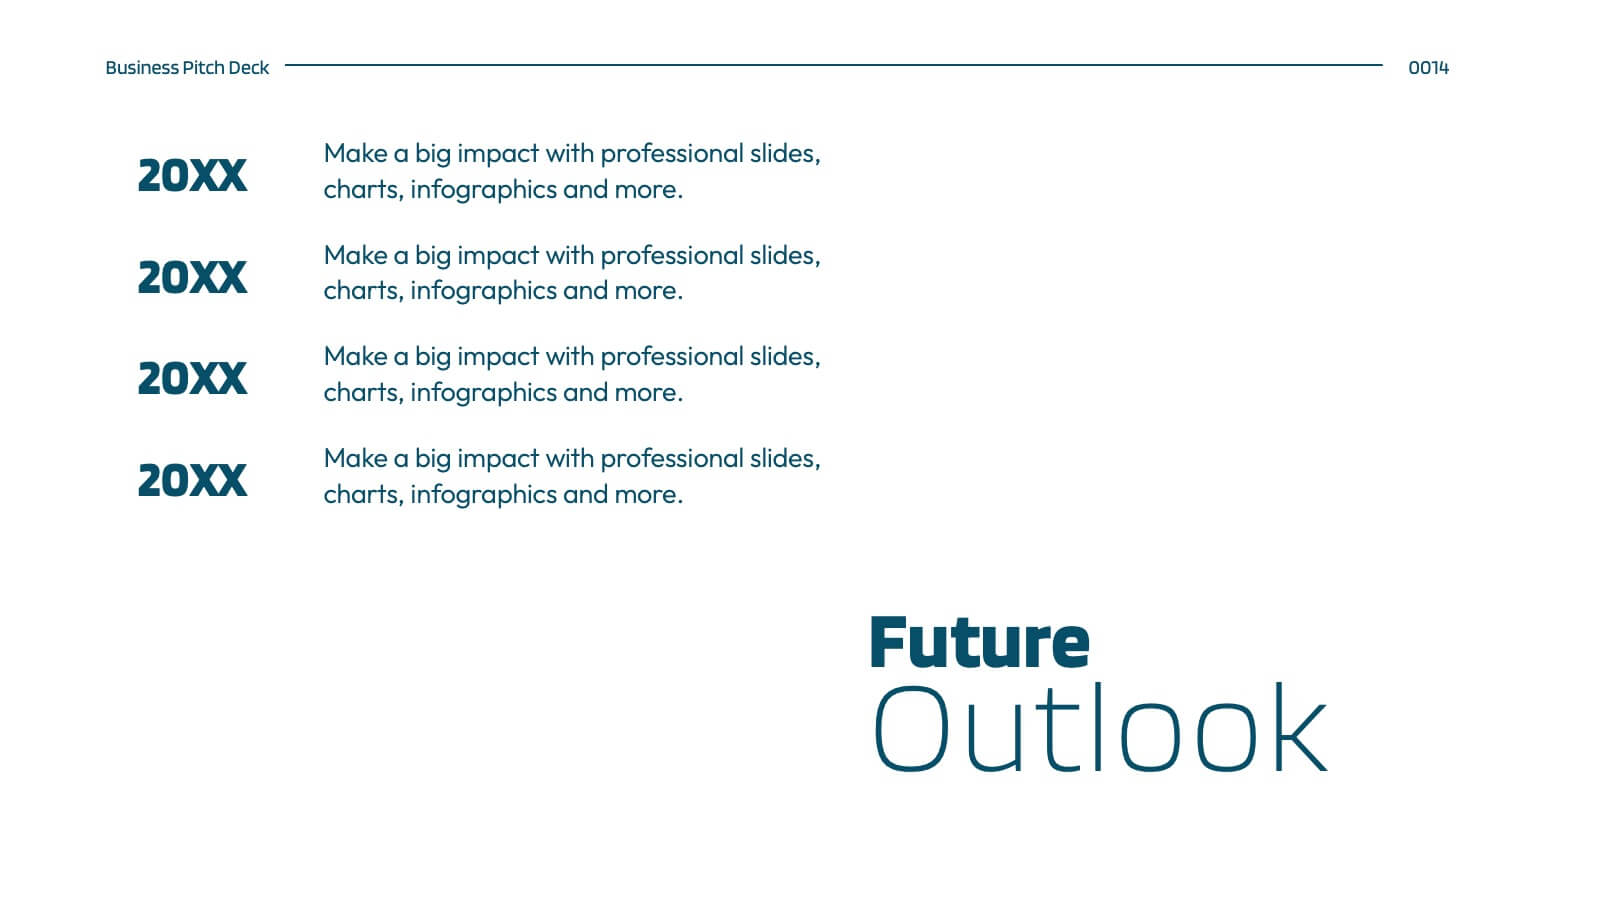
Hellenic Small Business Pitch Deck Presentation
Unleash the spirit of entrepreneurship with this captivating Hellenic-themed presentation! Designed specifically for small business pitches, this template allows you to showcase your business concept, market analysis, and financial plans with elegance and clarity. Its vibrant visuals will engage your audience and leave a lasting impression. Compatible with PowerPoint, Keynote, and Google Slides.


4 diapositivas
Key Stakeholder Identification Presentation
A great presentation starts with clarity, and this slide brings your message to life with bold, visual focus. Use it to break down key stakeholder groups, highlight their roles, and communicate insights with ease. Clean lines and intuitive icons keep everything clear and engaging. Fully compatible with PowerPoint, Keynote, and Google Slides.


21 diapositivas
Design Creative Concept Presentation
Enhance your creative presentations with this Creative Concept template. It features slides for objectives, color palettes, typography options, and prototyping steps. Ideal for designers and creative teams, this template supports PowerPoint, Keynote, and Google Slides, facilitating a comprehensive and engaging presentation of creative projects.


6 diapositivas
Profit vs Cost Analysis Presentation
Make your numbers tell a story of balance and success with this clean, data-driven presentation design. Perfect for comparing expenses and gains, it helps showcase business efficiency, growth, and decision-making clarity. Fully customizable and compatible with PowerPoint, Keynote, and Google Slides for a professional and seamless presentation experience.


6 diapositivas
Country Highlight Map North America Presentation
Showcase your regional focus with a clean, data-driven map that highlights key areas across the United States. Perfect for presenting business coverage, demographic data, or strategic expansion points, this layout keeps visuals sharp and organized. Fully compatible with PowerPoint, Keynote, and Google Slides for effortless customization and presentation.


7 diapositivas
SEO Infographic Presentation Template
SEO stands for “search engine optimization.” In simple terms, it's the process of improving your site to increase its visibility when people search for products or services related to your business in Google and other search engines. Learn more about SEO with this clean template, including how to optimize your pages and how search engines work. This template will inform you how keywords and phrases drive search engine results, how they affect rankings, and what steps to take to achieve higher rankings. This template comes packed with fun illustrations, and can be used as a great presentation.


6 diapositivas
Sustainability Management Analysis Infographics
Explore the world of Sustainability Management with our customizable infographic template. This template is fully compatible with popular presentation software like PowerPoint, Keynote, and Google Slides, allowing you to easily customize it to illustrate and communicate various aspects of sustainability management. The Sustainability Management infographic template offers a visually engaging platform to explore and explain the principles, strategies, and initiatives related to sustainability within organizations. Whether you're a sustainability professional, business leader, or simply interested in environmental responsibility, this template provides a user-friendly canvas to create informative presentations and educational materials. Deepen your understanding of Sustainability Management with this SEO-optimized infographic template, thoughtfully designed for clarity and ease of use. Customize it to highlight key sustainability goals, best practices, metrics, and the importance of sustainable business practices, ensuring that your audience gains a comprehensive understanding of this critical field. Start crafting your personalized infographic today to delve into the world of Sustainability Management.


10 diapositivas
Organizational Hierarchy Infographic Presentation
Clearly define your Organizational Hierarchy with this structured infographic template. Designed for business presentations, HR teams, and corporate strategy, this visual layout simplifies reporting structures, leadership roles, and team organization. Fully customizable and easy to edit in PowerPoint, Keynote, and Google Slides, making it perfect for internal communications and management reports.


4 diapositivas
Professional Business Meeting Agenda Presentation
Efficiently structure your next corporate gathering with the "Professional Business Meeting Agenda" presentation template. Its geometrically appealing layout organizes discussion points in a visually captivating manner, encouraging effective communication and engagement. Perfect for strategizing sessions, this template ensures that every item on your agenda is highlighted with clarity. Compatible across PowerPoint, Keynote, and Google Slides, it’s designed to make every meeting more productive.


7 diapositivas
Pyramid Model Infographic
A pyramid model is a visual representation that uses the structure of a pyramid to convey information, concepts, or hierarchies in a clear and visually engaging manner. Our Pyramid Model Infographic template is the perfect tool to depict your concepts in a structured way. This template embodies an essence, enabling you to present your ideas in a way that's both powerful and timeless. This infographic is a powerful representation of your ideas, allowing you to showcase their strength, structure, and enduring potential. Use this template to construct a visual masterpiece that stands tall, just like the pyramids of ancient times!


6 diapositivas
Bubble Diagram for Idea Development Presentation
Visualize your creative process with this Bubble Diagram for Idea Development template. Ideal for brainstorming sessions, project planning, and innovation strategies, this slide uses color-coded lightbulbs and numbered bubbles to illustrate key ideas and their relationships. Perfect for entrepreneurs, teams, and educators, it simplifies complex concepts into a clear, engaging format. Fully editable and compatible with PowerPoint, Keynote, and Google Slides for seamless customization.


5 diapositivas
New Product Innovation Plan Presentation
Bring your ideas to market with confidence using this clear and engaging presentation. Designed to showcase every stage of product development, it helps visualize innovation steps, research insights, and launch strategies with impact. Fully editable and compatible with PowerPoint, Keynote, and Google Slides for effortless customization and professional results.


7 diapositivas
App Mockup Infographic
Elevate your app demonstrations with this vibrant collection of app mockup templates, specifically designed to showcase the functionality and design of mobile applications across various devices. Each template emphasizes the user experience, presenting your app in a clear and engaging manner that highlights its most compelling features. The templates are crafted with a clean, modern aesthetic, incorporating bright colors and clear typography to draw attention to key functionalities and user interfaces. Perfect for developers and designers looking to present their apps to clients, stakeholders, or potential users, these mockups provide a professional framework for displaying apps in context. Customizable to fit your specific needs, this collection allows you to seamlessly integrate your own app designs and screenshots, making it easier than ever to convey the look and feel of your app in a realistic setting. Whether for pitches, presentations, or promotional materials, these mockups are an invaluable tool for communicating the value and operation of your application.


4 diapositivas
Data Table Infographic Presentation
Organize complex information clearly with the Data Table Infographic Presentation. This slide design features a structured table layout paired with icon-labeled column headers for visual clarity. Ideal for presenting statistics, performance metrics, survey data, or structured comparisons. Highlighted headers draw attention to key sections, making your data easy to digest. Fully editable in PowerPoint, Keynote, and Google Slides.


6 diapositivas
SMART Goal Setting Process Presentation
Clearly define and communicate your business goals with the SMART Goal Setting Process slide. This layout visually breaks down the SMART framework—Specific, Measurable, Achievable, Relevant, and Time-bound—using icons, headers, and editable descriptions for each section. Ideal for strategy planning, goal tracking, and team alignment. Easily customizable in PowerPoint, Keynote, and Google Slides to suit any industry or project.


21 diapositivas
Runewood Marketing Proposal Template Presentation
The Marketing Proposal Presentation Template provides 21 slides covering core aspects like market presence, growth strategies, and financial highlights. Perfect for agencies and businesses to showcase their marketing strategies effectively. Fully customizable and compatible with PowerPoint, Keynote, and Google Slides.


6 diapositivas
Social Psychology Infographic
Social psychology is a branch of psychology that focuses on how individuals' thoughts, feelings, and behaviors are influenced by their social interactions and the social environment. These infographics explore various concepts and principles of social psychology. This template is designed to provide a comprehensive overview of the fascinating field of social psychology and its relevance to understanding human behavior in social contexts. The template provides practical tips and strategies based on social psychology research for improving social interactions, communication skills, and building positive relationships.