


Características


¿Tienes alguna pregunta?
Recomendar


7 diapositivas
Science Program Infographic Presentation
Science play's a crucial role in shaping our understanding of the world around us and has numerous applications in fields such as medicine and environmental science. This template can be used to present your science project in a professional fashion. The infographic contains all the graphs, figures and data you need, so that all you need to include is your own text. This is a creative template perfect for your next scientific research projects. It can be used to present the results of a study or an experiment. This template is compatible with powerpoint, keynote and google slides.


5 diapositivas
Project Milestone Timeline Presentation
Bring your project’s journey to life with this vibrant and organized presentation layout. Designed to showcase milestones, releases, and key phases clearly, it helps teams stay aligned and focused on goals. Fully editable and compatible with PowerPoint, Keynote, and Google Slides for smooth, professional presentations every time.


27 diapositivas
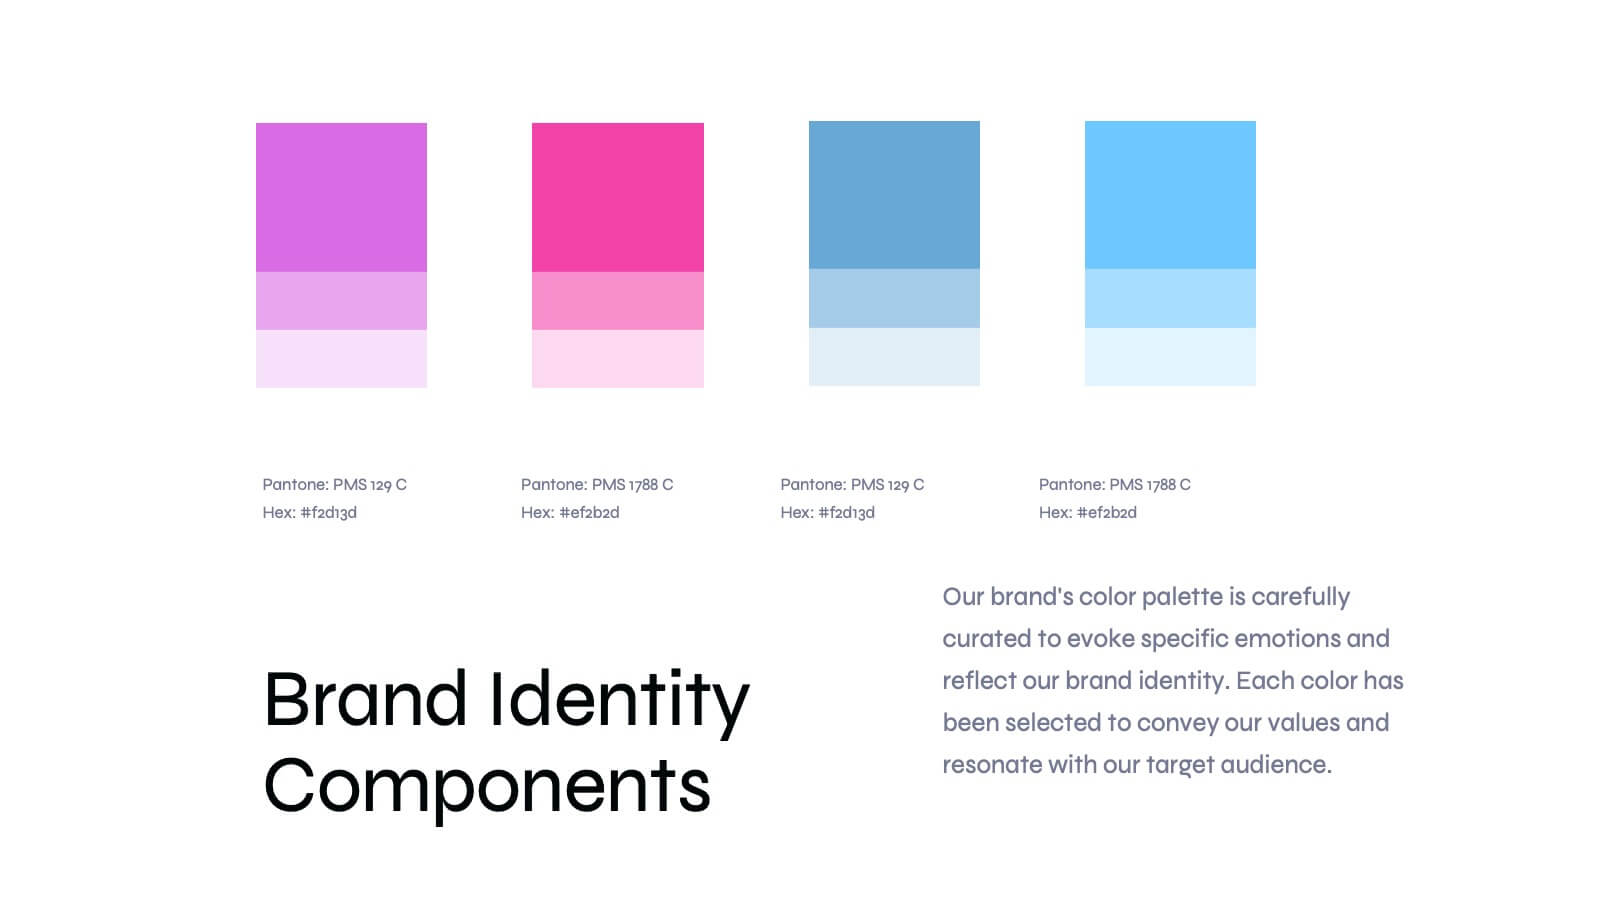
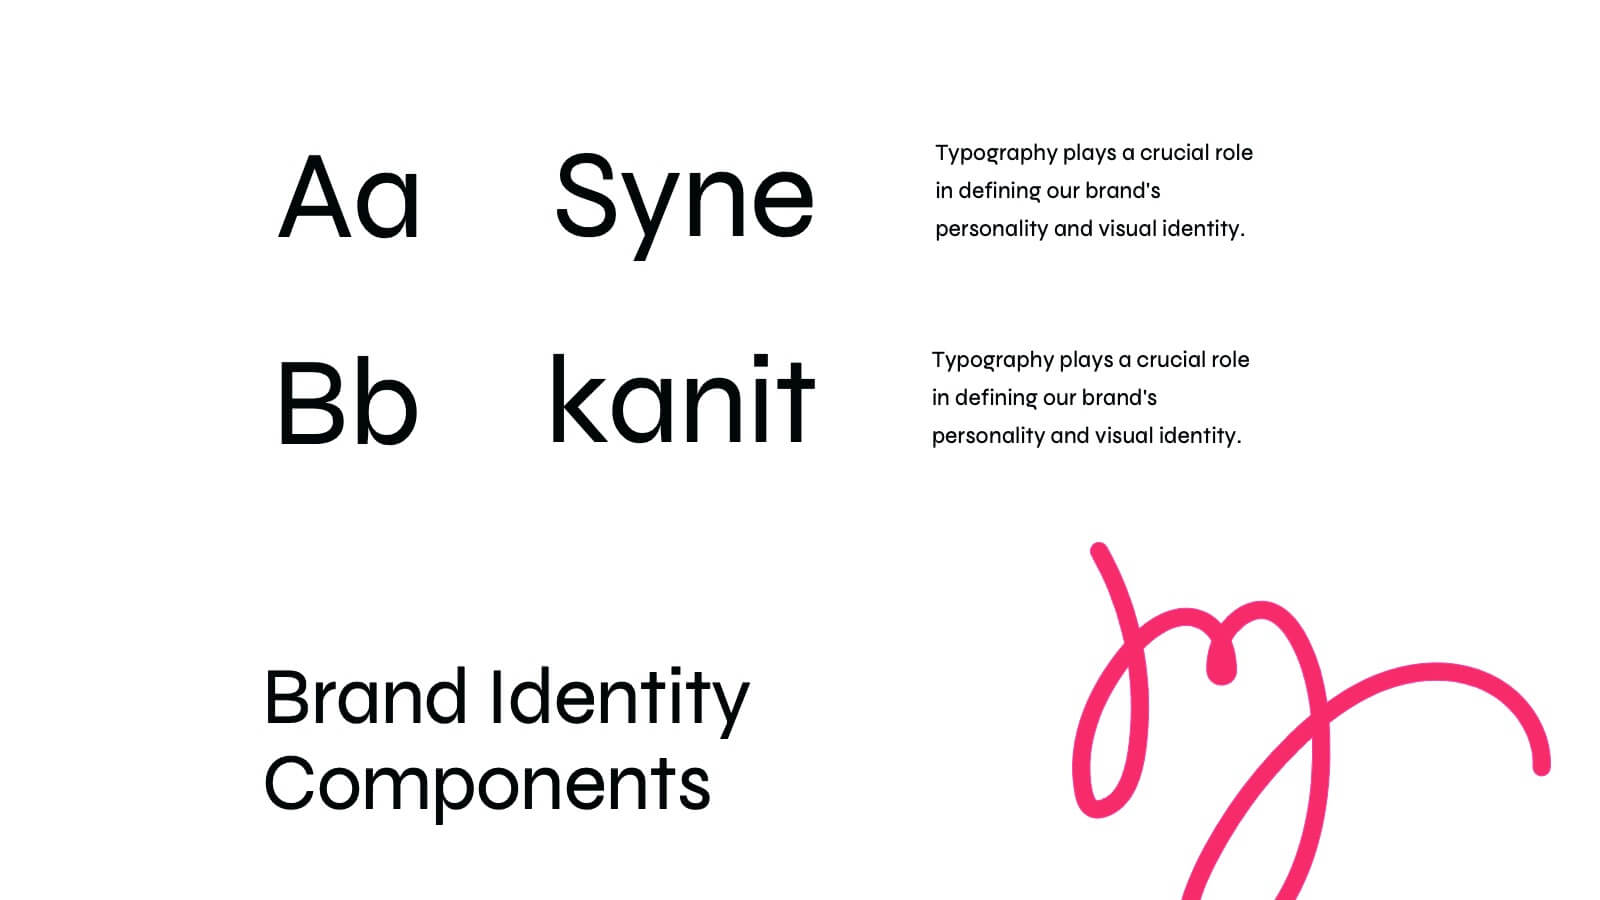
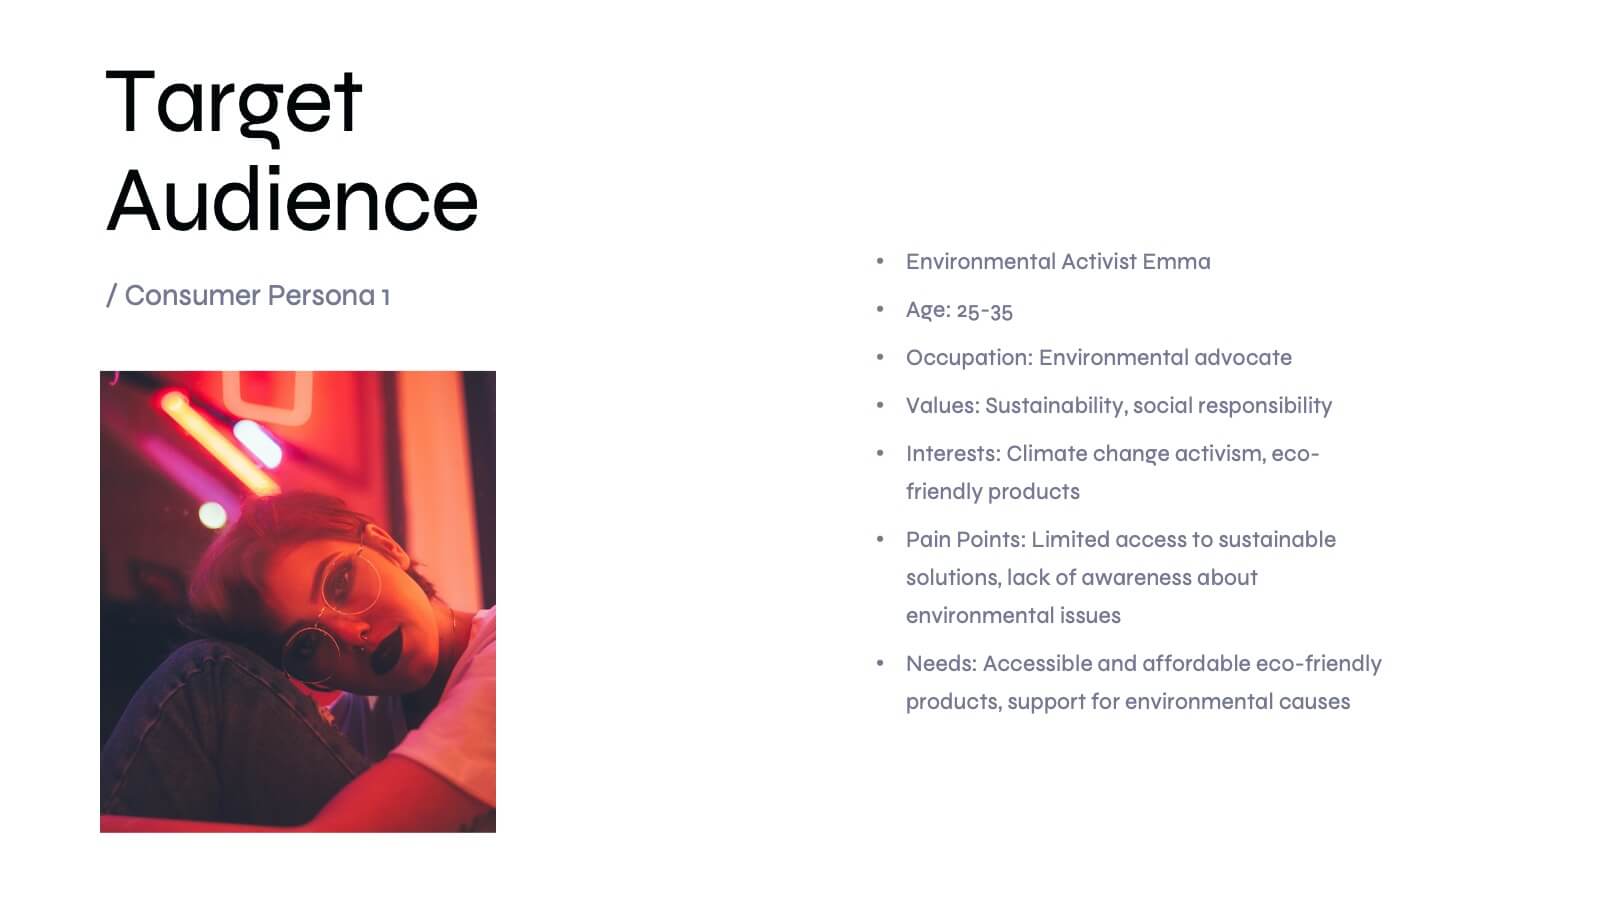
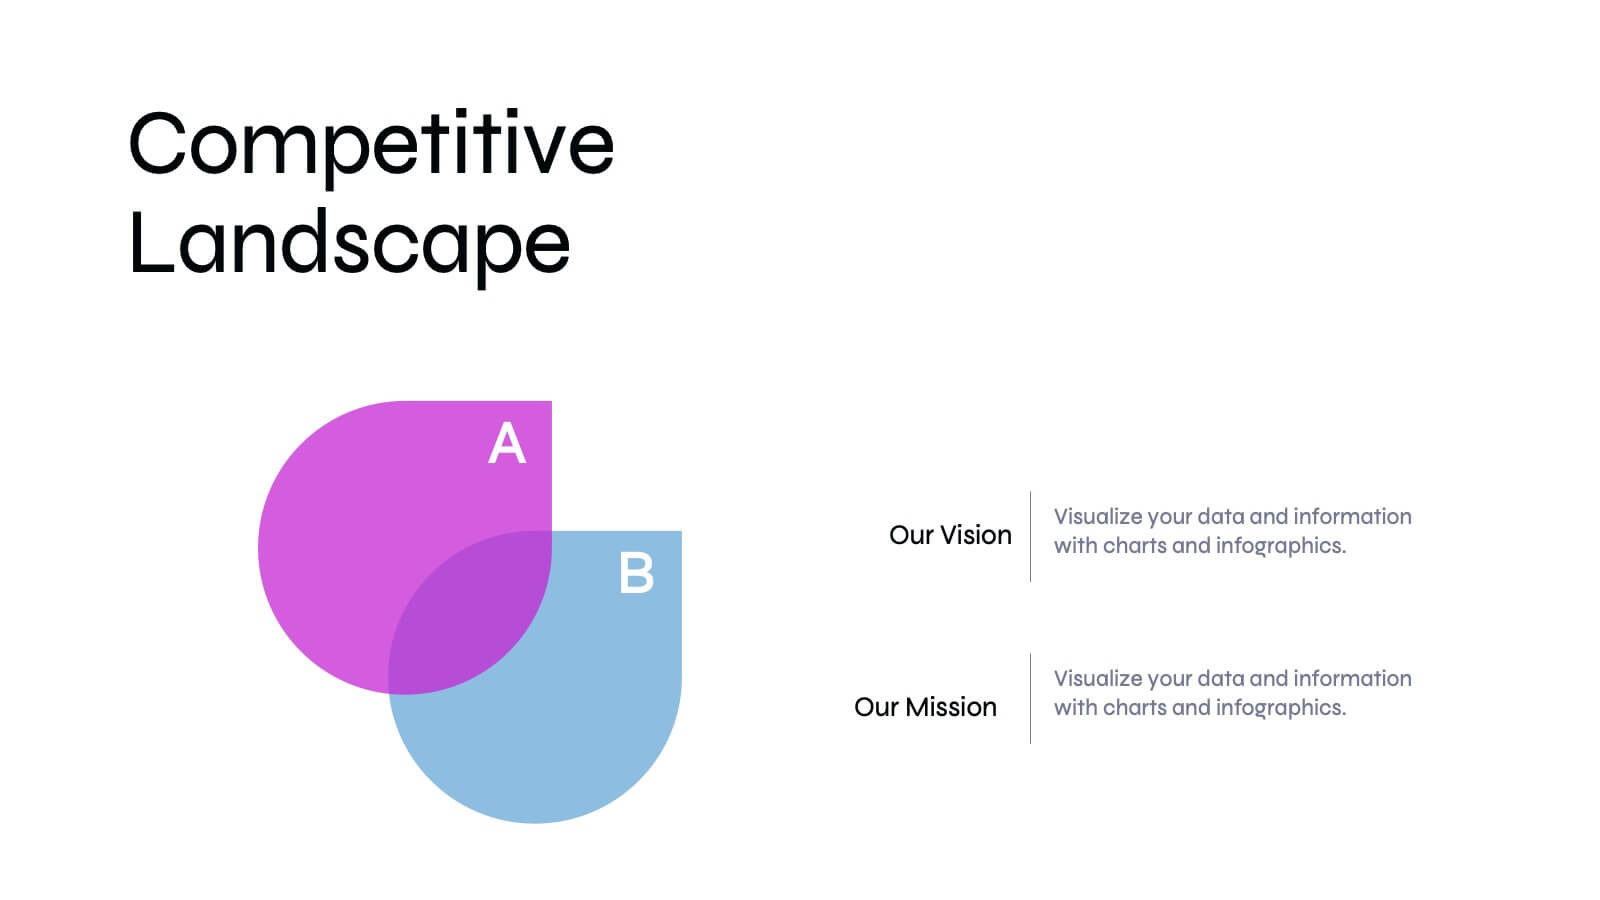
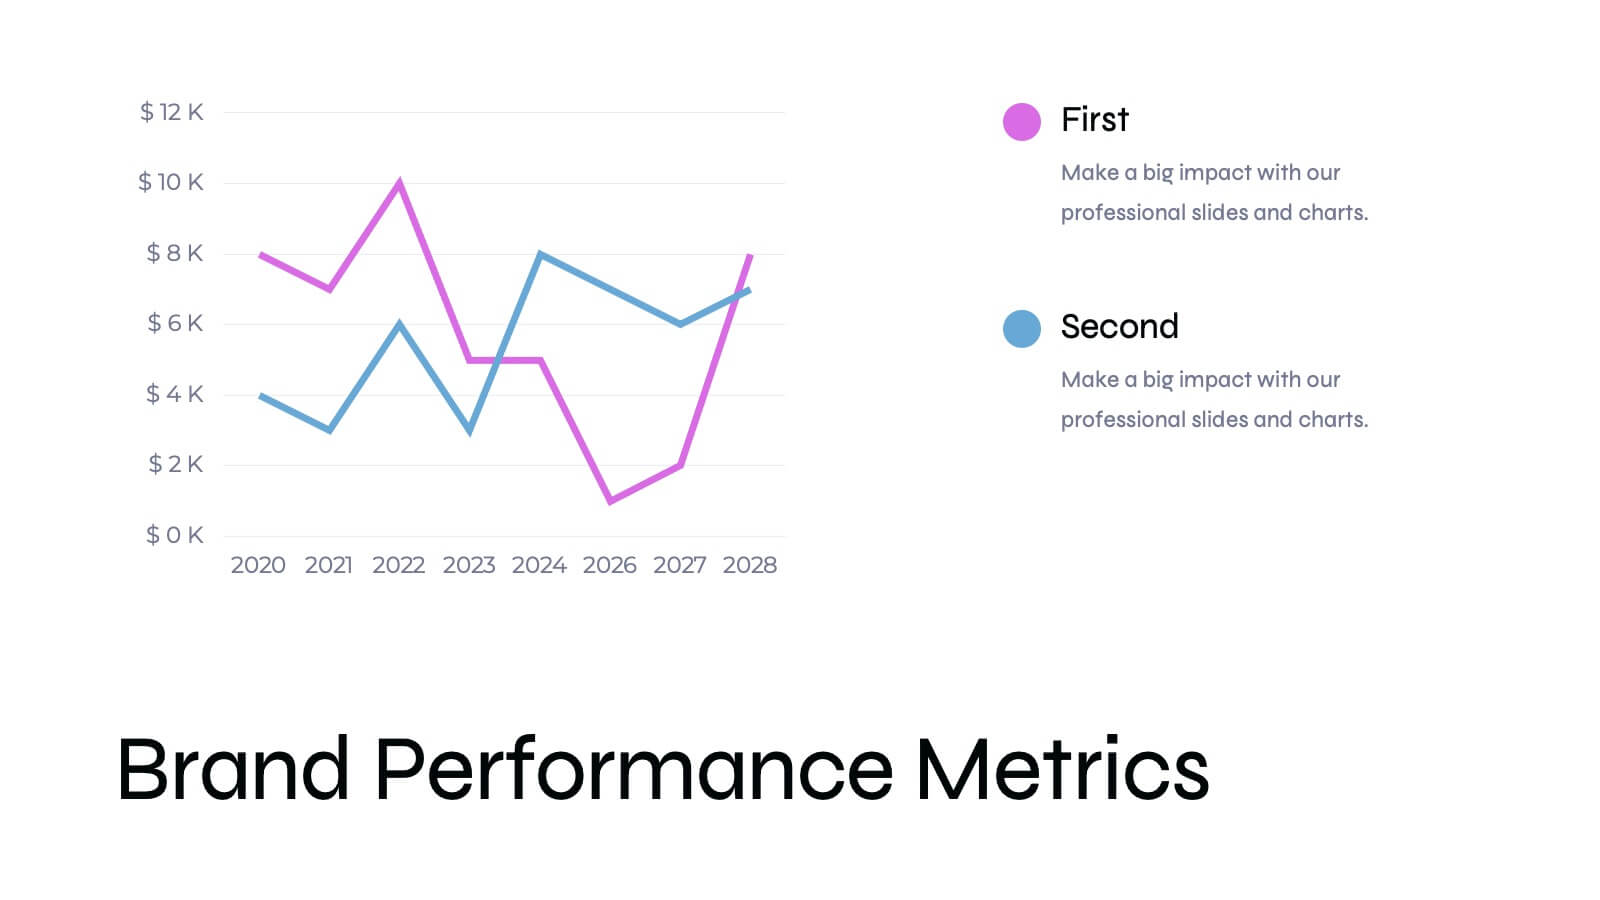
Basilisk Brand Guidelines Proposal Presentation
Present your brand strategy effectively with this modern brand guidelines proposal template! It includes sections for brand vision, values, identity, and market analysis. Fully customizable and compatible with PowerPoint, Keynote, and Google Slides, it’s perfect for showcasing your brand's identity and ensuring consistency across all platforms.


3 diapositivas
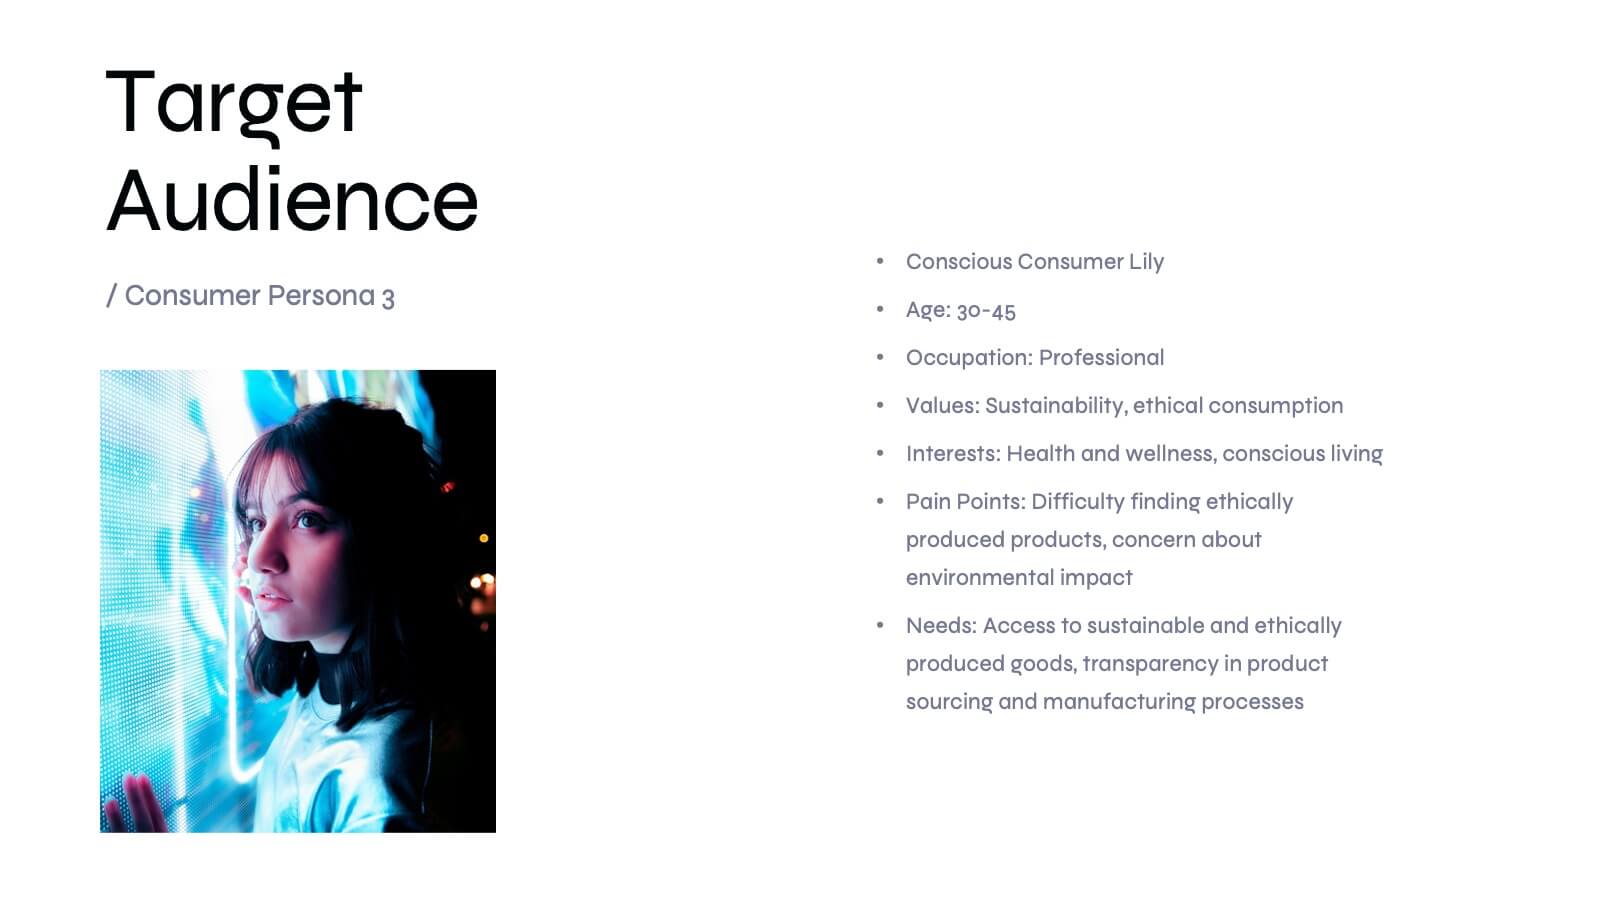
Persona Mapping for Target Audience Presentation
Get clear on who you're speaking to with this visual persona mapping slide. Ideal for marketing plans, customer research, or segmentation strategies, this layout helps you define and compare target audience types with clean icons and text space. Fully editable and works with PowerPoint, Keynote, and Google Slides.


20 diapositivas
Aeneas Sales Proposal Presentation
Seal your next deal with this professional sales proposal template. It covers key sections like objectives, pricing strategy, and target market, offering a comprehensive layout for your pitch. Ideal for impressing clients, it's compatible with PowerPoint, Keynote, and Google Slides for smooth, impactful presentations.


7 diapositivas
Data Analysis Tools Infographic
The Data Analysis Tools Infographic provides a dynamic and intuitive way to represent data analytics and performance metrics visually. This template offers various graph styles, such as bar graphs, line charts, and human figures, to illustrate statistical data effectively. Whether it's market research, financial analysis, website analytics, or any other form of quantitative data, this infographic is designed to make data easily understandable at a glance. Compatible with popular presentation software like PowerPoint, Google Slides, and Keynote, it's an excellent tool for professionals who aim to communicate complex data in a simplified, engaging manner.


5 diapositivas
Layered Business Pyramid Framework
Visualize business hierarchy and strategic layers with the Layered Business Pyramid Framework Presentation. This editable slide features a five-tier pyramid diagram aligned with corresponding text sections, ideal for showcasing organizational structures, workflow levels, or growth stages. Each layer is color-coded for clarity and impact, making your insights easy to digest. Fully compatible with PowerPoint, Keynote, and Google Slides.


6 diapositivas
Startup Goals and MVP Rollout Plan Presentation
Launch with clarity using the Startup Goals and MVP Rollout Plan Presentation. This dynamic circular layout features a rocket icon and segmented design to represent phased growth and product milestones. Ideal for showcasing early-stage priorities, MVP deliverables, and go-to-market strategies. Compatible with PowerPoint, Keynote, Google Slides, and Canva for full customization.


5 diapositivas
Financial Budget Infographics
Financial goals refer to specific objectives and targets that individuals or businesses set to manage their finances effectively and achieve financial success. These vertical infographics are designed to help individuals and businesses effectively present their financial budgets and plans. Whether you're a financial analyst or a business owner, this template is perfect for conveying complex financial information in a clear and concise manner. These infographics provide an overview of the budget, showcasing key financial goals, total income, and total expenses. This features visuals to help users set and track financial goals.


5 diapositivas
Travel Planning and Destination Guide Presentation
Highlight your itinerary or destination comparisons with this suitcase-stacked infographic slide. Each luggage icon aligns with a percentage label and text box, helping you present travel data, tips, or packing categories in an engaging and visually organized way. Perfect for travel agencies, bloggers, and vacation planners. Fully editable in PowerPoint, Keynote, and Google Slides.


6 diapositivas
Top Benefits Breakdown Presentation
Showcase your strongest advantages with a clean, structured layout that highlights each benefit clearly and effectively. This modern design is perfect for presenting key selling points, service features, or strategic highlights in a professional way. Fully customizable and compatible with PowerPoint, Keynote, and Google Slides for seamless editing and presentation.


4 diapositivas
Insurance Services Overview Presentation
Present your offerings with clarity using this Insurance Services Overview slide. Ideal for explaining coverage tiers, policy types, or service options. The clean umbrella graphic adds a strong visual metaphor for protection. Fully customizable and compatible with PowerPoint, Keynote, and Google Slides for use across any insurance or finance presentation.


4 diapositivas
Workflow Bottleneck Fishbone Analysis
Identify slowdowns and streamline performance with the Workflow Bottleneck Fishbone Analysis Presentation. This diagram features a horizontally aligned fishbone structure with segmented semicircles, ideal for pinpointing process inefficiencies across stages. Fully customizable in PowerPoint, Keynote, and Google Slides for professional workflow diagnostics.


4 diapositivas
HR Policies and Employee Management Presentation
Clearly outline your workplace strategies with this HR Policies and Employee Management slide. Featuring four color-coded segments alongside an illustration of employee analysis, this layout is ideal for presenting onboarding steps, employee benefits, internal policies, or training procedures. Fully editable and compatible with PowerPoint, Keynote, and Google Slides for seamless customization.


21 diapositivas
Carmenta Project Management Plan Presentation
Organize your projects with clarity using this comprehensive project management plan template. It includes slides for objectives, timelines, risk management, budget breakdowns, and team introductions. Ideal for efficient project presentations, it’s compatible with PowerPoint, Keynote, and Google Slides, offering a structured approach to showcase every project detail.


22 diapositivas
Nimbus Project Milestones Report Presentation
This project plan template offers a modern, vibrant design that clearly outlines key project components, including problem statements, objectives, deliverables, timelines, and risk management. It’s perfect for teams looking to present a comprehensive project overview. Compatible with PowerPoint, Keynote, and Google Slides for impactful presentations with a polished look!


4 diapositivas
Case Study Insights and Outcomes Presentation
Showcase real-world takeaways with the Case Study Insights and Outcomes Presentation. This modern, folder-style infographic layout guides your audience through three key stages of a case study—process, insight, and results. Ideal for highlighting lessons learned, performance reviews, or client success journeys. Fully editable in PowerPoint, Keynote, and Google Slides.