
Características


¿Tienes alguna pregunta?
Recomendar


5 diapositivas
IT Support and Systems Presentation
Streamline your tech communication with a clean, structured layout that highlights your IT services, support processes, and system workflows. Perfect for teams presenting solutions, infrastructure overviews, or technical strategies, this presentation brings clarity to complex topics. Fully compatible with PowerPoint, Keynote, and Google Slides for effortless editing and delivery.


5 diapositivas
Veterinary Medicine Advances Presentation
Discover the latest in Veterinary Medicine Advances with our engaging presentation template. Designed to highlight key innovations and treatment methods, this template offers a clear visual format for presenting complex information effectively to colleagues and stakeholders in the veterinary field.


6 diapositivas
Product Launch Pitch Deck
Make your product debut unforgettable with this dynamic pitch deck slide. Featuring clean visuals, pie chart stats, and a mobile app mockup, it’s ideal for tech startups and innovative brands. Fully customizable in PowerPoint, Keynote, and Google Slides, it's perfect for presenting key product benefits and performance highlights.


6 diapositivas
Objective Research Infographics
Enhance your presentation on "Objective Research" with our professionally designed infographic template. This template, compatible with PowerPoint, Keynote, and Google Slides, is the perfect tool for presenting complex research data in a clear and engaging manner. Our template boasts a clean, modern design with a neutral color scheme, making it ideal for both corporate and academic settings. The layout is expertly crafted to showcase your research objectives, methodologies, and findings in a visually appealing way. It includes elements like graphs, charts, and bullet points, ensuring your data is not only accessible but also impactful. Easy to customize and user-friendly, this template empowers you to convey your research objectives with clarity and professionalism. Whether you're presenting to colleagues, students, or stakeholders, this infographic template will elevate your presentation and make your data stand out.


25 diapositivas
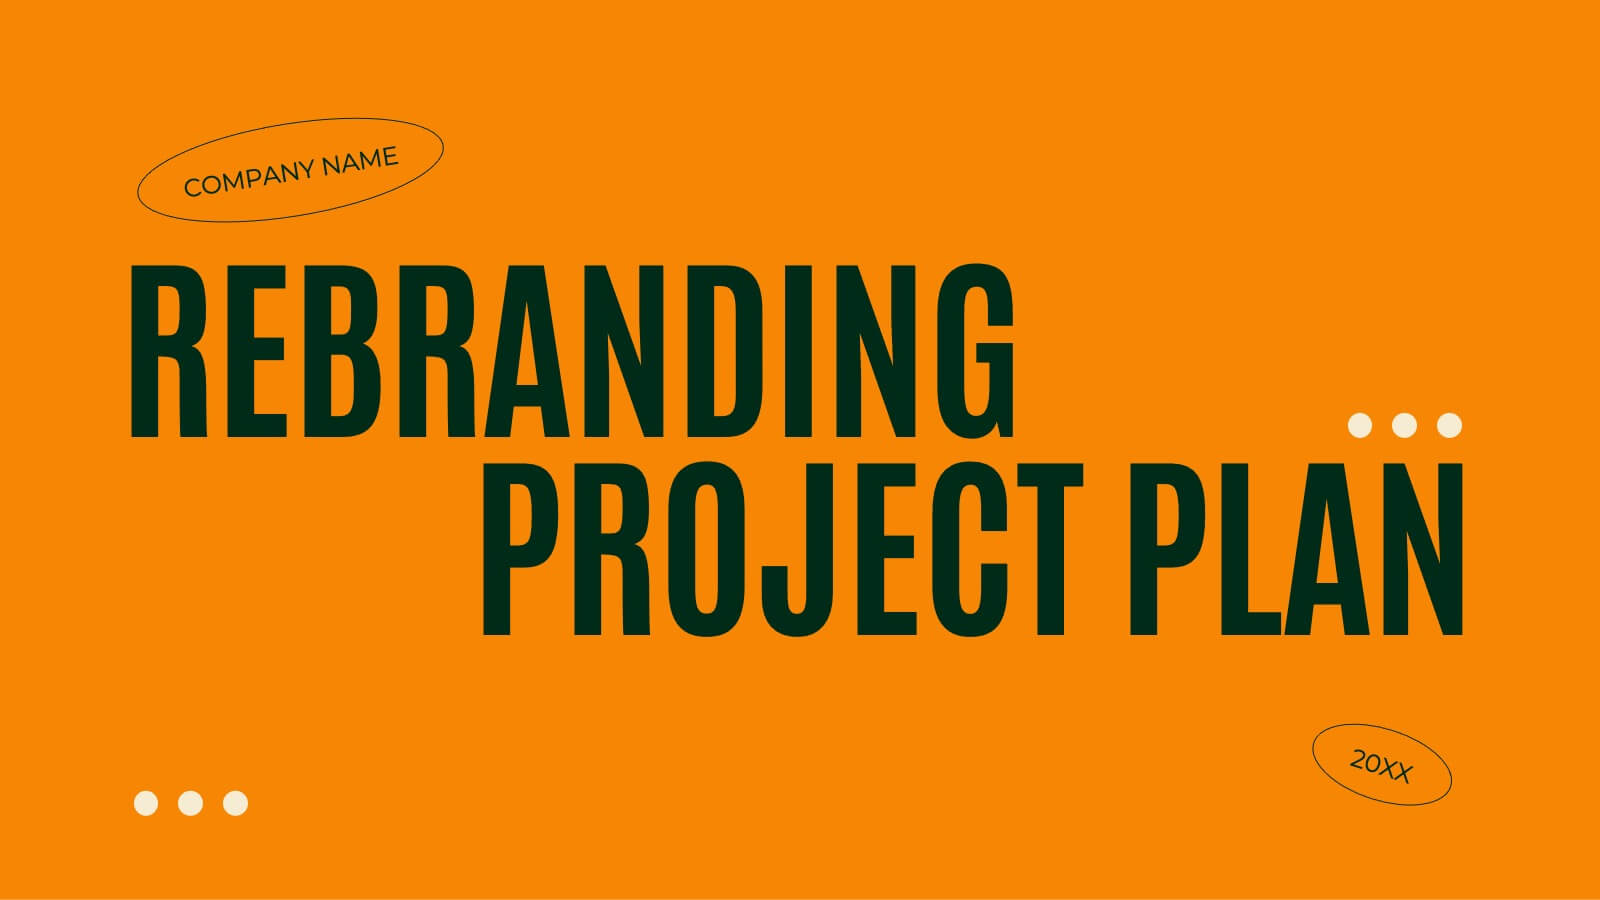
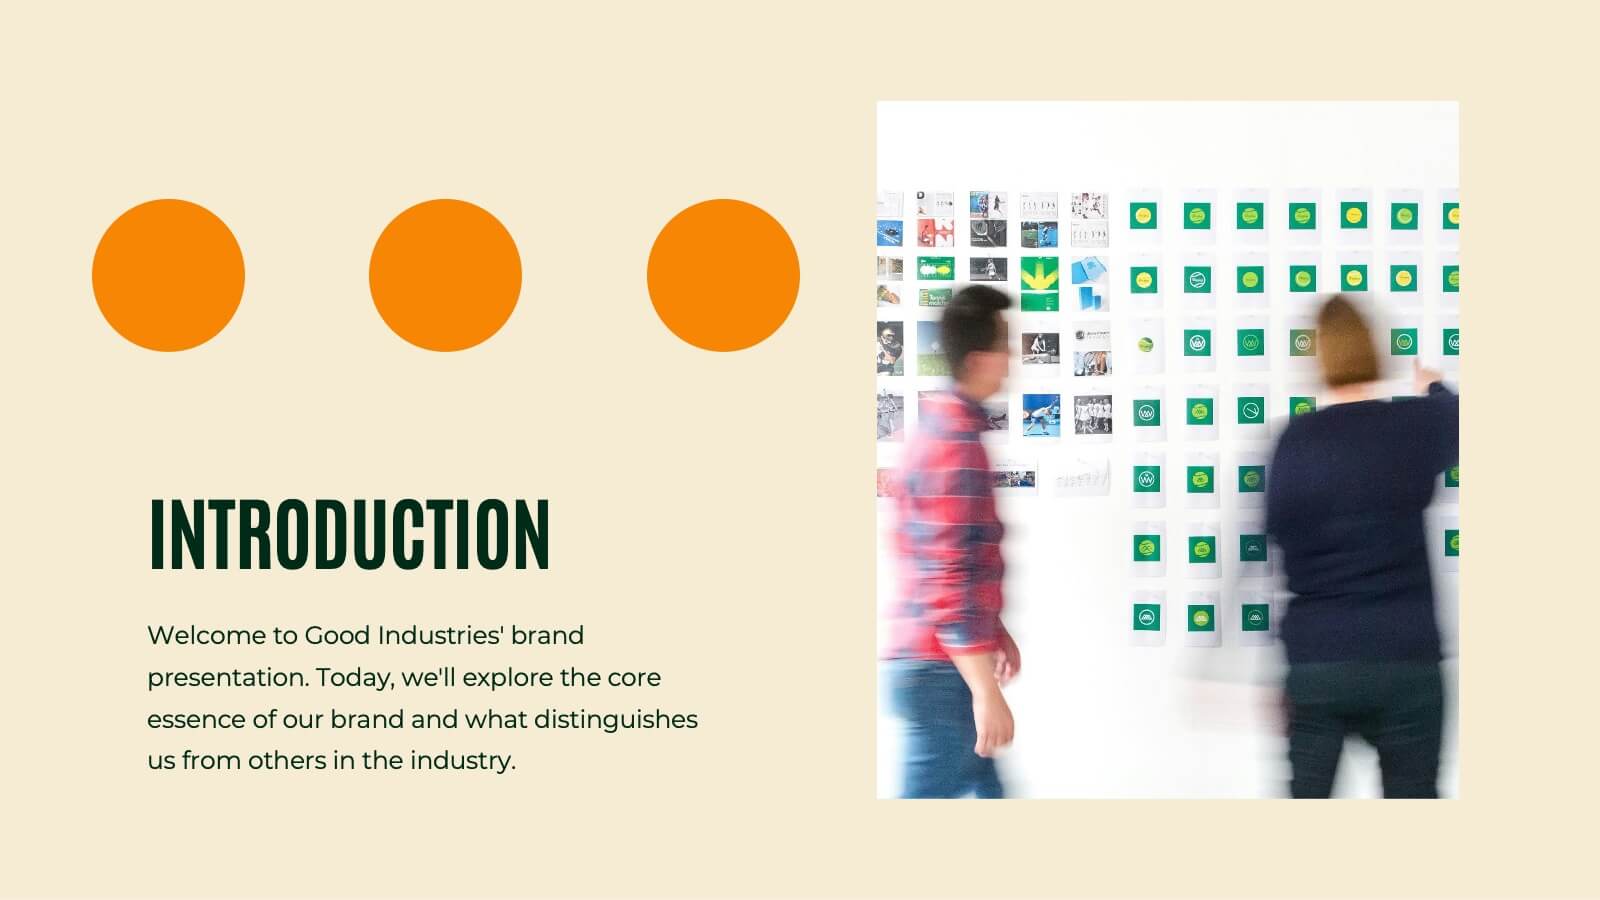
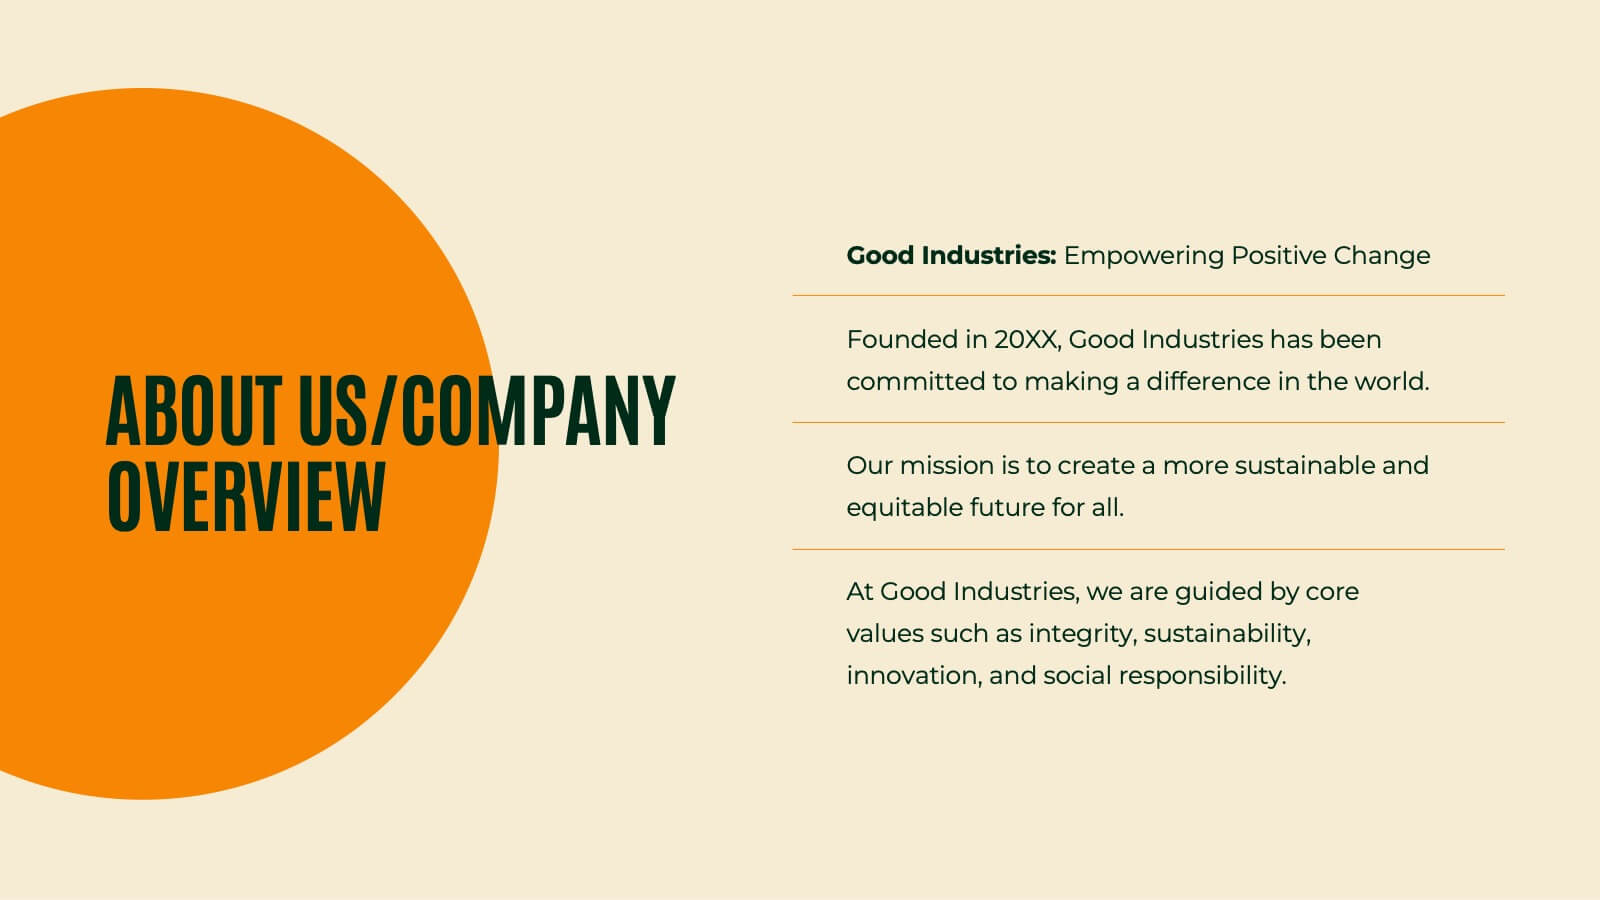
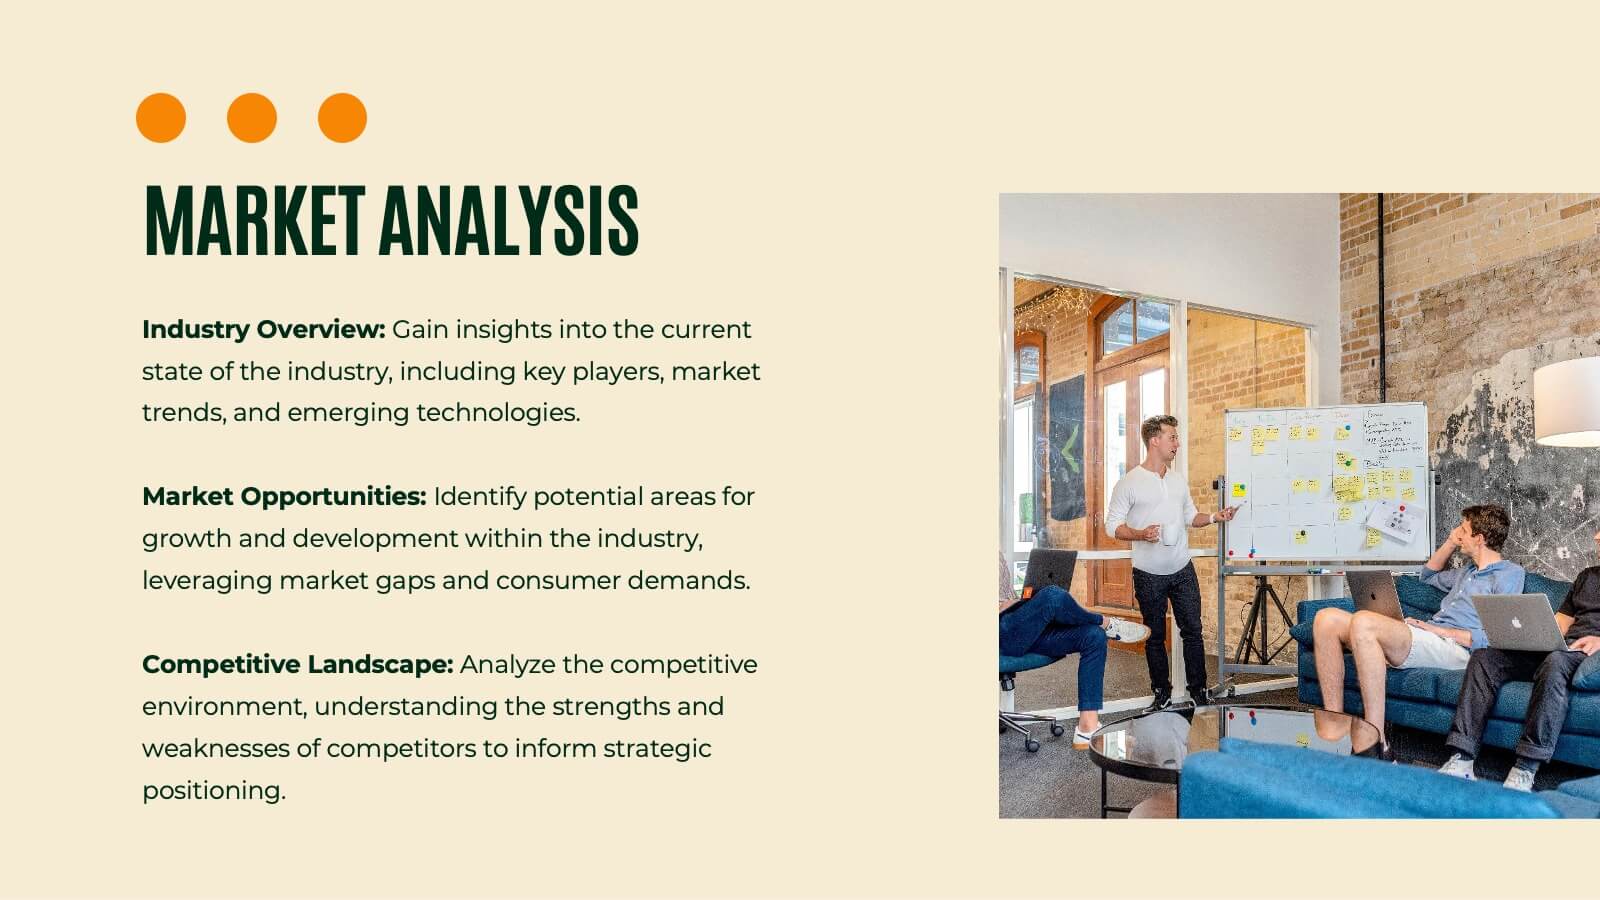
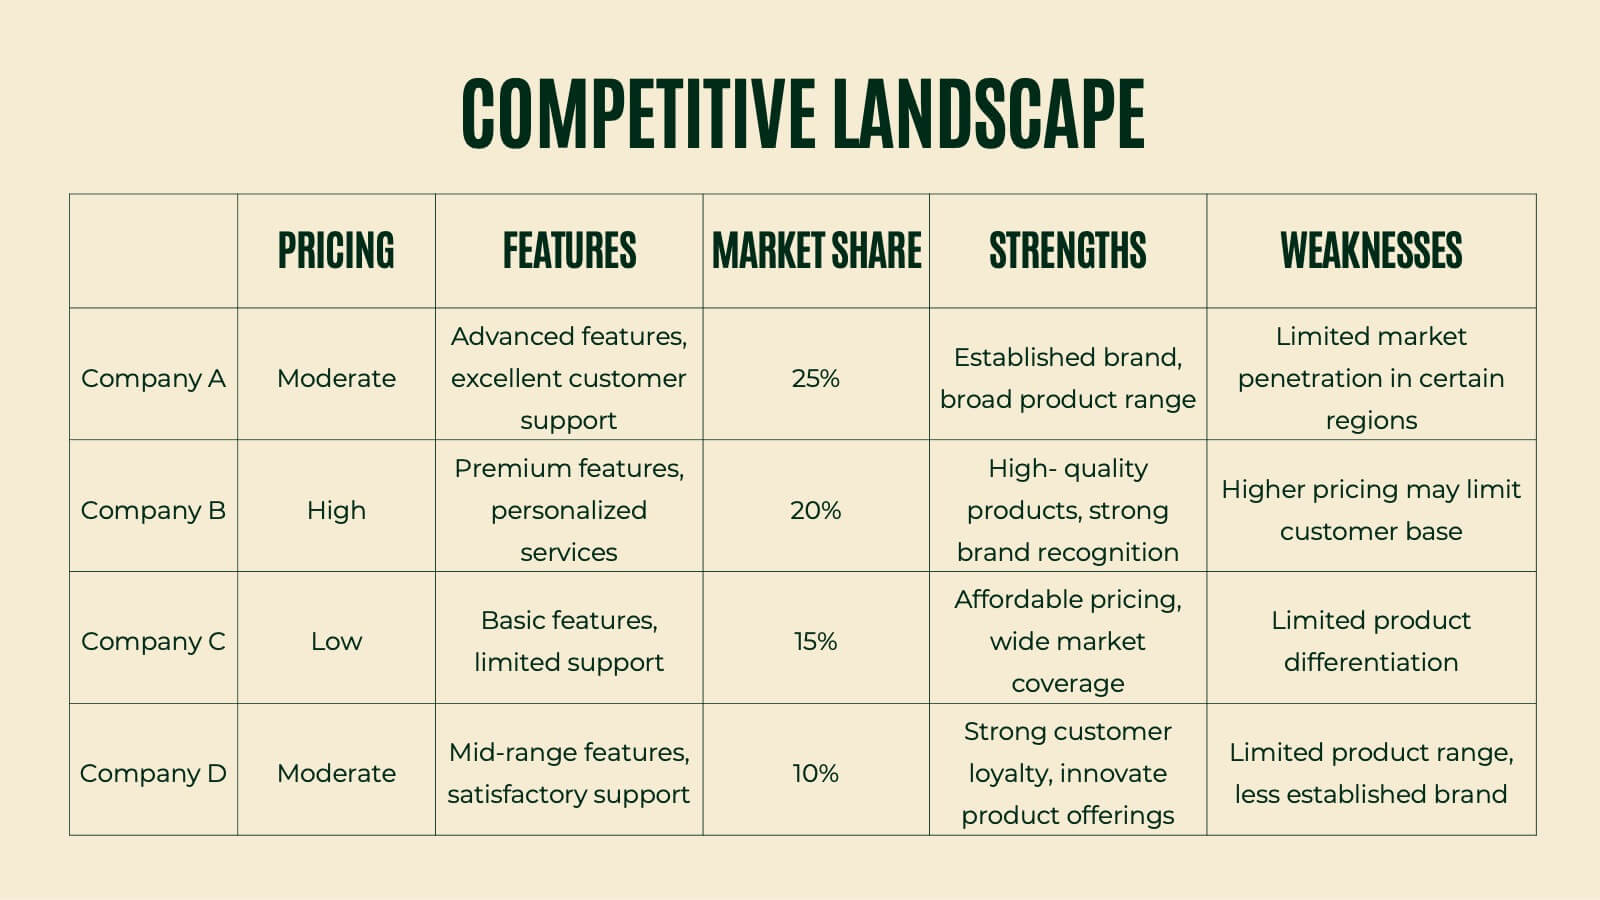
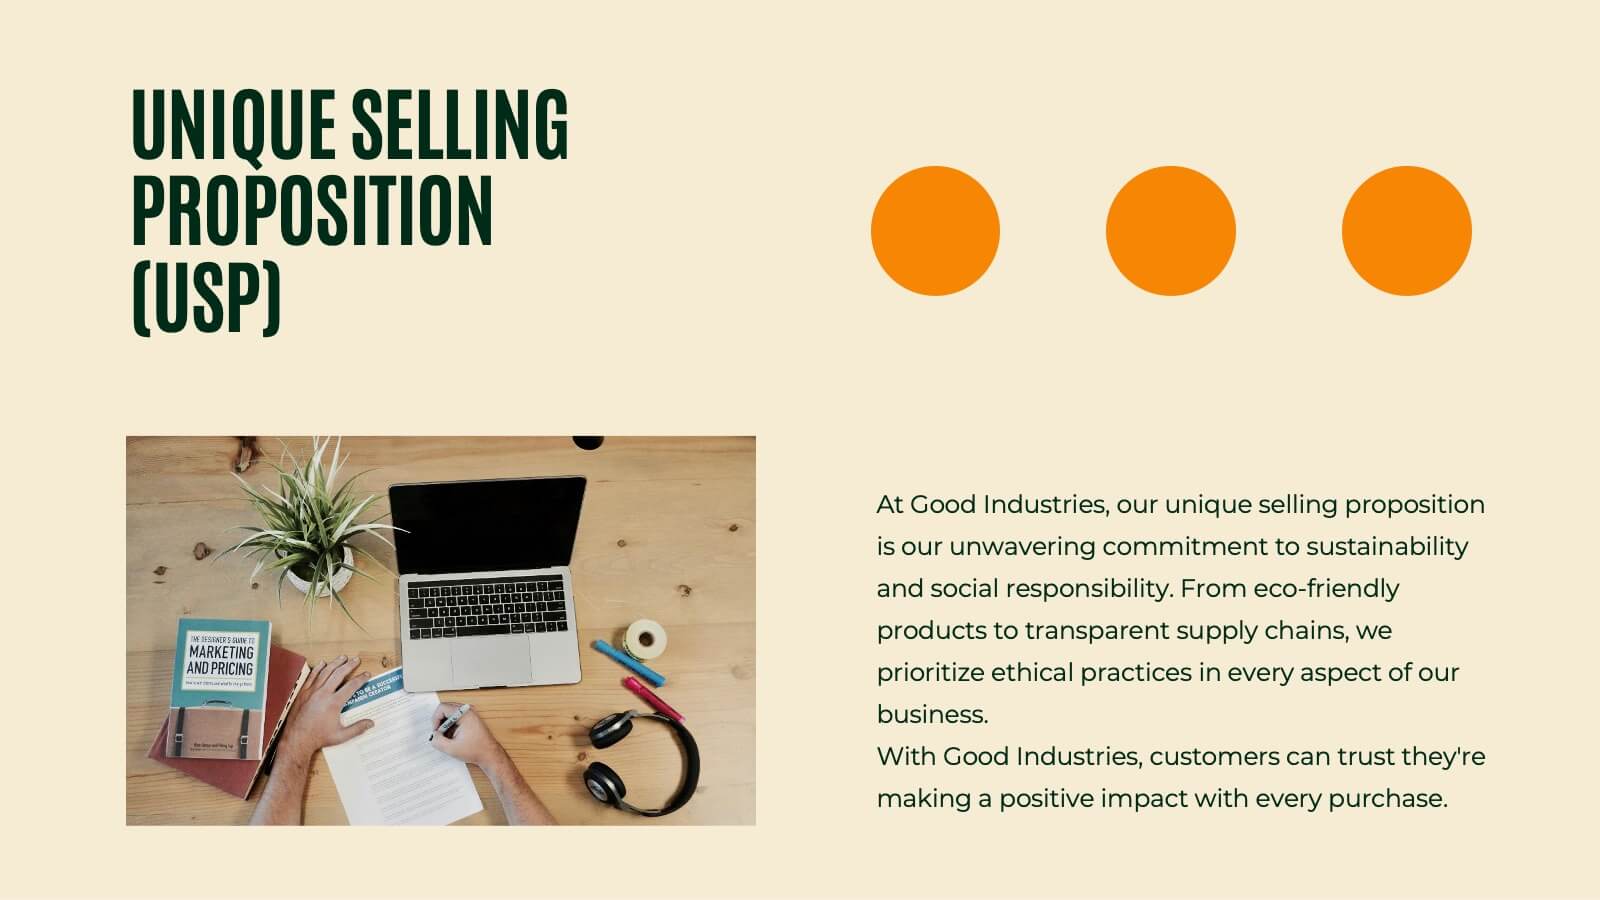
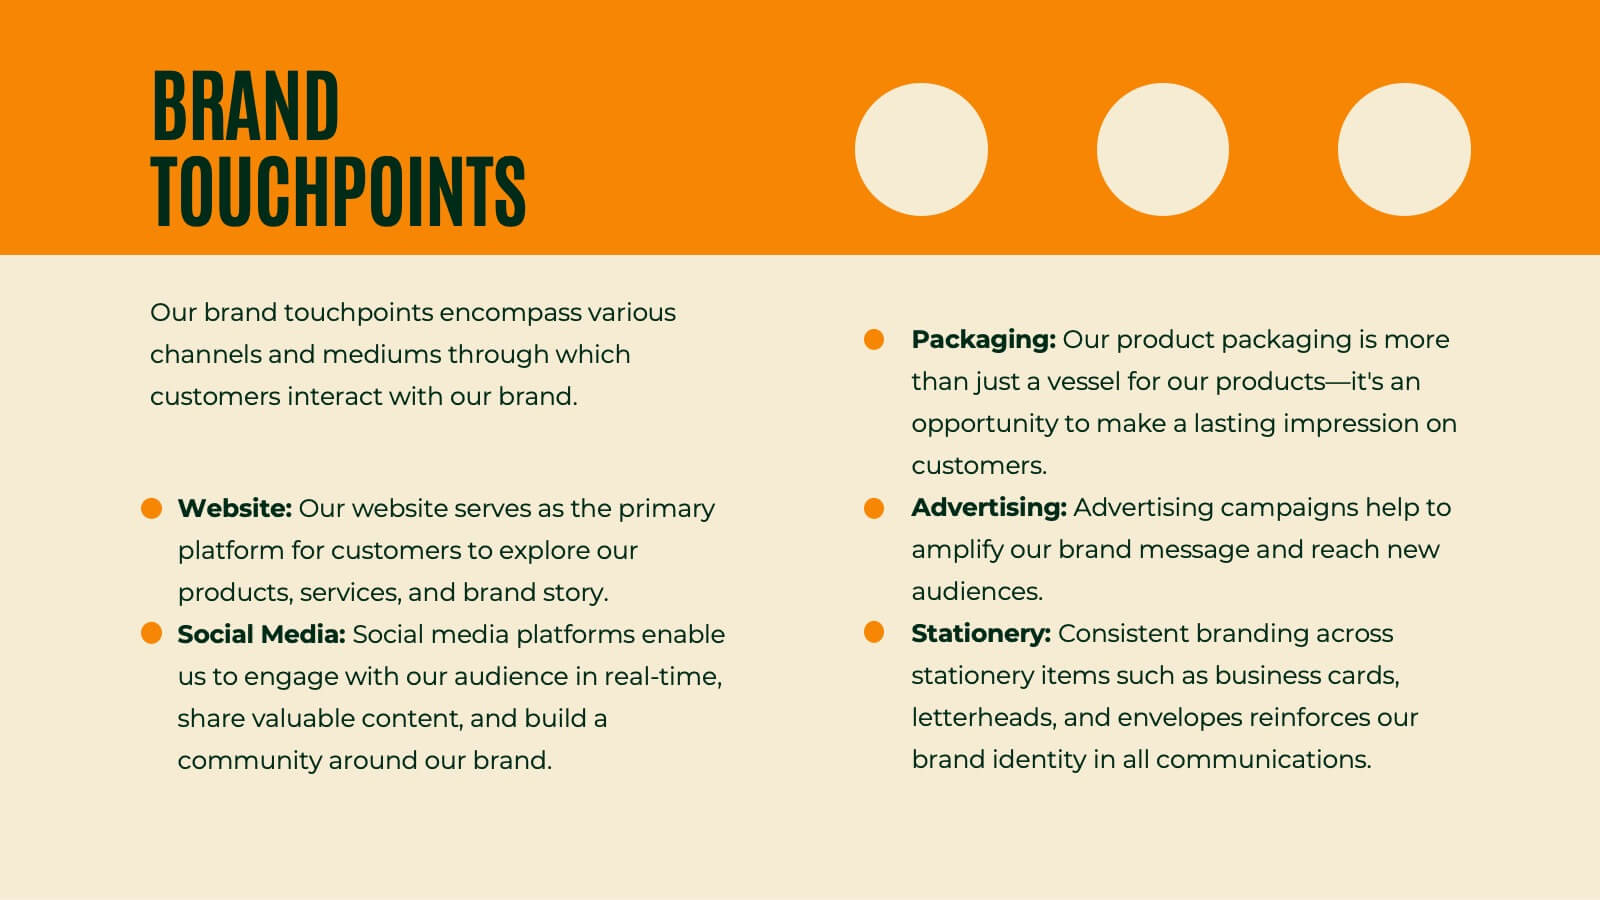
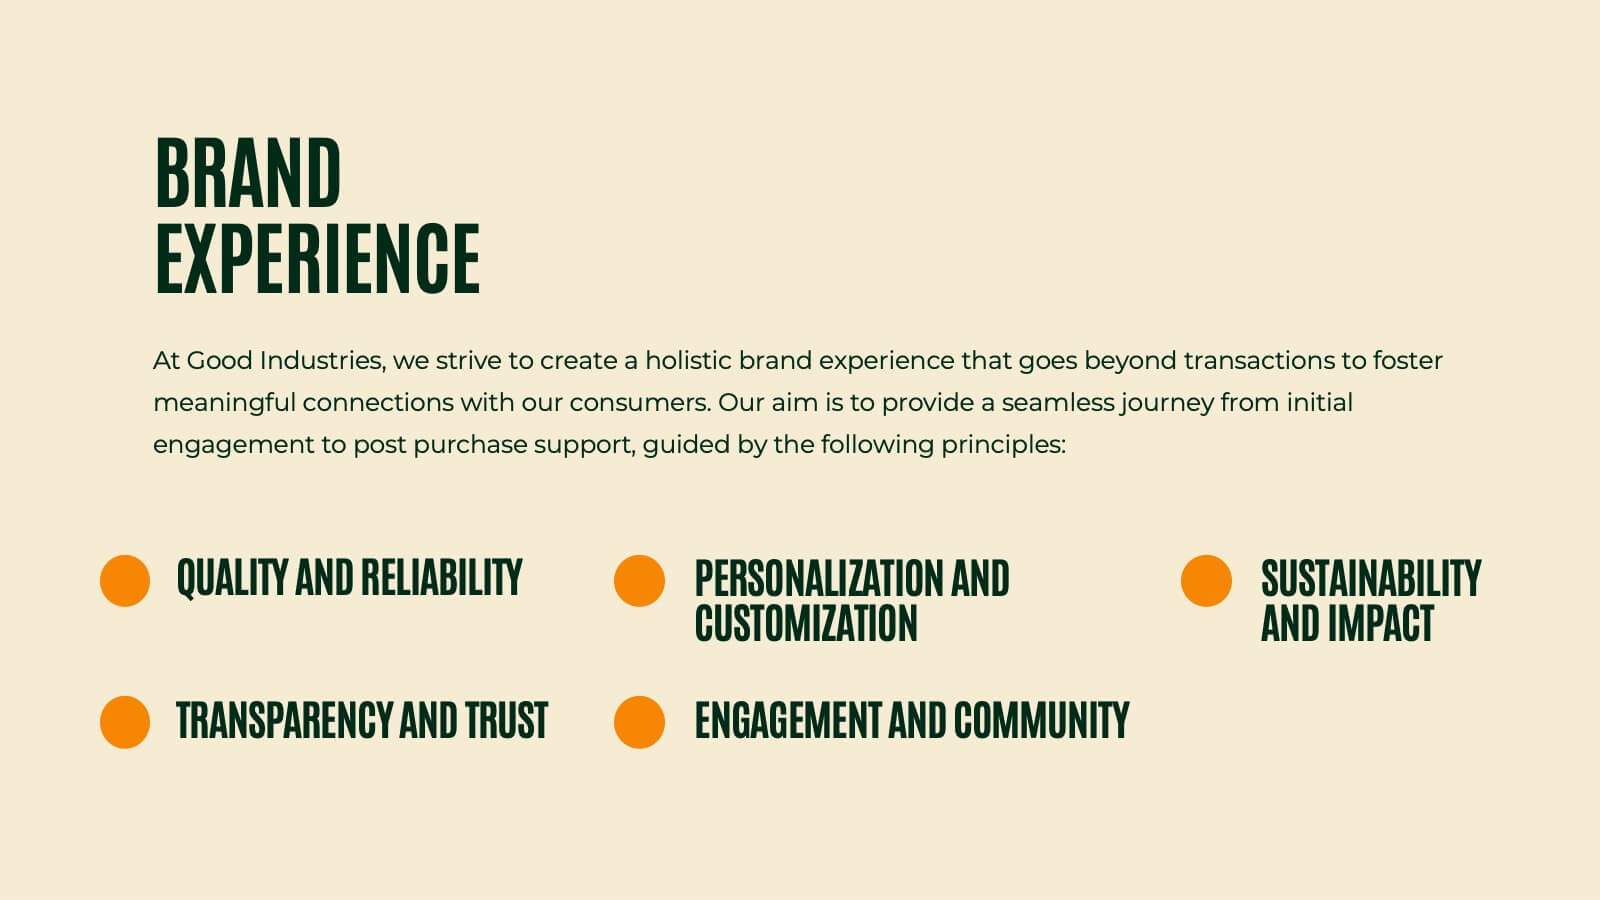
Siren Rebranding Project Plan Presentation
This sleek brand presentation template covers essential elements like market analysis, brand guidelines, positioning, and audience insights. It's designed to showcase your brand identity and development strategies with a modern layout. Compatible with PowerPoint, Keynote, and Google Slides, it’s perfect for delivering professional and engaging brand presentations.


4 diapositivas
Investor Business Plan One-Pager Presentation
Present your startup vision with clarity using this Investor Business Plan One-Pager. Designed to outline key milestones, growth projections, and funding goals, it’s perfect for pitch decks and investor briefs. Visually dynamic and fully customizable, this one-slide format works seamlessly in PowerPoint, Keynote, and Google Slides—ideal for entrepreneurs and startups.


29 diapositivas
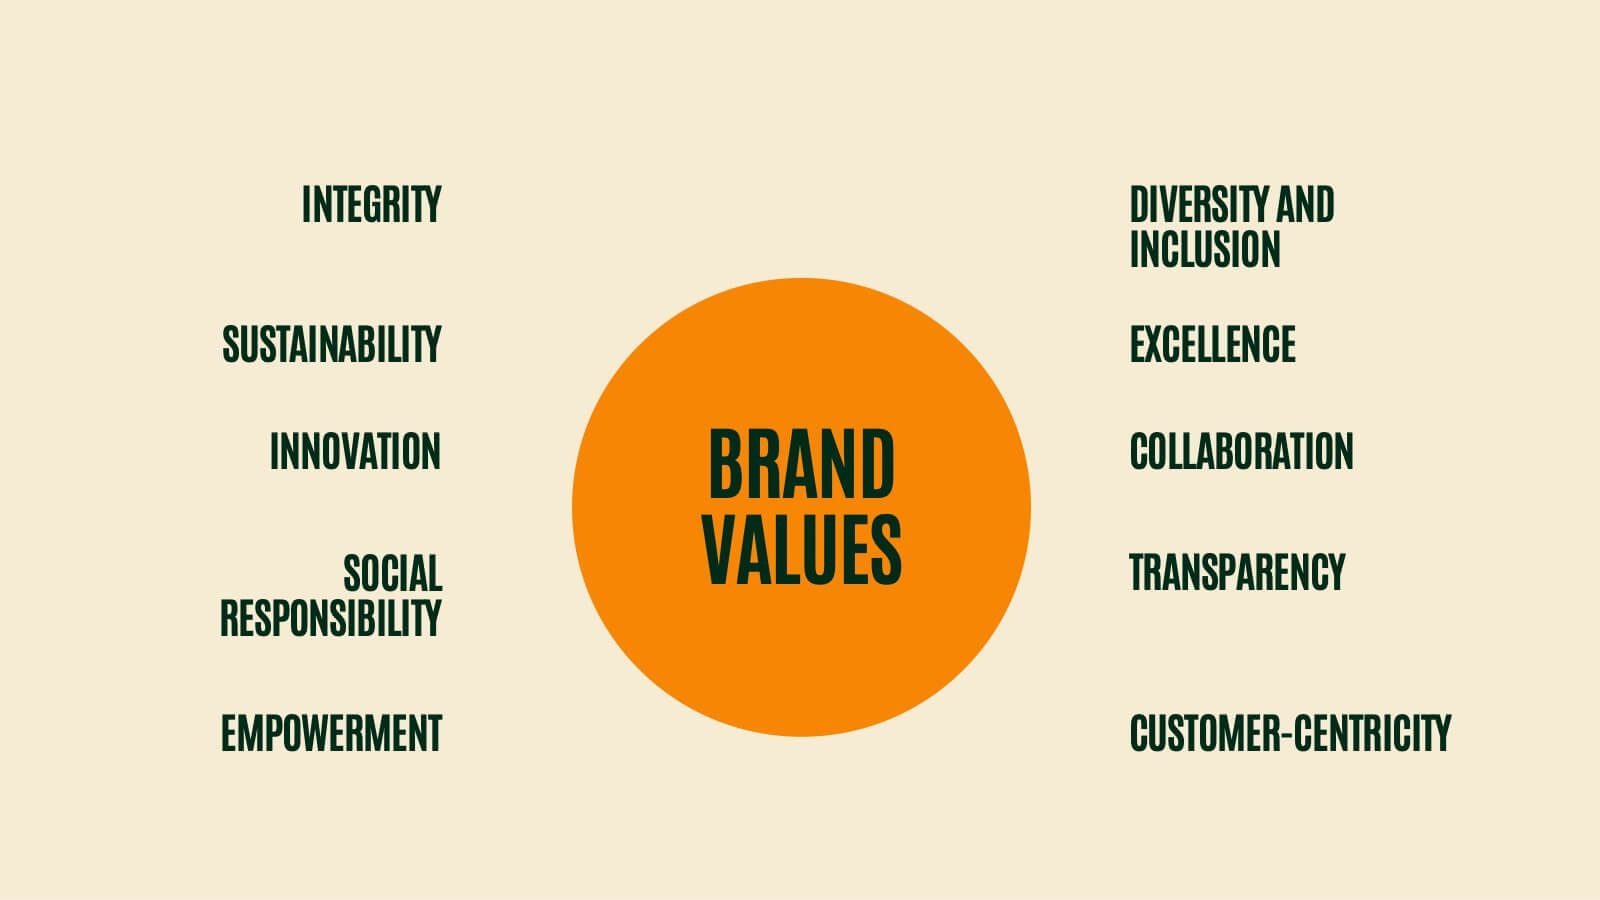
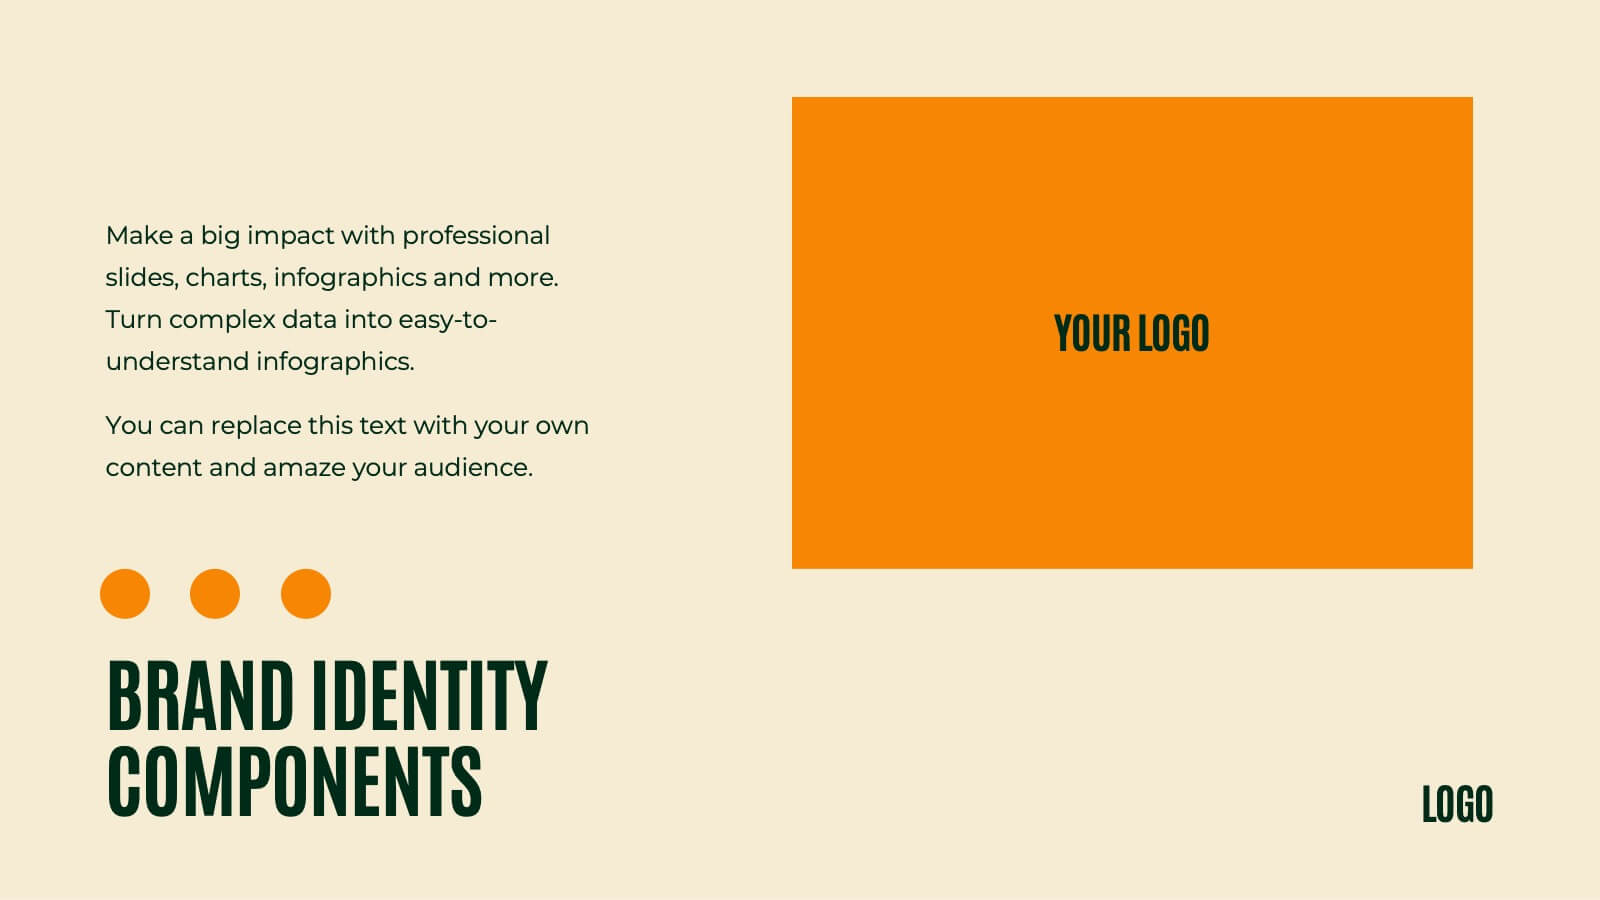
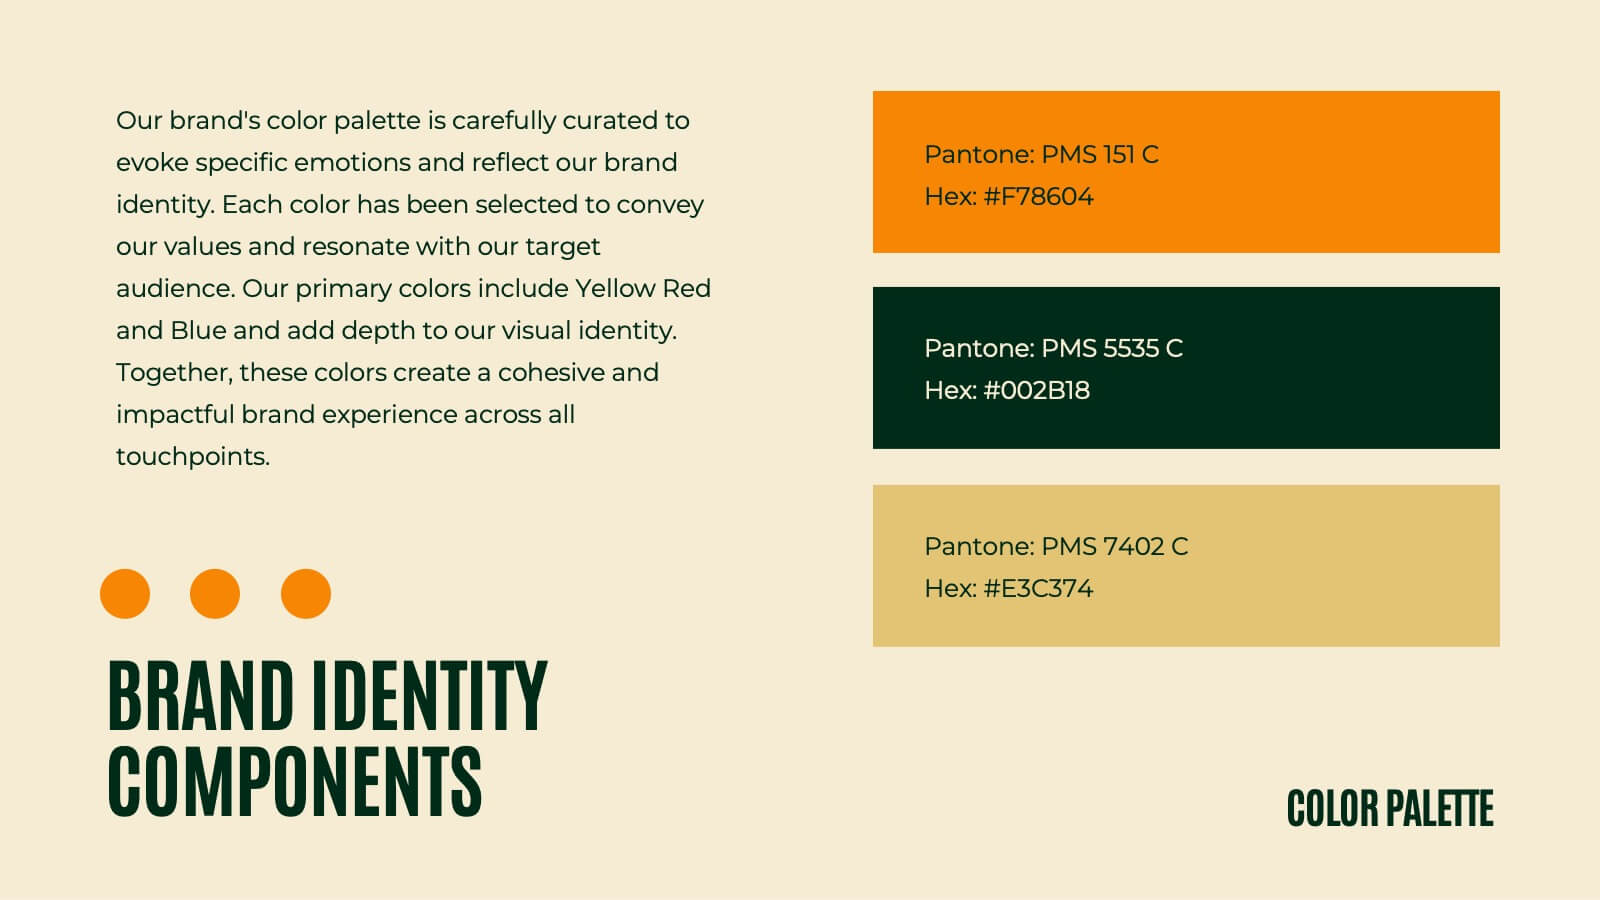
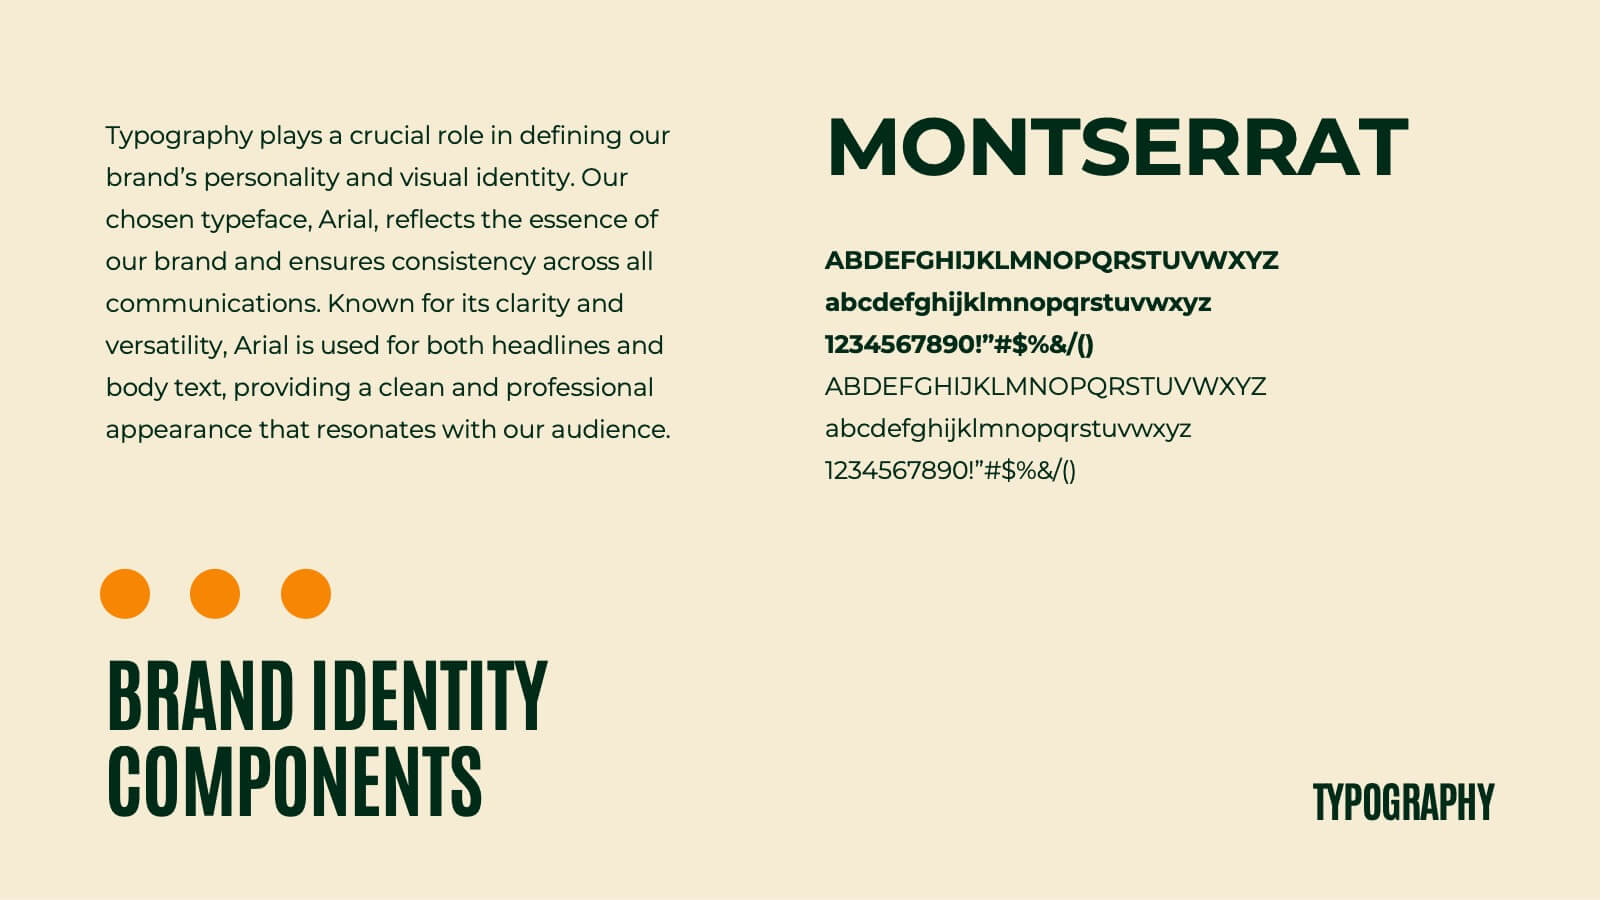
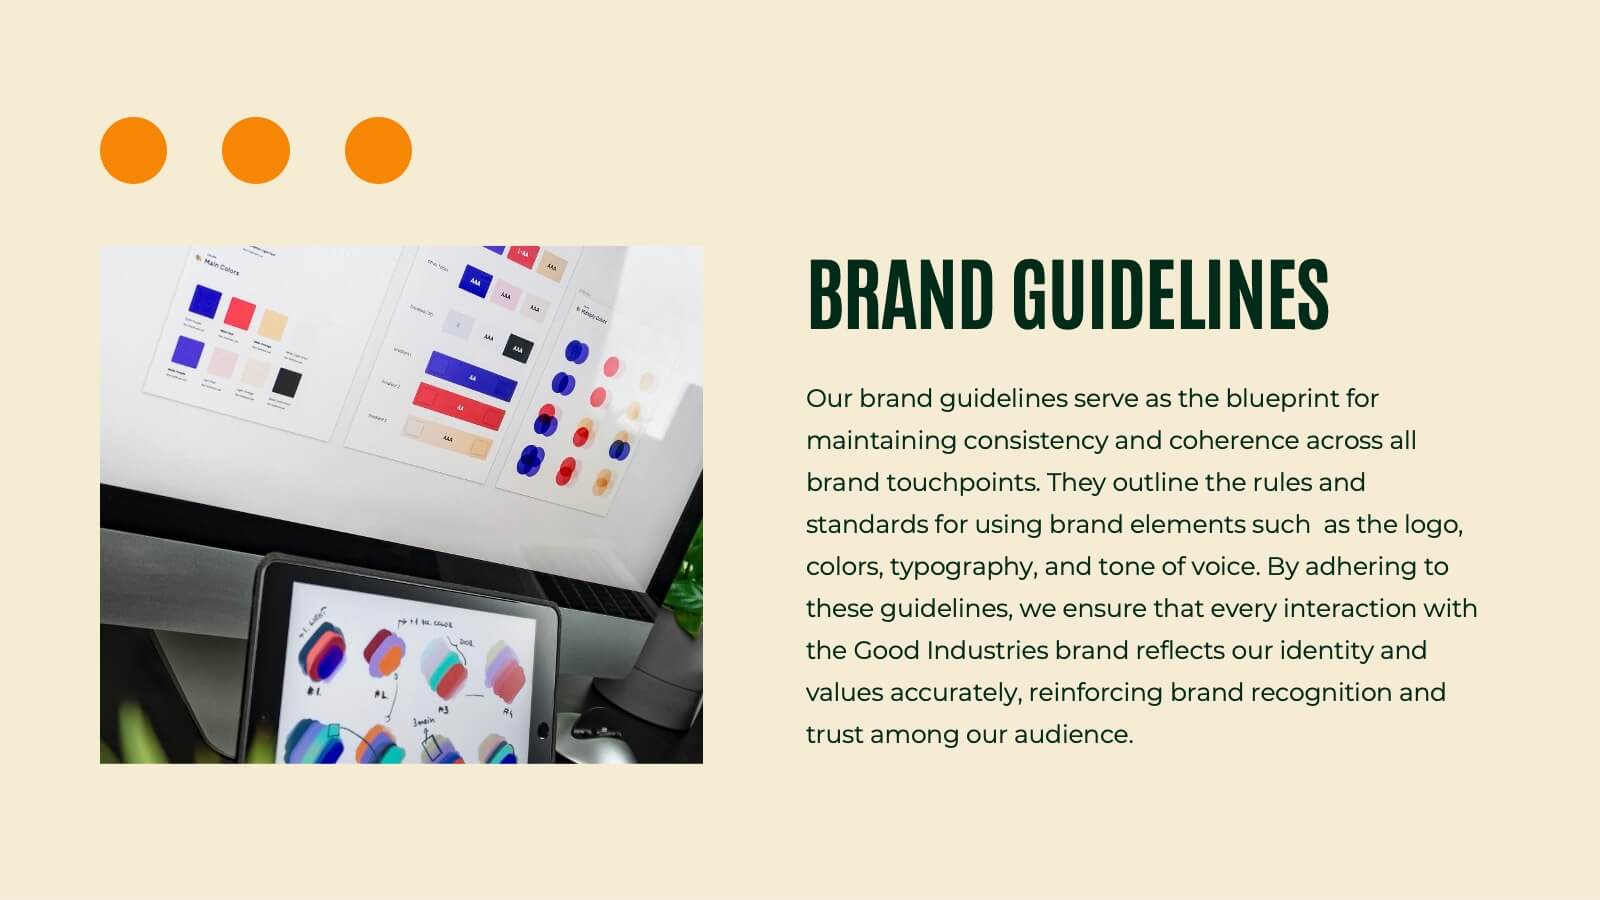
Shadowglow Brand Guidelines Proposal Presentation
Present a cohesive brand vision with this professional template, designed for crafting detailed and visually compelling brand guidelines. Highlight essential components like brand vision and mission, brand values, and identity elements, including color palettes, typography, and imagery. This template seamlessly incorporates customer personas, tone and voice guidelines, and brand touchpoints to define the essence of your brand's communication. Utilize slides for website, social media, and packaging strategies to establish consistency across all platforms. Customizable and compatible with PowerPoint, Google Slides, and Keynote, this design ensures clarity and professionalism, making it ideal for agencies or teams presenting comprehensive brand proposals.


6 diapositivas
Harvey Ball Comparison Chart Presentation
Turn data into insight with this clean and colorful presentation design. Ideal for visualizing comparisons, progress levels, or product evaluations, it makes complex information easy to read and interpret. Fully editable and compatible with PowerPoint, Keynote, and Google Slides, this layout ensures clarity and impact in every presentation.


12 diapositivas
Startup Investor Pitch Deck Presentation
Craft a compelling pitch with this Startup Investor Pitch Deck template. Featuring a structured layout, it helps showcase your startup’s vision, market potential, and financial projections. Designed for clarity and engagement, this template ensures a persuasive investor presentation. Fully compatible with PowerPoint, Keynote, and Google Slides for seamless customization.


5 diapositivas
Industry Analysis Porter's 5 Forces
Analyze market dynamics with this clean, circular infographic focused on Porter’s Five Forces. Visually break down buyer power, supplier influence, new entrants, substitutes, and competitive rivalry for a clear strategic overview. Ideal for consultants, marketers, and business analysts. Fully editable in PowerPoint, Keynote, and Google Slides.


21 diapositivas
Aetherial UX Research Report Presentation
A professional and modern template for UX research presentations. Highlight key elements such as user personas, journey mapping, wireframes, and testing processes. Includes slides for accessibility considerations, design systems, and feedback iteration. Fully customizable and compatible with PowerPoint, Keynote, and Google Slides to deliver impactful insights and research findings.


4 diapositivas
Business Role Structure Diagram Presentation
Bring your team structure to life with a clear, engaging visual that makes every role instantly understandable. This presentation helps you map relationships, outline responsibilities, and communicate workflow with ease. Designed for simple customization and professional clarity, it supports PowerPoint, Keynote, and Google Slides for seamless editing across platforms.


7 diapositivas
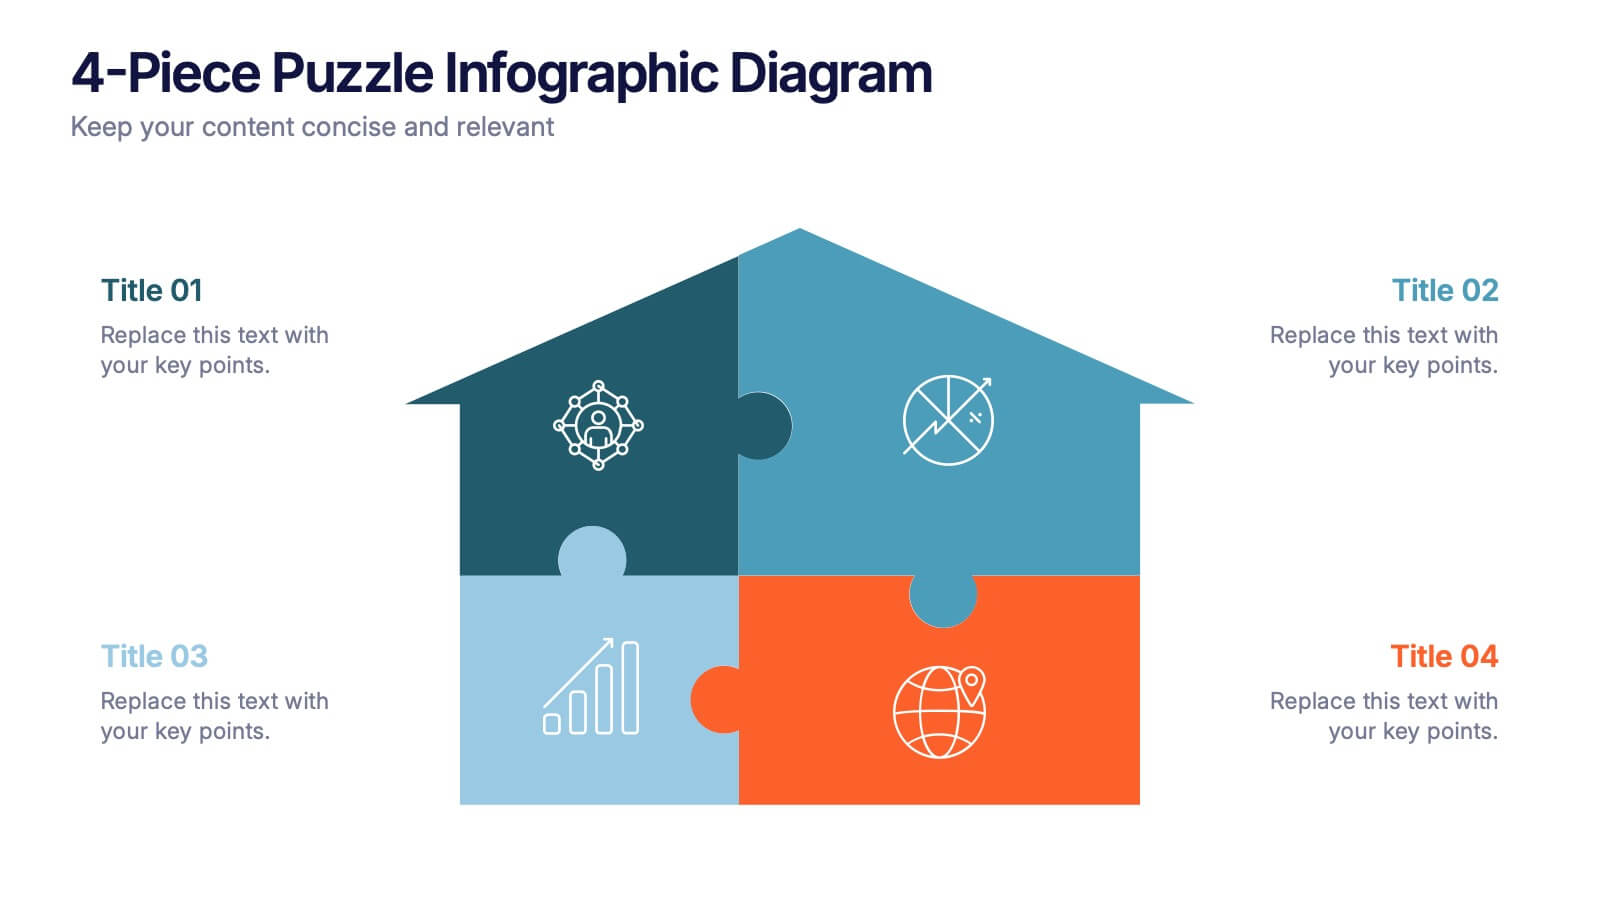
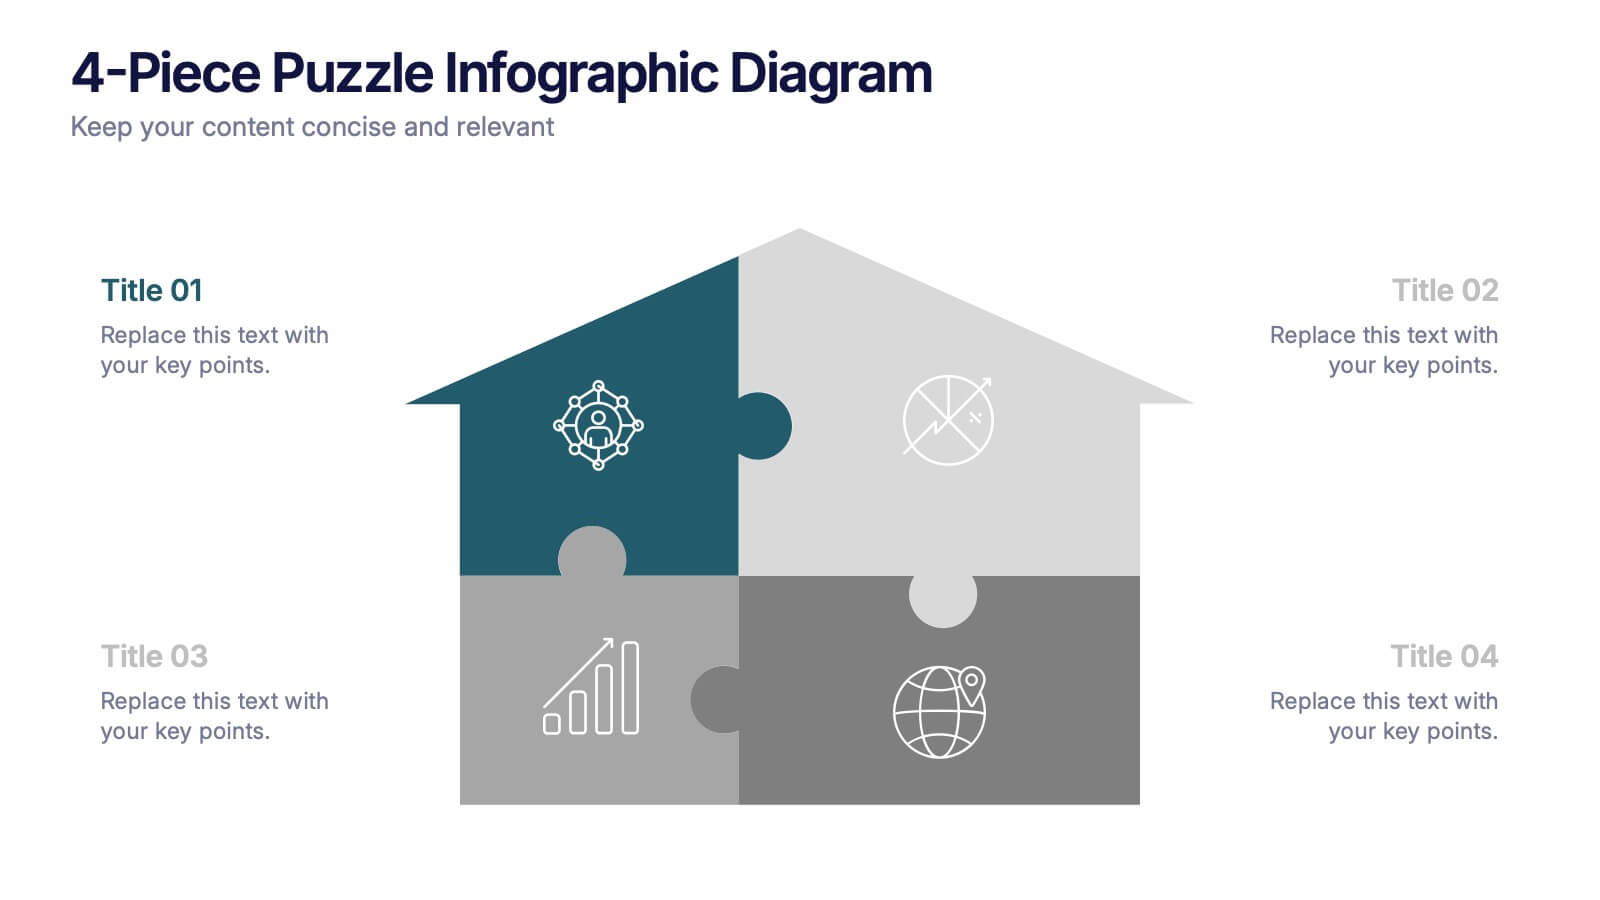
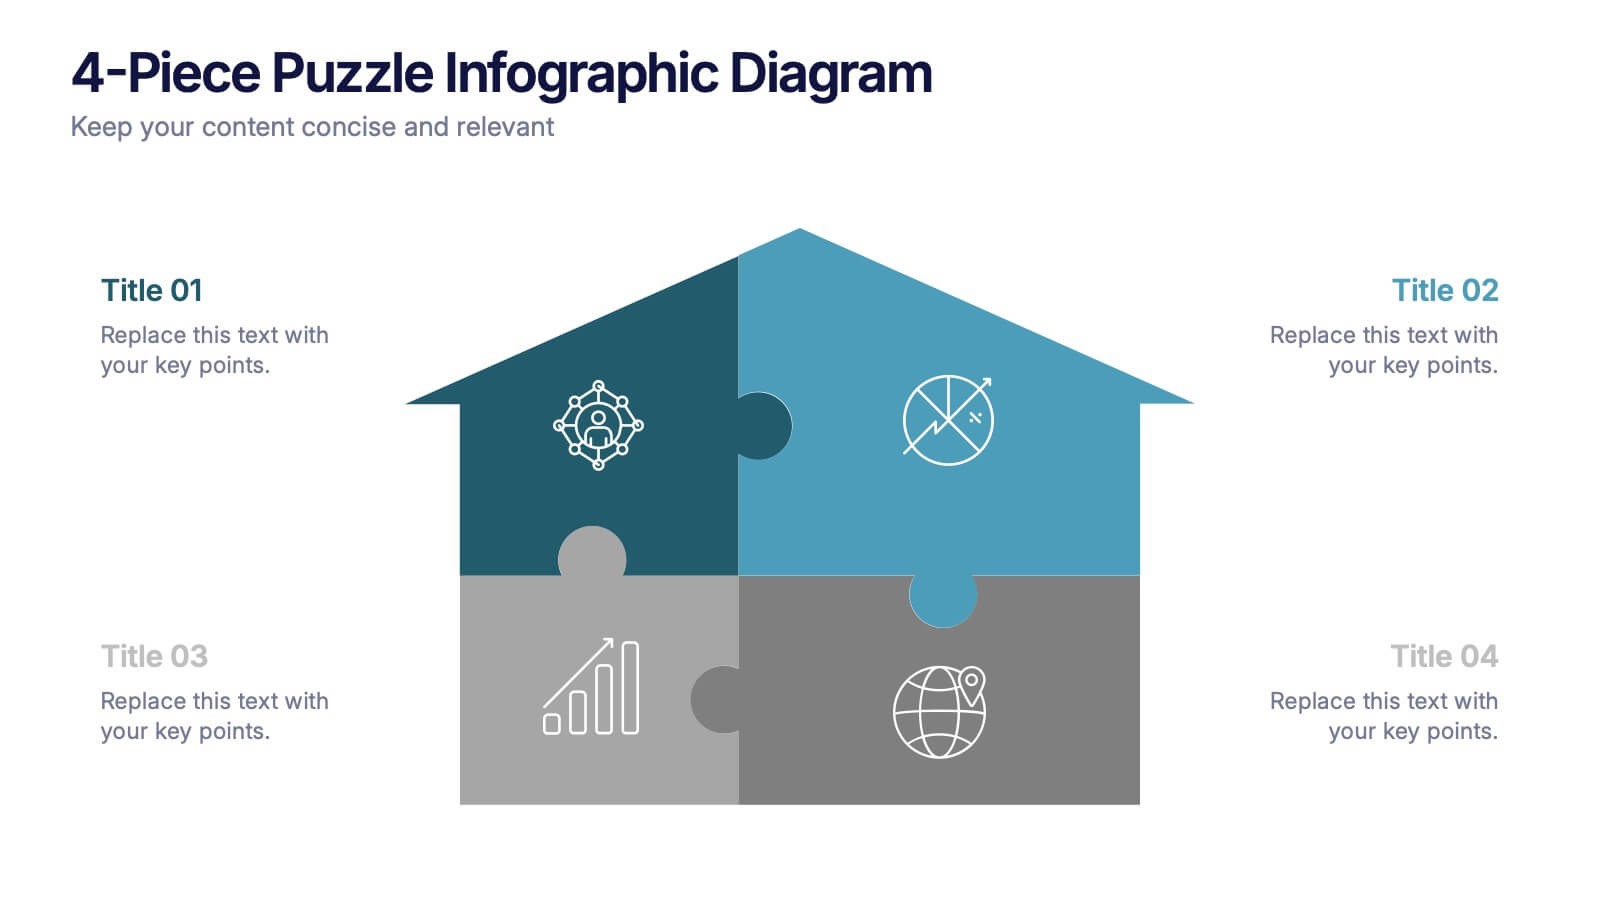
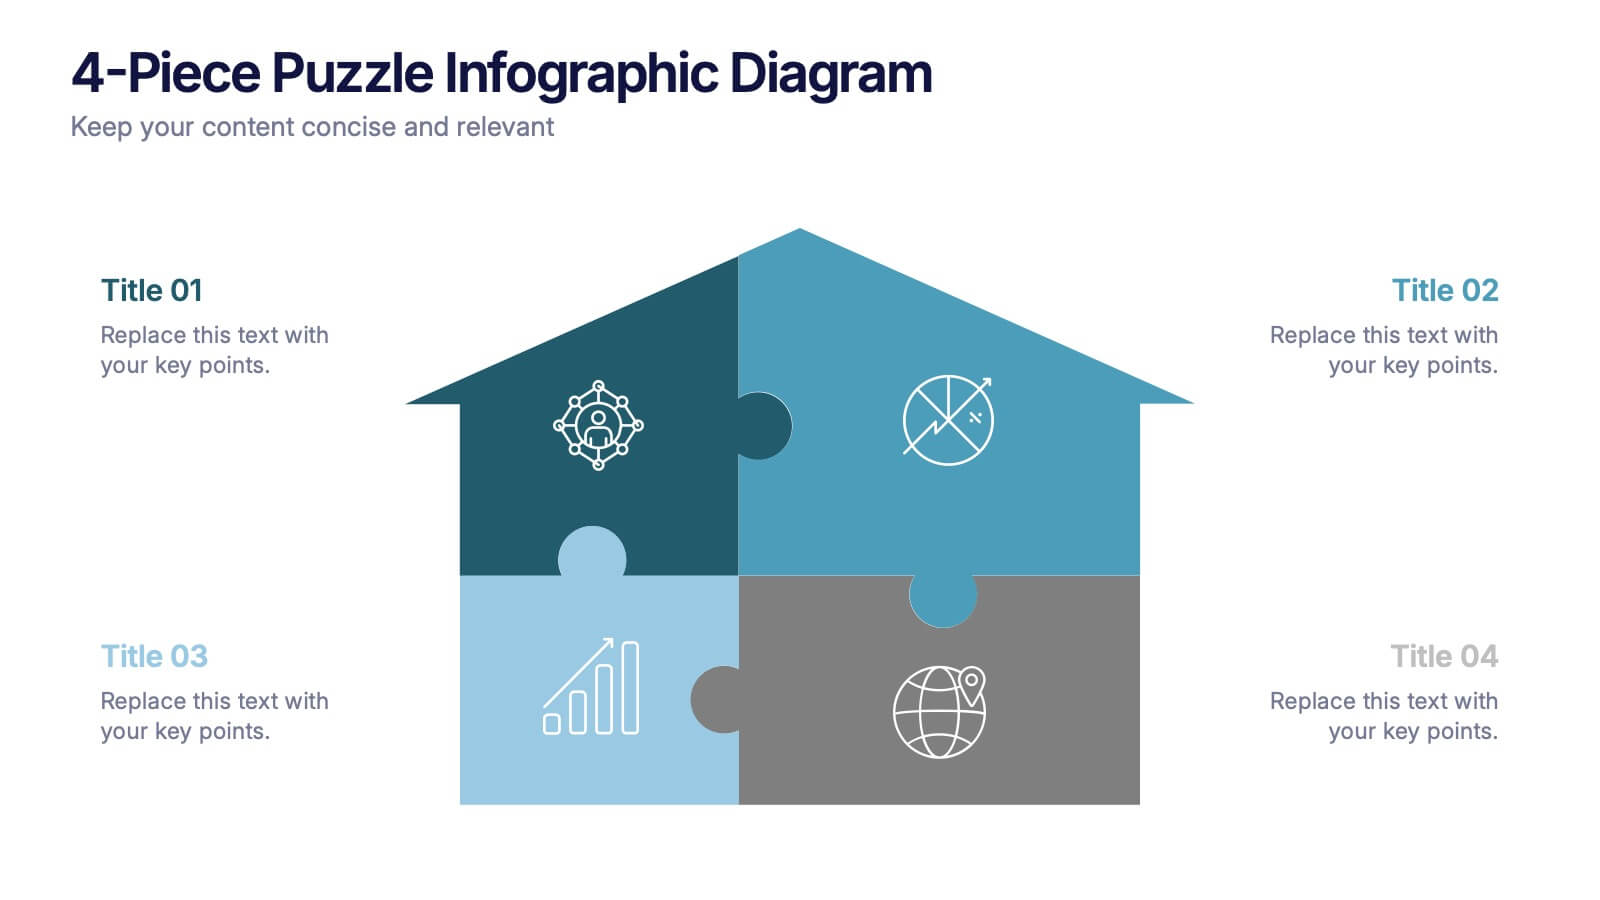
Matrix System Diagram Infographic
A matrix diagram is a visual representation of data in a matrix format, commonly used to analyze the relationships between two or more sets of items. This infographic template is a valuable tool in various fields including business, project management, quality management, and decision-making processes. Compatible with Powerpoint, Keynote, and Google Slides. This is designed to help you present intricate relationships, structures, and data in a clear and visually engaging way. Whether you're illustrating business strategies, decision matrices, or organizational hierarchies, this template simplifies complexity.


5 diapositivas
USA Regional Map Slide Presentation
Bring your data to life with a bold, colorful snapshot of regional insights across the United States. This presentation makes it easy to highlight state-level trends, compare demographics, and visualize performance using clean map graphics and simple icons. Fully compatible with PowerPoint, Keynote, and Google Slides.


5 diapositivas
Nutrition Facts Infographics
Nutrition facts provide important information about the nutritional content of food and beverages. This helps individuals make informed decisions about their dietary choices and understand the impact of food on their health. These infographic templates are designed to present essential information about nutrition and healthy eating habits. These infographics are suitable for nutritionists, dietitians, health educators, or anyone looking to communicate key facts and guidelines about nutrition in a clear and engaging manner. Compatible with Powerpoint, Keynote, and Google Slides, these are fully customizable.


8 diapositivas
Africa Market Potential and Improvement Map Presentation
Visualize market opportunities across Africa with this insightful map template. Featuring percentage-based growth indicators and color-coded country highlights, it’s perfect for showcasing regional potential, trends, and business expansion strategies. Fully customizable in PowerPoint, Keynote, and Google Slides, this template supports clear, data-driven storytelling for marketing, economic, or strategic presentations.


26 diapositivas
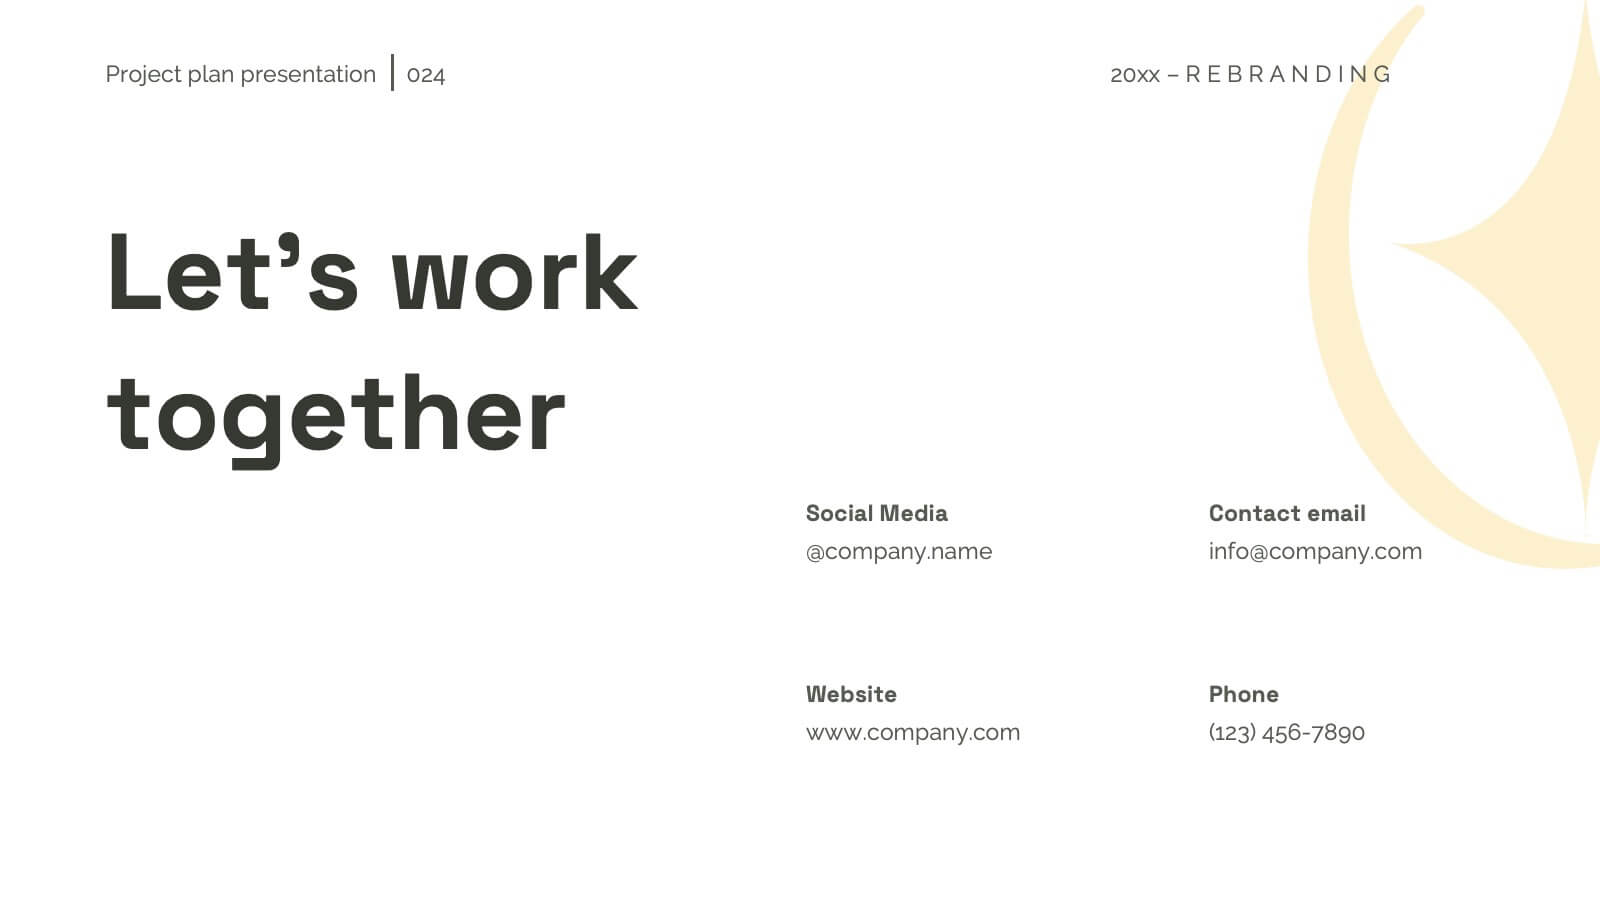
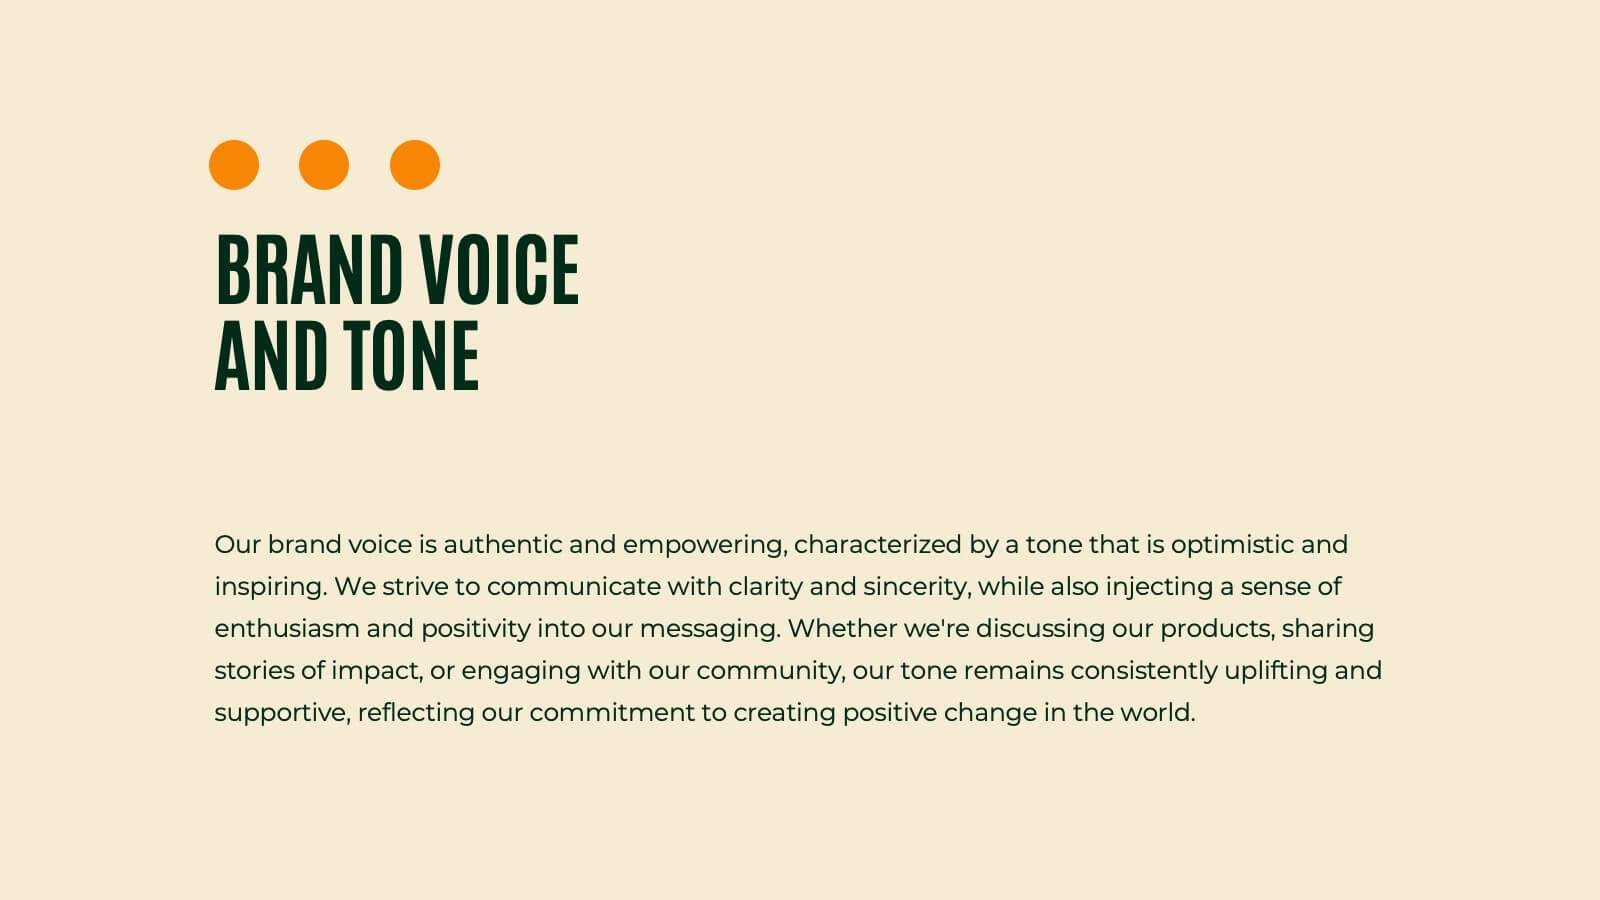
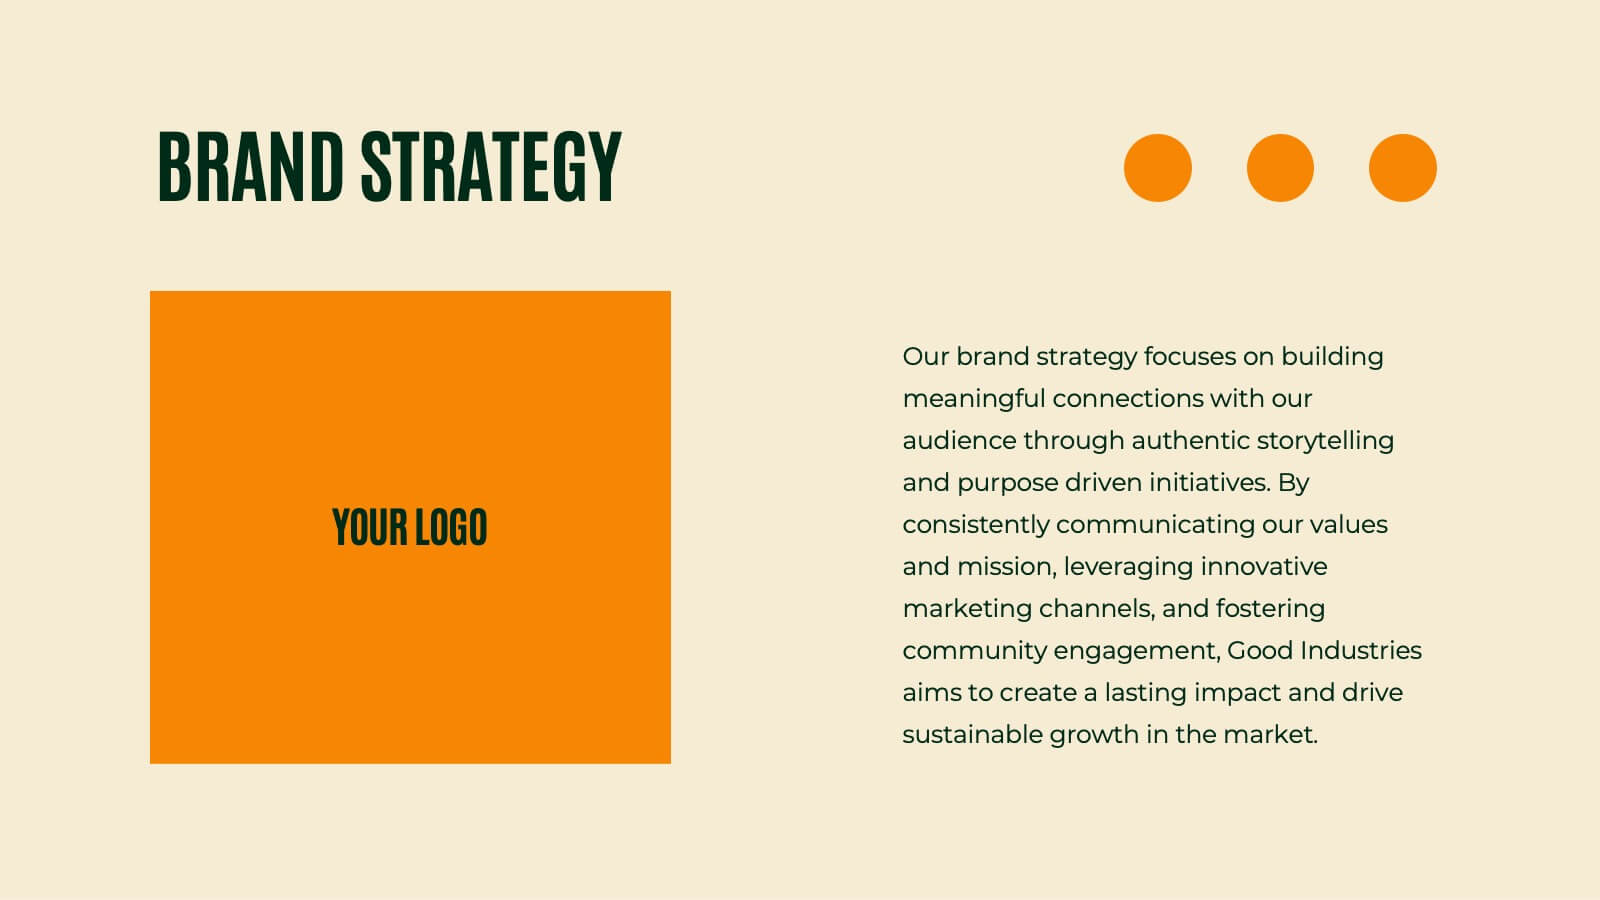
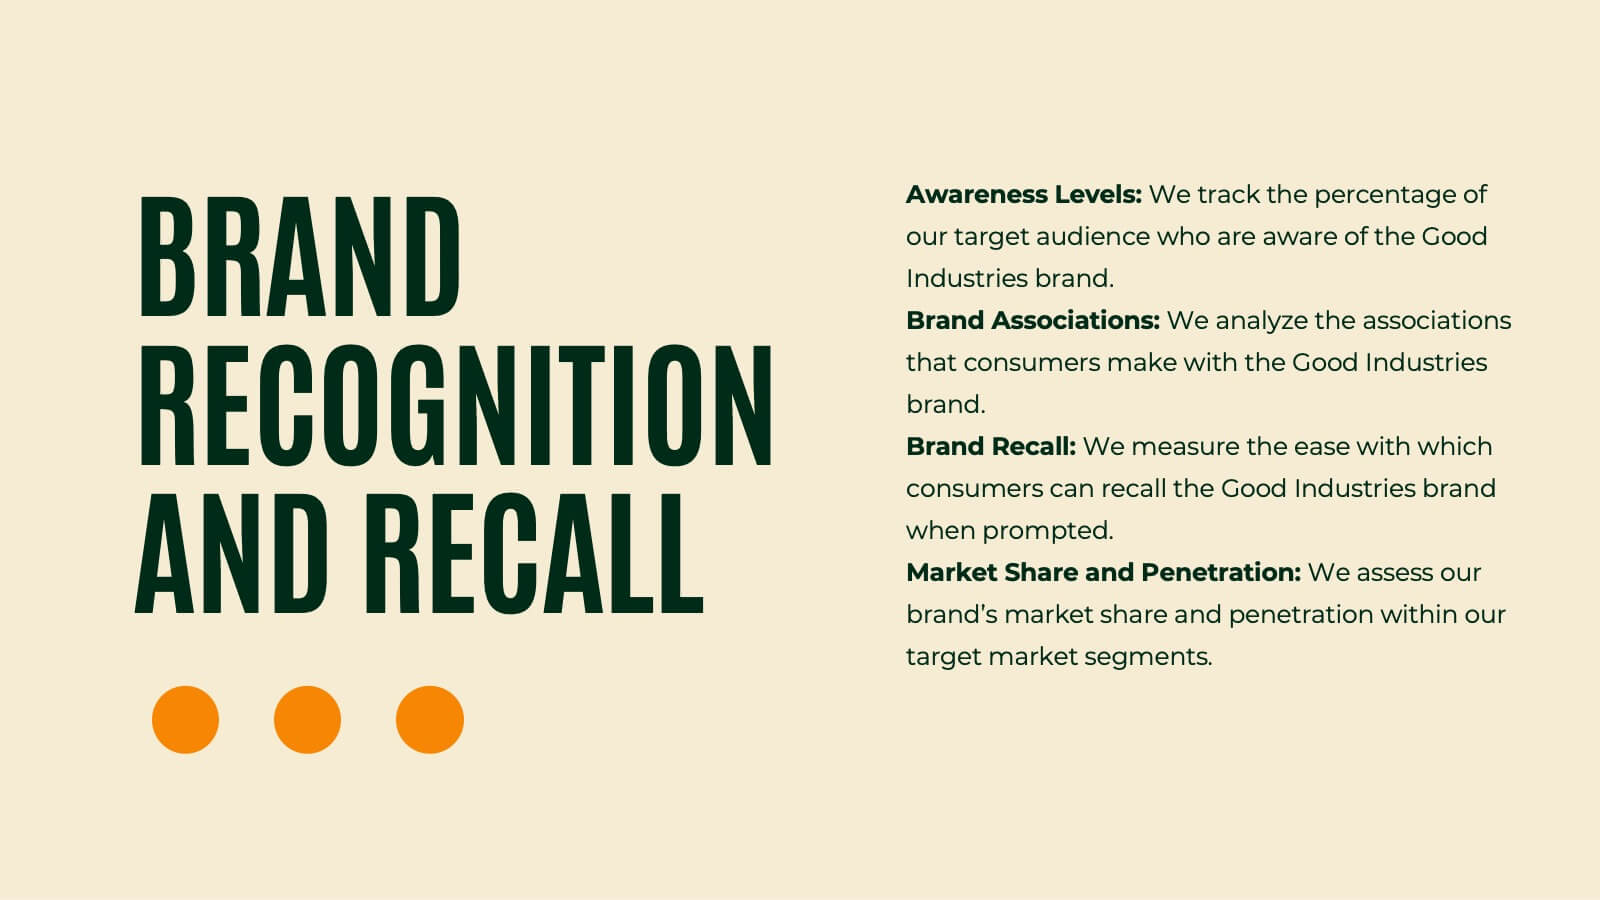
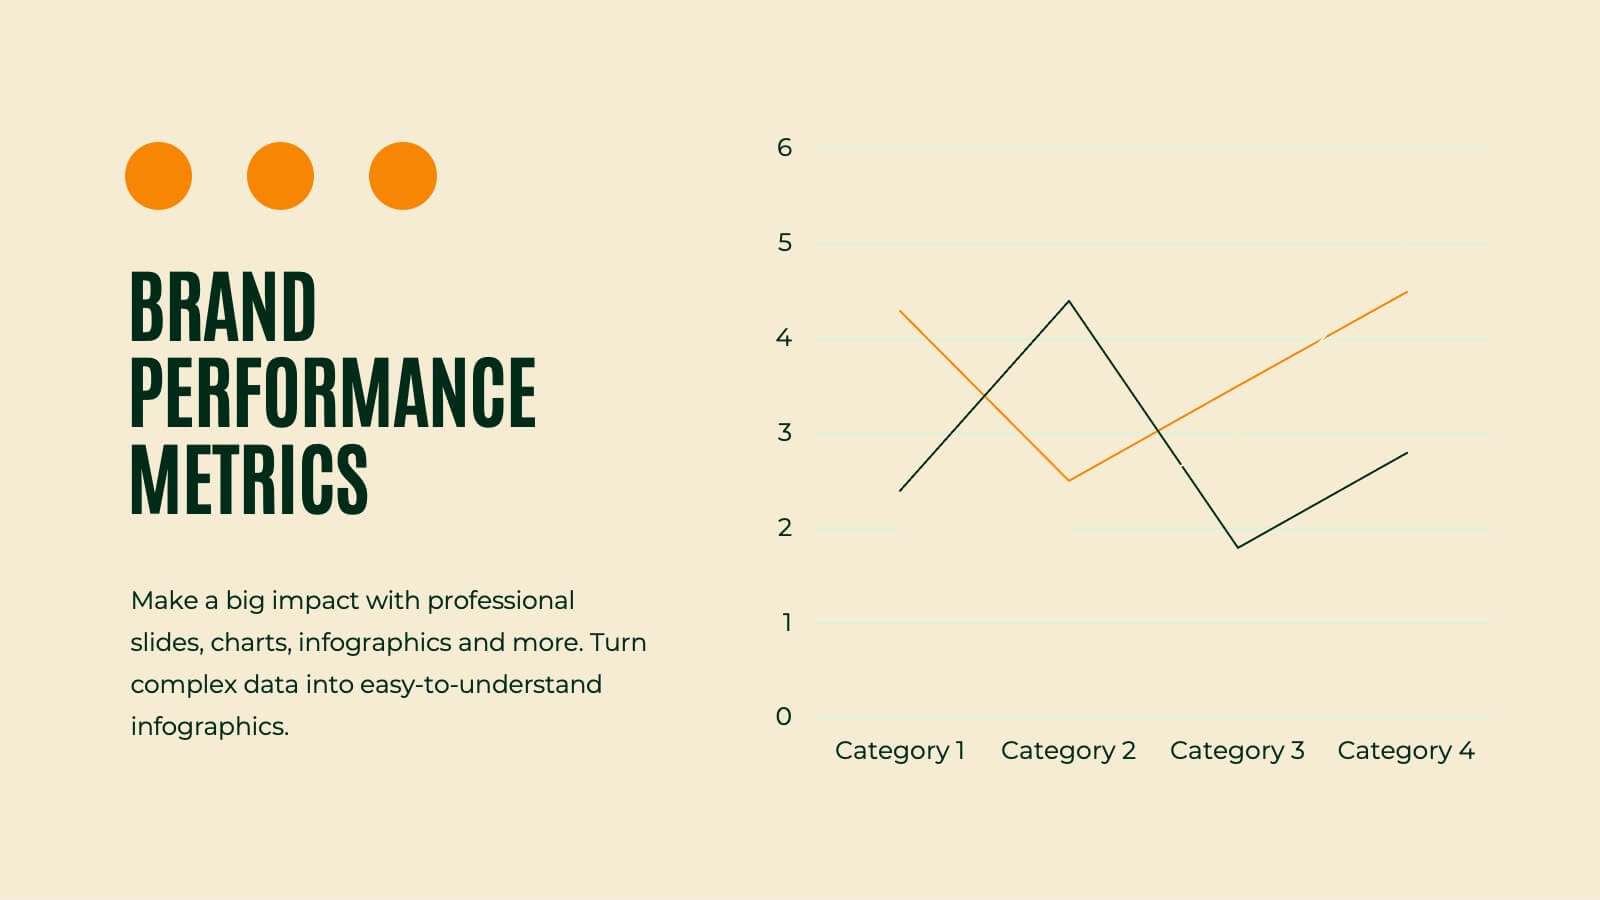
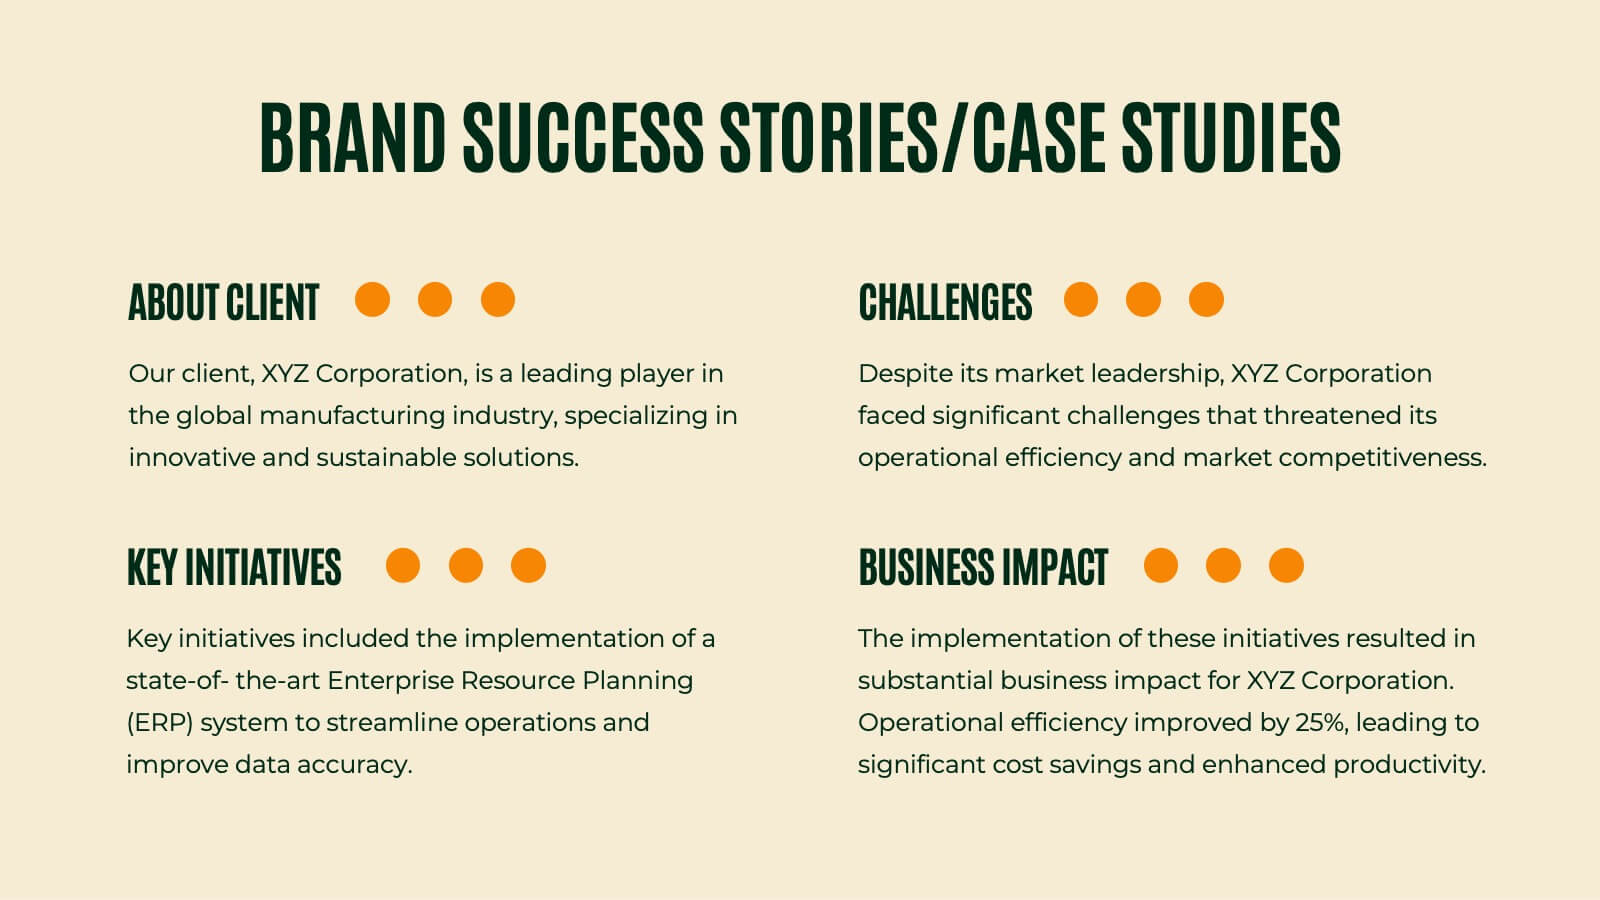
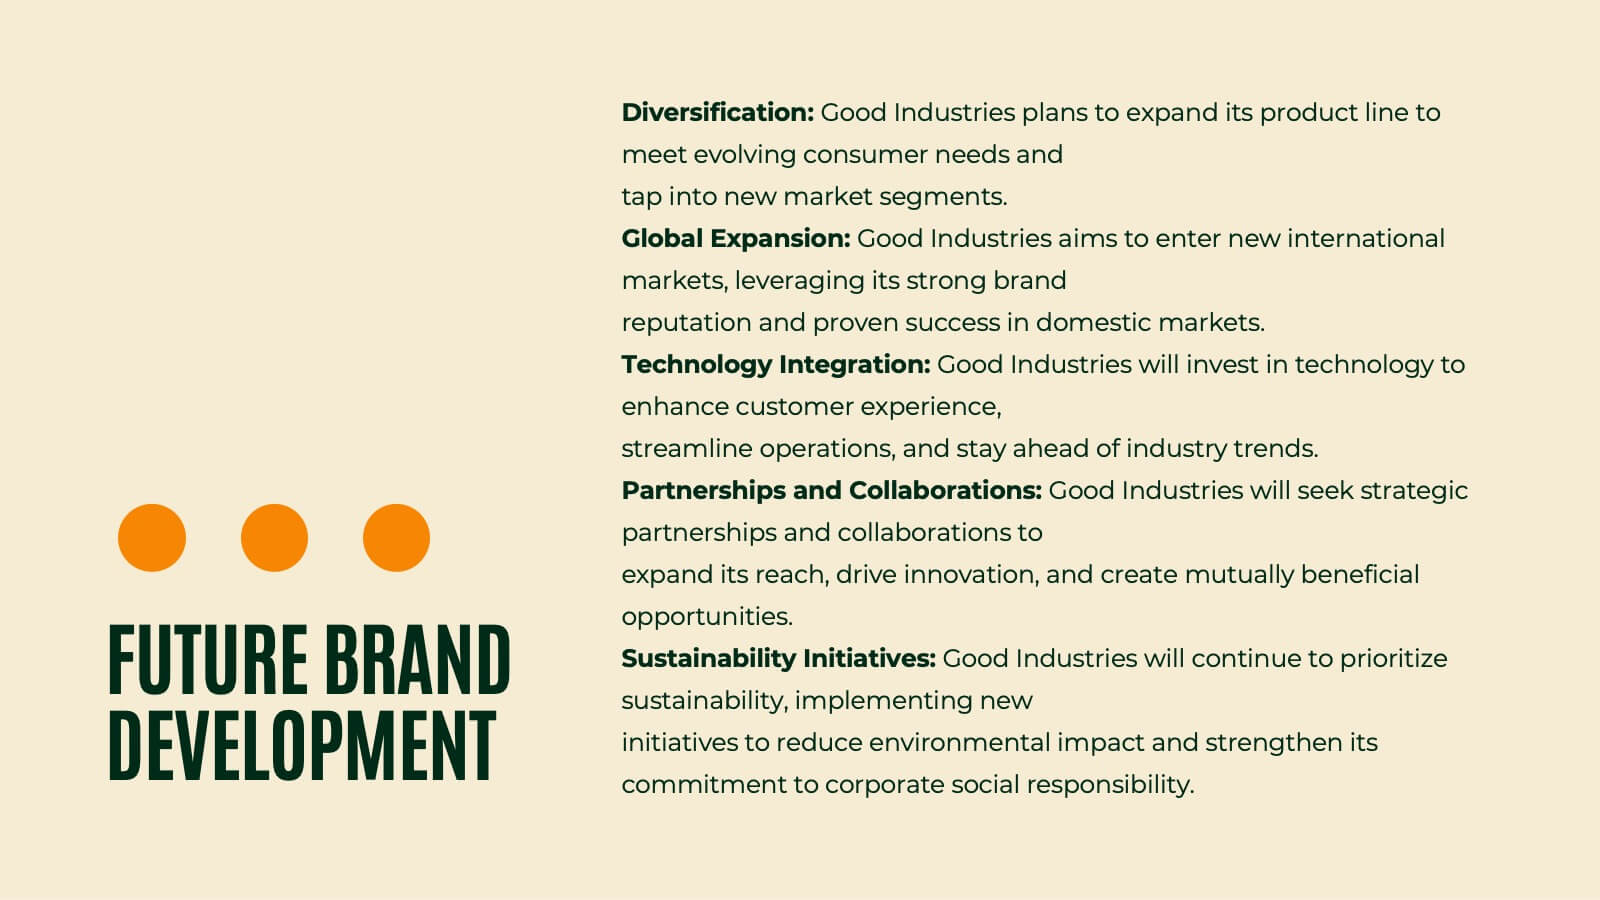
Griffin Rebranding Project Plan Presentation
Unleash the power of branding with this vibrant presentation template! This tool guides you through essential brand elements like identity, voice, and strategy. Perfect for marketers and brand managers aiming to make a memorable impact. Compatible with PowerPoint, Keynote, and Google Slides, it's a must-have for any branding project.