


Características


¿Tienes alguna pregunta?
Recomendar


5 diapositivas
Public Health Data Presentation
Bright visuals and clean data blocks make this slide an energizing way to present key insights, instantly pulling viewers into the story behind your metrics. It helps simplify complex information while keeping everything clear, structured, and easy to follow. Fully compatible with PowerPoint, Keynote, and Google Slides.


23 diapositivas
Skycrest Business Idea Pitch Deck Presentation
Present your innovative business idea with this bold pitch deck, featuring sections for problem statement, solution, business model, and financial projections. Ideal for capturing investor attention, this template supports PowerPoint, Keynote, and Google Slides, making it perfect for impactful presentations across multiple platforms.


7 diapositivas
Schedule Infographics Presentation Template
Featuring our Schedule Infographic template, this is a great tool for business owners, students and others who need to create an impactful presentation. Using this template will ensure that your main point is emphasized and can be easily understood by all of your viewers. This template includes different colors and fonts that can be easily edited and changed. This will help you visualize your existing data and create a presentation that includes all of your points. Use this template to make a professional and smart looking schedule, and present your plan to others in an easy to understand way.


10 diapositivas
Post-Pandemic Business Strategy Presentation
Help your team adapt to the new normal with this sleek and professional slide layout. Featuring a sanitizer bottle graphic as a central metaphor, the design visually supports your content on strategic recovery, operational safety, or workflow changes. Includes four editable text sections, each with modern icons. Ideal for HR, leadership updates, or business continuity plans. Compatible with PowerPoint, Keynote, and Google Slides.


21 diapositivas
Stellara Content Marketing Pitch Deck Presentation
This Marketing Pitch Deck Presentation is designed to showcase your business strategies with clarity and style. Featuring slides for company history, market presence, financial highlights, and growth plans, it's perfect for startups and agencies. Fully editable and compatible with PowerPoint, Keynote, and Google Slides.


8 diapositivas
Educational Lesson Plan Presentation
The "Educational Lesson Plan Presentation" template offers a vibrant and engaging method to display educational strategies and frameworks. This template uses a stacked blocks design that visually represents the hierarchical structure of lesson components. Each block is color-coded, facilitating easy distinction between different sections such as Title 01, Title 02, Title 03, and Title 04, which can be customized with specific educational goals or key points. This format is ideal for educators planning their lessons or for presentations at educational seminars, workshops, or teacher training sessions, where clarity and visual structure enhance communication and understanding.


4 diapositivas
Science Lab Results and Data Analysis Presentation
Visualize lab data with clarity using this science-themed infographic. Featuring test tubes in a rack, it’s ideal for presenting experimental results, sample comparisons, or analysis summaries. Each tube aligns with icons and key points for easy interpretation. Fully customizable in PowerPoint, Keynote, and Google Slides to match your findings.


6 diapositivas
Concept Web with Spider Diagram Layout Presentation
Map out complex ideas with clarity using the Concept Web with Spider Diagram Layout Presentation. This dynamic radial format is perfect for showing interrelated components, skills analysis, or performance metrics at a glance. Ideal for brainstorming, strategy, or education—fully editable in Canva, PowerPoint, Keynote, and Google Slides.


28 diapositivas
Ignite Rebranding Project Plan Presentation
Ignite your brand with this vibrant project plan template! Perfect for defining brand identity, vision, and strategy. Ideal for marketers and brand managers aiming to create a cohesive and compelling brand presence. Compatible with PowerPoint, Keynote, and Google Slides, this template ensures your branding is impactful and professional. Make your brand unforgettable!


22 diapositivas
Dakota Corporate Strategy Agenda Presentation
Maximize your strategic sessions with this dynamic corporate strategy agenda presentation template. This template is designed to streamline your business discussions, featuring sections for everything from speaker introductions to session overviews and networking breaks. It’s ideal for conferences, workshops, or any corporate gatherings where a clear, structured schedule is essential. Compatible with major platforms like PowerPoint, Google Slides, and Keynote, it ensures you can organize and execute your agenda efficiently, fostering effective communication and collaboration across your team.


5 diapositivas
Risk Assessment Heat Map Presentation
Evaluate risks effectively with a structured heat map. This Risk Assessment Heat Map helps visualize potential threats by mapping probability and impact levels. Ideal for risk management, business continuity planning, and decision-making. Fully customizable and compatible with PowerPoint, Keynote, and Google Slides for professional and seamless integration.


6 diapositivas
Money Conversion Infographics
Convert currencies effectively with our Money Conversion infographic template. This template is fully compatible with popular presentation software like PowerPoint, Keynote, and Google Slides, allowing you to easily customize it to illustrate and communicate currency conversion rates and methods. The Money Conversion infographic template offers a visually engaging platform to explain the process of converting one currency to another, including exchange rates, conversion tools, and tips for international travelers or businesses. Whether you're a traveler, finance professional, or anyone dealing with currency exchange, this template provides a user-friendly canvas to create informative presentations and educational materials. Optimize your currency conversion knowledge with this SEO-optimized Money Conversion infographic template, thoughtfully designed for clarity and ease of use. Customize it to showcase currency conversion tools, real-time exchange rate sources, and practical examples, ensuring that your audience gains valuable insights into this important aspect of finance. Start crafting your personalized infographic today to become more proficient in money conversion.


6 diapositivas
Marketing Plan Infographic
Bring your marketing plan to life with this visually engaging Marketing Plan Infographic. Tailored for clarity and impact, it's perfect for Powerpoint, Google Slides, and Keynote. This template helps marketers and business professionals effectively communicate their strategy, from market analysis to sales targets. Customize each part with your data to showcase your marketing mix, customer segmentation, or competitive analysis. Whether for client meetings, team briefings, or classroom settings, this infographic simplifies complex data into a compelling visual narrative. Elevate your marketing presentation and ensure your plan is understood and remembered.

21 diapositivas
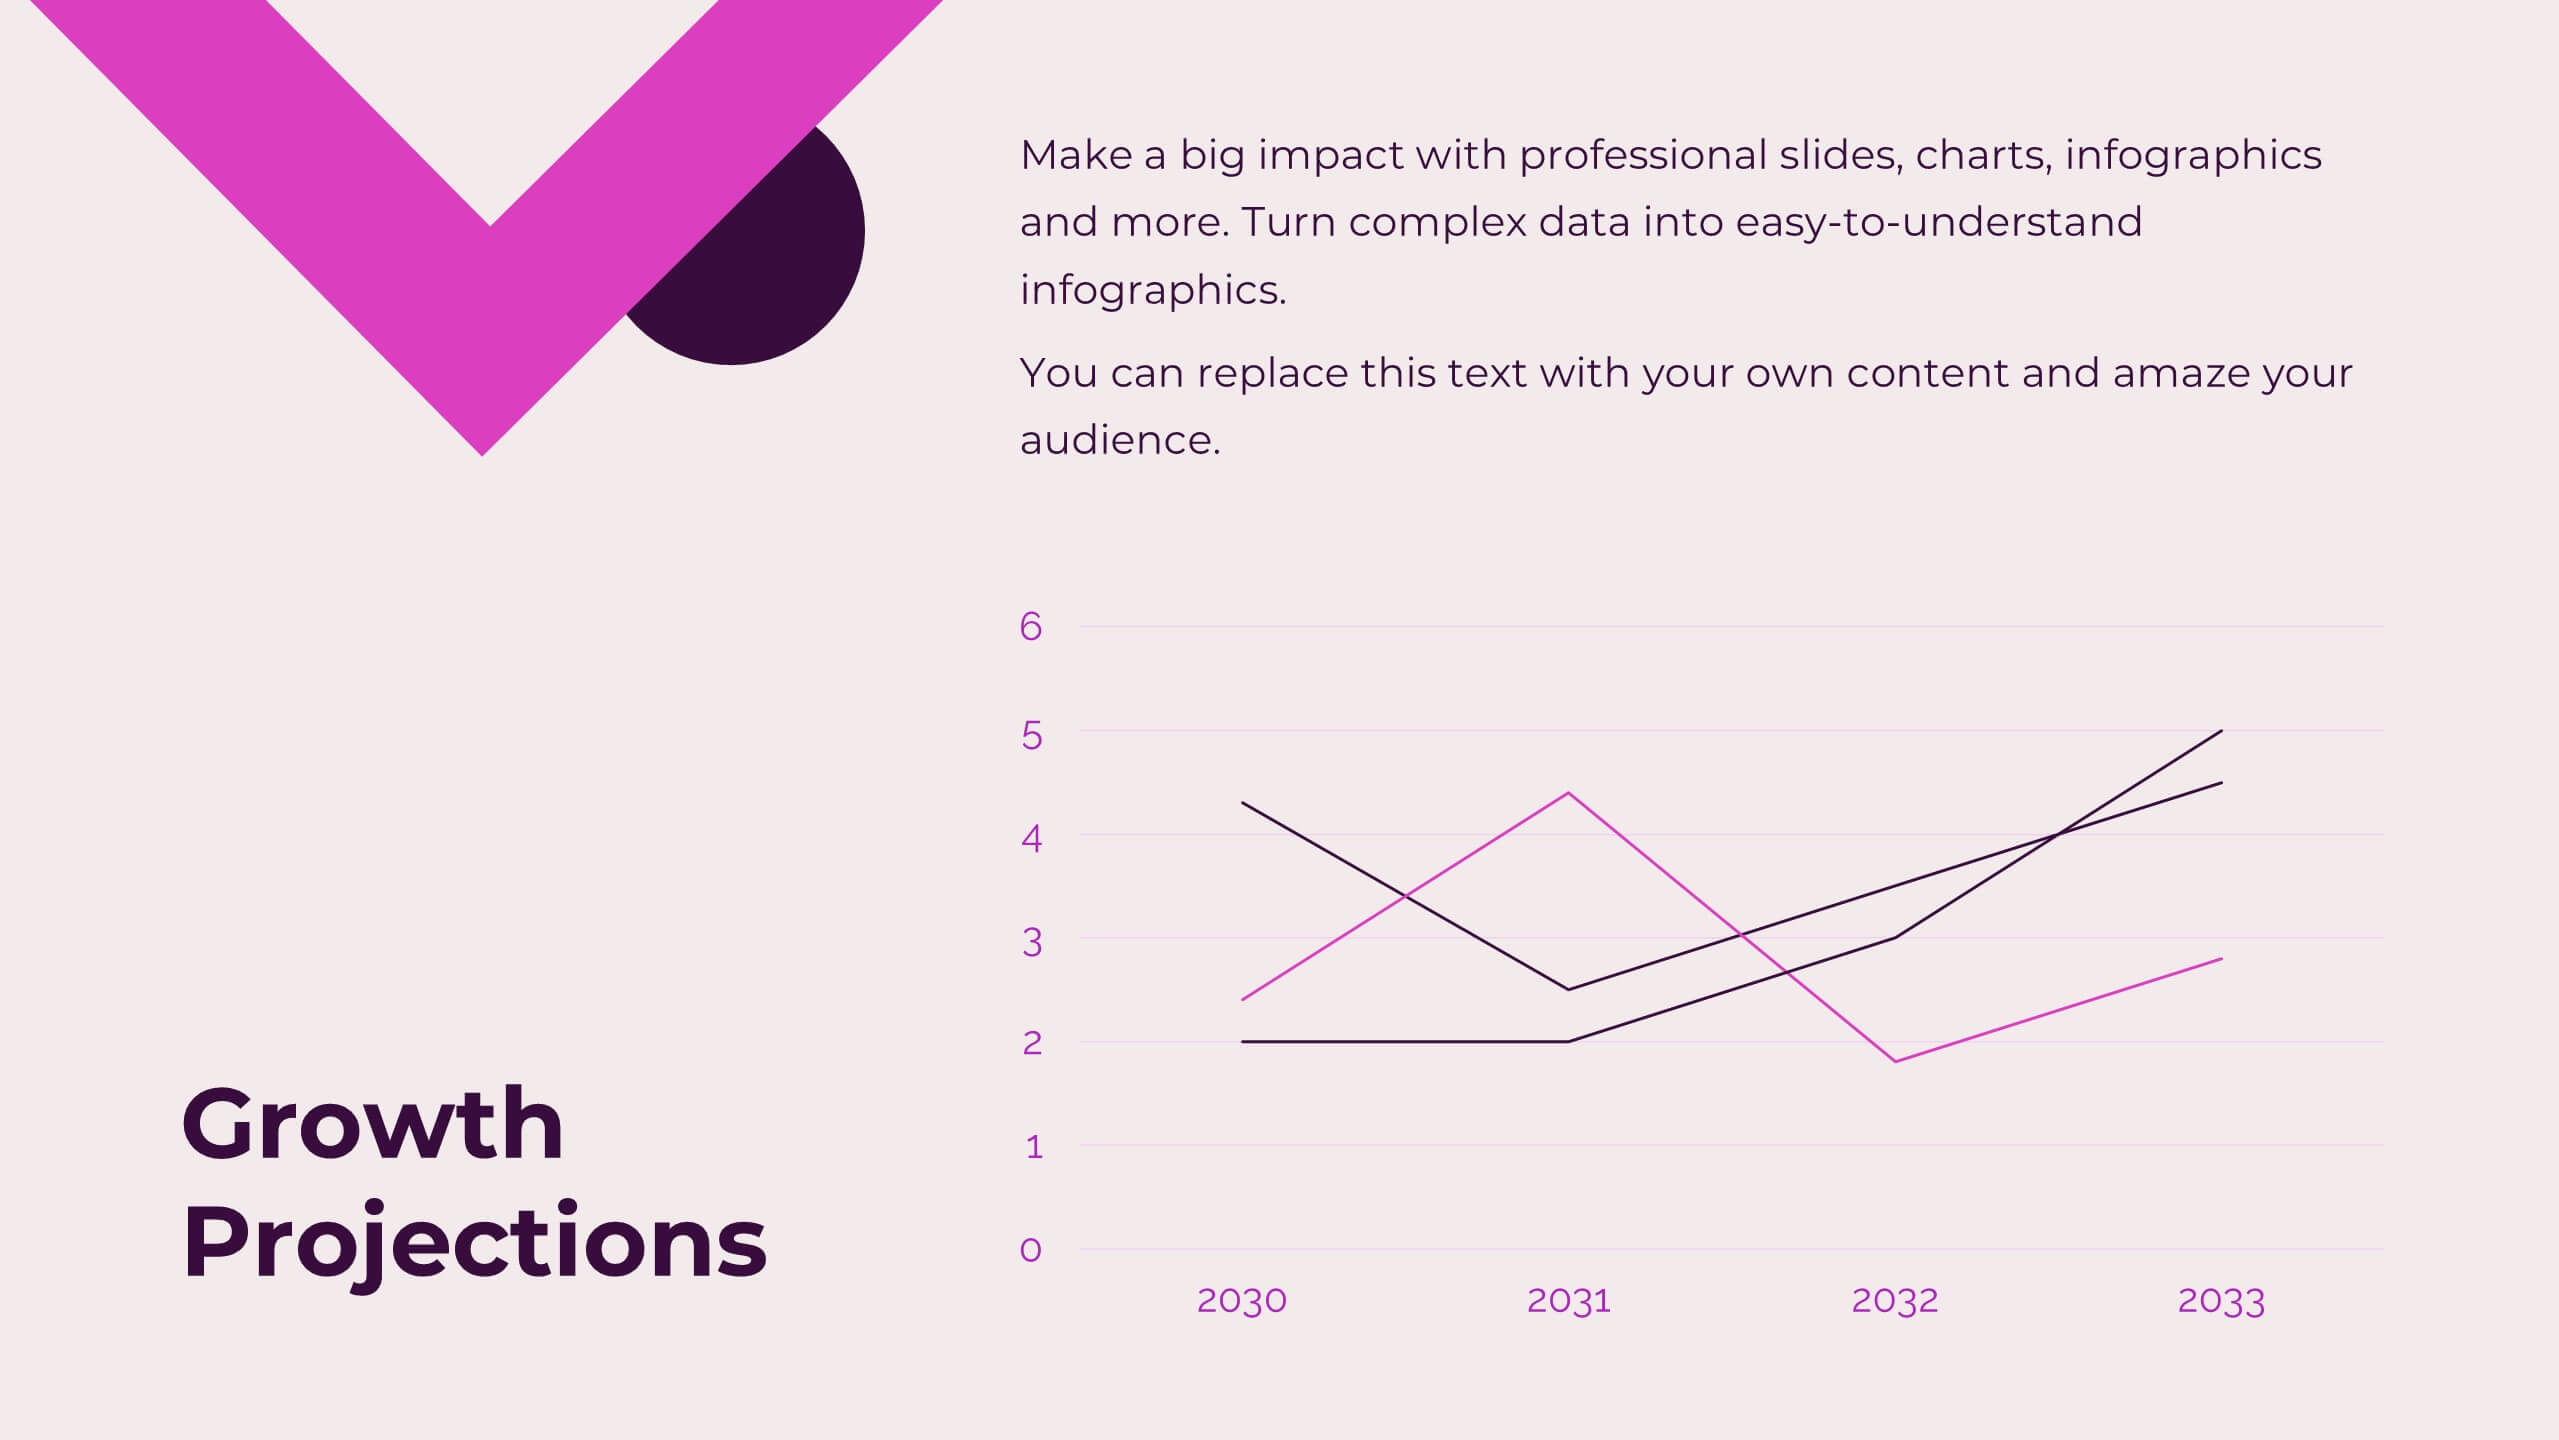
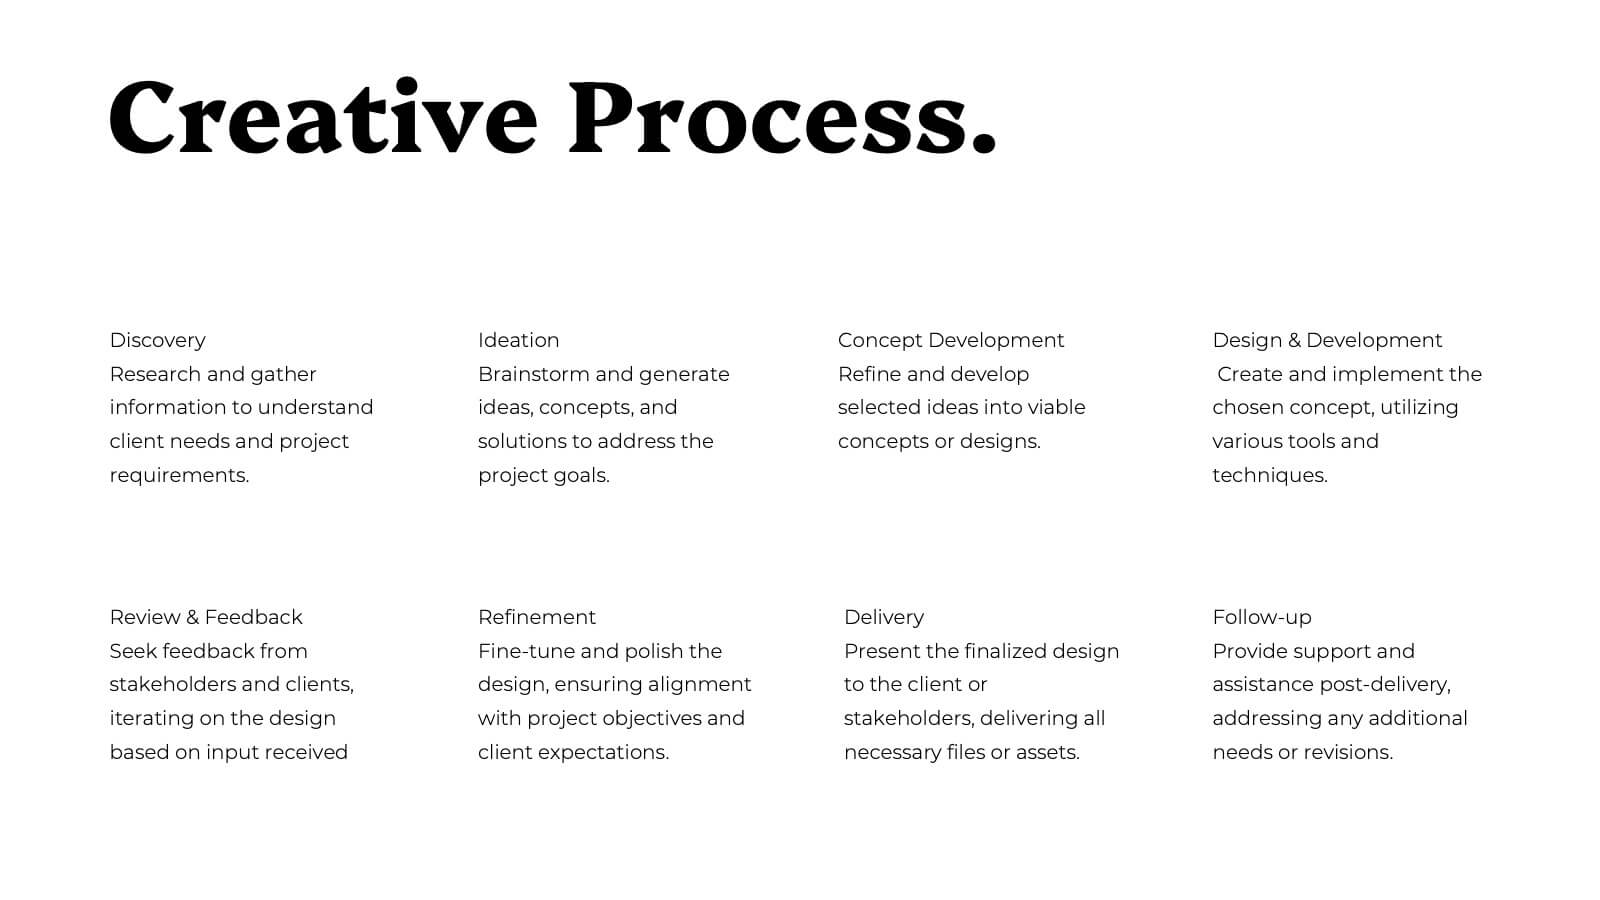
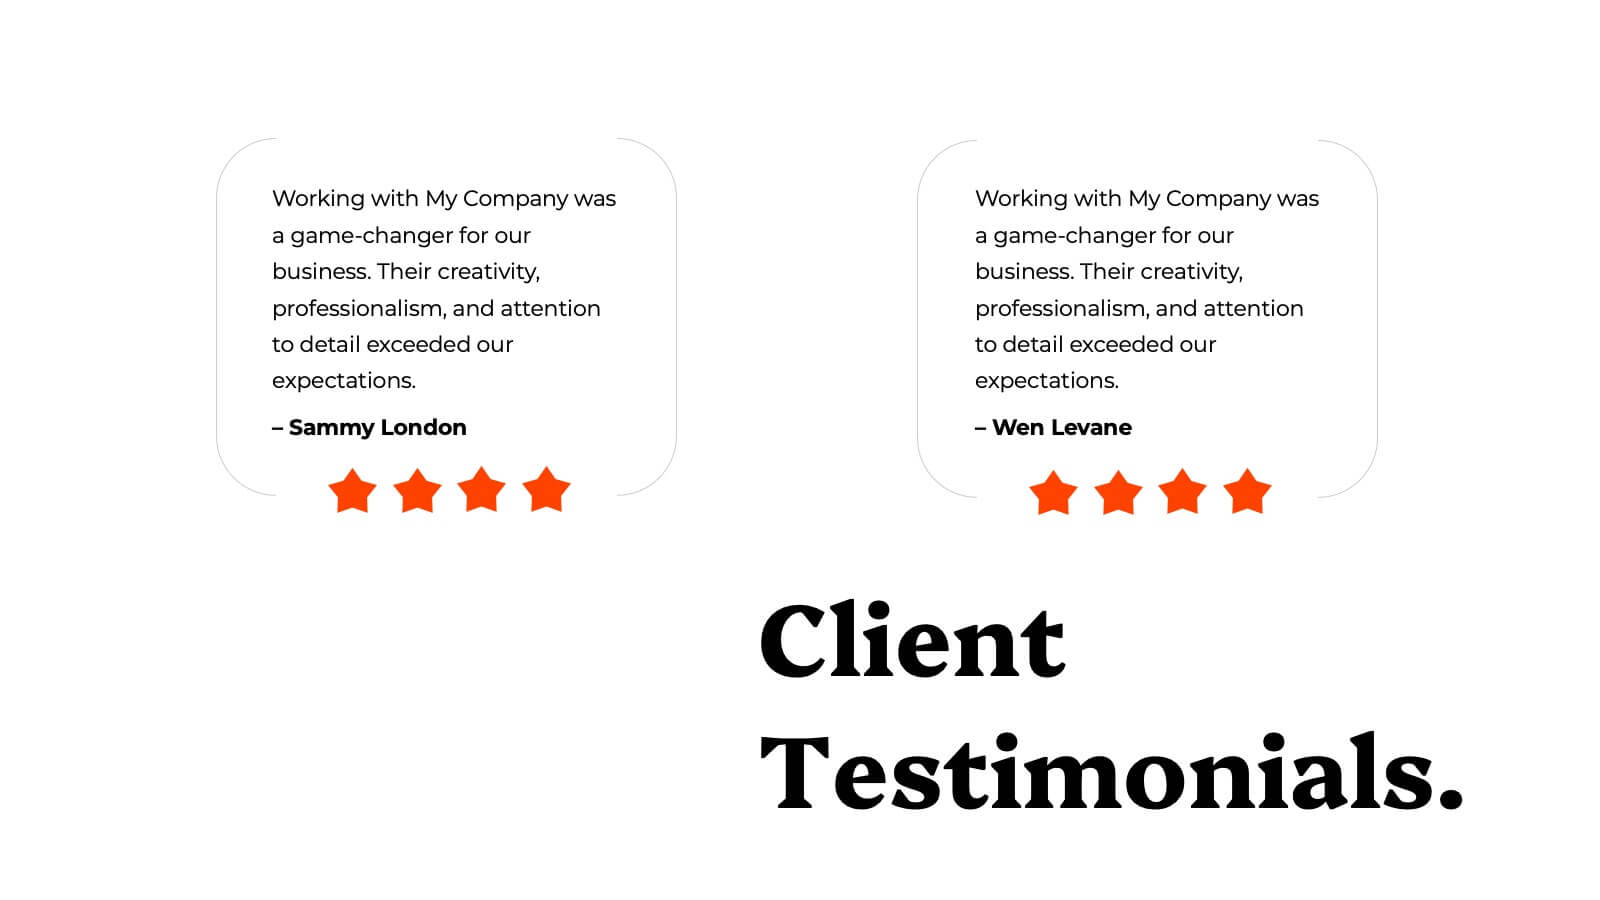
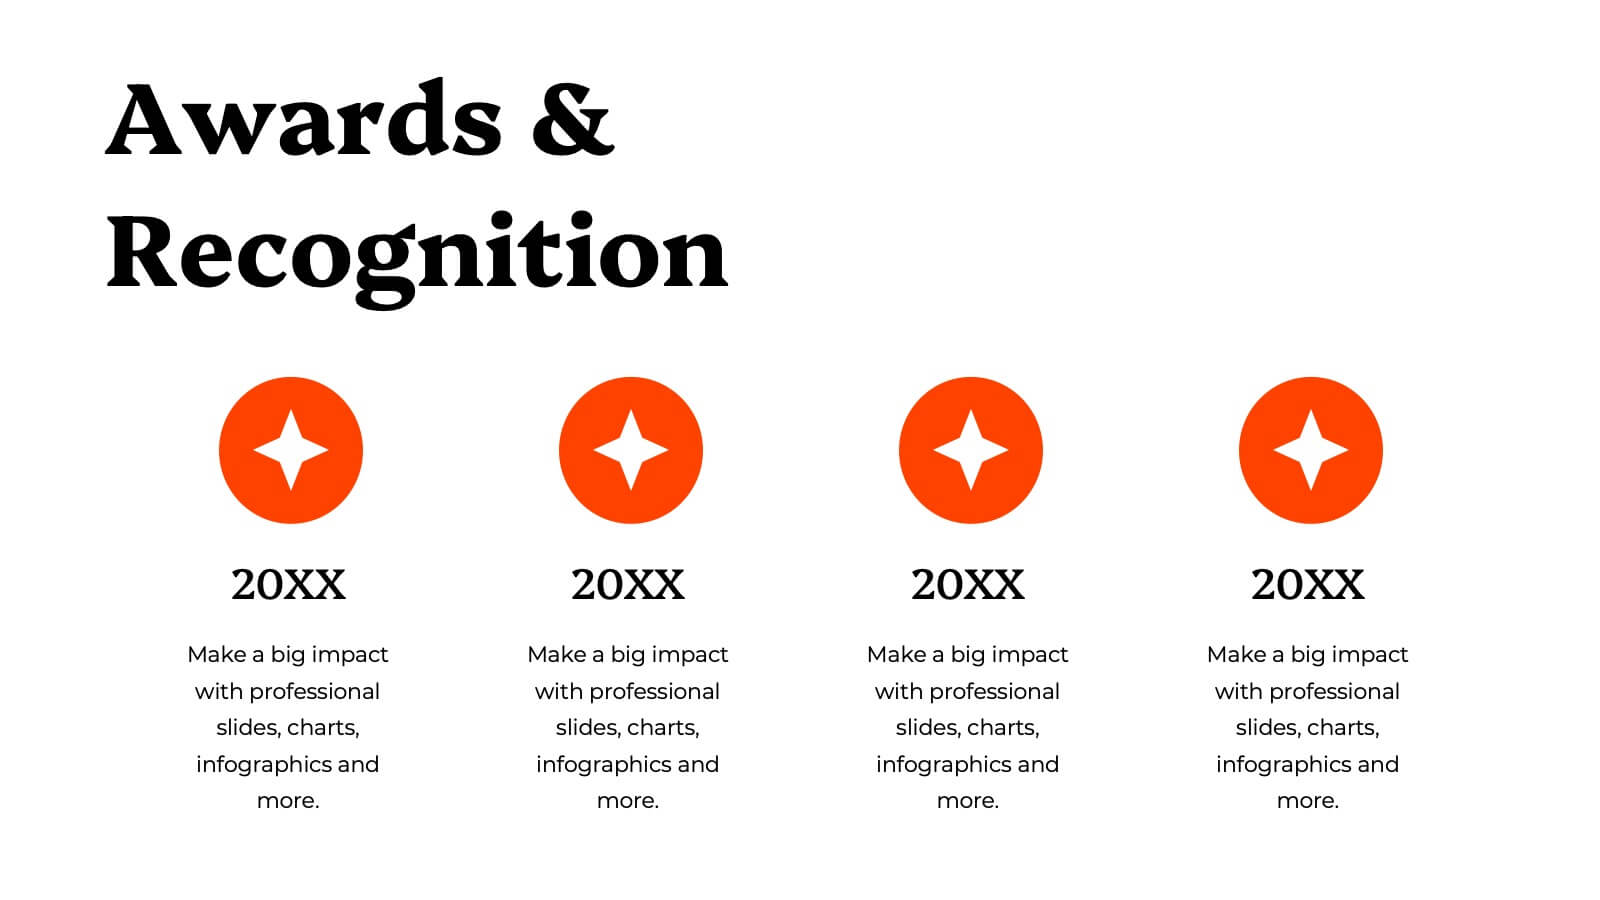
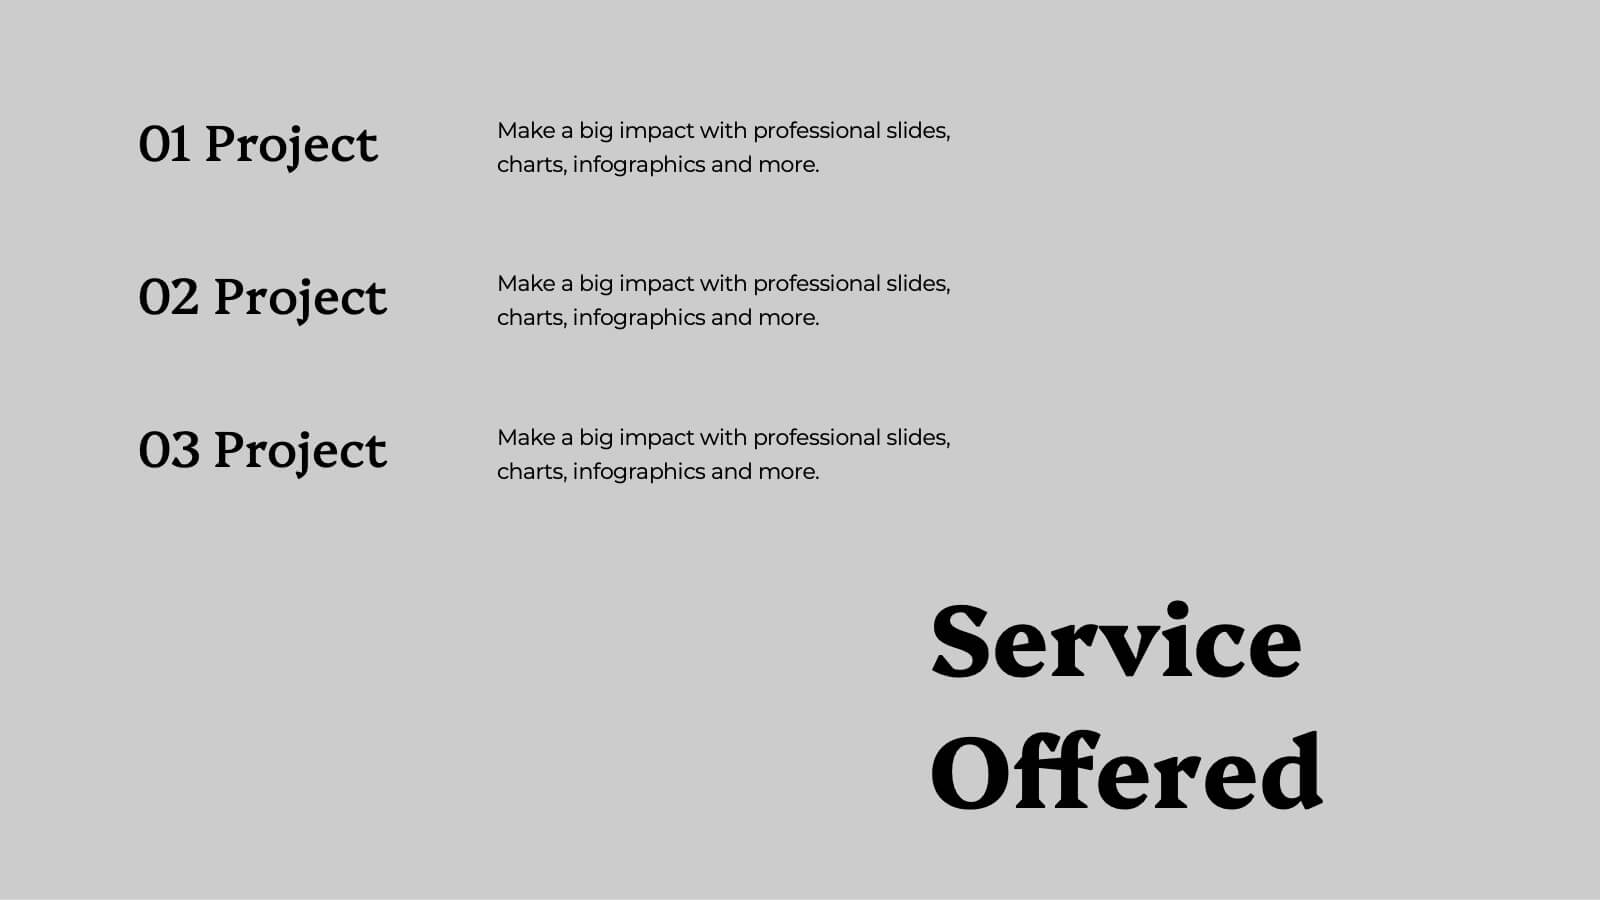
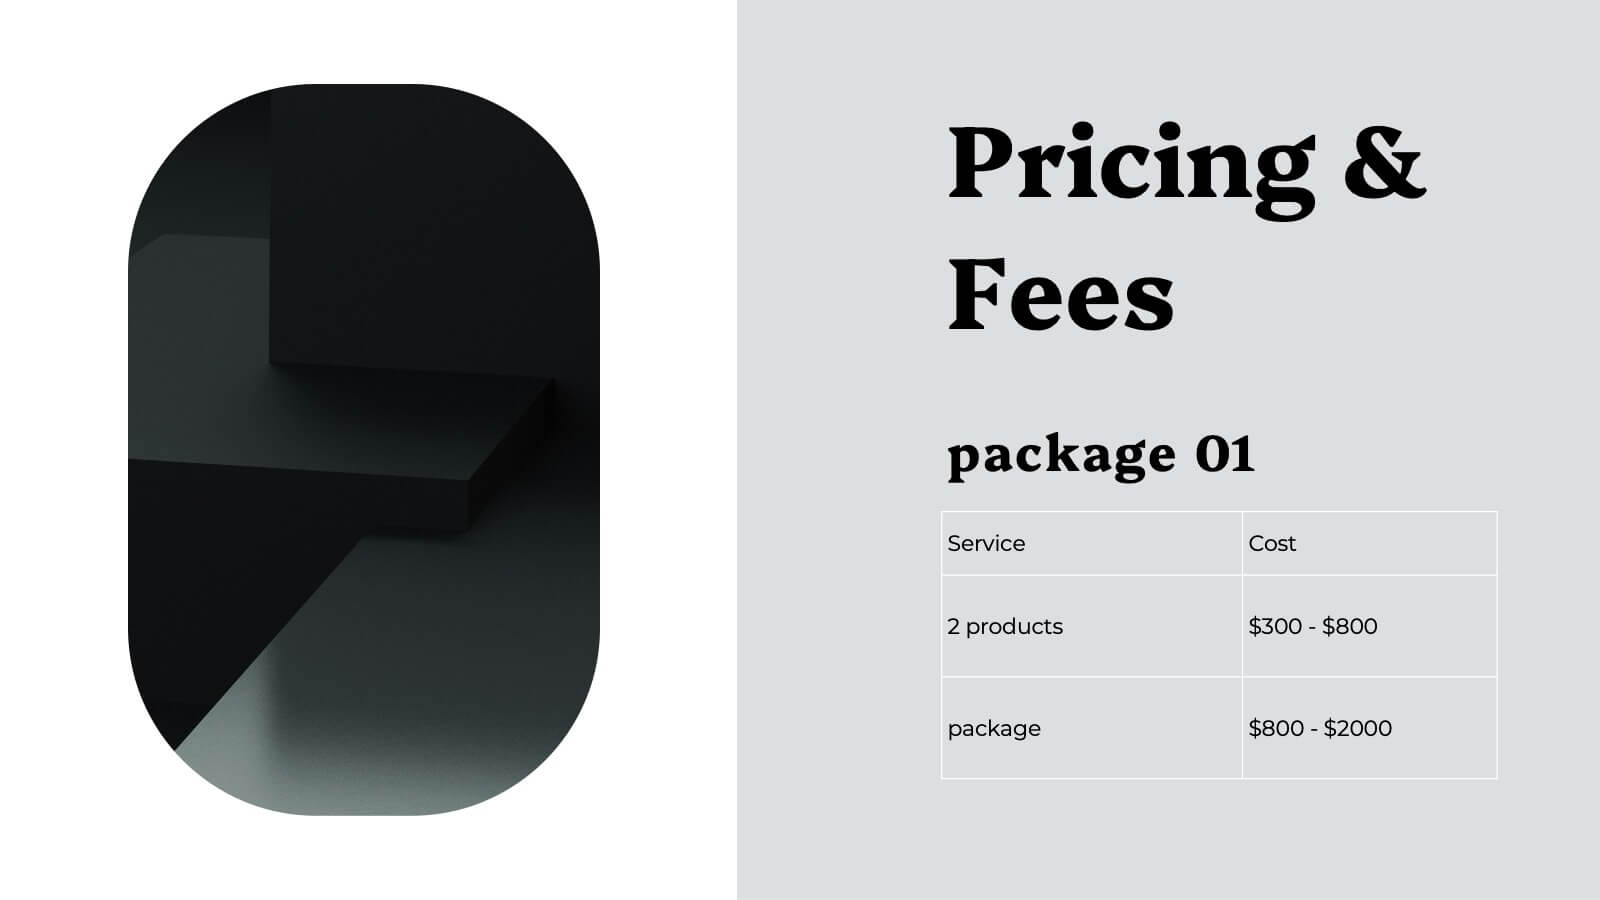
Arcadian Photography Portfolio Template Presentation
Showcase your best work with this sleek and stylish photography portfolio presentation template! It’s perfect for presenting your featured projects, creative process, and client testimonials in a visually stunning way. This template is fully customizable and offers a professional touch to your portfolio, making it ideal for both personal and client presentations. Compatible with PowerPoint, Keynote, and Google Slides.


7 diapositivas
Team Leadership and Management Presentation
Unlock the secrets of effective team leadership and management with our detailed presentation template. Designed for training sessions and workshops, it provides clear guidance on key leadership principles and team management tactics through engaging graphics and strategic layouts. Ideal for enhancing team dynamics and leadership skills.


5 diapositivas
Strategic Framework Slide Presentation
Turn your strategy into a story that flows with clarity and precision using this clean, timeline-based presentation design. Ideal for illustrating project phases, corporate planning, or growth roadmaps, it keeps information structured and engaging. Fully editable and compatible with PowerPoint, Keynote, and Google Slides for seamless customization.


6 diapositivas
Actionable Steps with Visual Checklist Presentation
Simplify complex processes with the Actionable Steps with Visual Checklist Presentation. This engaging layout uses a curved flow and bold circular icons to represent each step in a clear, logical sequence. Ideal for outlining strategic plans, onboarding procedures, or milestone-driven workflows. With five customizable steps and tick-mark visuals, it's easy to showcase completed and pending tasks. Fully compatible with PowerPoint, Keynote, and Google Slides—great for any team-driven or instructional presentation.