


Características


¿Tienes alguna pregunta?
Recomendar


7 diapositivas
Work From Home Infographic Presentation Template
A Work From Home Infographic is a visual representation of data related to working from home. This infographic can be used as a guide to get you through some of the best opportunities available. Use this template to get the necessary tools to start working from home. Use this infographic to show your audience how many people work from home by adding statistics, tips and interesting facts. This template is designed to effectively communicate complex information in a simple format, making it great for exploring the topic of working from home. This is a perfect way to promote your business!


6 diapositivas
Organizational Goals and SMART Objectives Presentation
Align your business vision with clarity using this Organizational Goals and SMART Objectives slide. Designed to visually represent each SMART component—Specific, Measurable, Achievable, Relevant, and Time-bound—it helps communicate strategic goals in a simple and effective format. Fully editable in Canva, PowerPoint, and Google Slides for maximum flexibility.


5 diapositivas
Business Annual Report Summary Presentation
Clear, Concise, and Impactful! The Business Annual Report Summary Presentation template helps you present key performance indicators, financial metrics, and company growth in a professional and visually engaging way. Fully customizable and compatible with PowerPoint, Keynote, and Google Slides, it’s ideal for executives and analysts aiming for a compelling data-driven presentation.


4 diapositivas
Corporate Growth and Strategy Map Presentation
Visualize your business development path with this layered strategy map. Ideal for showcasing organizational goals, strategic initiatives, and cascading growth stages. Each level is clearly structured for easy customization, making it perfect for leadership planning, corporate roadmaps, or strategic reviews in PowerPoint, Keynote, or Google Slides.


21 diapositivas
Fablelight Digital Agency Strategy Plan Presentation
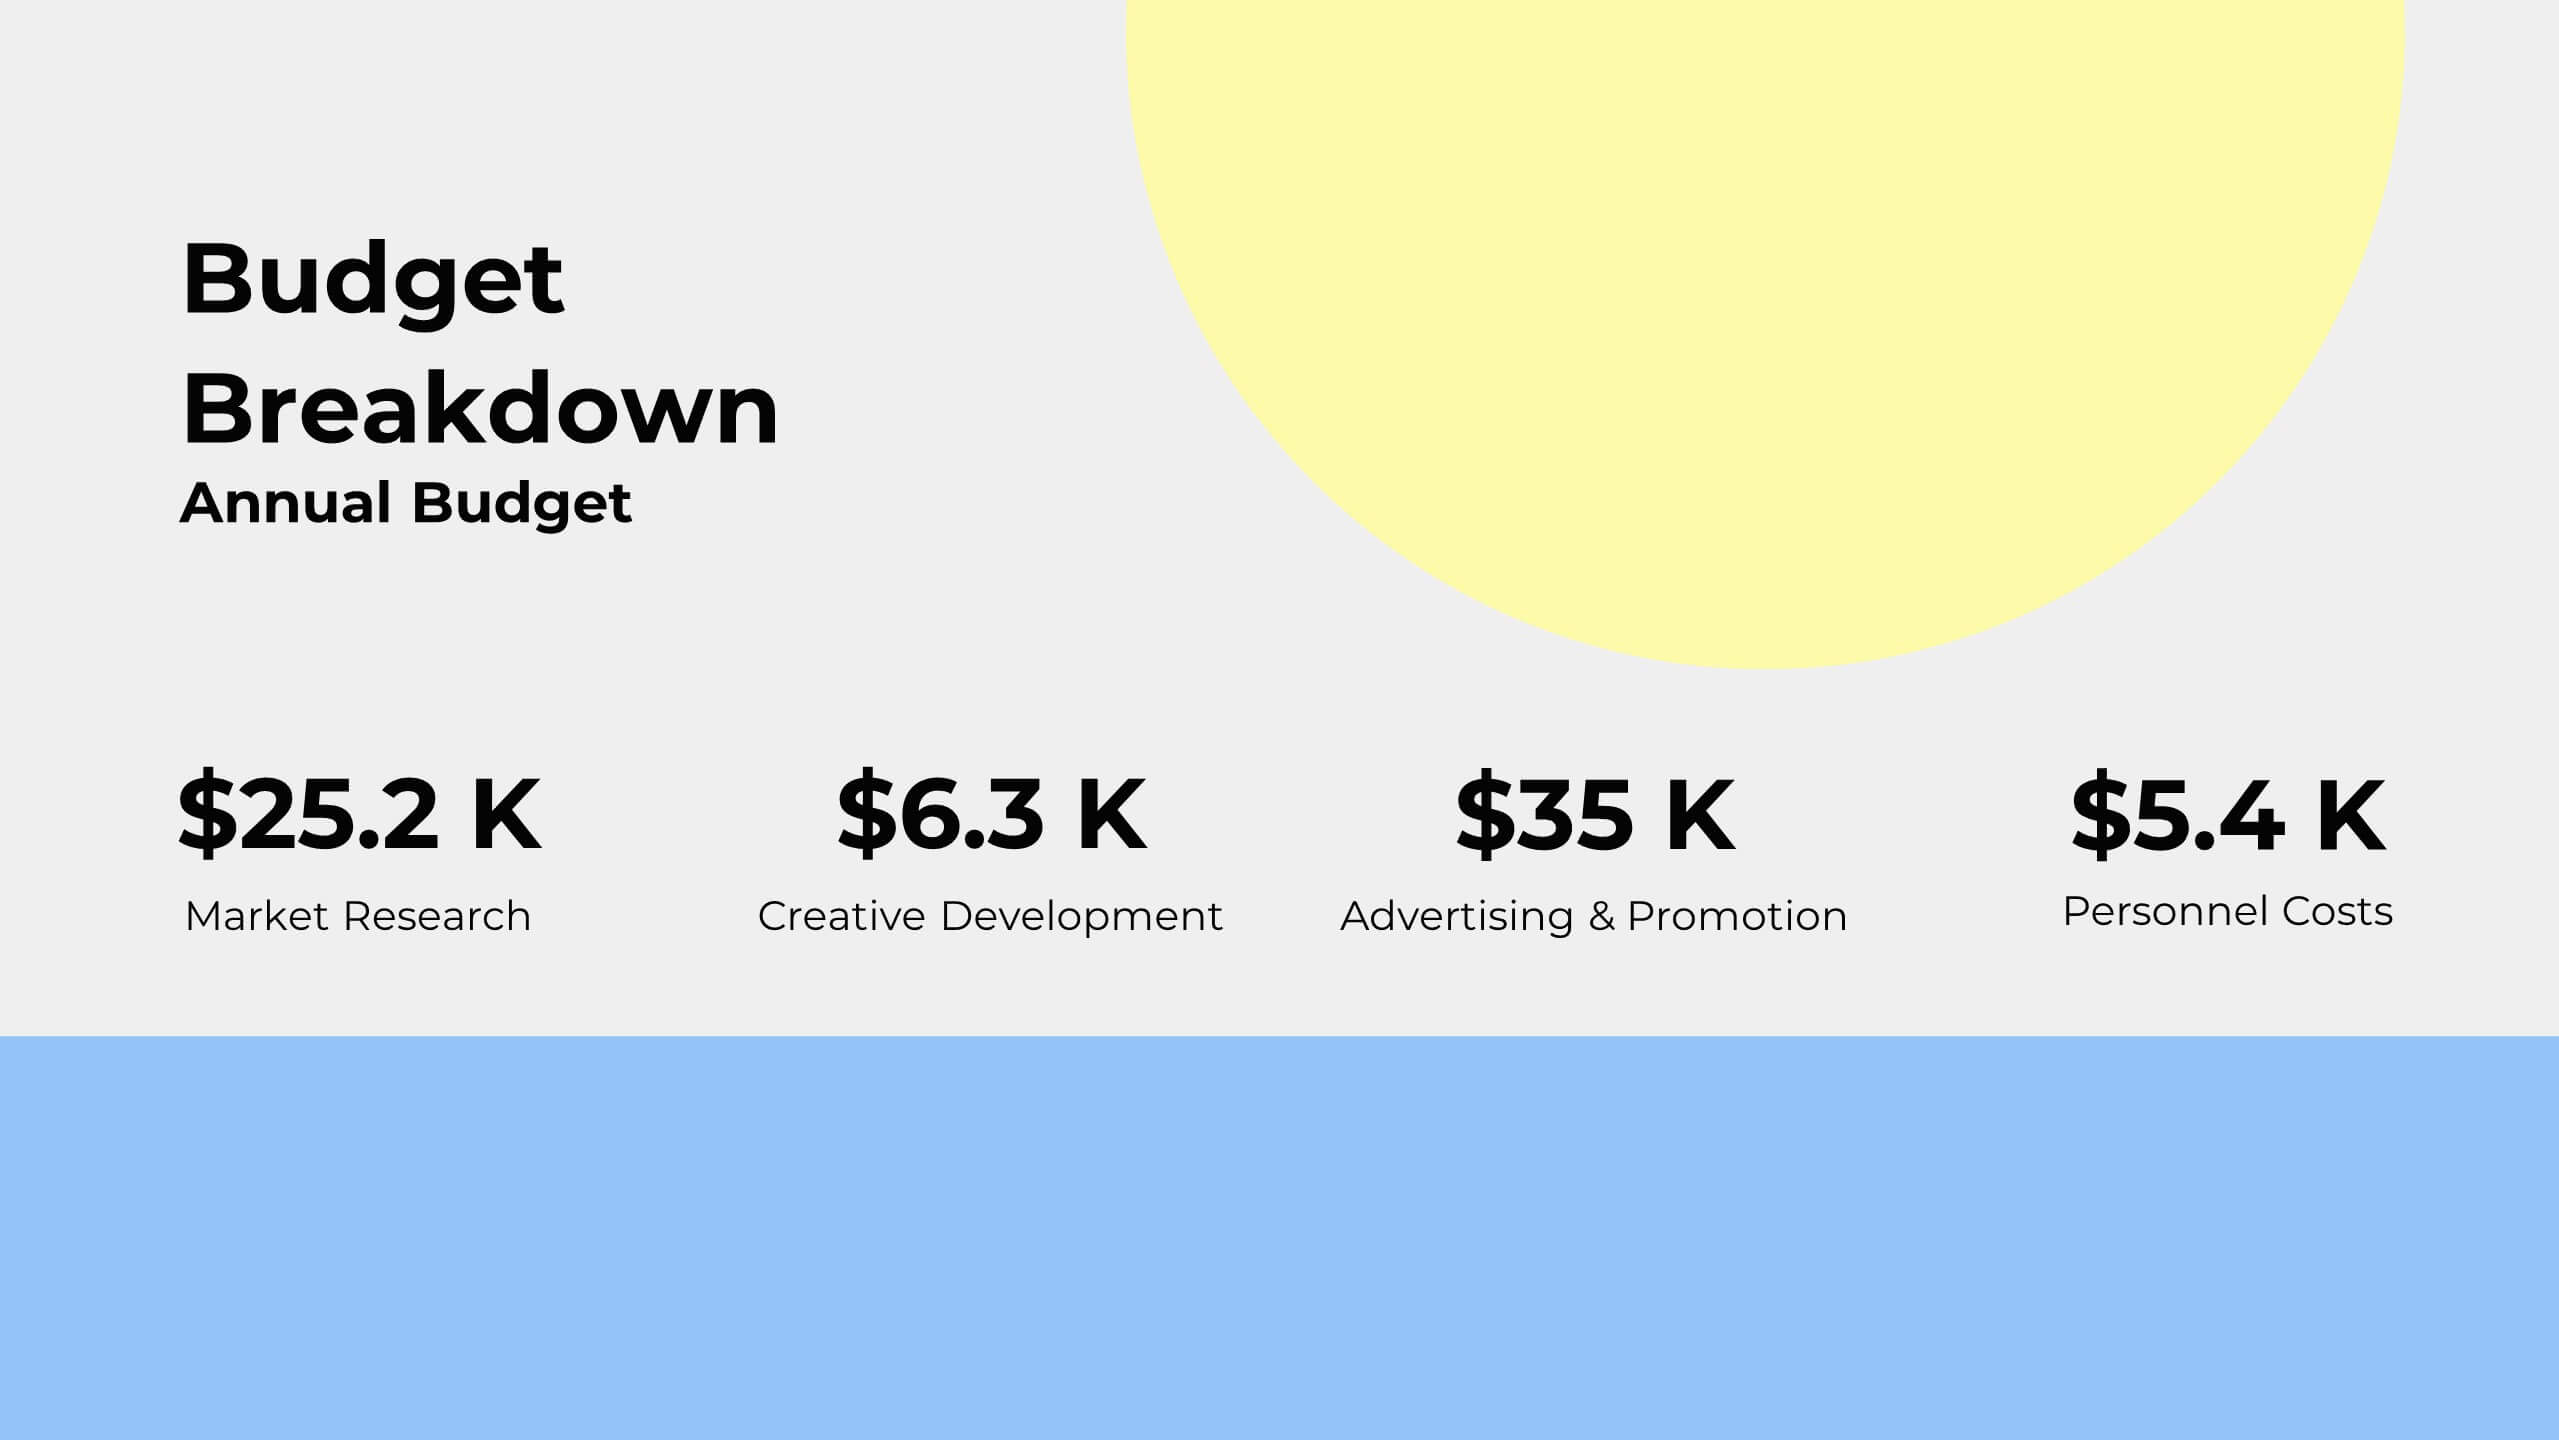
This sleek and modern presentation template is designed to effectively communicate a strategic plan for any professional agency. It includes sections for mission and vision, team structure, services offered, and a detailed creative process. Dive into market analysis, industry trends, and case studies to showcase expertise and success stories. Strategy development, campaign execution, and measurement analytics are highlighted to demonstrate goal-oriented planning. Client testimonials, partnerships, social impact initiatives, and awards provide credibility and enhance trust. Fully customizable and compatible with PowerPoint, Keynote, and Google Slides.


21 diapositivas
Whisperleaf Startup Strategy Presentation
This vibrant startup strategy template sets the stage for success with structured content and bold design. Highlight your mission, vision, product overview, and competitive landscape all in one place. Perfect for conveying business models, market insights, and growth strategies with clarity. Editable in PowerPoint, Keynote, and Google Slides for ultimate flexibility.


21 diapositivas
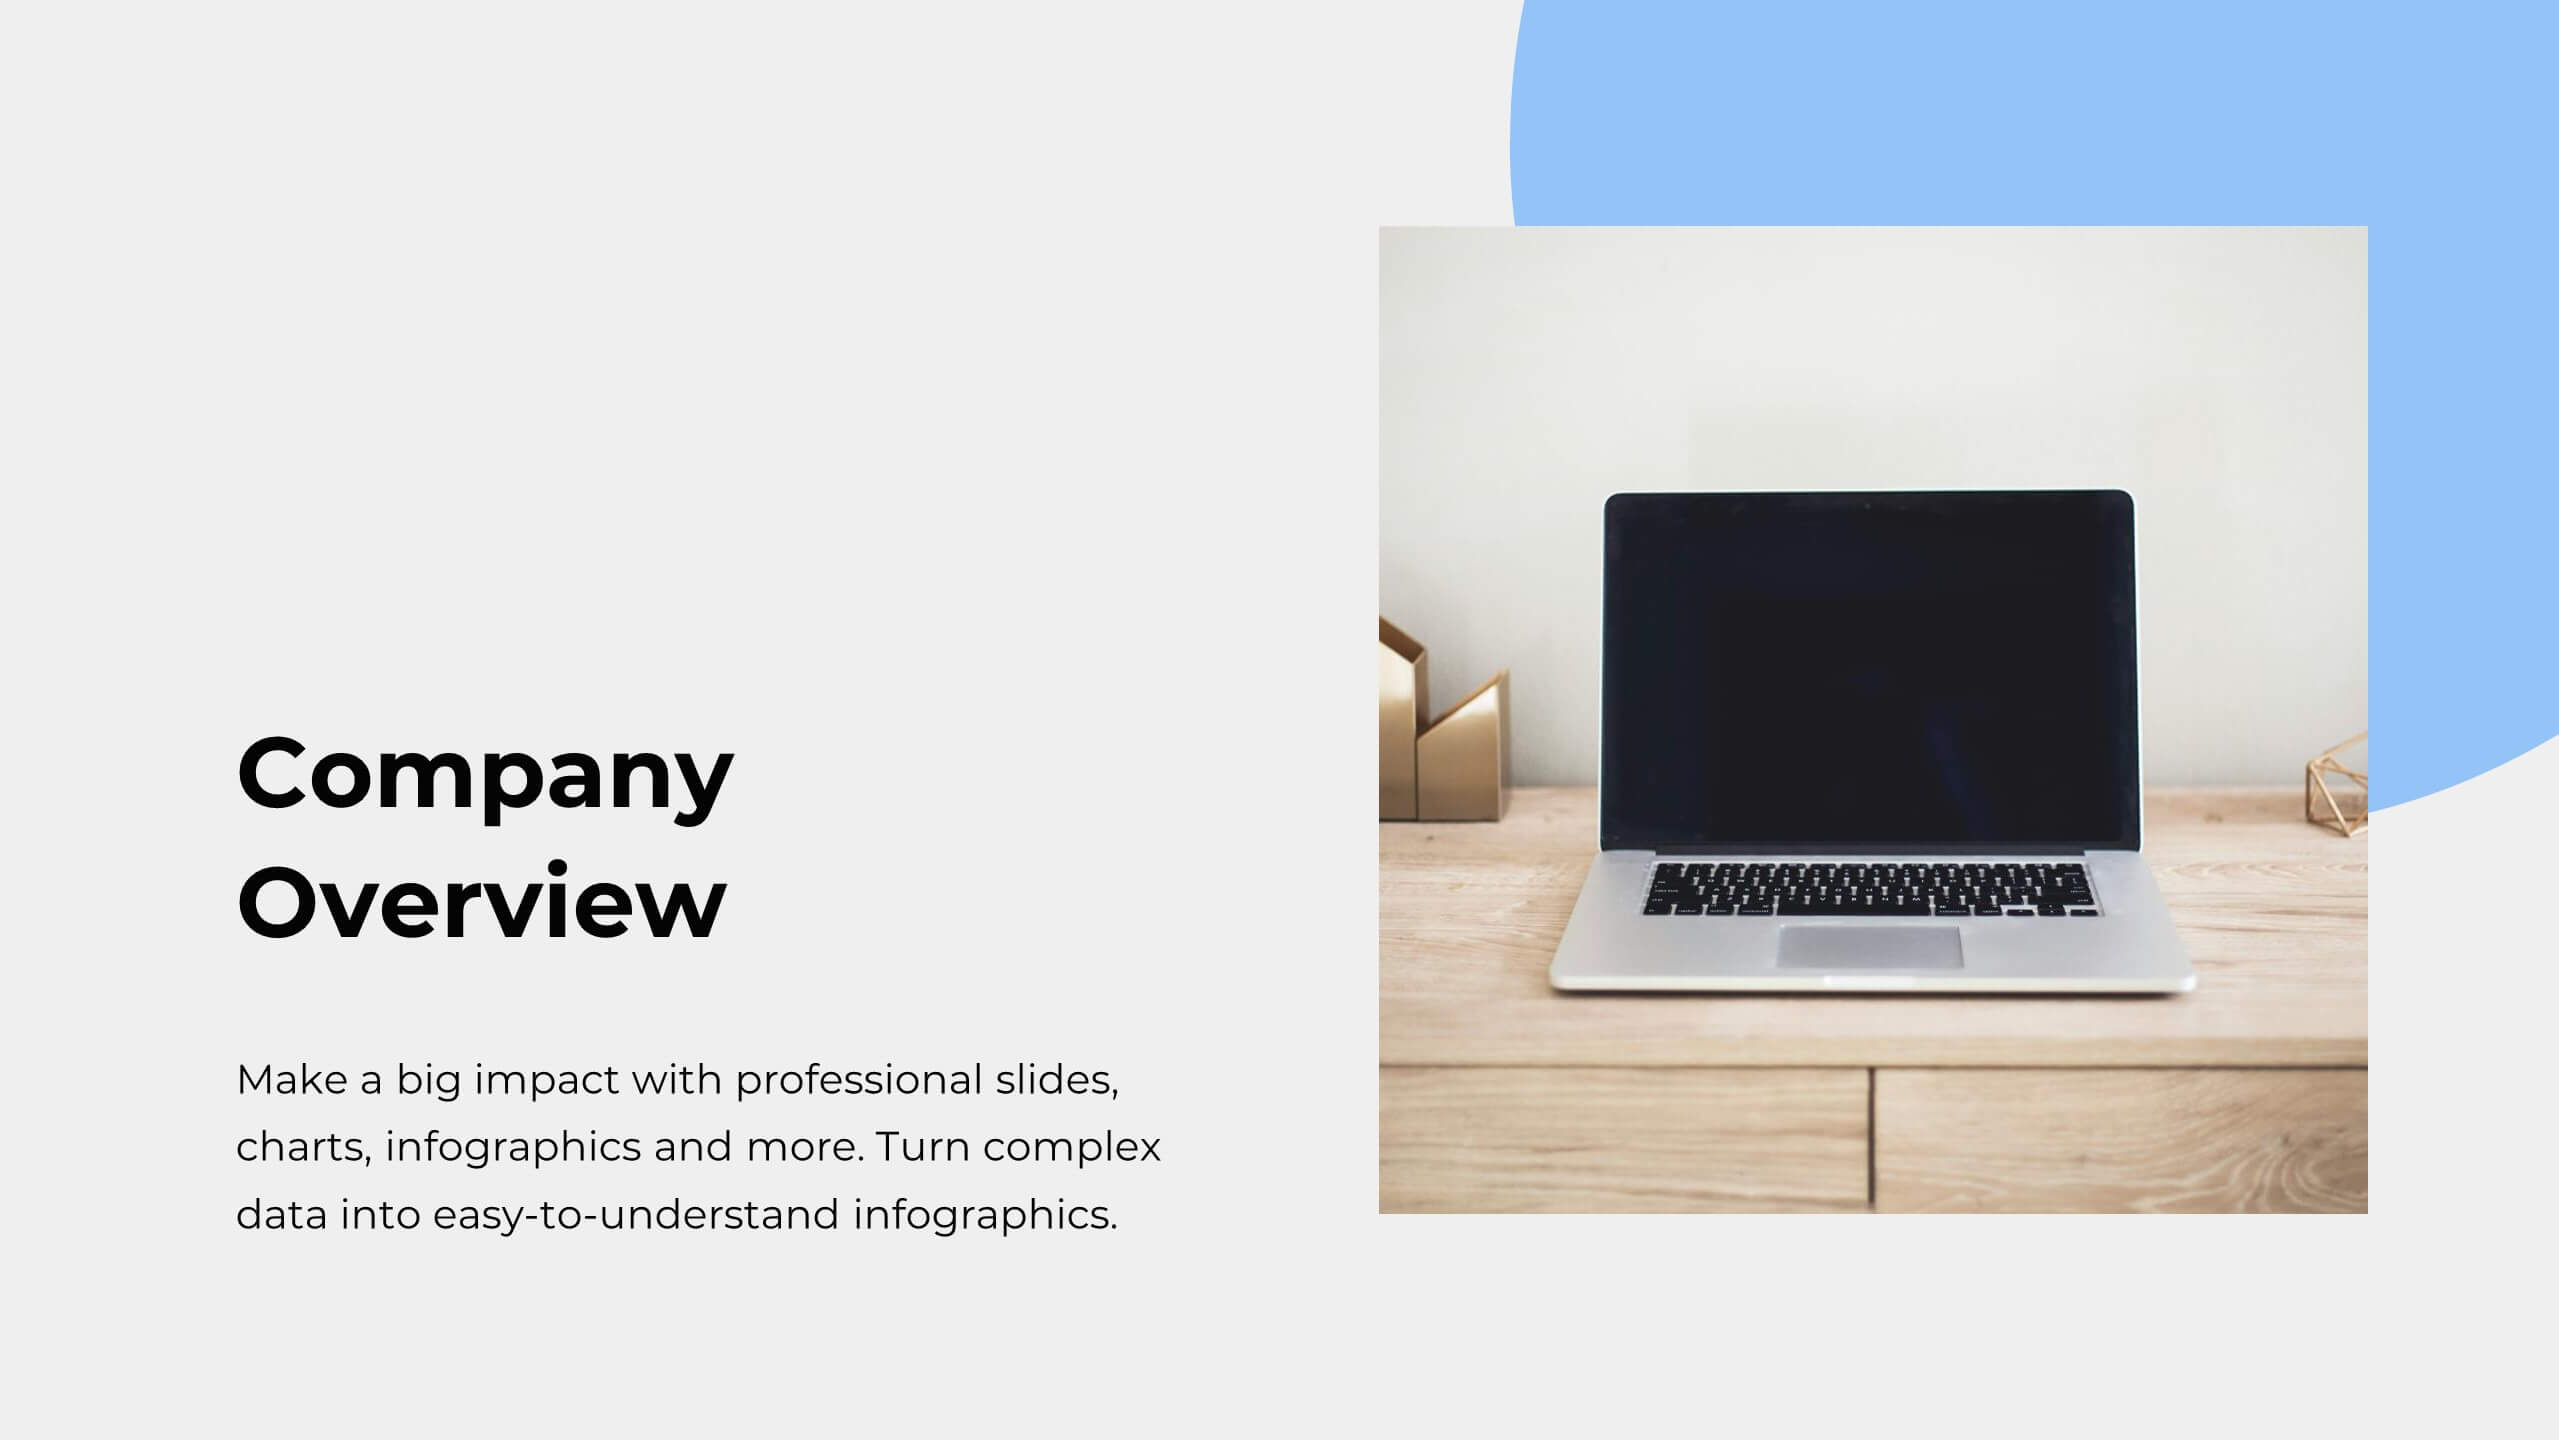
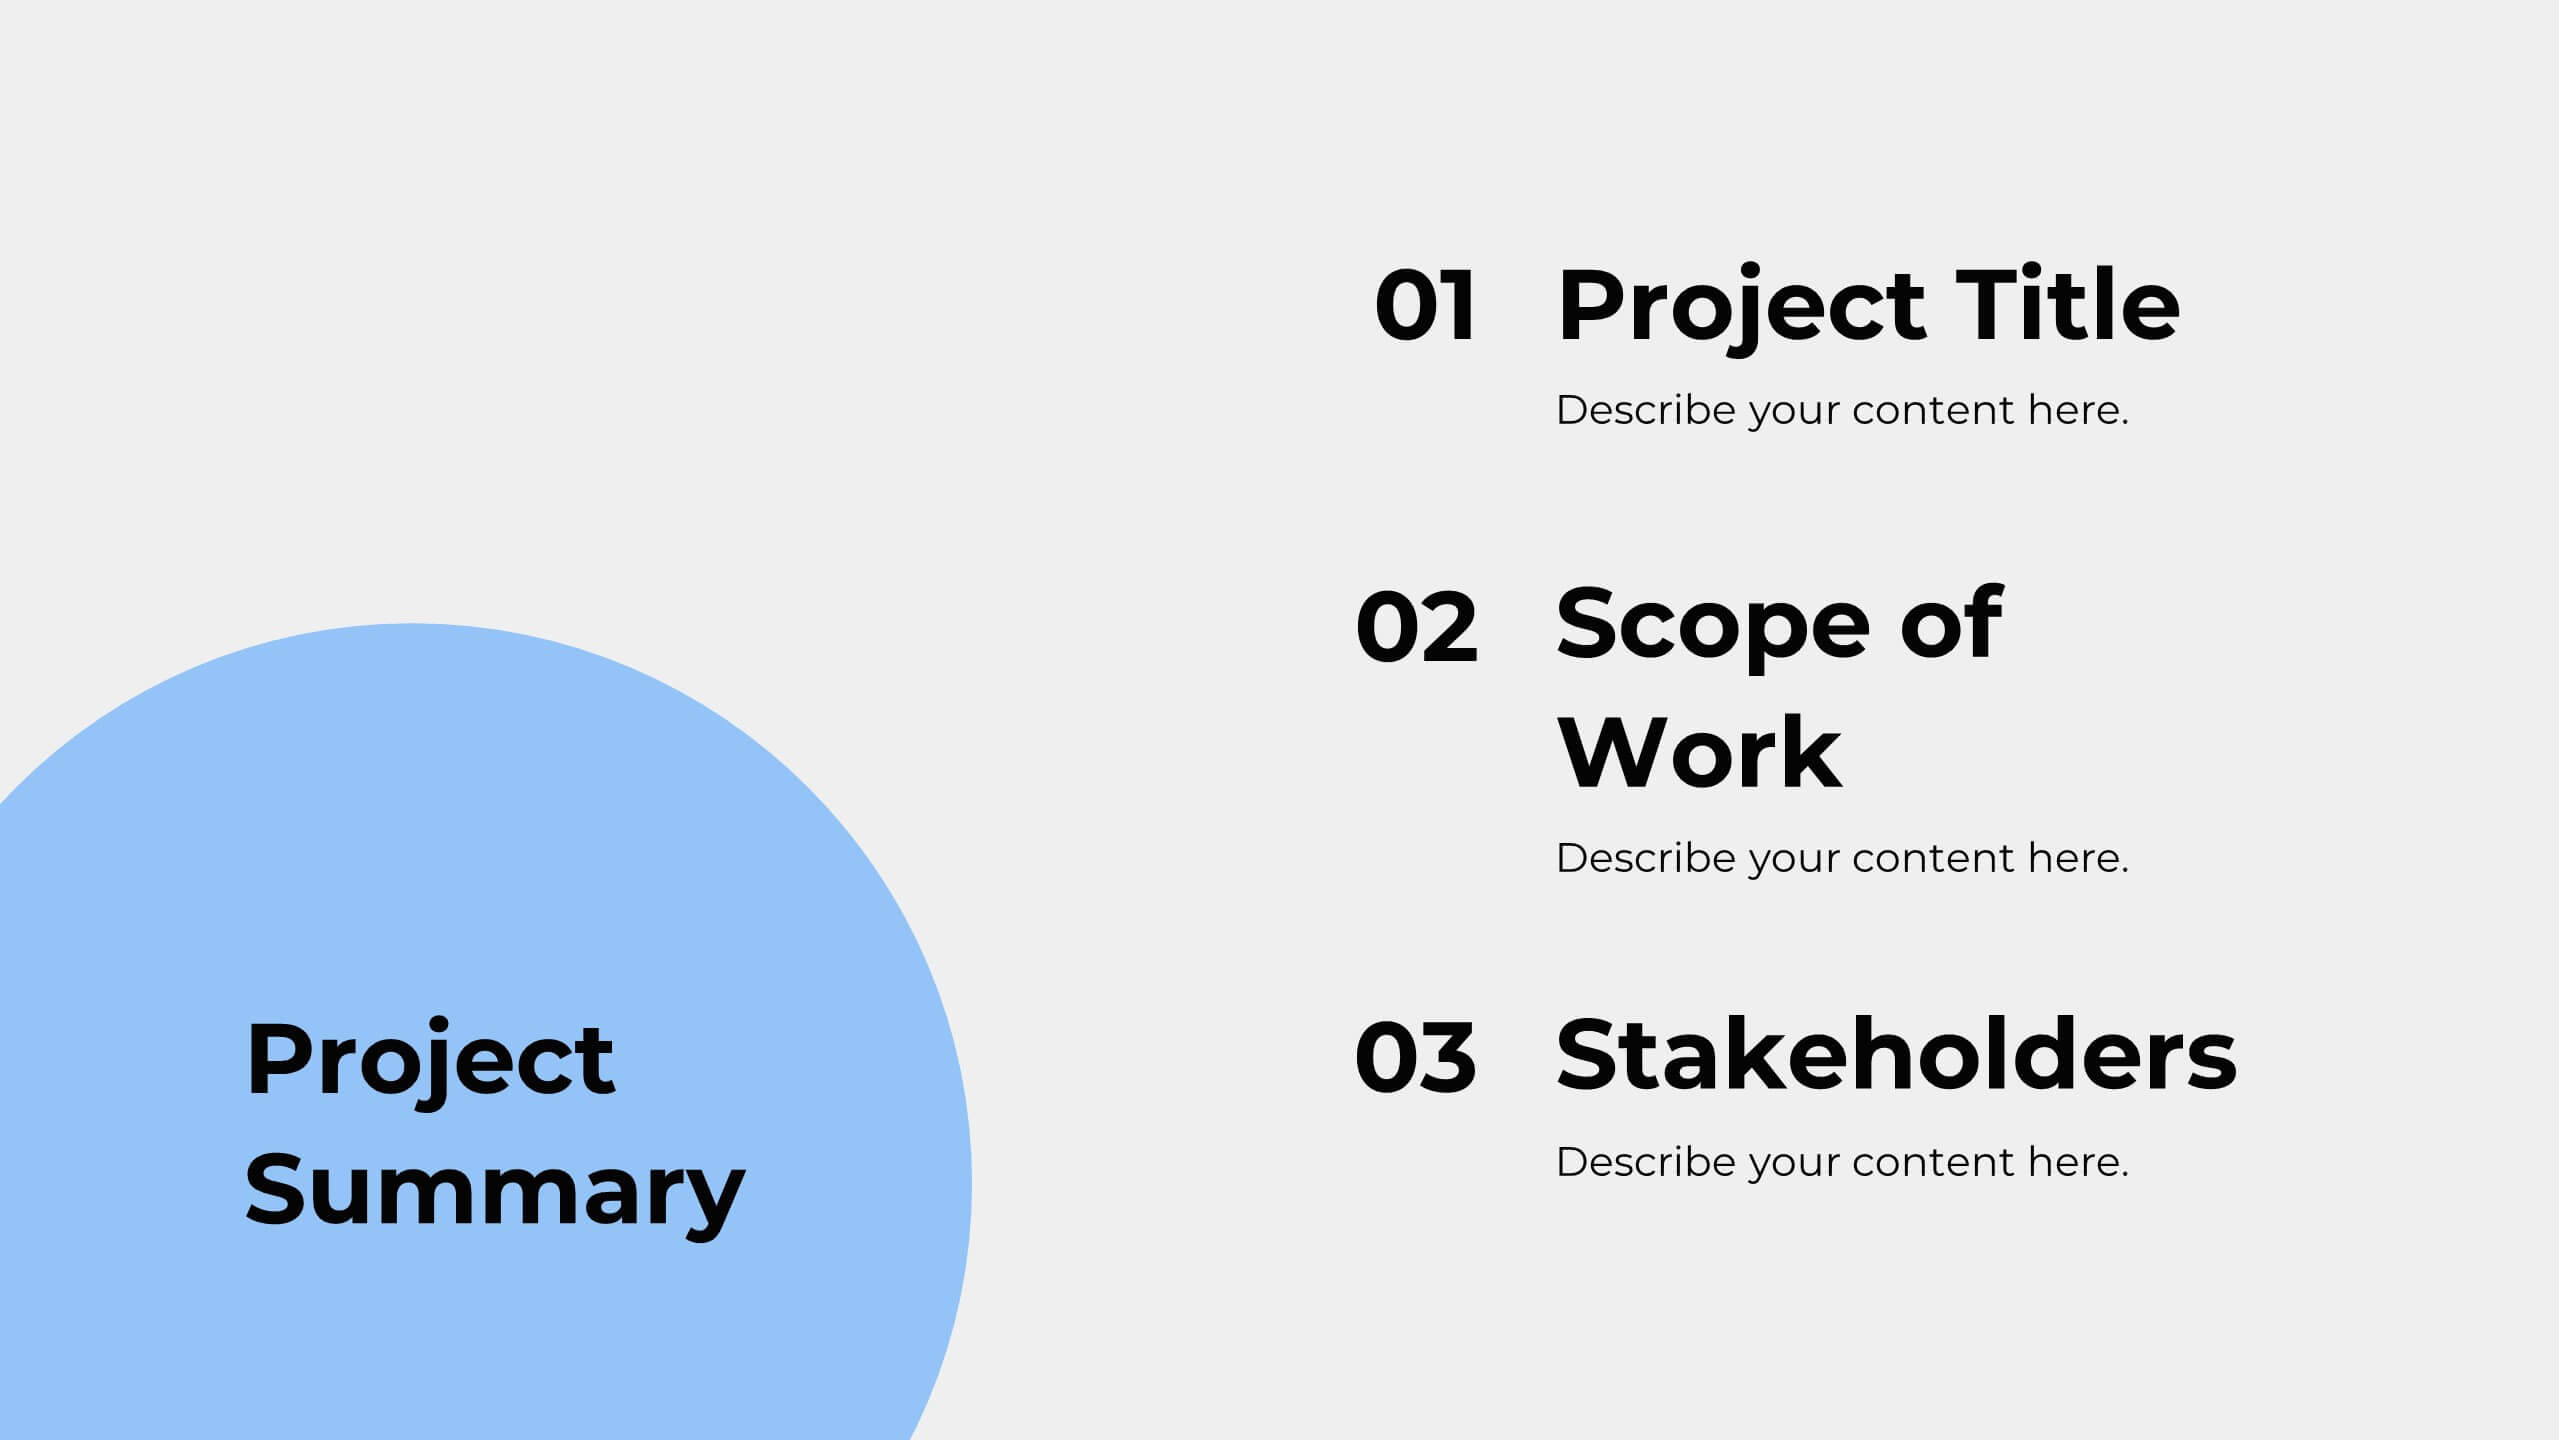
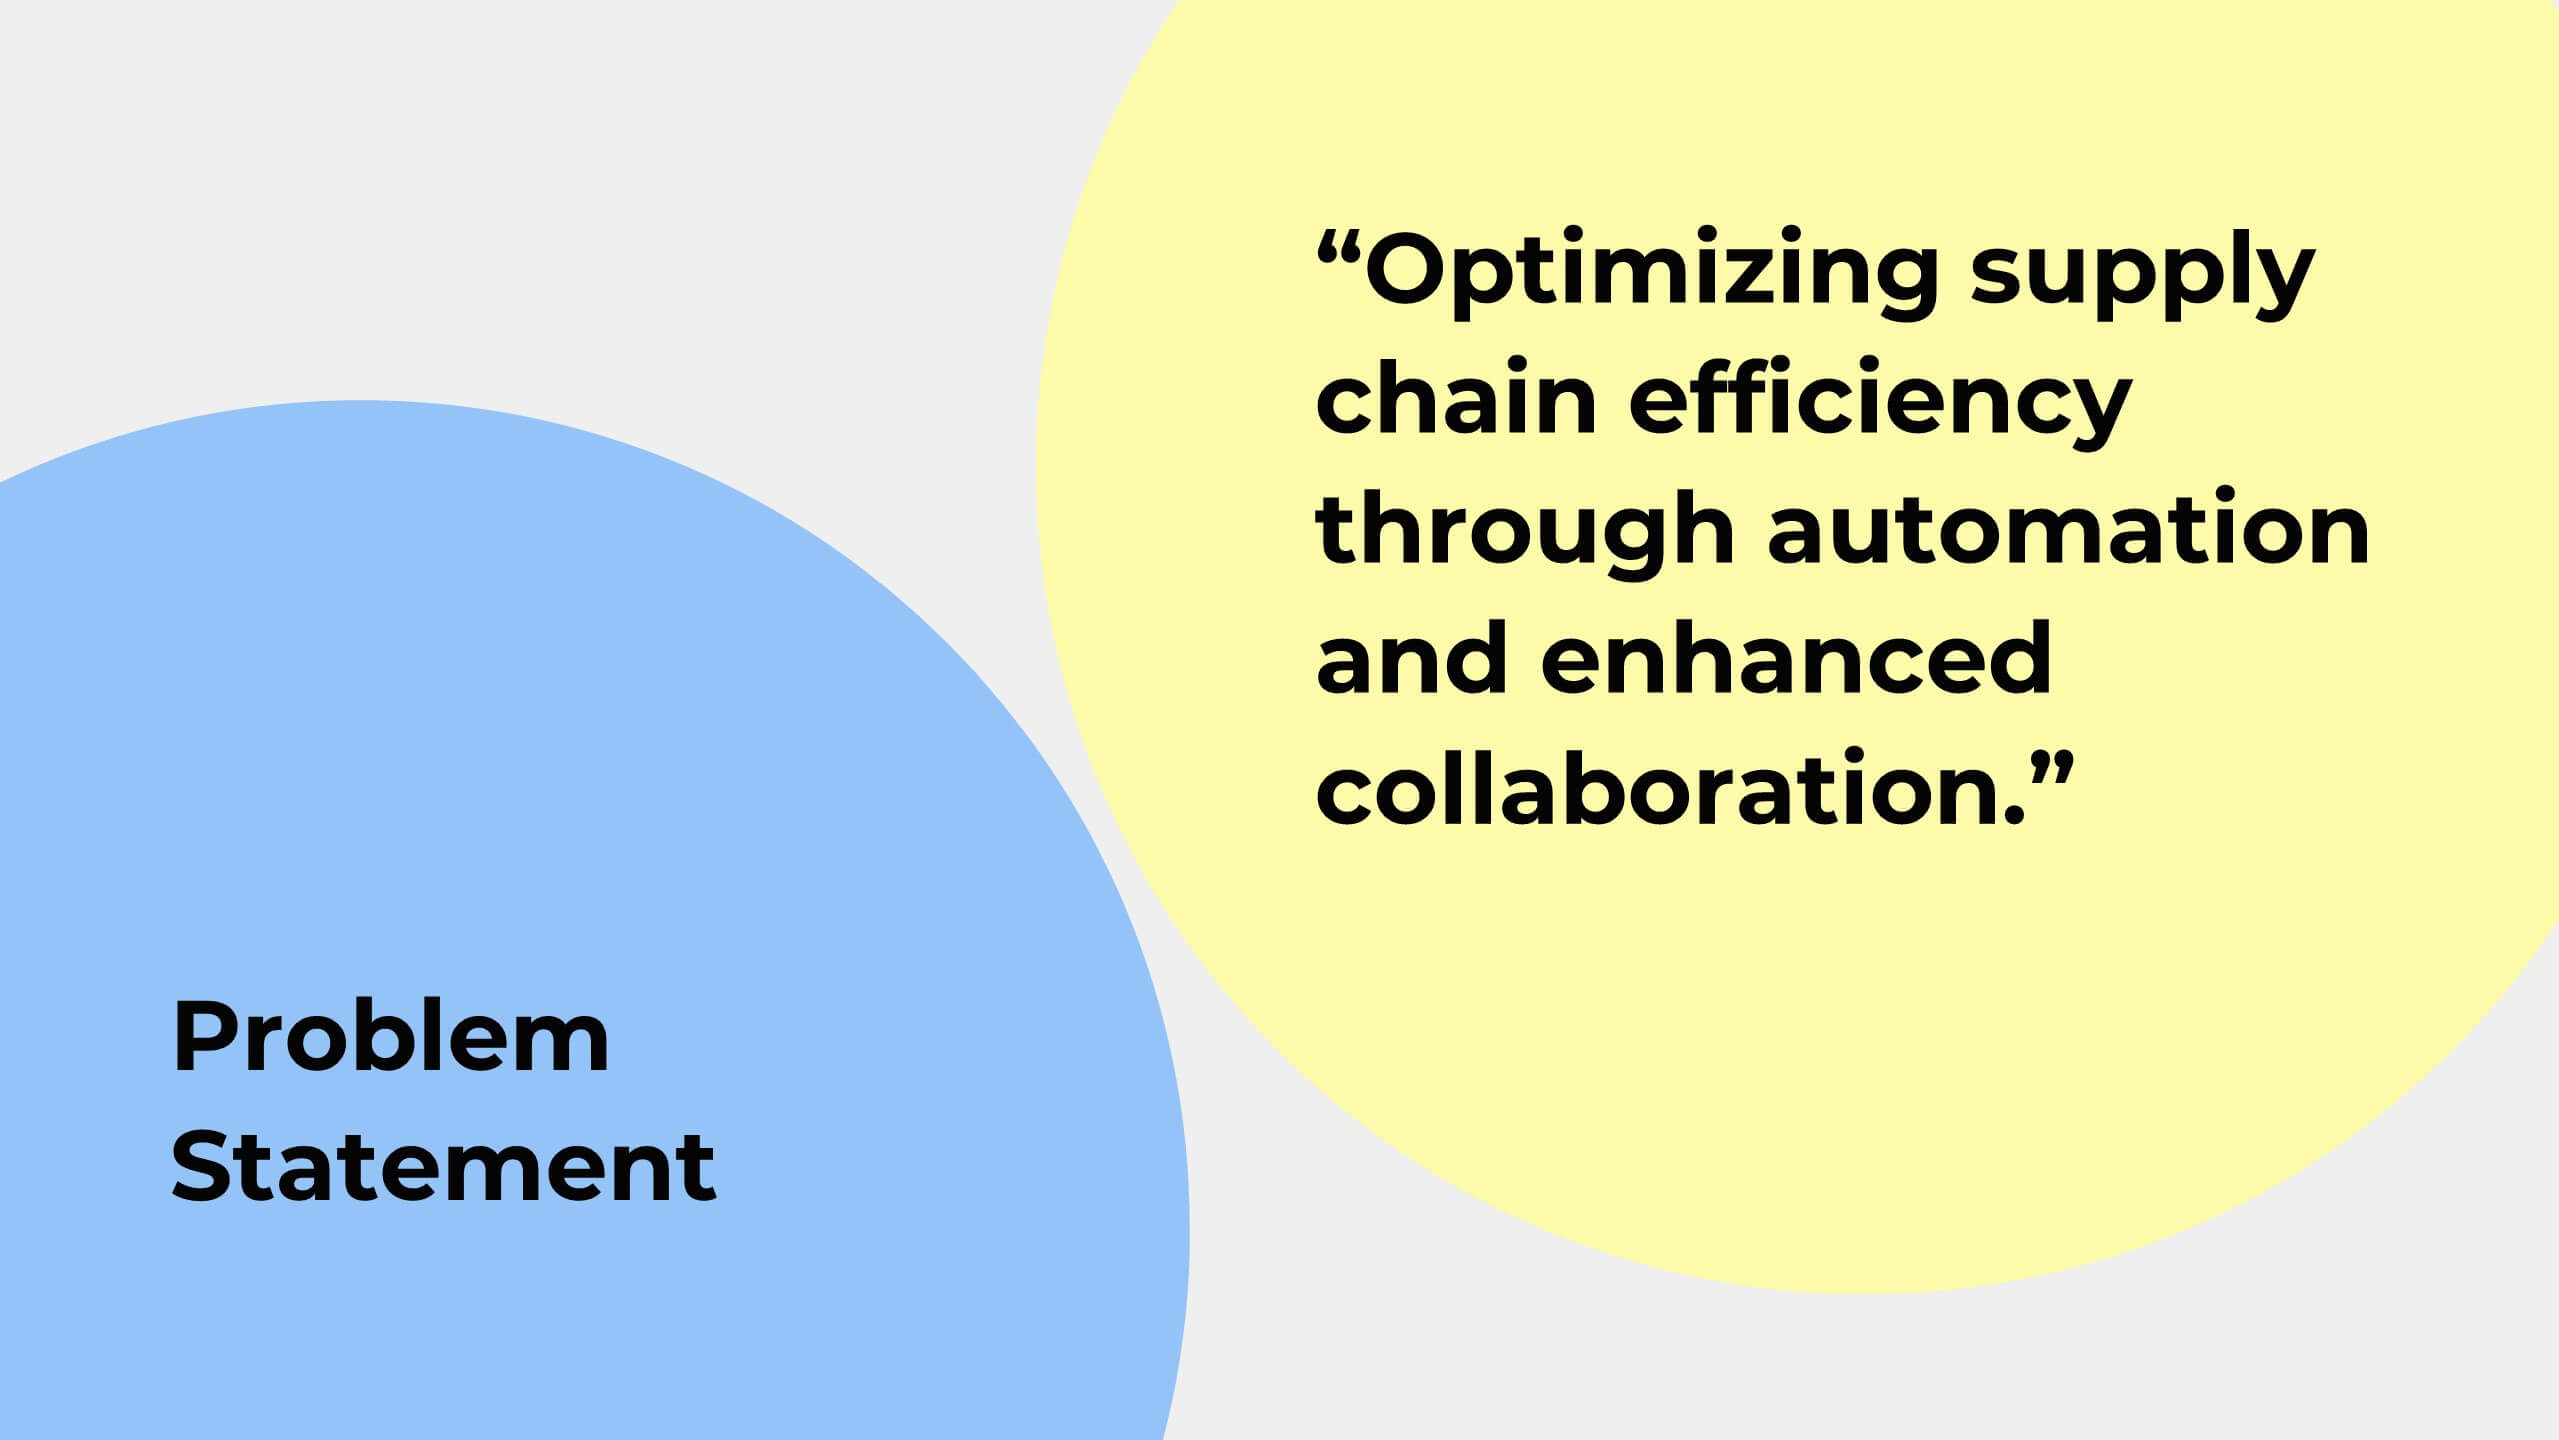
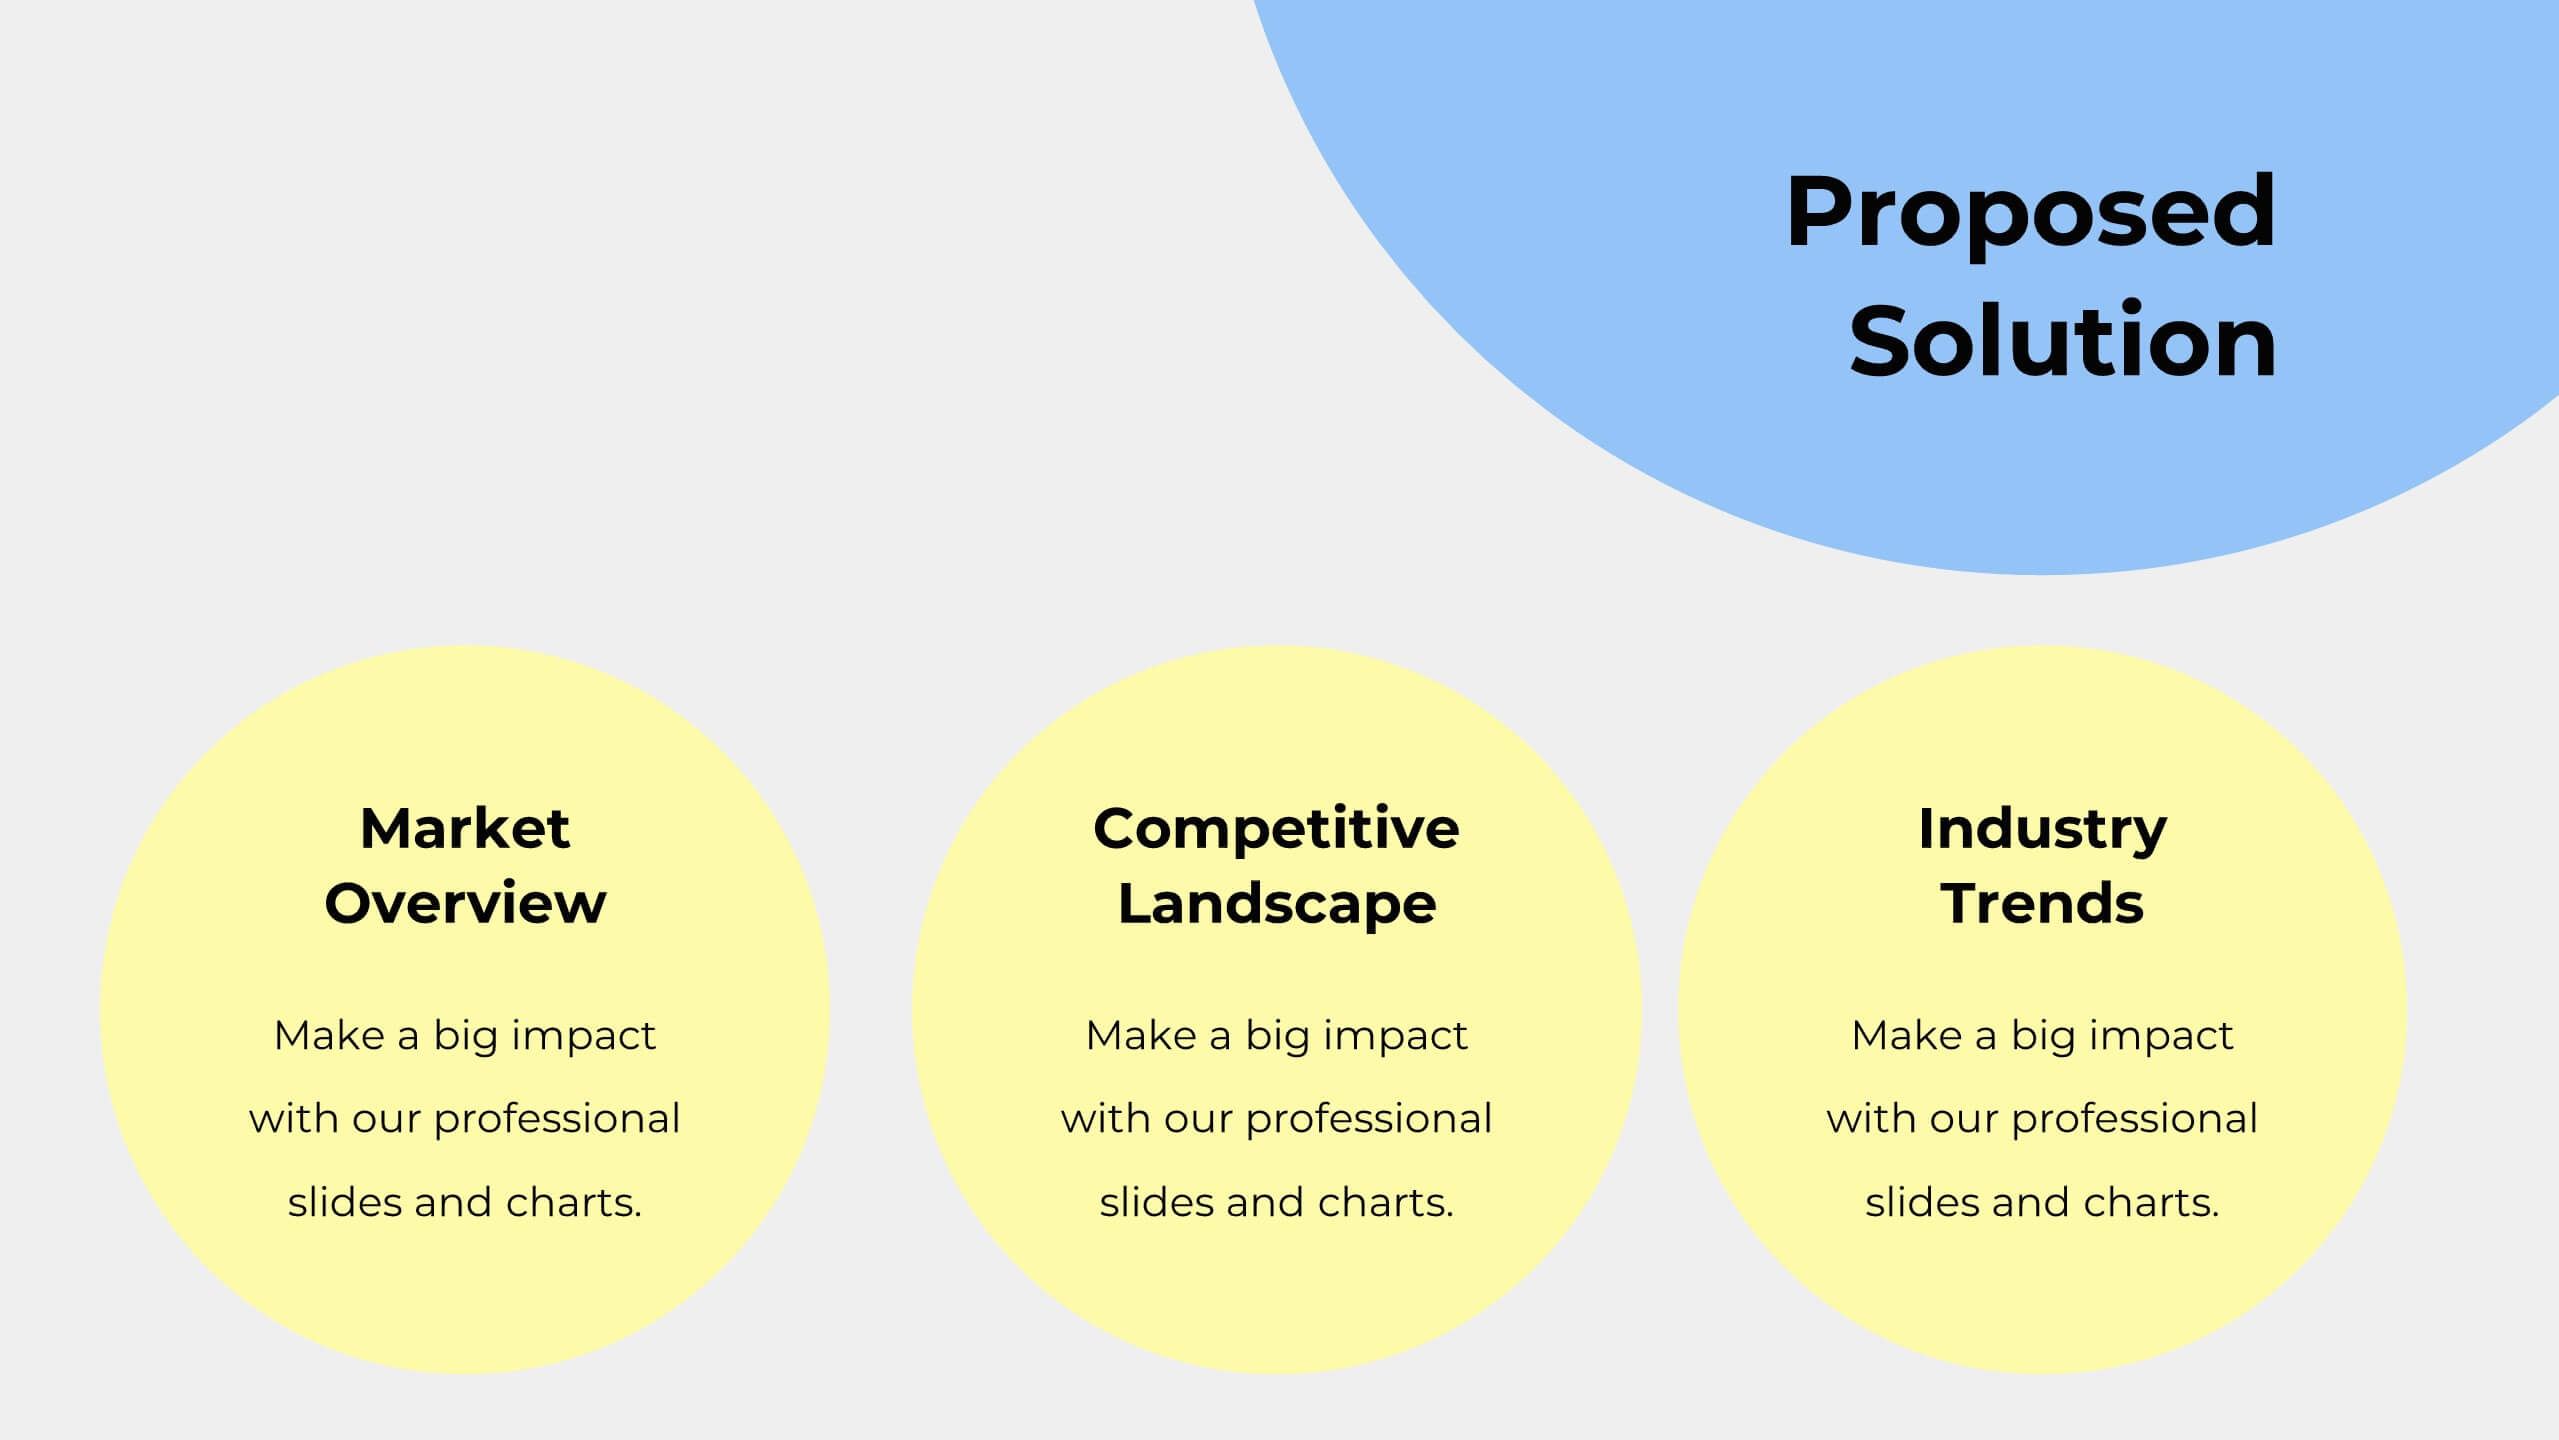
Flare Project Management Plan Presentation
Unleash the full potential of your projects with a dynamic plan template that makes every detail shine! This vibrant and clear design is built to guide your team and stakeholders through every phase of your project with confidence and clarity. Starting with a compelling introduction and project overview, this template captures attention and sets the stage for success. Dive deep into problem statements, objectives, and the scope of work, all presented in a visually appealing and easy-to-digest format. With sections dedicated to timelines, milestones, budget breakdowns, and resource allocation, this template ensures every aspect of your project is meticulously planned and communicated. The inclusion of stakeholder analysis, risk management, and quality assurance plans showcases your thorough approach to project management. Perfectly compatible with PowerPoint, Keynote, and Google Slides, this template is your go-to tool for creating project plans that are both inspiring and effective. Get ready to impress and lead your projects to success!


5 diapositivas
Smart Agriculture and Sustainability Trends
Highlight the future of farming with the Smart Agriculture and Sustainability Trends Presentation. This slide features a sleek visual progression of plant growth stages, symbolizing innovation, eco-conscious development, and data-driven agricultural trends. Ideal for sustainability reports, agritech proposals, and environmental briefings. Fully editable and compatible with PowerPoint, Keynote, and Google Slides.


6 diapositivas
Airline Business Strategy and Trends Presentation
Navigate your industry insights with clarity using this sleek aviation-themed slide. Perfect for showcasing five core data points or trends, each positioned along a stylized airplane graphic. This layout is ideal for airline professionals, aerospace consultants, and logistics analysts. Fully customizable in PowerPoint, Keynote, and Google Slides.

20 diapositivas
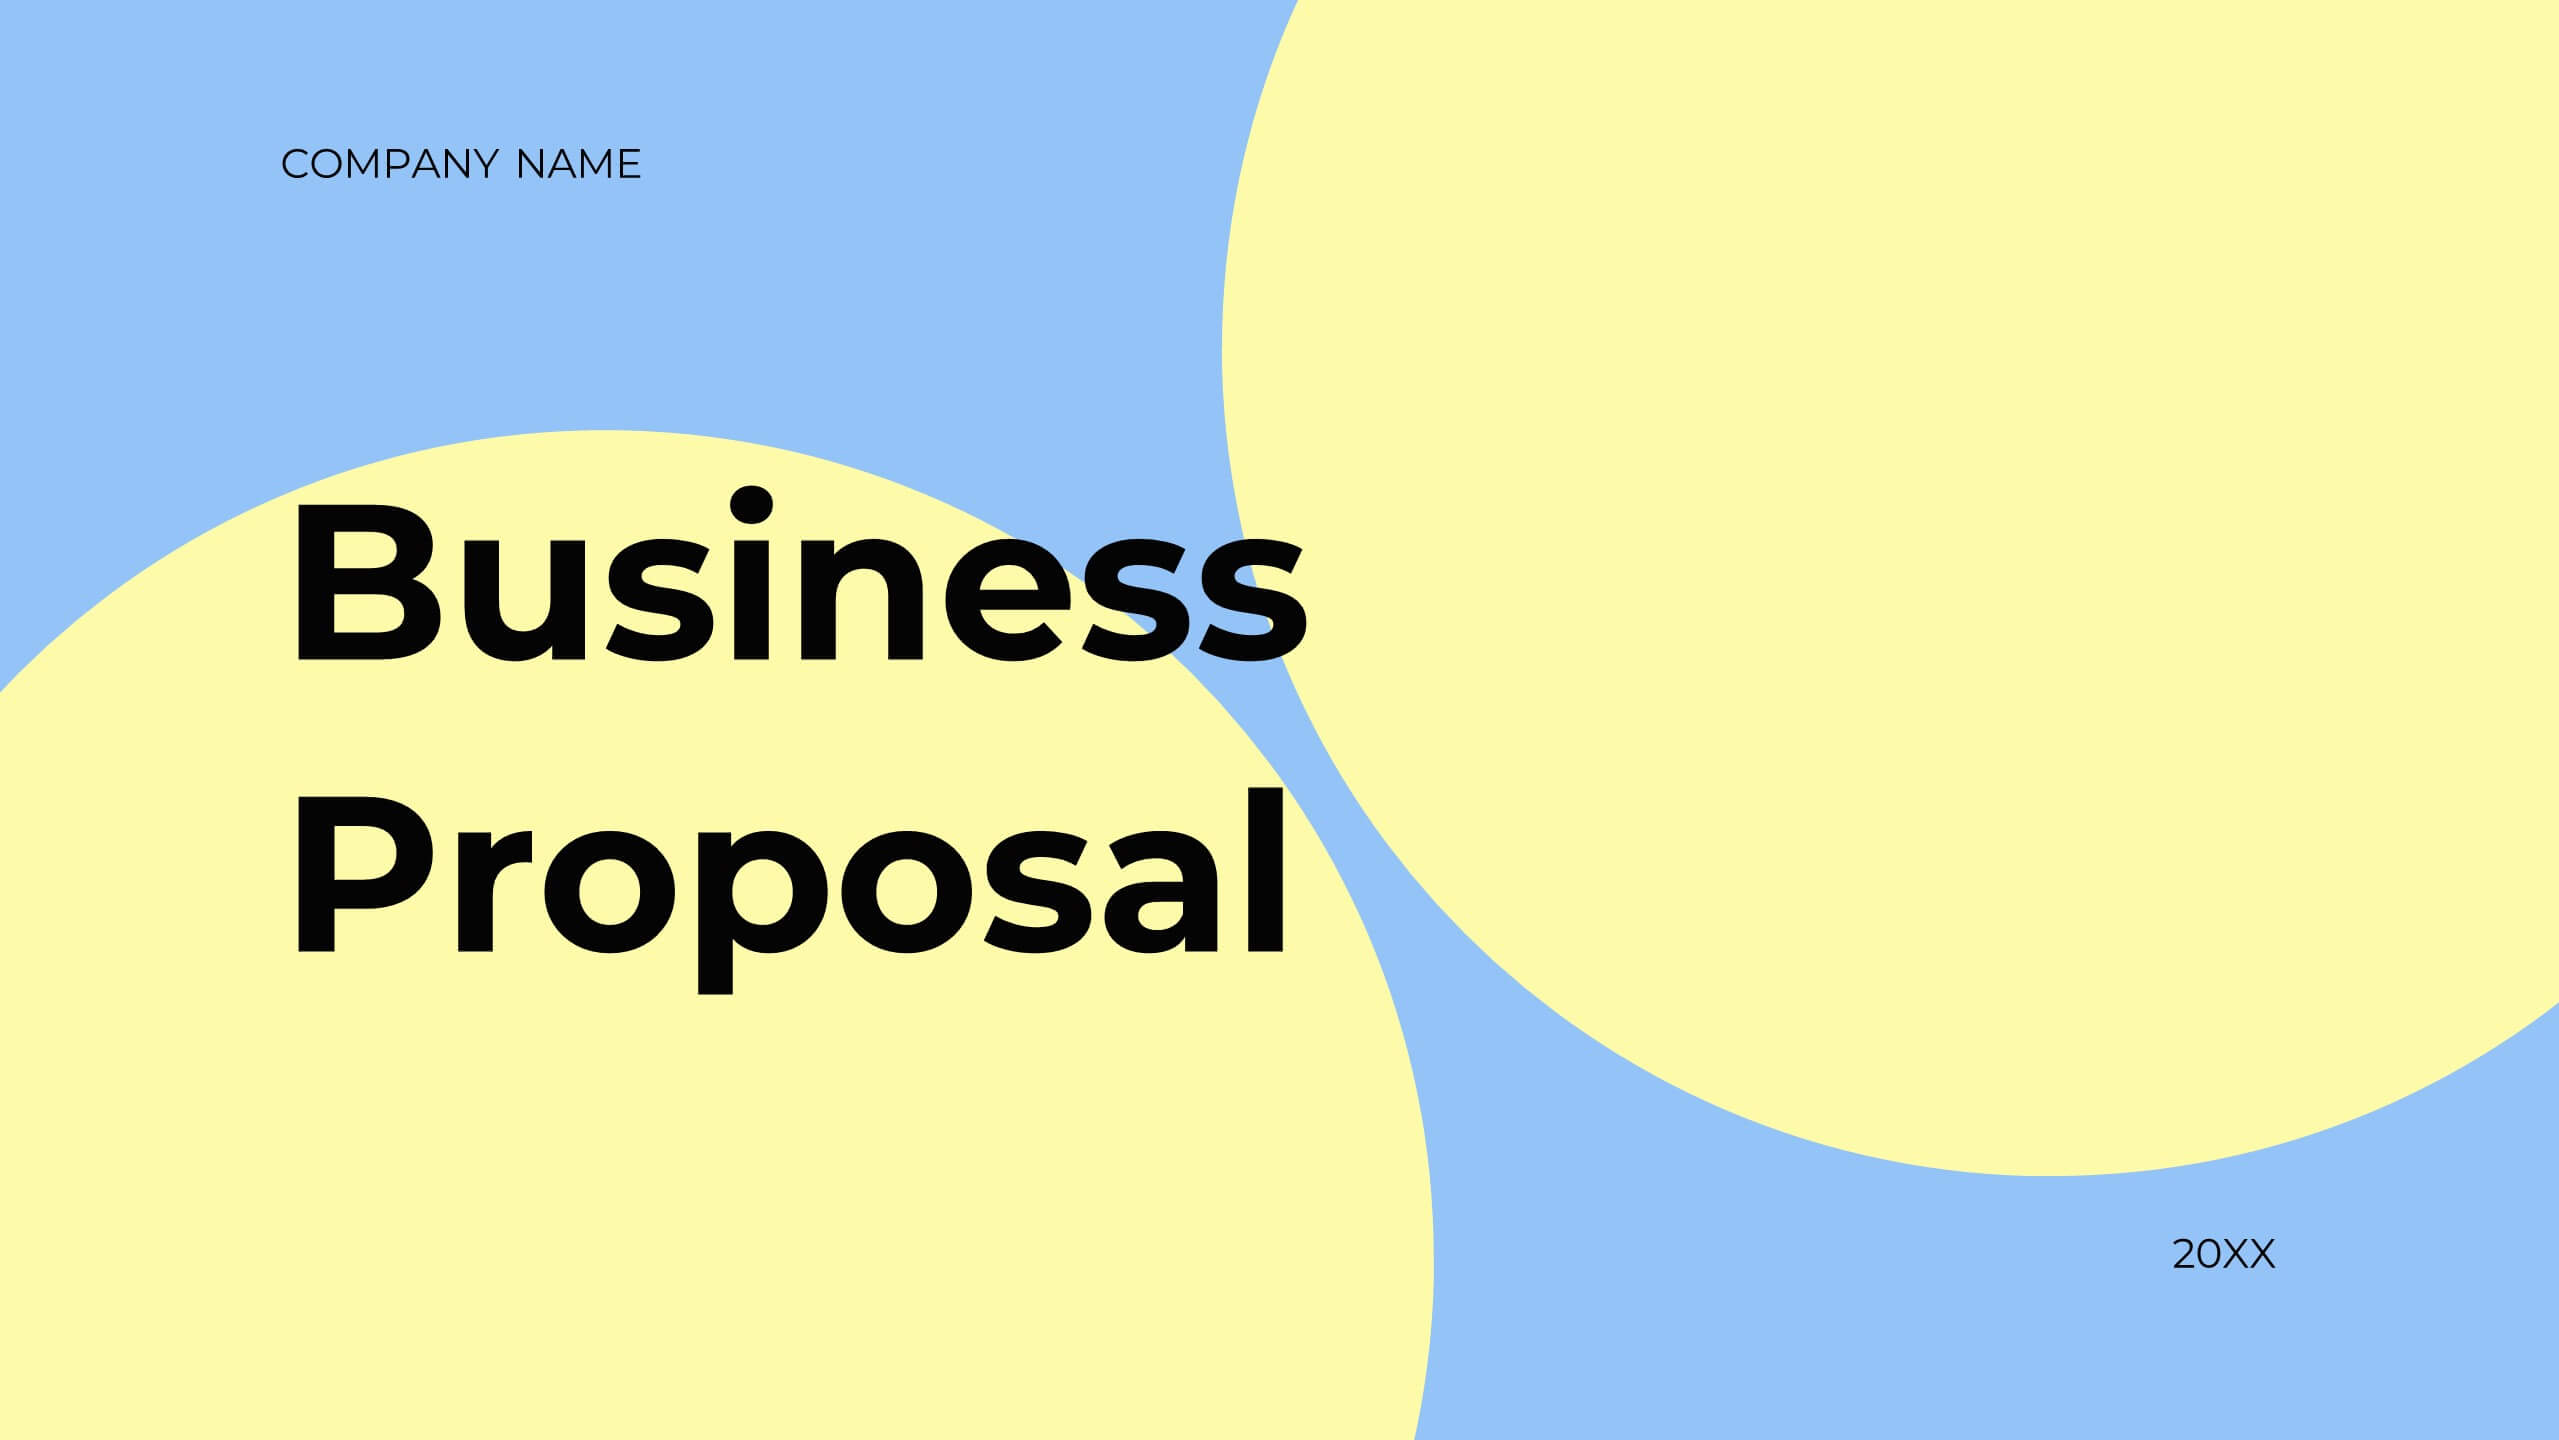
Inspire Business Proposal Presentation
Excite your audience with a compelling business proposal! This template includes sections for objectives, scope of work, timeline, budget, and more. Present your business plan clearly and effectively. Compatible with PowerPoint, Keynote, and Google Slides, it’s designed to impress stakeholders and secure approval for your project. Transform ideas into reality today!


24 diapositivas
Catalyst Strategic Planning Report Presentation
Unleash your strategic vision with the Catalyst Strategic Planning Report template! This vibrant and dynamic layout is designed to make your strategic planning presentations not only effective but also visually captivating. The template’s playful yet professional design elements, including bold color blocks and creative graphics, draw attention to key points, ensuring your message resonates with your audience. From SWOT analysis to market trends, and resource allocation to action plans, every slide is crafted to communicate your strategic objectives clearly and compellingly. Perfect for business reviews, strategic meetings, or investor presentations, this template allows you to present data-driven insights and actionable steps in an engaging manner. It’s fully customizable, making it easy to adapt to your brand’s colors and style. Whether you’re presenting to a team or stakeholders, the Catalyst template provides the perfect platform to articulate your vision. Compatible with PowerPoint, Keynote, and Google Slides, it’s your go-to tool for impactful strategic presentations!


5 diapositivas
Professional Business People Collaboration Presentation
Showcase effective teamwork and synergy with this Professional Business People Collaboration slide. The puzzle-piece visual metaphor highlights how diverse roles fit together to build cohesive strategies. With five clearly labeled sections, it’s perfect for project collaboration plans, department overviews, or joint venture strategies. Fully editable and compatible with PowerPoint, Keynote, and Google Slides.


8 diapositivas
Customer Survey Results Analysis Presentation
Visualize feedback clearly and confidently with this dynamic results breakdown template. Featuring circular percentage graphics around a central report icon, this slide is ideal for presenting survey insights, NPS metrics, or user feedback summaries. Fully editable in PowerPoint, Keynote, and Google Slides.


5 diapositivas
Company Success Story Timeline Presentation
Highlight your journey with the Company Success Story Timeline Presentation. This modern, mountain-style layout helps you break down your company’s key milestones, phases, or achievements step by step. With five customizable stages and icons, it’s ideal for visual storytelling, growth metrics, or project retrospectives. Fully editable in Canva, PowerPoint, Keynote, and Google Slides.


21 diapositivas
Auster Financial Report Presentation
Present financial insights with clarity using this comprehensive report template. Highlight key metrics, performance, project progress, competitor analysis, and strategic initiatives. Includes sections for team productivity, market trends, goals, and recommendations. Perfect for business reviews and updates. Fully customizable for PowerPoint, Keynote, and Google Slides.


5 diapositivas
Visual Mind Connections Bubble Chart Presentation
Visualize interconnected concepts with clarity using the Visual Mind Connections Bubble Chart Presentation. This engaging layout centers around a core idea, surrounded by supporting points in a clean, circular flow. Ideal for mapping strategies, team roles, or processes. Fully editable in PowerPoint, Keynote, or Google Slides—perfect for business, education, or coaching.


6 diapositivas
Investment Strategy Planning Presentation
The "Investment Strategy Planning Presentation" templates employ a clean and straightforward design with pentagon-shaped elements to visually represent various stages or components of investment strategies. Each template highlights key points with icons that effectively communicate the concept, making them especially useful for financial presentations where clarity and emphasis on specific financial strategies are crucial. This format supports a structured approach to presenting complex investment plans, helping to guide the audience through each phase of the strategy clearly and efficiently.