


Características


¿Tienes alguna pregunta?
Recomendar


7 diapositivas
Financial Health and Budget Planning Presentation
Present your budgeting journey with clarity using the Financial Health and Budget Planning Presentation. This slide features a horizontal flow diagram with six editable steps—perfect for outlining savings strategies, expense tracking, or financial goals. Each icon-based block helps highlight key actions. Fully customizable in PowerPoint, Canva, and Google Slides.


4 diapositivas
Goal Breakdown and Success Metrics Presentation
Visualize achievement metrics with the Goal Breakdown and Success Metrics Presentation. This dynamic template features global maps, KPIs, and segment analysis to track progress and highlight results. Ideal for executives, project leads, or analysts. Fully customizable in PowerPoint, Keynote, and Google Slides for polished and insightful business presentations.


6 diapositivas
Cloud IT Infrastructure Design Presentation
Transform the way you explain cloud systems with this modern, data-driven presentation. Ideal for outlining infrastructure layers, deployment strategies, or network operations, it uses a clean, cloud-inspired layout for clarity and impact. Fully customizable and compatible with PowerPoint, Keynote, and Google Slides for a smooth, professional presentation experience.


7 diapositivas
United States Map Infographic Presentation Template
The United States is a country in North America, consisting of 50 states. Besides the 48 conterminous states that occupy the middle latitudes of the continent, the United States includes the state of Alaska, at the northwestern extreme of North America, and the island state of Hawaii, in the mid-Pacific Ocean. This map template is a great way to kickstart your project, add a clean and professional look with it. This template can be used to display any type of data or information you need in your presentations. Use this map template to show where the states are and what they're known for.


4 diapositivas
Business SWOT Evaluation Presentation
Break down business strategies with this visually structured SWOT analysis layout. Present strengths, weaknesses, opportunities, and threats in a clean, quadrant-style format. Ideal for reports, pitches, or internal reviews. Fully editable in PowerPoint, Keynote, and Google Slides for clear, impactful analysis that drives smarter decision-making and strategic alignment.


4 diapositivas
Innovation with Design Thinking Framework Presentation
Drive innovation with the Design Thinking Framework presentation. This visually engaging layout structures ideas, processes, and solutions into a clear and adaptable design. Perfect for brainstorming sessions, business strategy meetings, and creative problem-solving. Fully customizable and compatible with PowerPoint, Keynote, and Google Slides for a seamless workflow.


5 diapositivas
Supply Chain Process Infographics
Unravel the complexities of logistics with supply chain process infographics. This vibrant template, splashed with energetic shades of orange, purple, and green, is designed to streamline the convolutions of supply chain management into an easily digestible format. Ideal for business analysts and logistics professionals, these vertical infographics offer a visually engaging narrative. The template features innovative graphics, intuitive icons, and versatile image placeholders, meticulously crafted to aid in visualizing the intricate processes within supply chain dynamics. These infographics are the tool you need to bring clarity to your audience.


6 diapositivas
Business Performance Pie Chart Presentation
Showcase key business insights with the Business Performance Pie Chart Presentation template. Designed for professionals, this fully editable slide deck allows you to present performance metrics, financial data, and strategic analysis using visually appealing pie charts. Ideal for business reports, investor meetings, and corporate presentations, it ensures clarity and engagement. Compatible with PowerPoint, Keynote, and Google Slides.


7 diapositivas
Sustainable Agriculture Infographic Presentation
An Agriculture Infographic presents information and data related to agriculture and the farming industry. This template is designed to cover a wide range of topics, including crop production, livestock farming, food processing, distribution, and sustainable agriculture practices. Use this infographic to provide information on the economic, social, and environmental impacts of agriculture, as well as to showcase new technologies and innovations in the farming industry. This infographic includes 7 slide layouts each with unique illustrations related to agriculture, charts, and diagrams.


7 diapositivas
Creative Tables Of Content Infographic
A creative table of contents is a visually appealing and innovative way of presenting the structure and contents of a document, report, book, or any written work. Our infographic template is an aesthetically pleasing and insightful map to your content landscape. This infographic is not just a guide; it's a visually engaging journey through your ideas and topics, promising a delightful and organized user experience. Fully customizable and compatible with Powerpoint, Keynote, and Google Slides. This creative table of contents uses design elements, colors, typography, and graphics to make it engaging and eye-catching.
8 diapositivas
Performance Tracking Using OKRs Presentation
Track success effectively with the Performance Tracking Using OKRs presentation. This sleek infinity loop design showcases key metrics across People, Products, and Processes, making it ideal for business performance reviews, goal alignment, and strategic planning. Fully editable and compatible with PowerPoint, Keynote, and Google Slides for seamless customization.


26 diapositivas
Blockchain for Businesses Presentation
Navigate the world of decentralized technology with our Blockchain for Businesses presentation template, compatible with PowerPoint, Keynote, and Google Slides. Tailored for business leaders, tech entrepreneurs, and financial experts, this template is a gateway to understanding blockchain's impact on the corporate landscape. Our template demystifies blockchain, presenting its core concepts and applications in business, from enhancing security to streamlining transactions. It provides a visual narrative to explain how blockchain can be a game-changer in various industries by fostering transparency, efficiency, and trust. With customizable diagrams, charts, and case studies, you can illustrate the practical benefits of blockchain integration in business operations. This template is SEO-optimized to reach audiences interested in leveraging blockchain technology for competitive advantage. Use our template to educate your audience about the strategic implementation of blockchain and position your business at the forefront of technological innovation.


3 diapositivas
Business Ethics and Legal Guidelines Presentation
Navigate the complexities of corporate governance with the "Business Ethics and Legal Guidelines" template, designed to simplify and clarify the presentation of legal standards and ethical expectations in business environments.This visually engaging layout helps emphasize the progression and importance of each principle, ensuring clarity in communication. Ideal for training modules, compliance meetings, or strategic planning sessions, it's compatible with PowerPoint, Keynote, and Google Slides.


4 diapositivas
Investor-Ready Pitch for New Ventures Presentation
Make a lasting impression with the Investor-Ready Pitch for New Ventures Presentation. Designed to balance visuals with key stats, this template helps startups clearly communicate value to potential investors. Highlight milestones, team credibility, and market opportunity using bold typography and high-impact imagery. Fully editable in PowerPoint, Keynote, Google Slides, and Canva.


7 diapositivas
Leadership Infographic Presentation Template
Leadership is a vital function of management. It helps to direct an organization's resources toward improved efficiency and the achievement of goals. While leadership can be defined in many ways, it is best explained as the ability to motivate and inspire others through example, providing them with direction and being a source of inspiration for those under your authority. This template is designed for you to build the key skills of leadership. Leadership is important for the success of any organization. This template will help you identify your leadership strengths and how to use them.
24 diapositivas
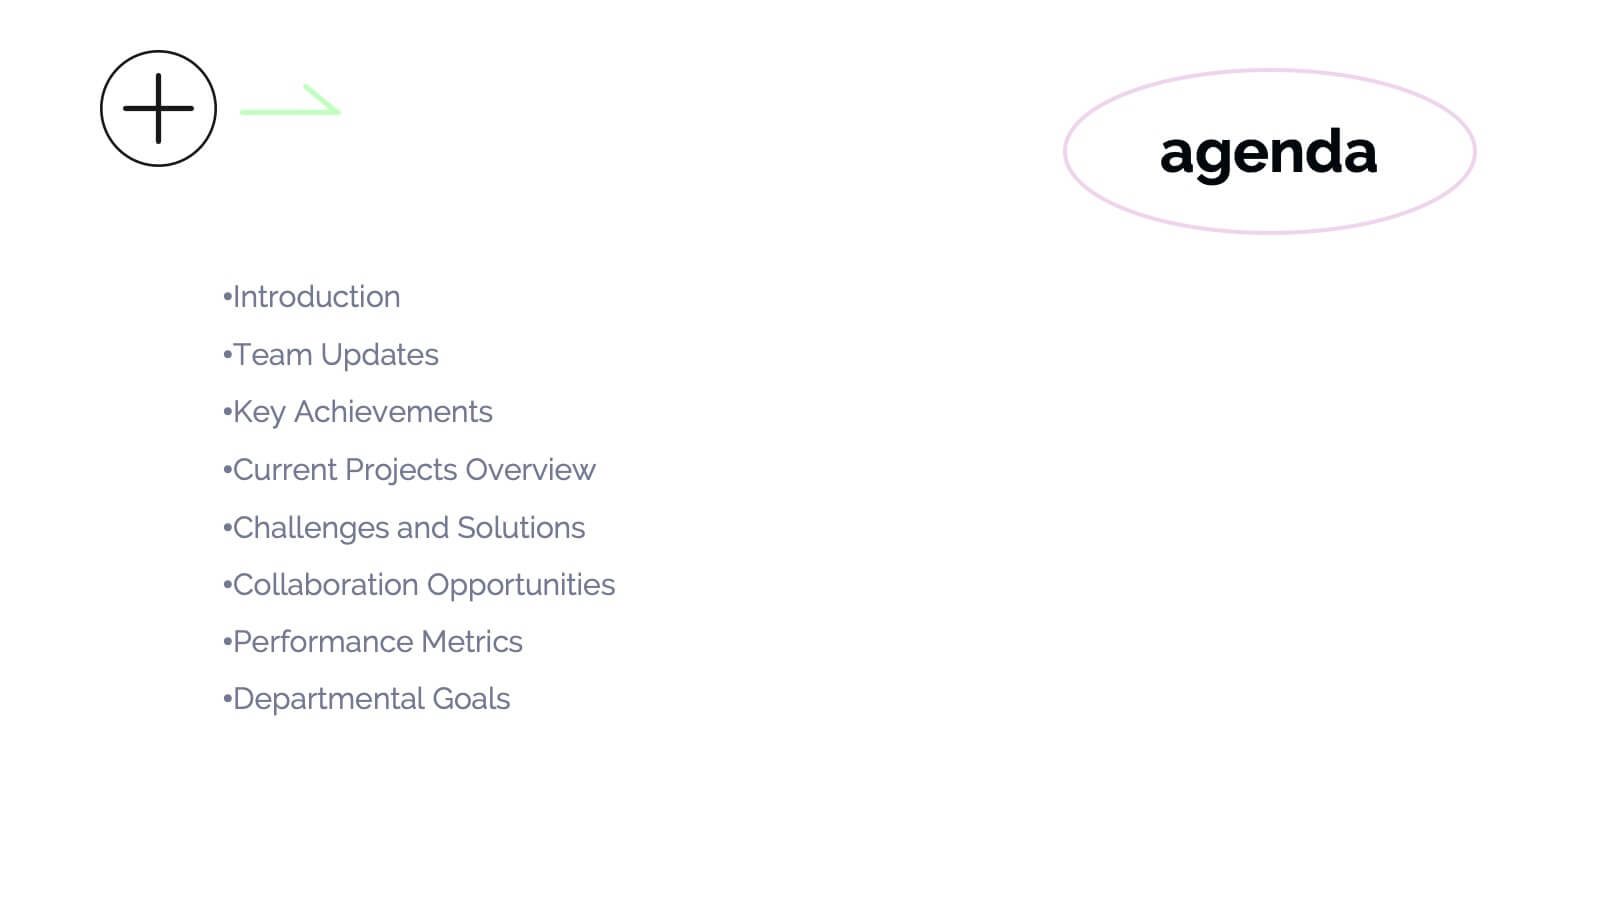
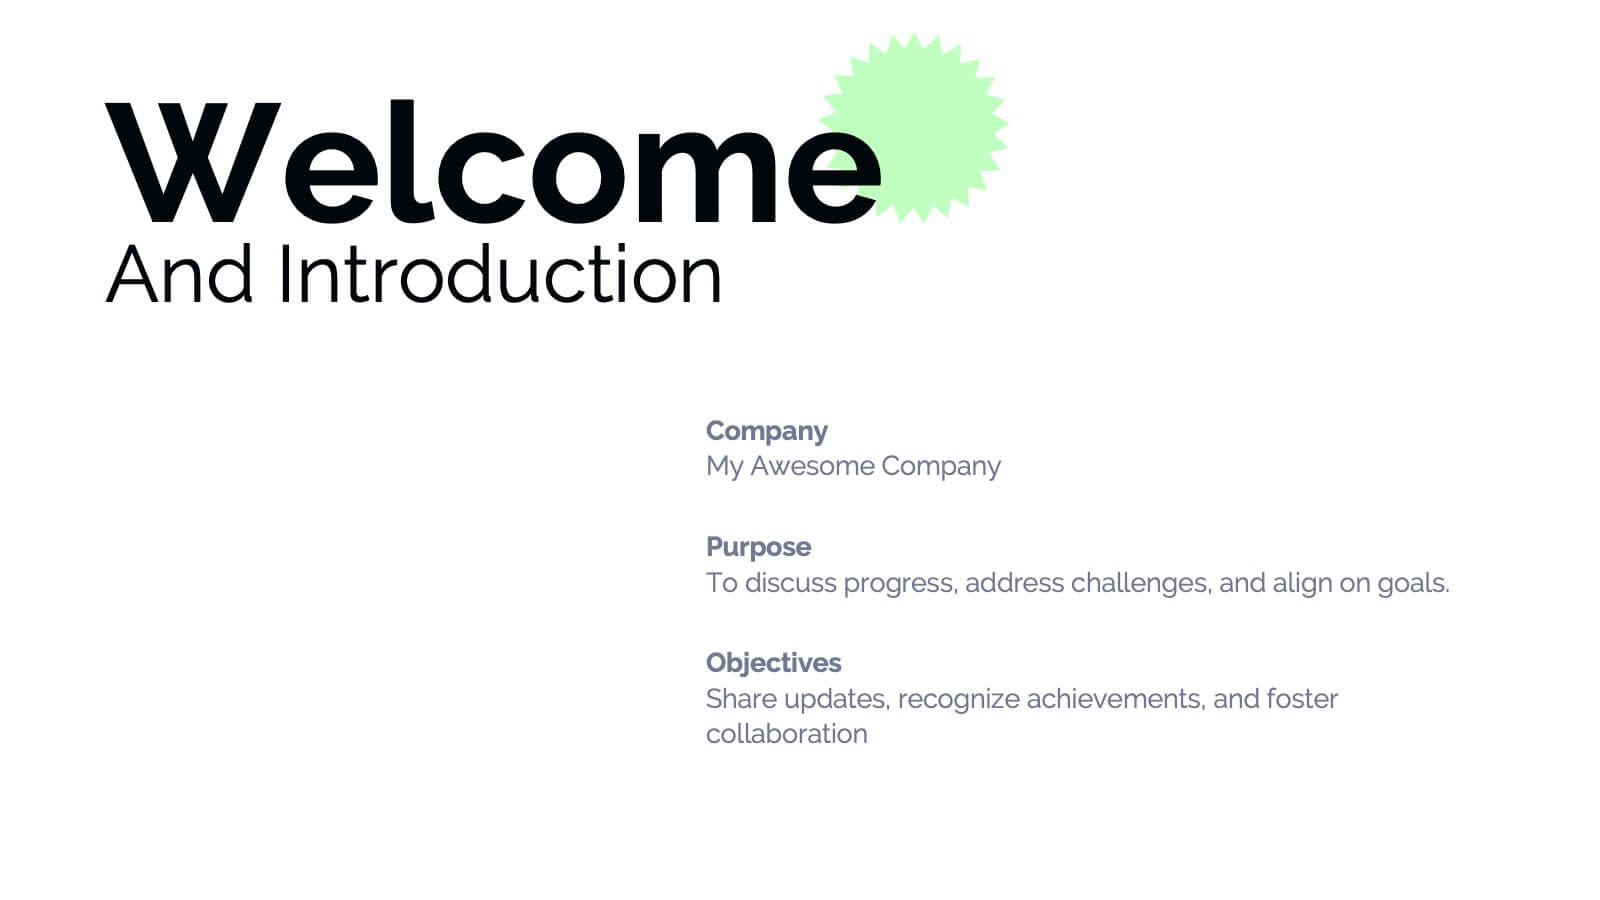
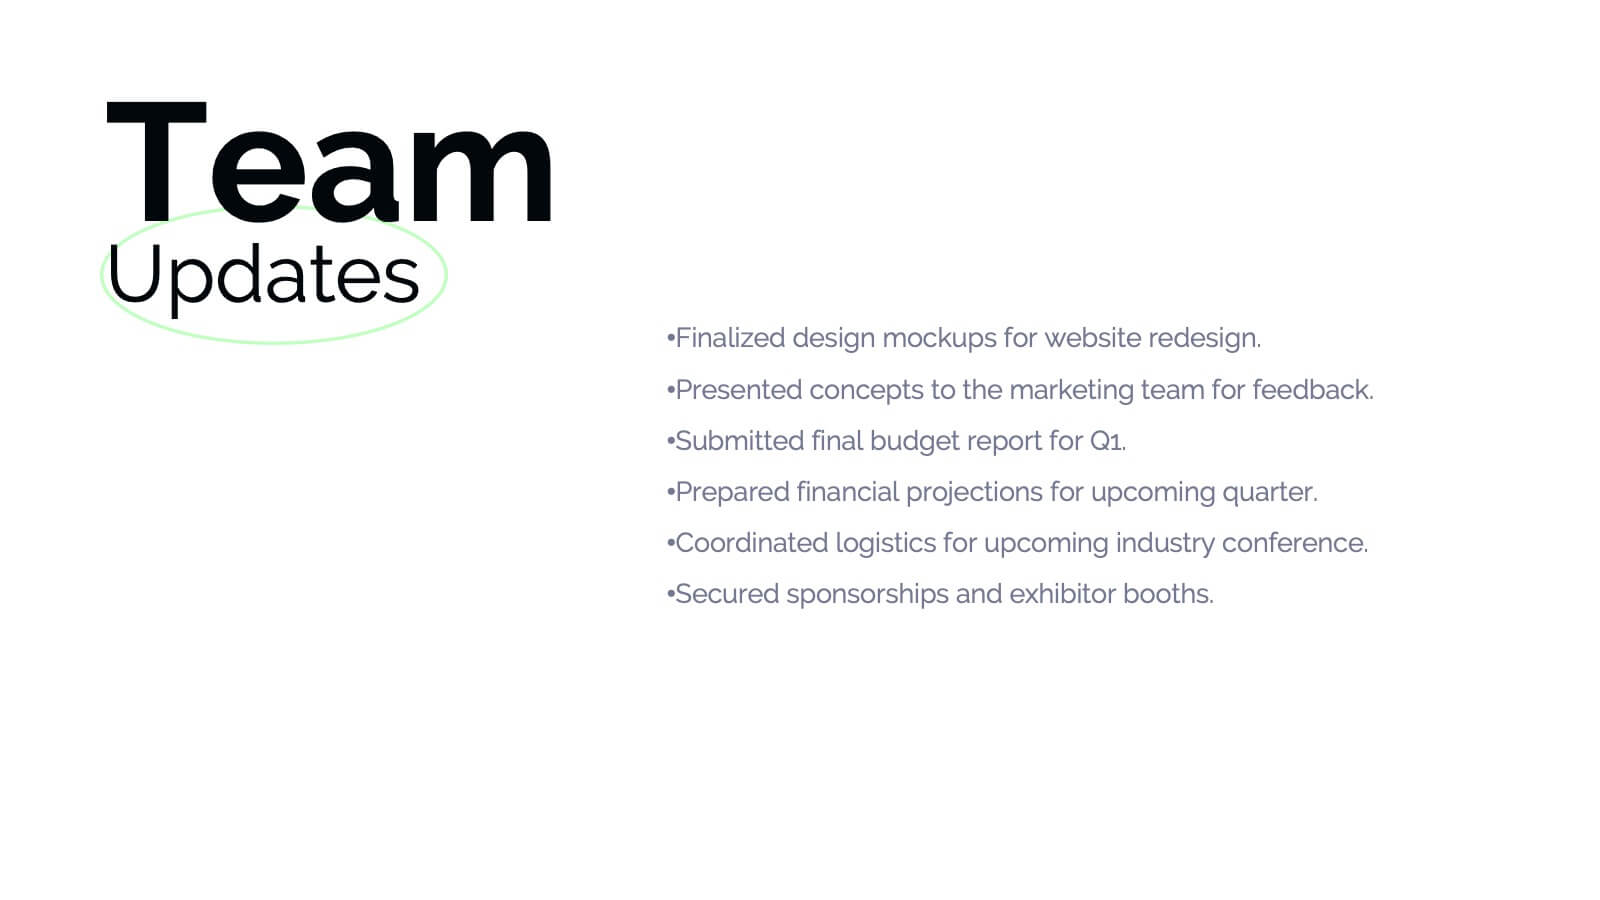
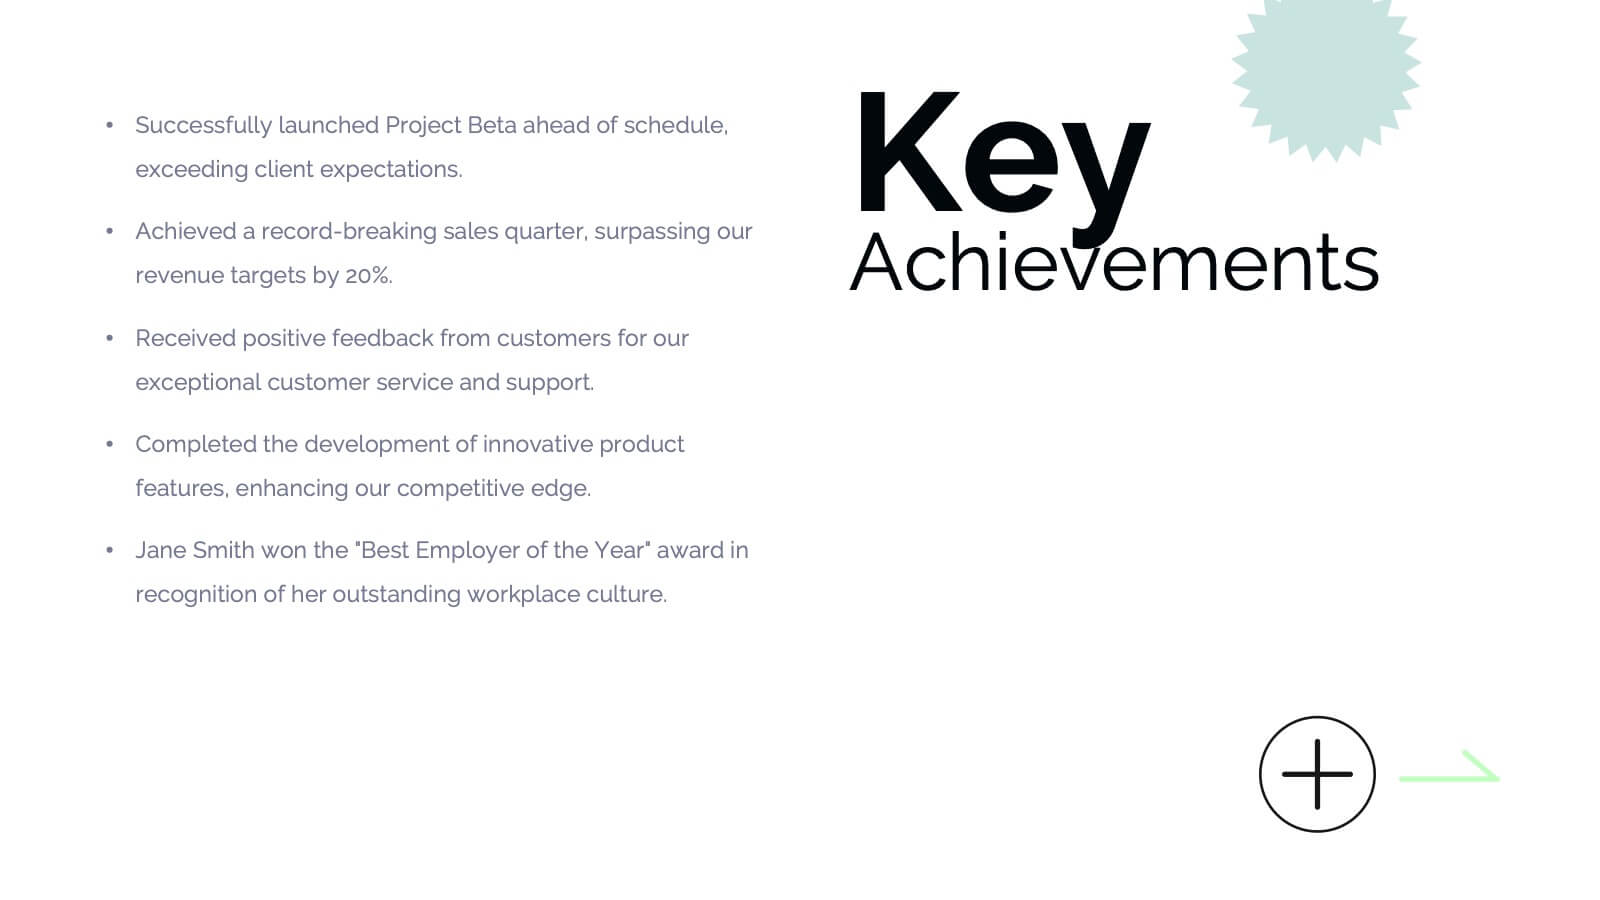
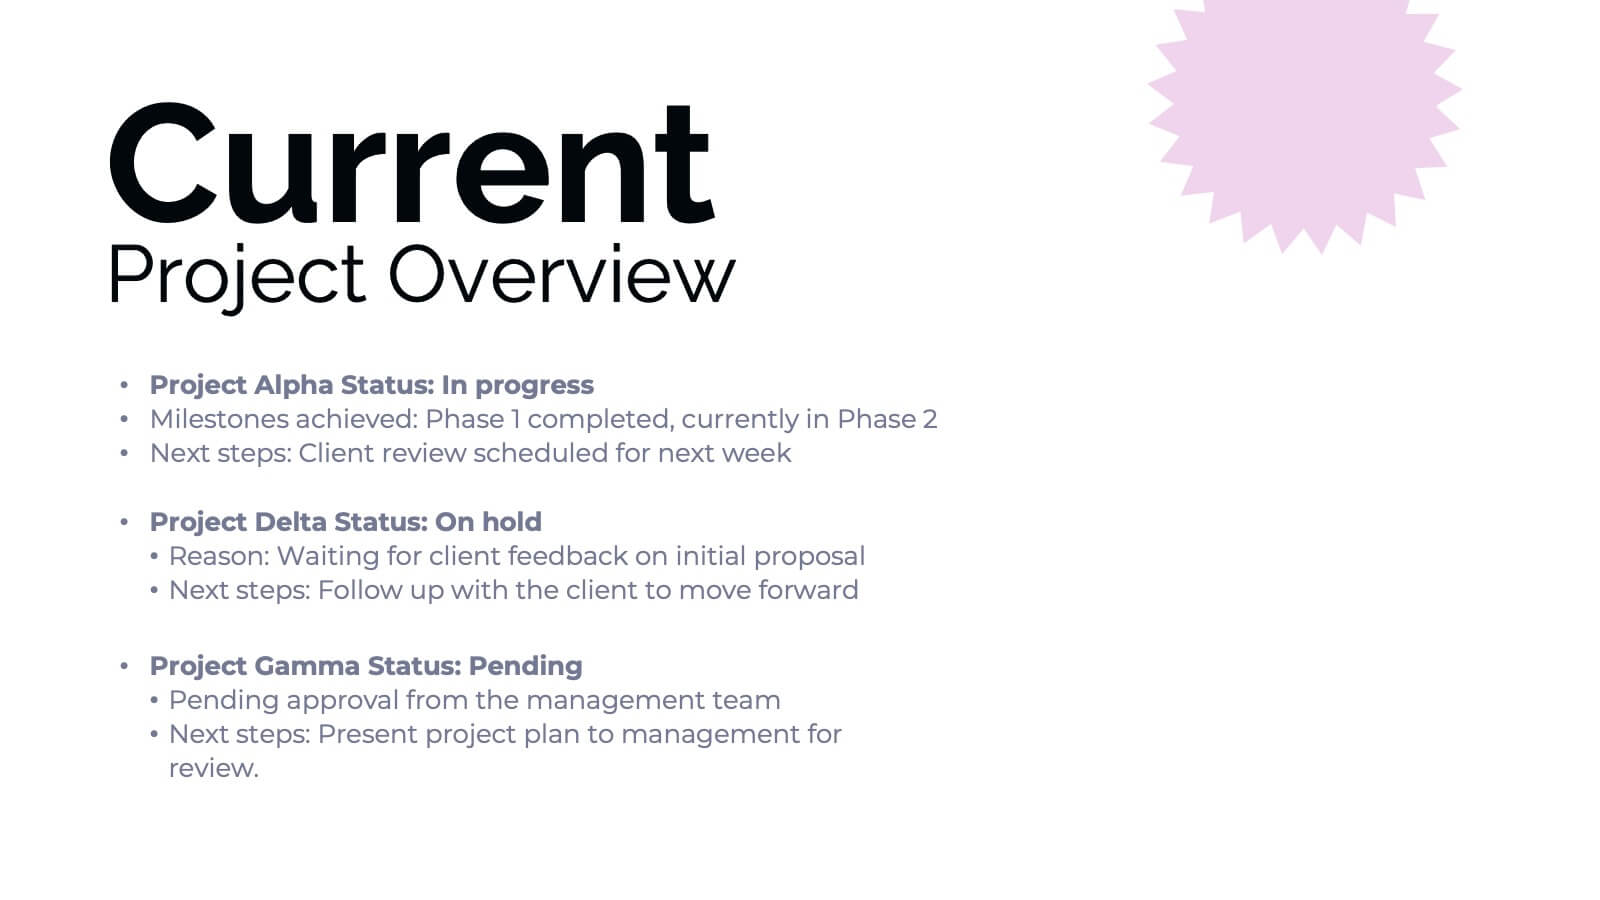
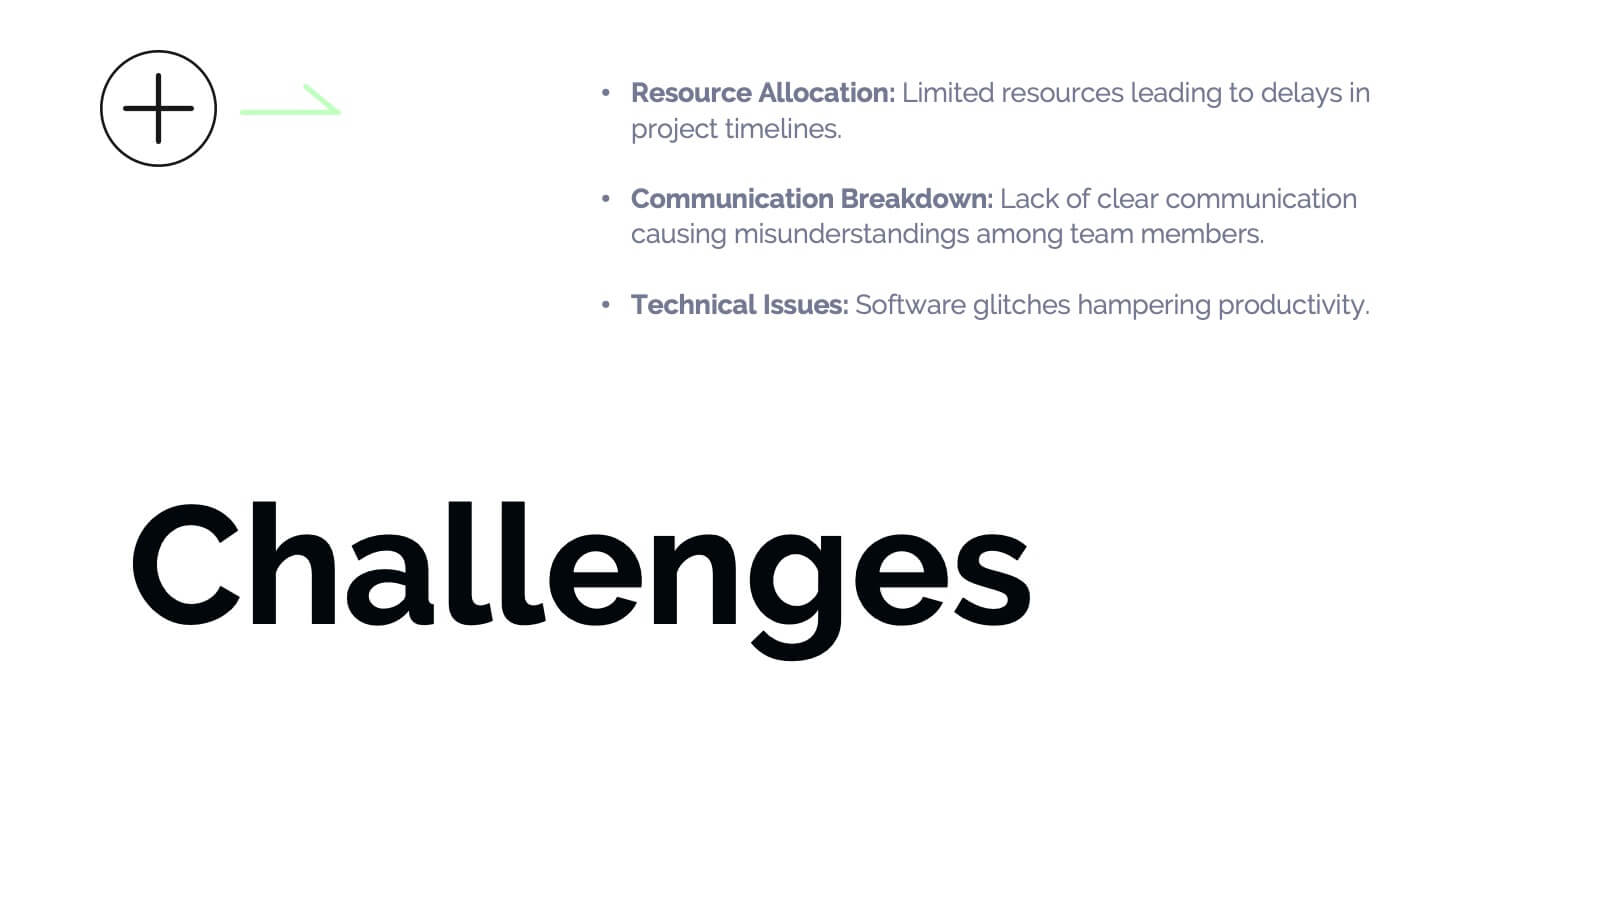
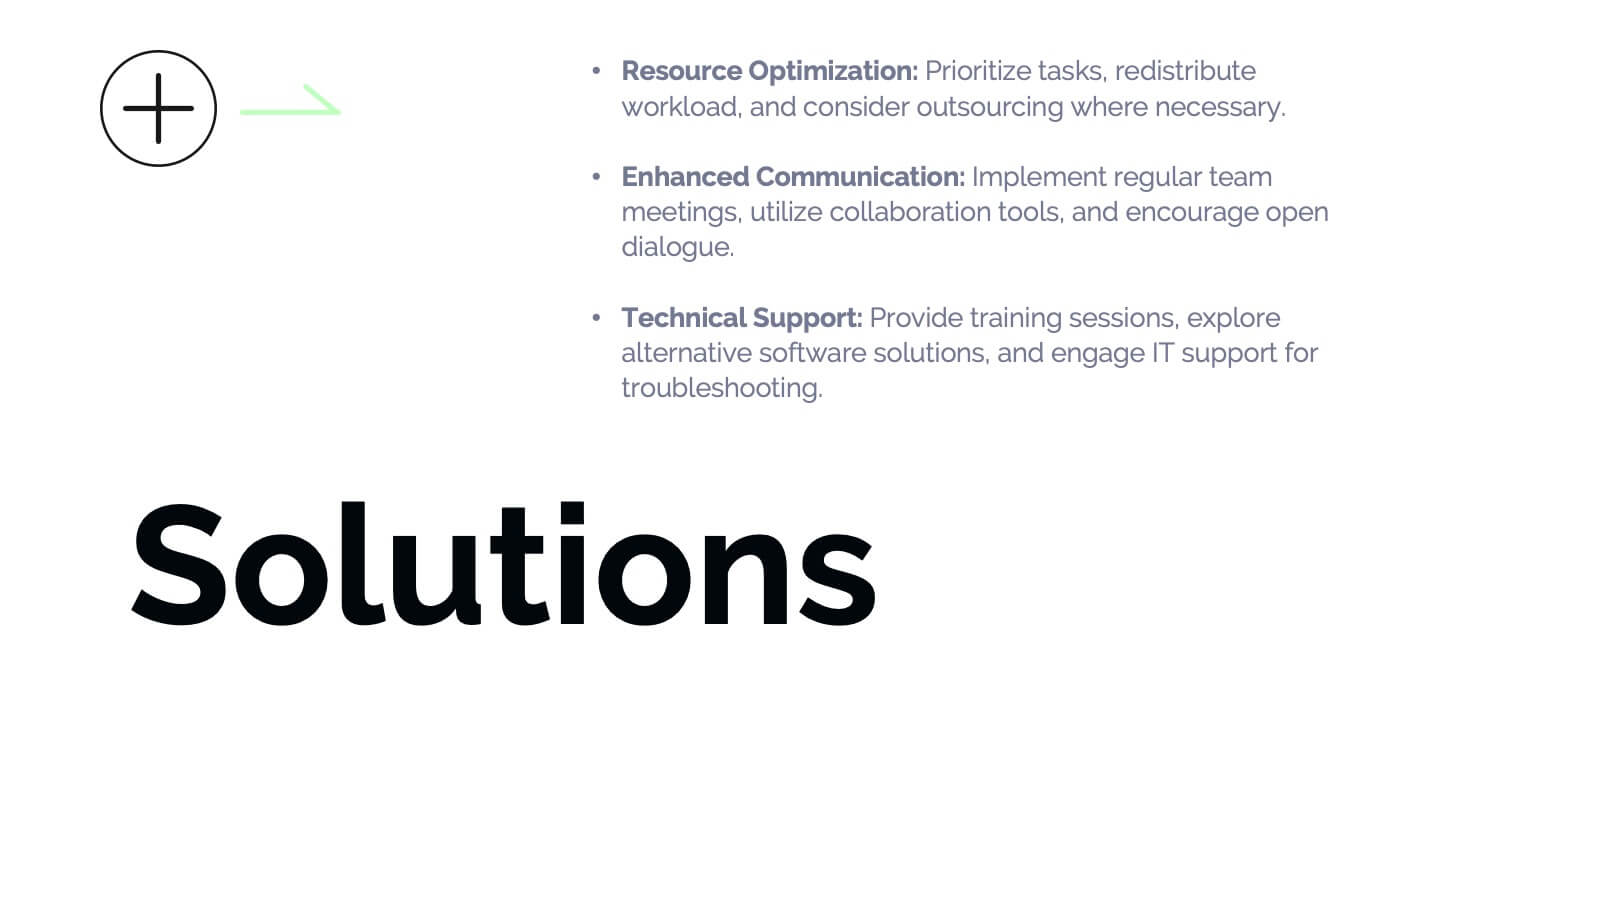
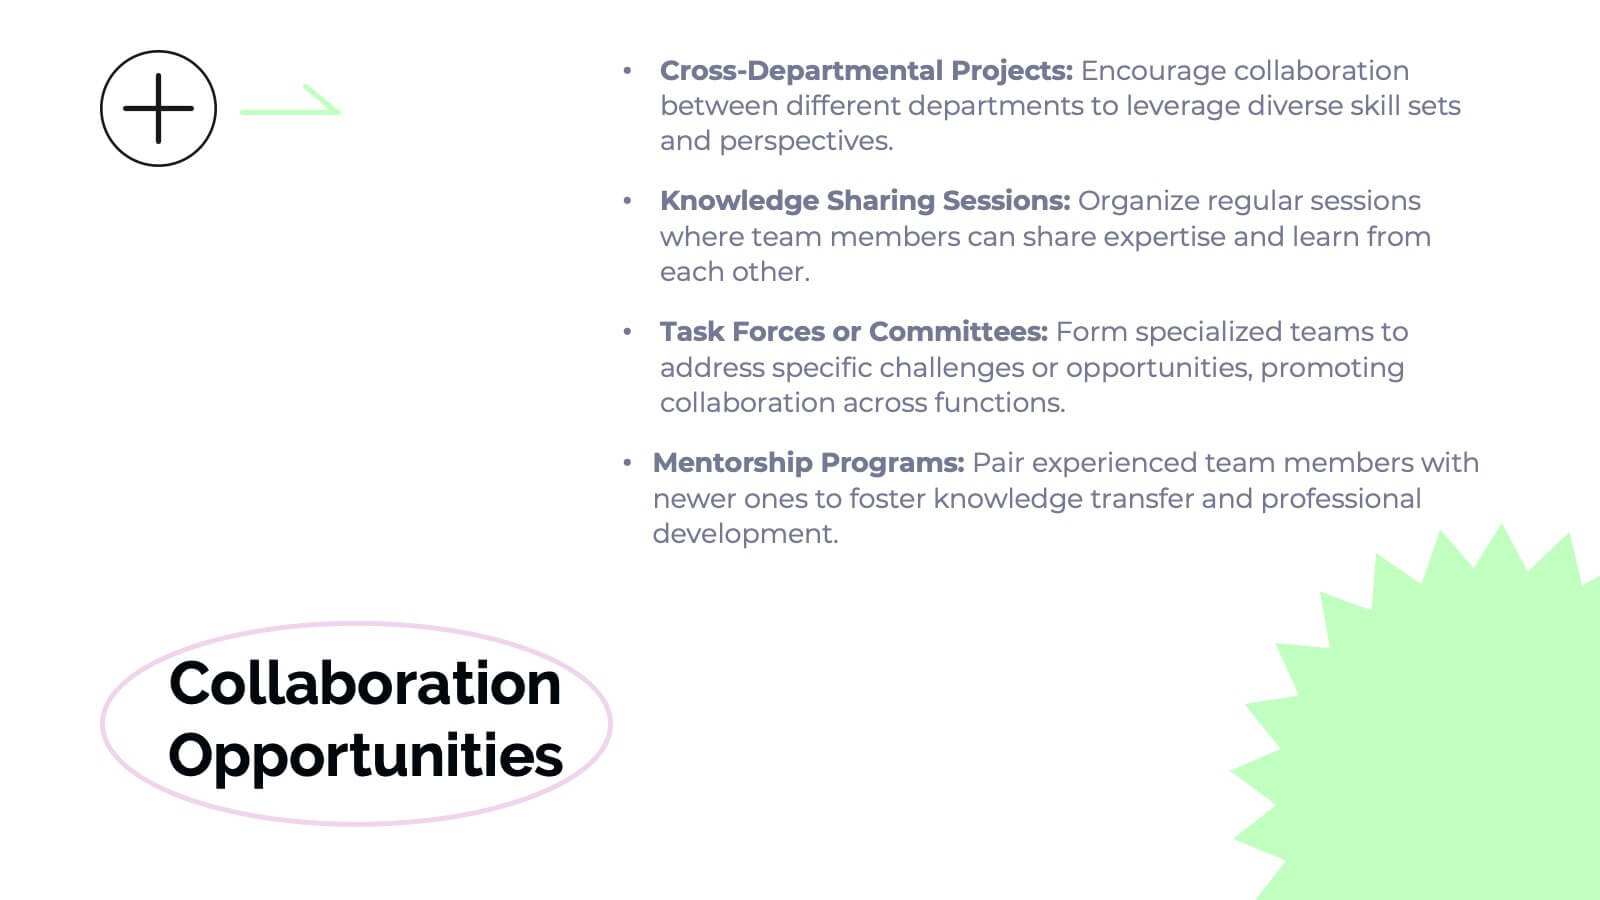
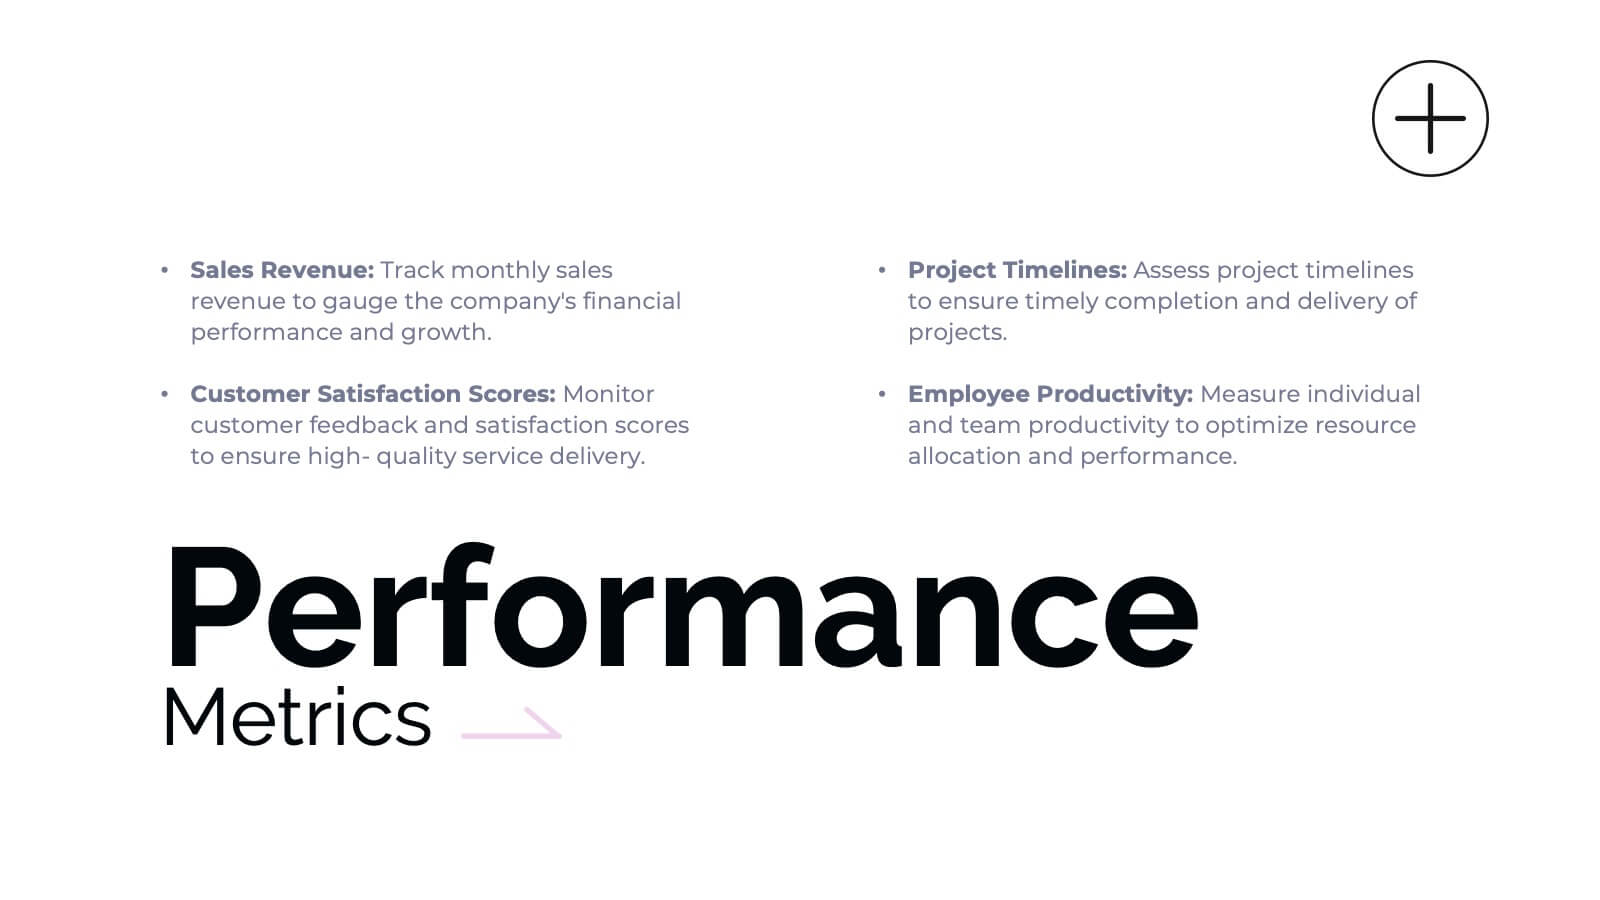
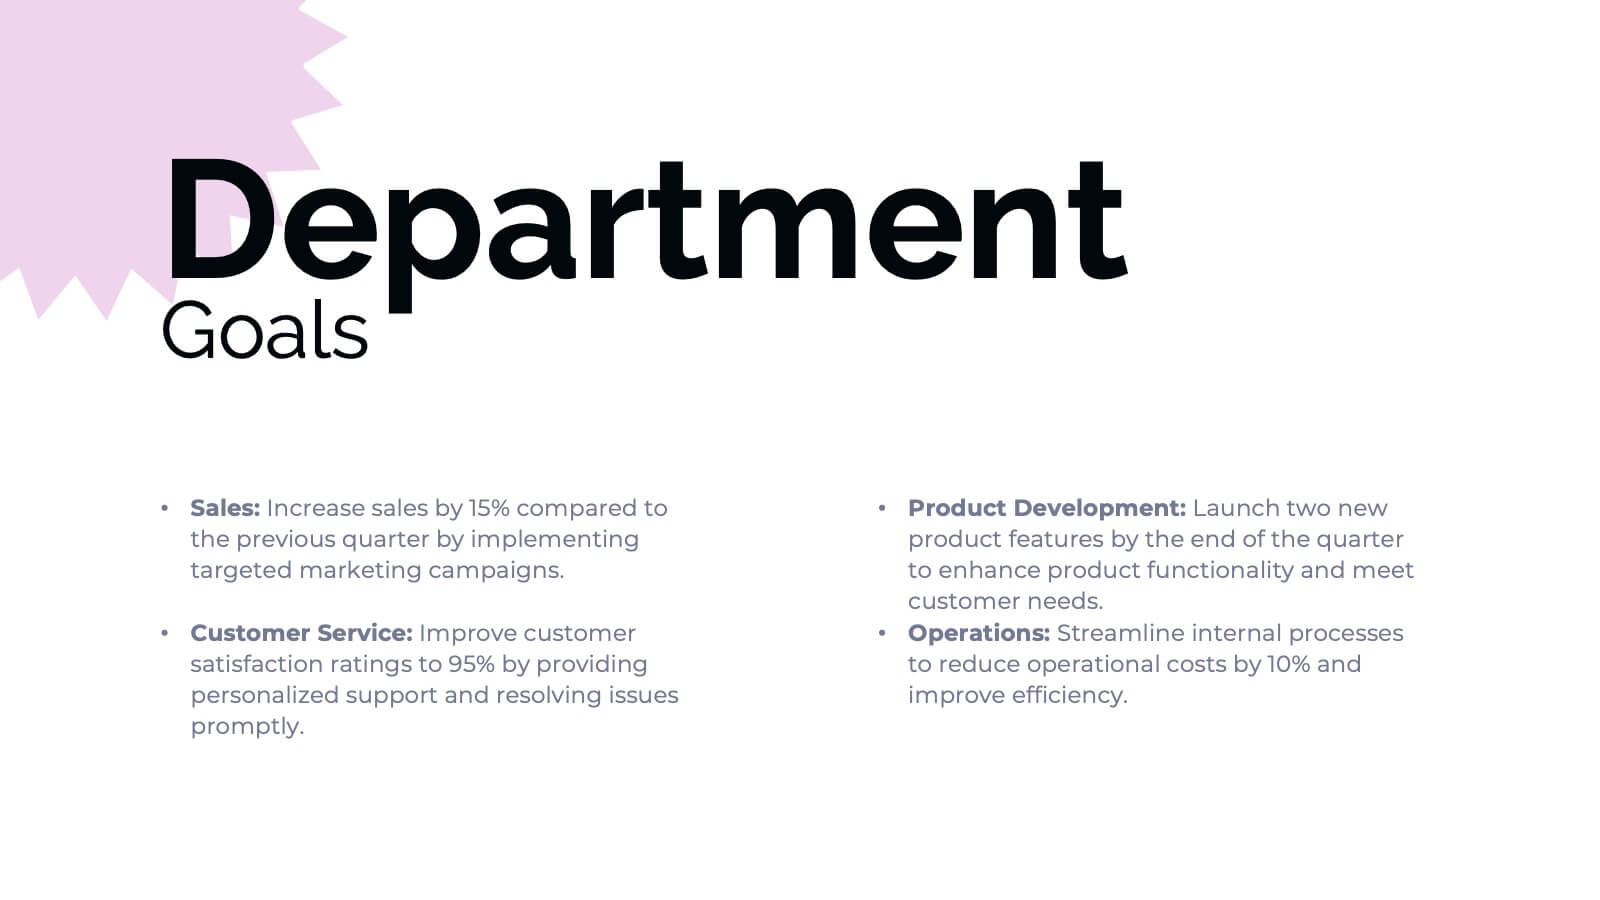
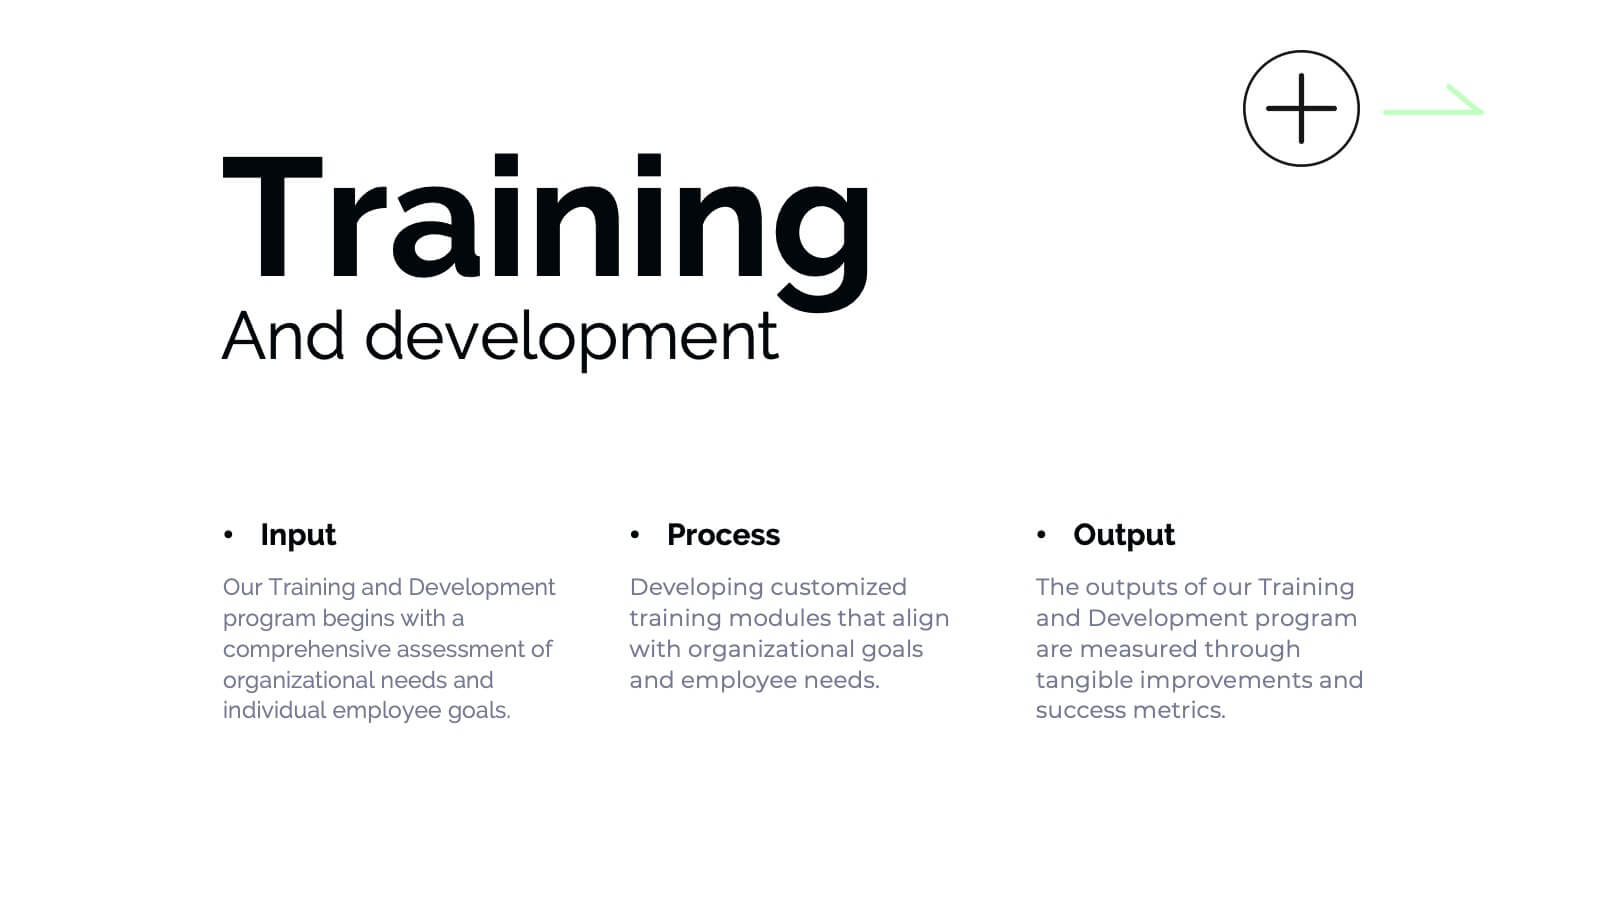
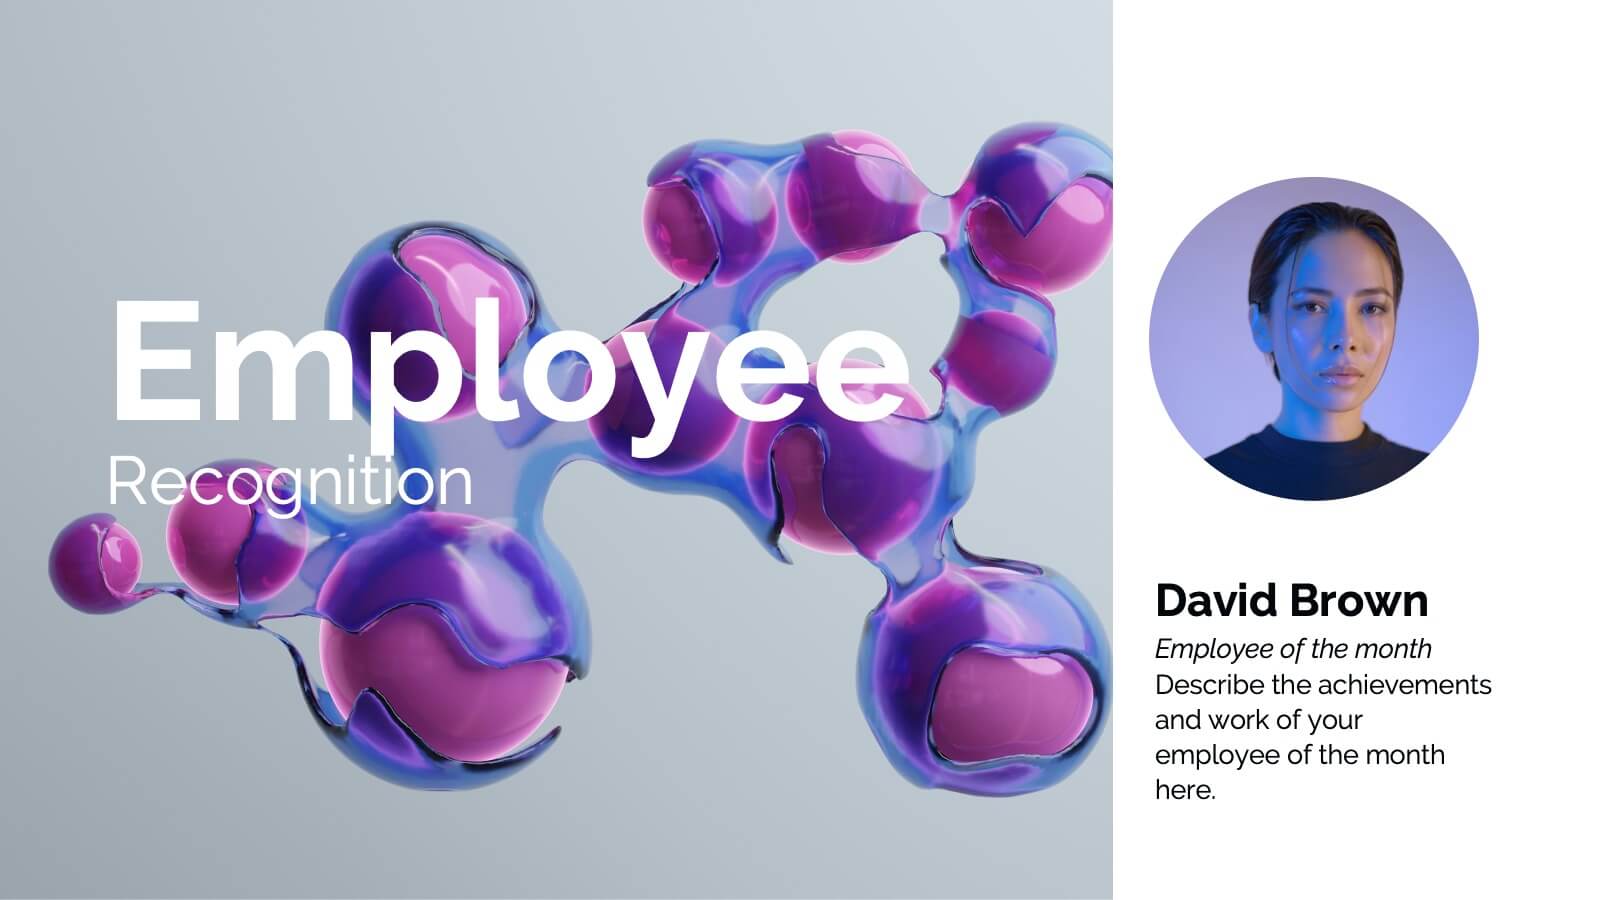
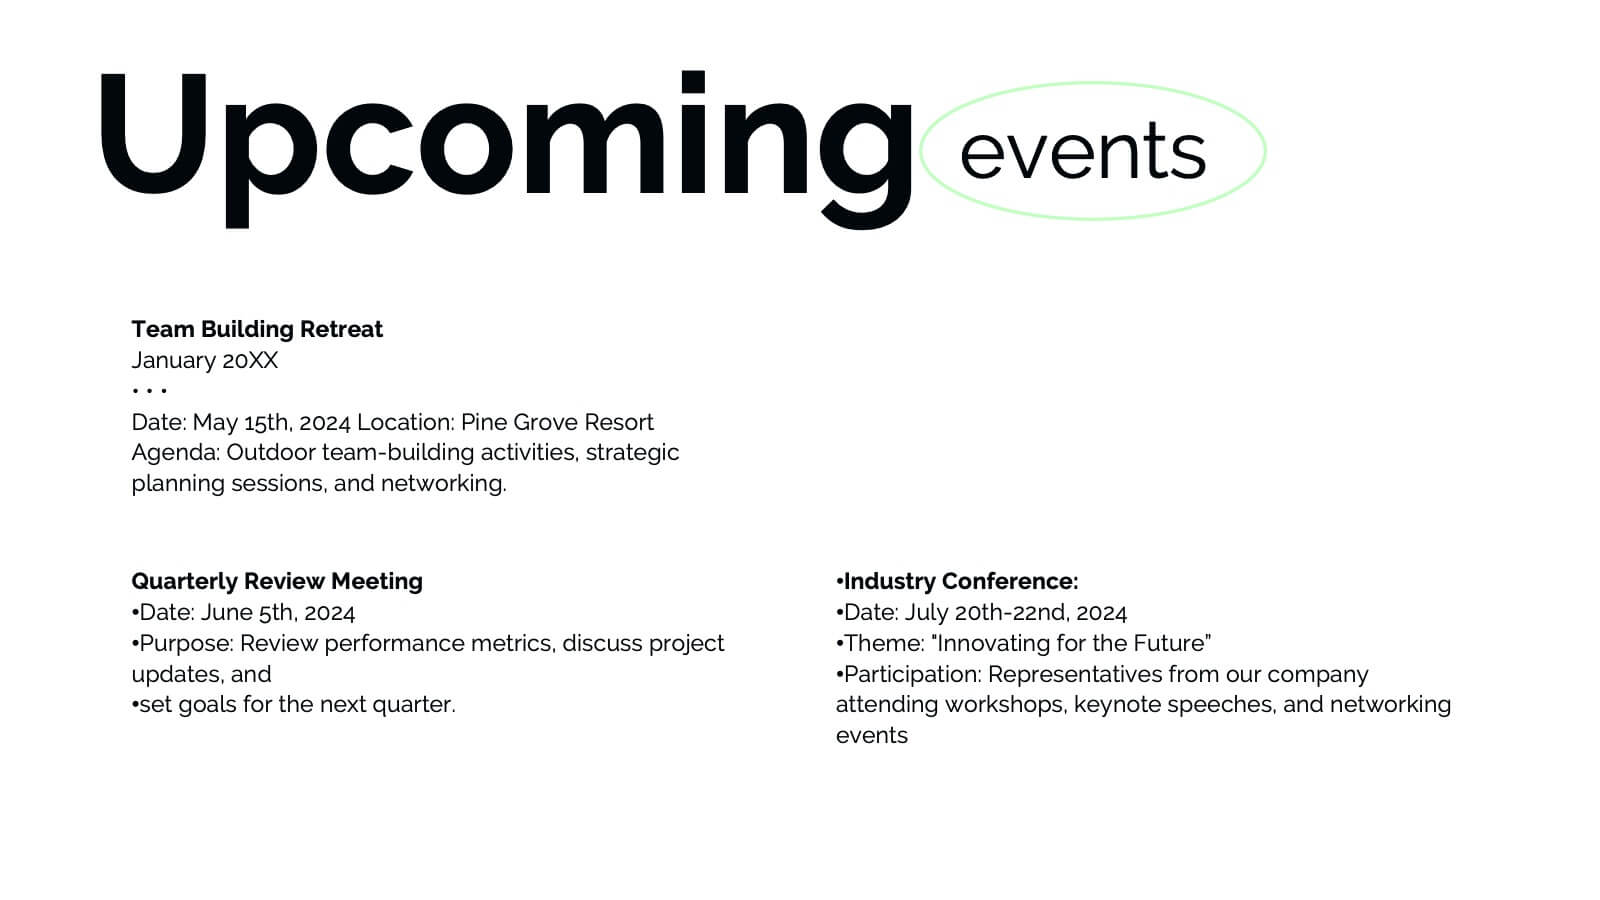
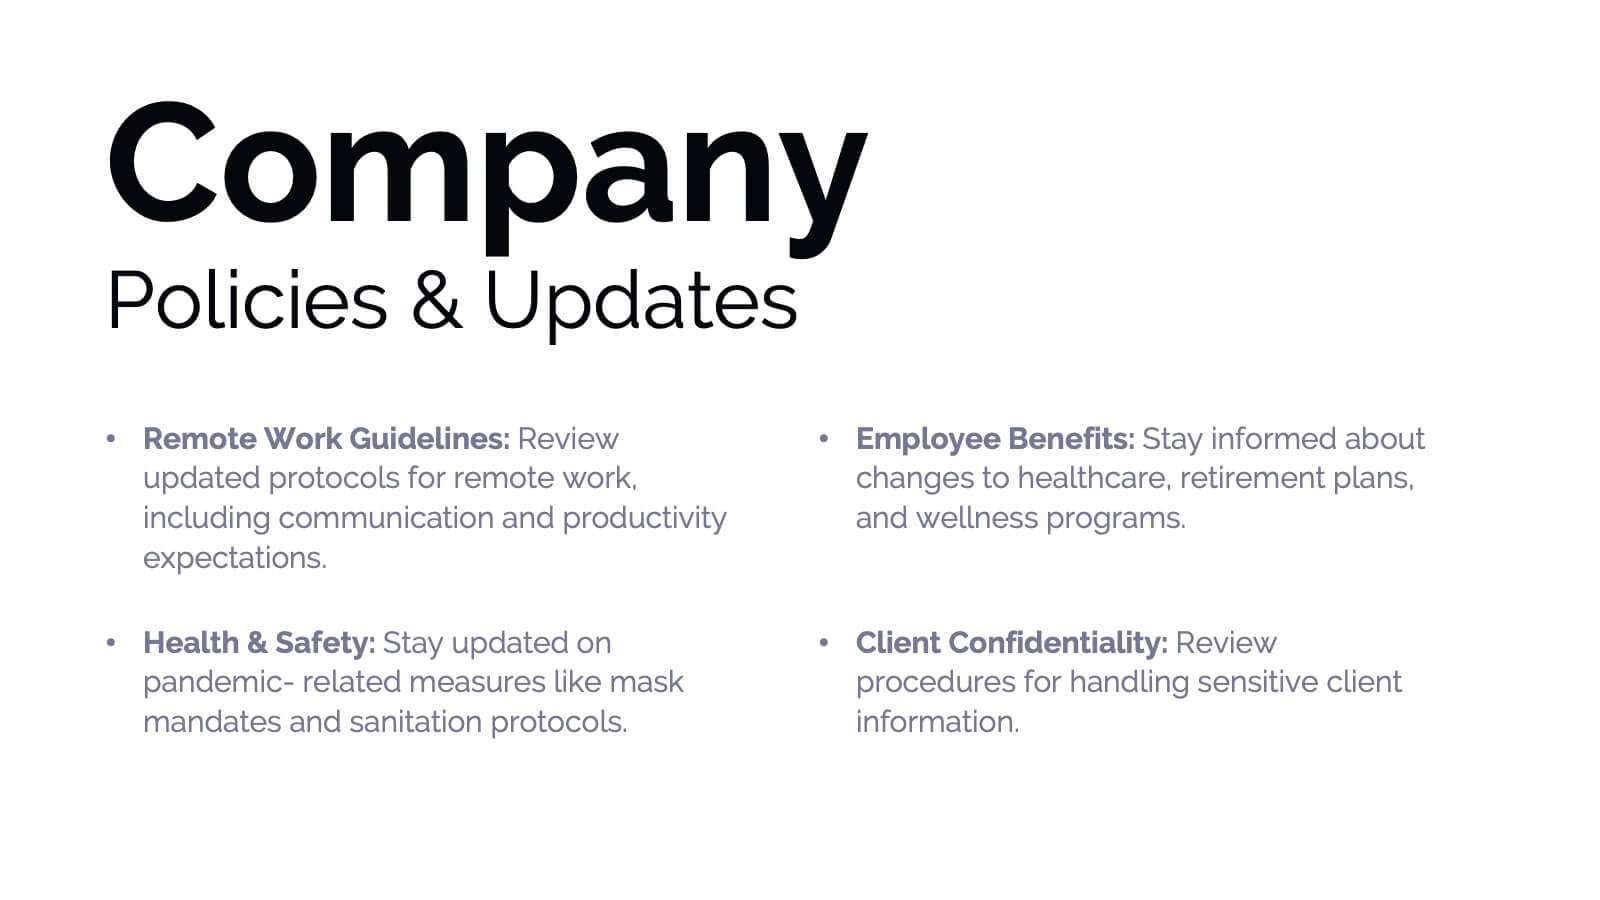
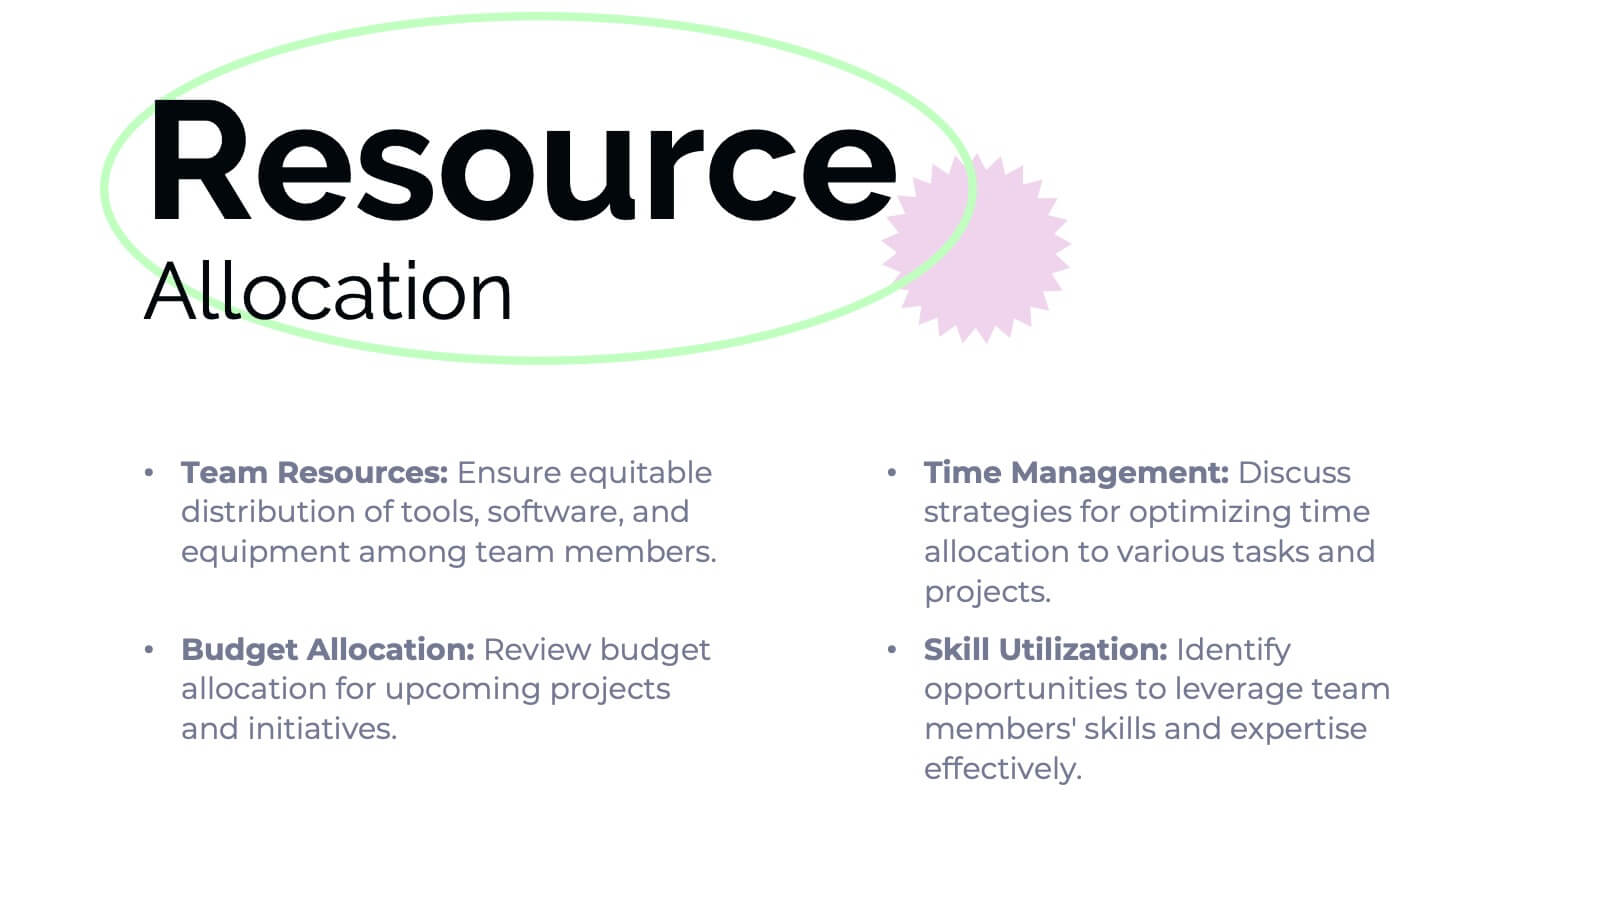
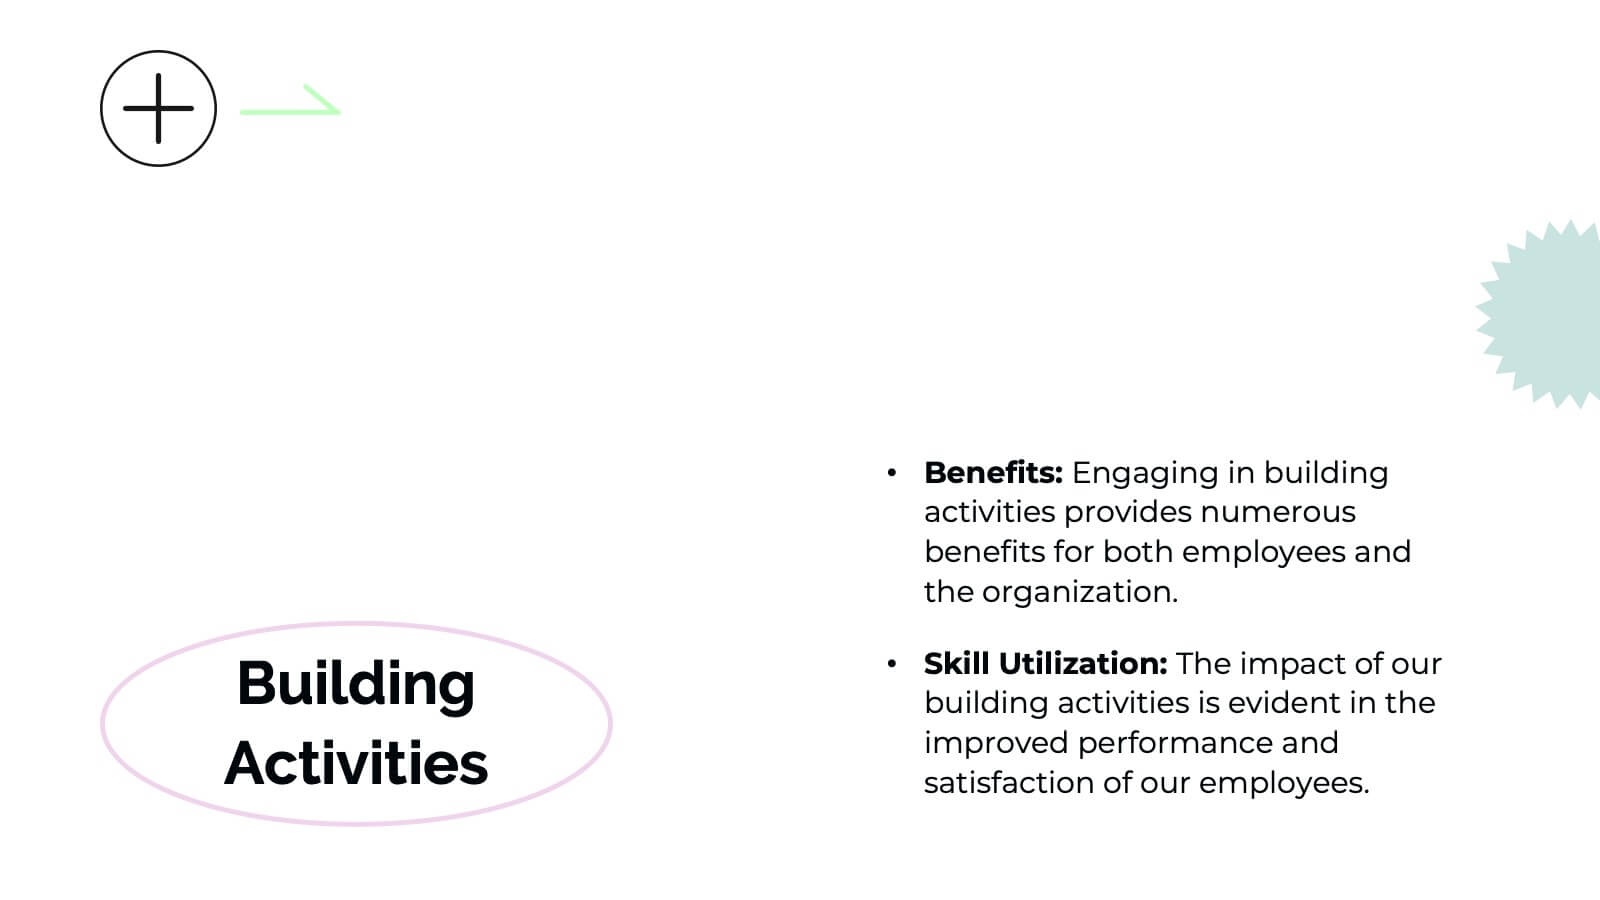
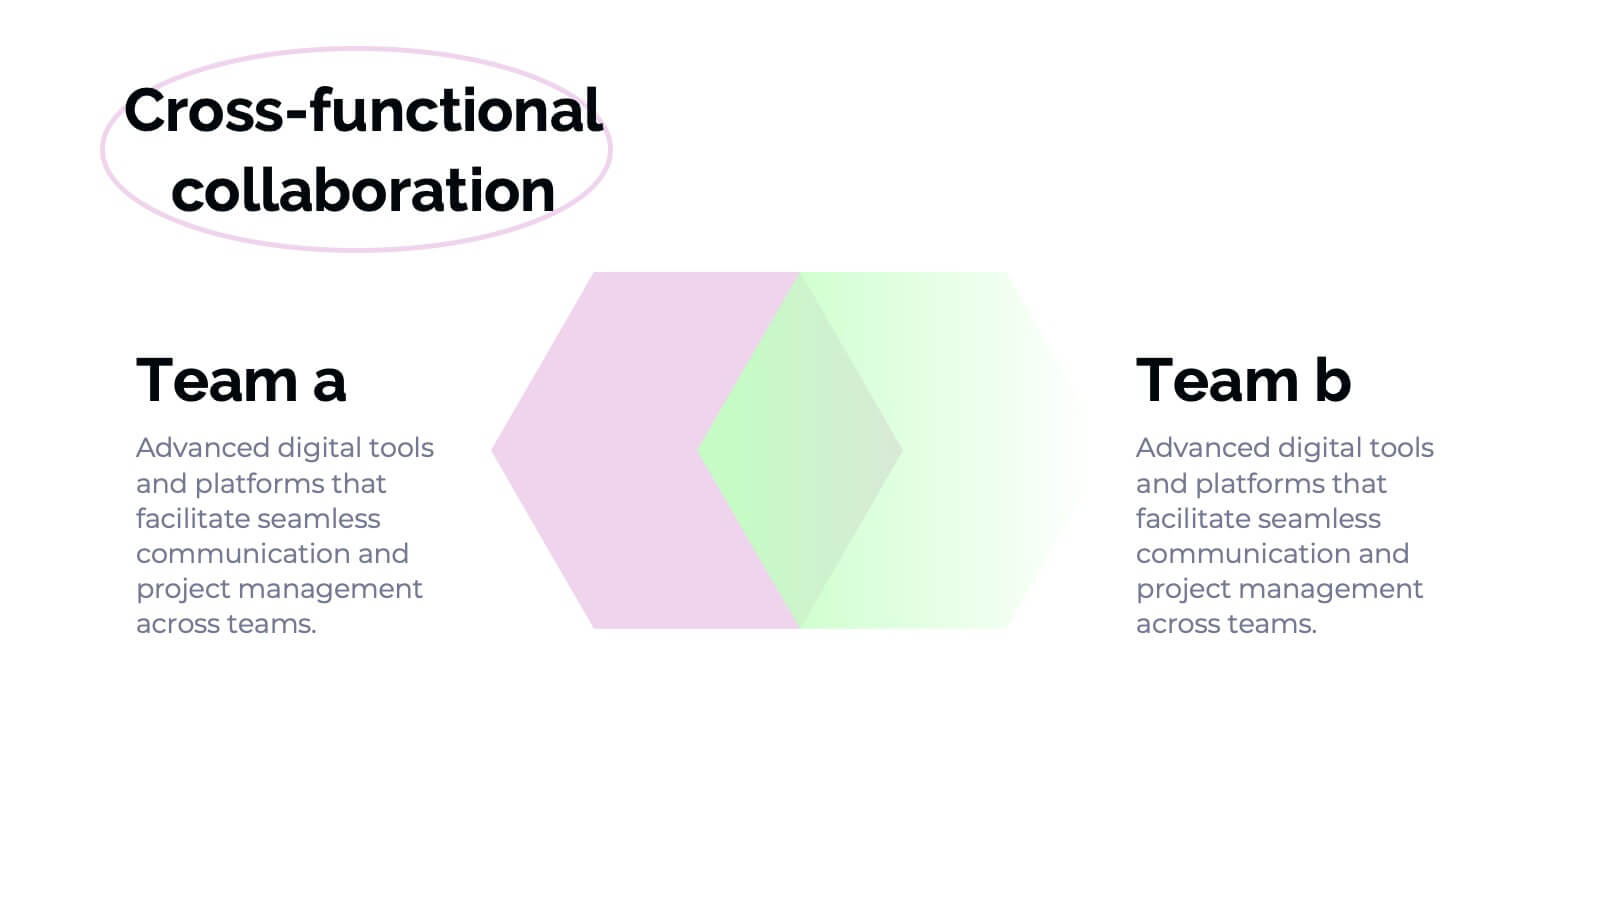
Banshee Business Operations Plan Presentation
Streamline your business operations with this comprehensive presentation template! From team updates and key achievements to challenges and solutions, every aspect of your business plan is covered. Ideal for tracking performance metrics, resource allocation, and upcoming events, this design keeps your operations organized and efficient. Compatible with PowerPoint, Keynote, and Google Slides for seamless integration.


26 diapositivas
Maki Presentation Template
Japanese cuisine is known all around the world, there is so much to try including all the different types of sushi. Maki is a 26 slide template made to help you market your services and products. The clean, simplistic design makes it easy for you to display your content in any modernized way. Maki is designed to showcase your packages, pricing and more. Help your customers feel comfortable purchasing your service or product using this template. Present your message clearly and effectively with this presentation. You can customize the design, photos, background and fonts to make it your own.