


Características


¿Tienes alguna pregunta?
Recomendar

22 diapositivas
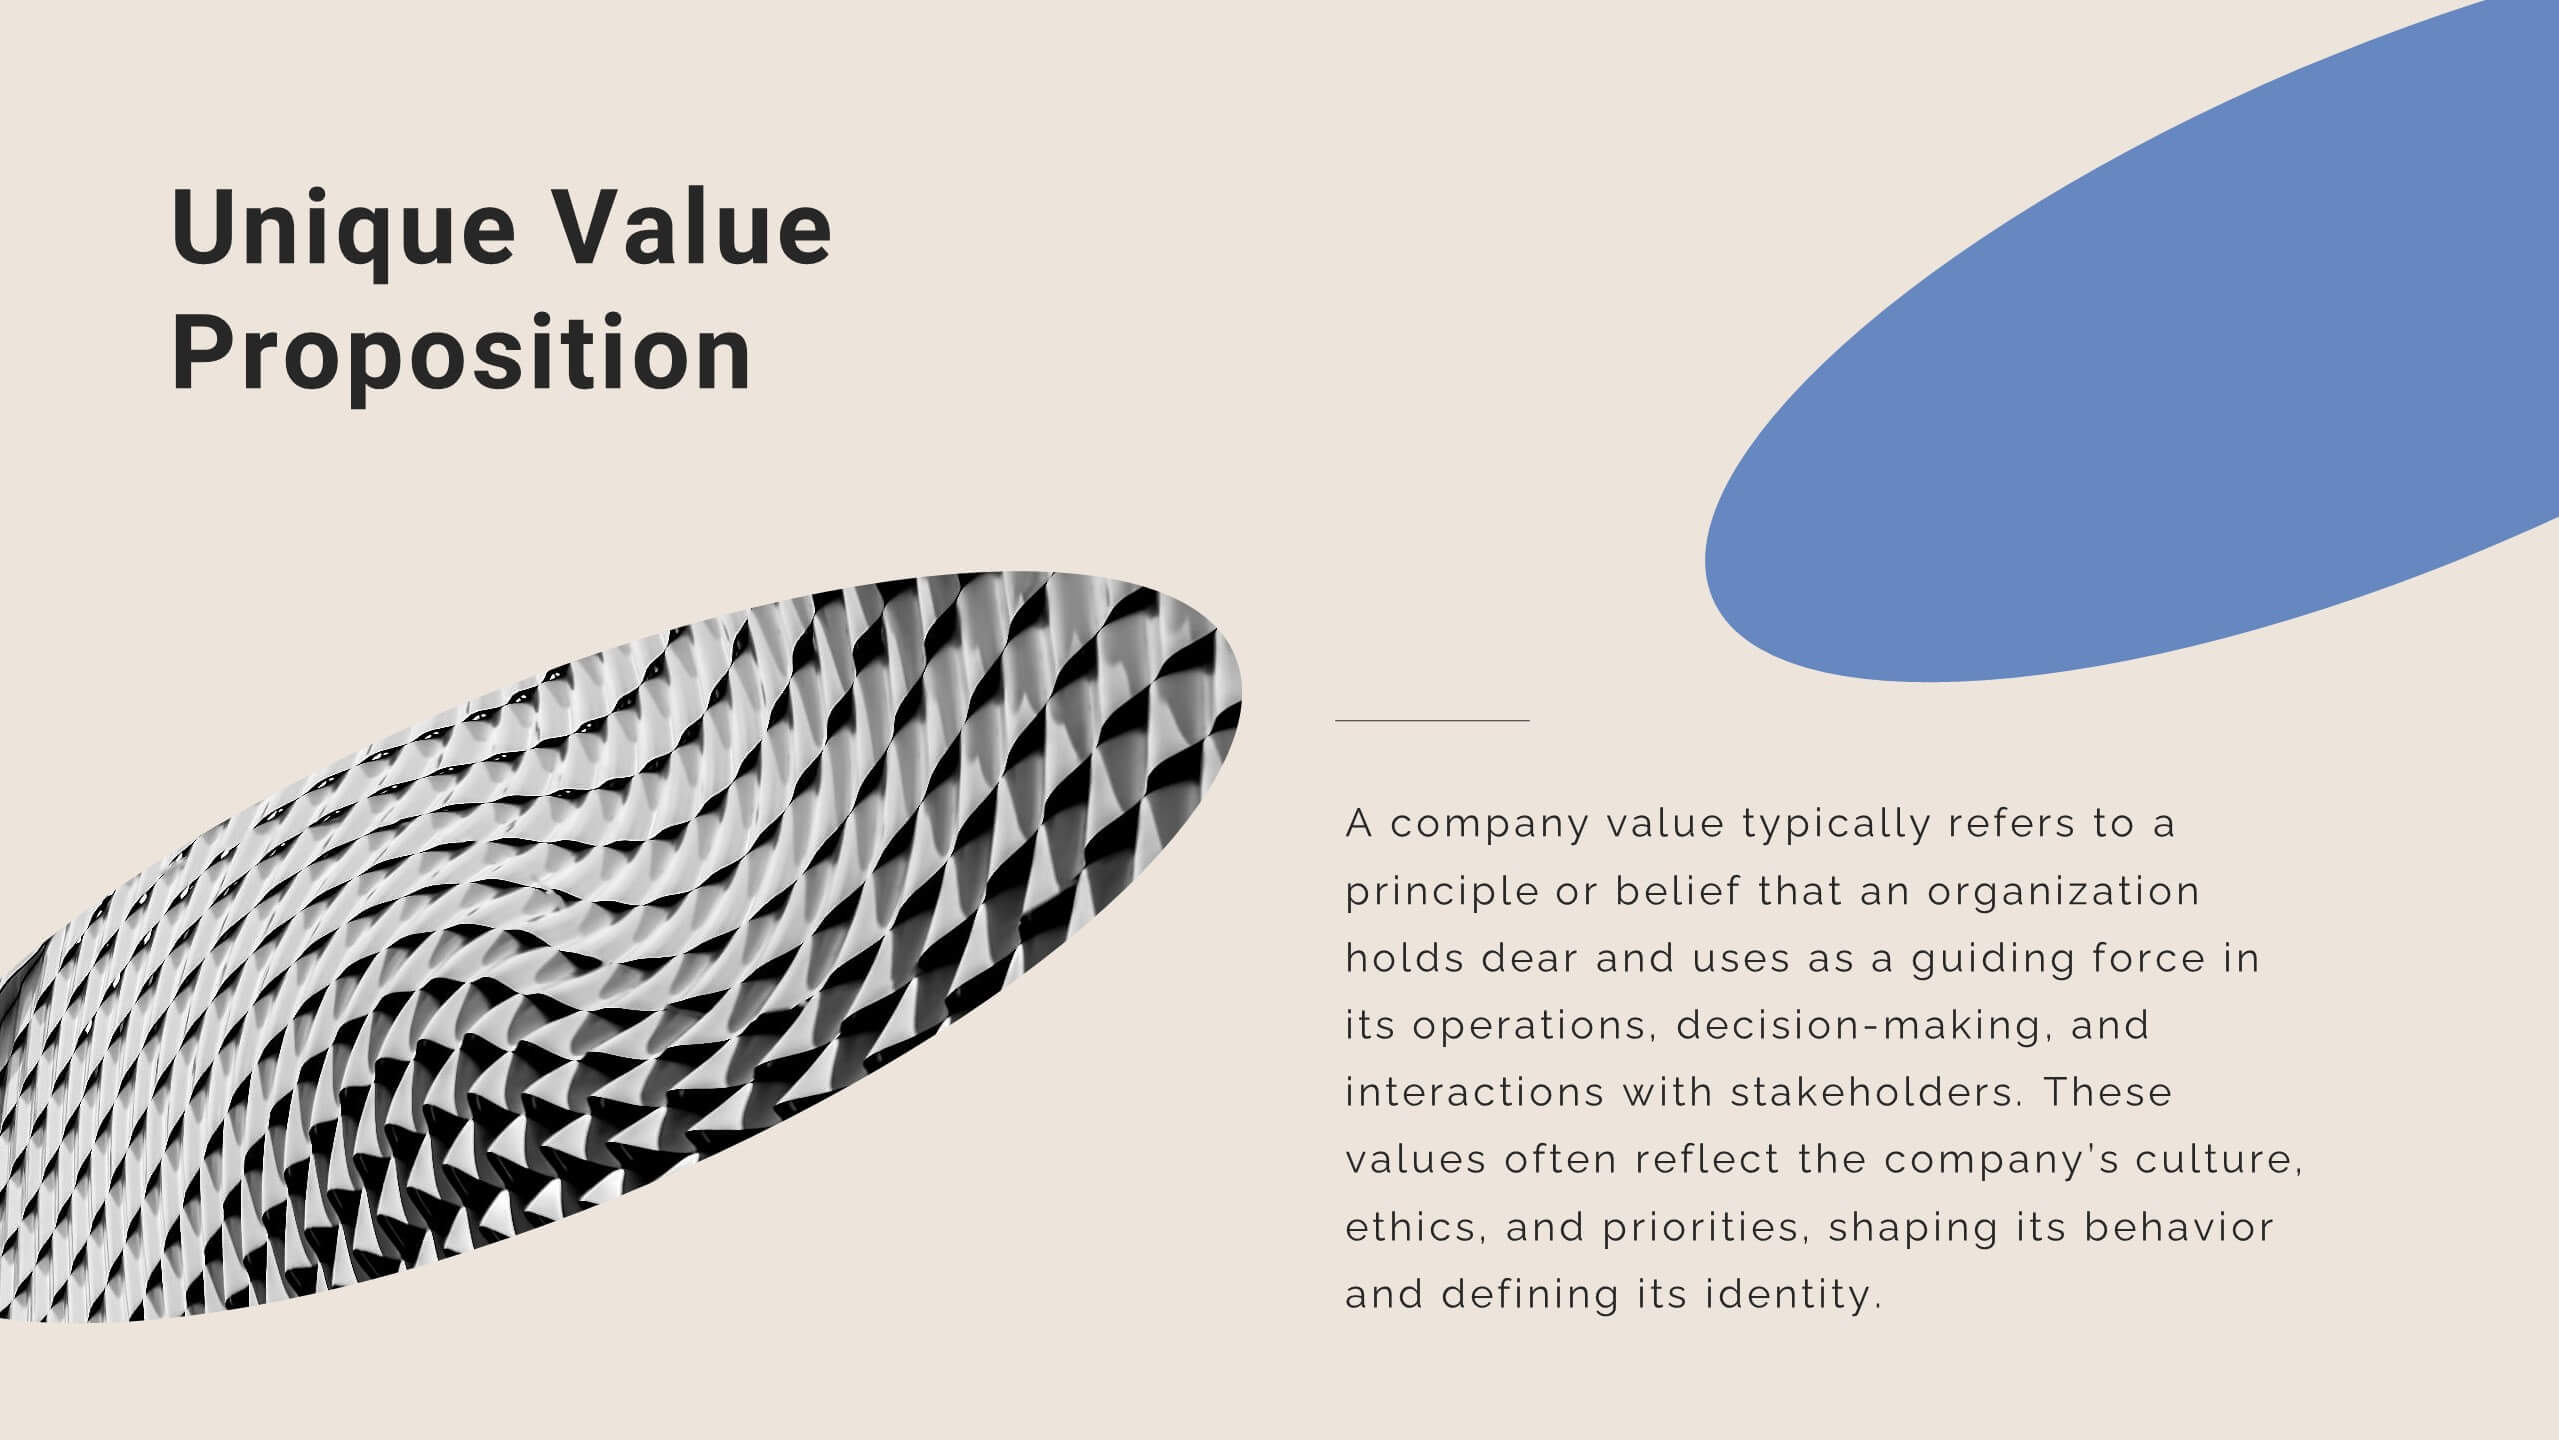
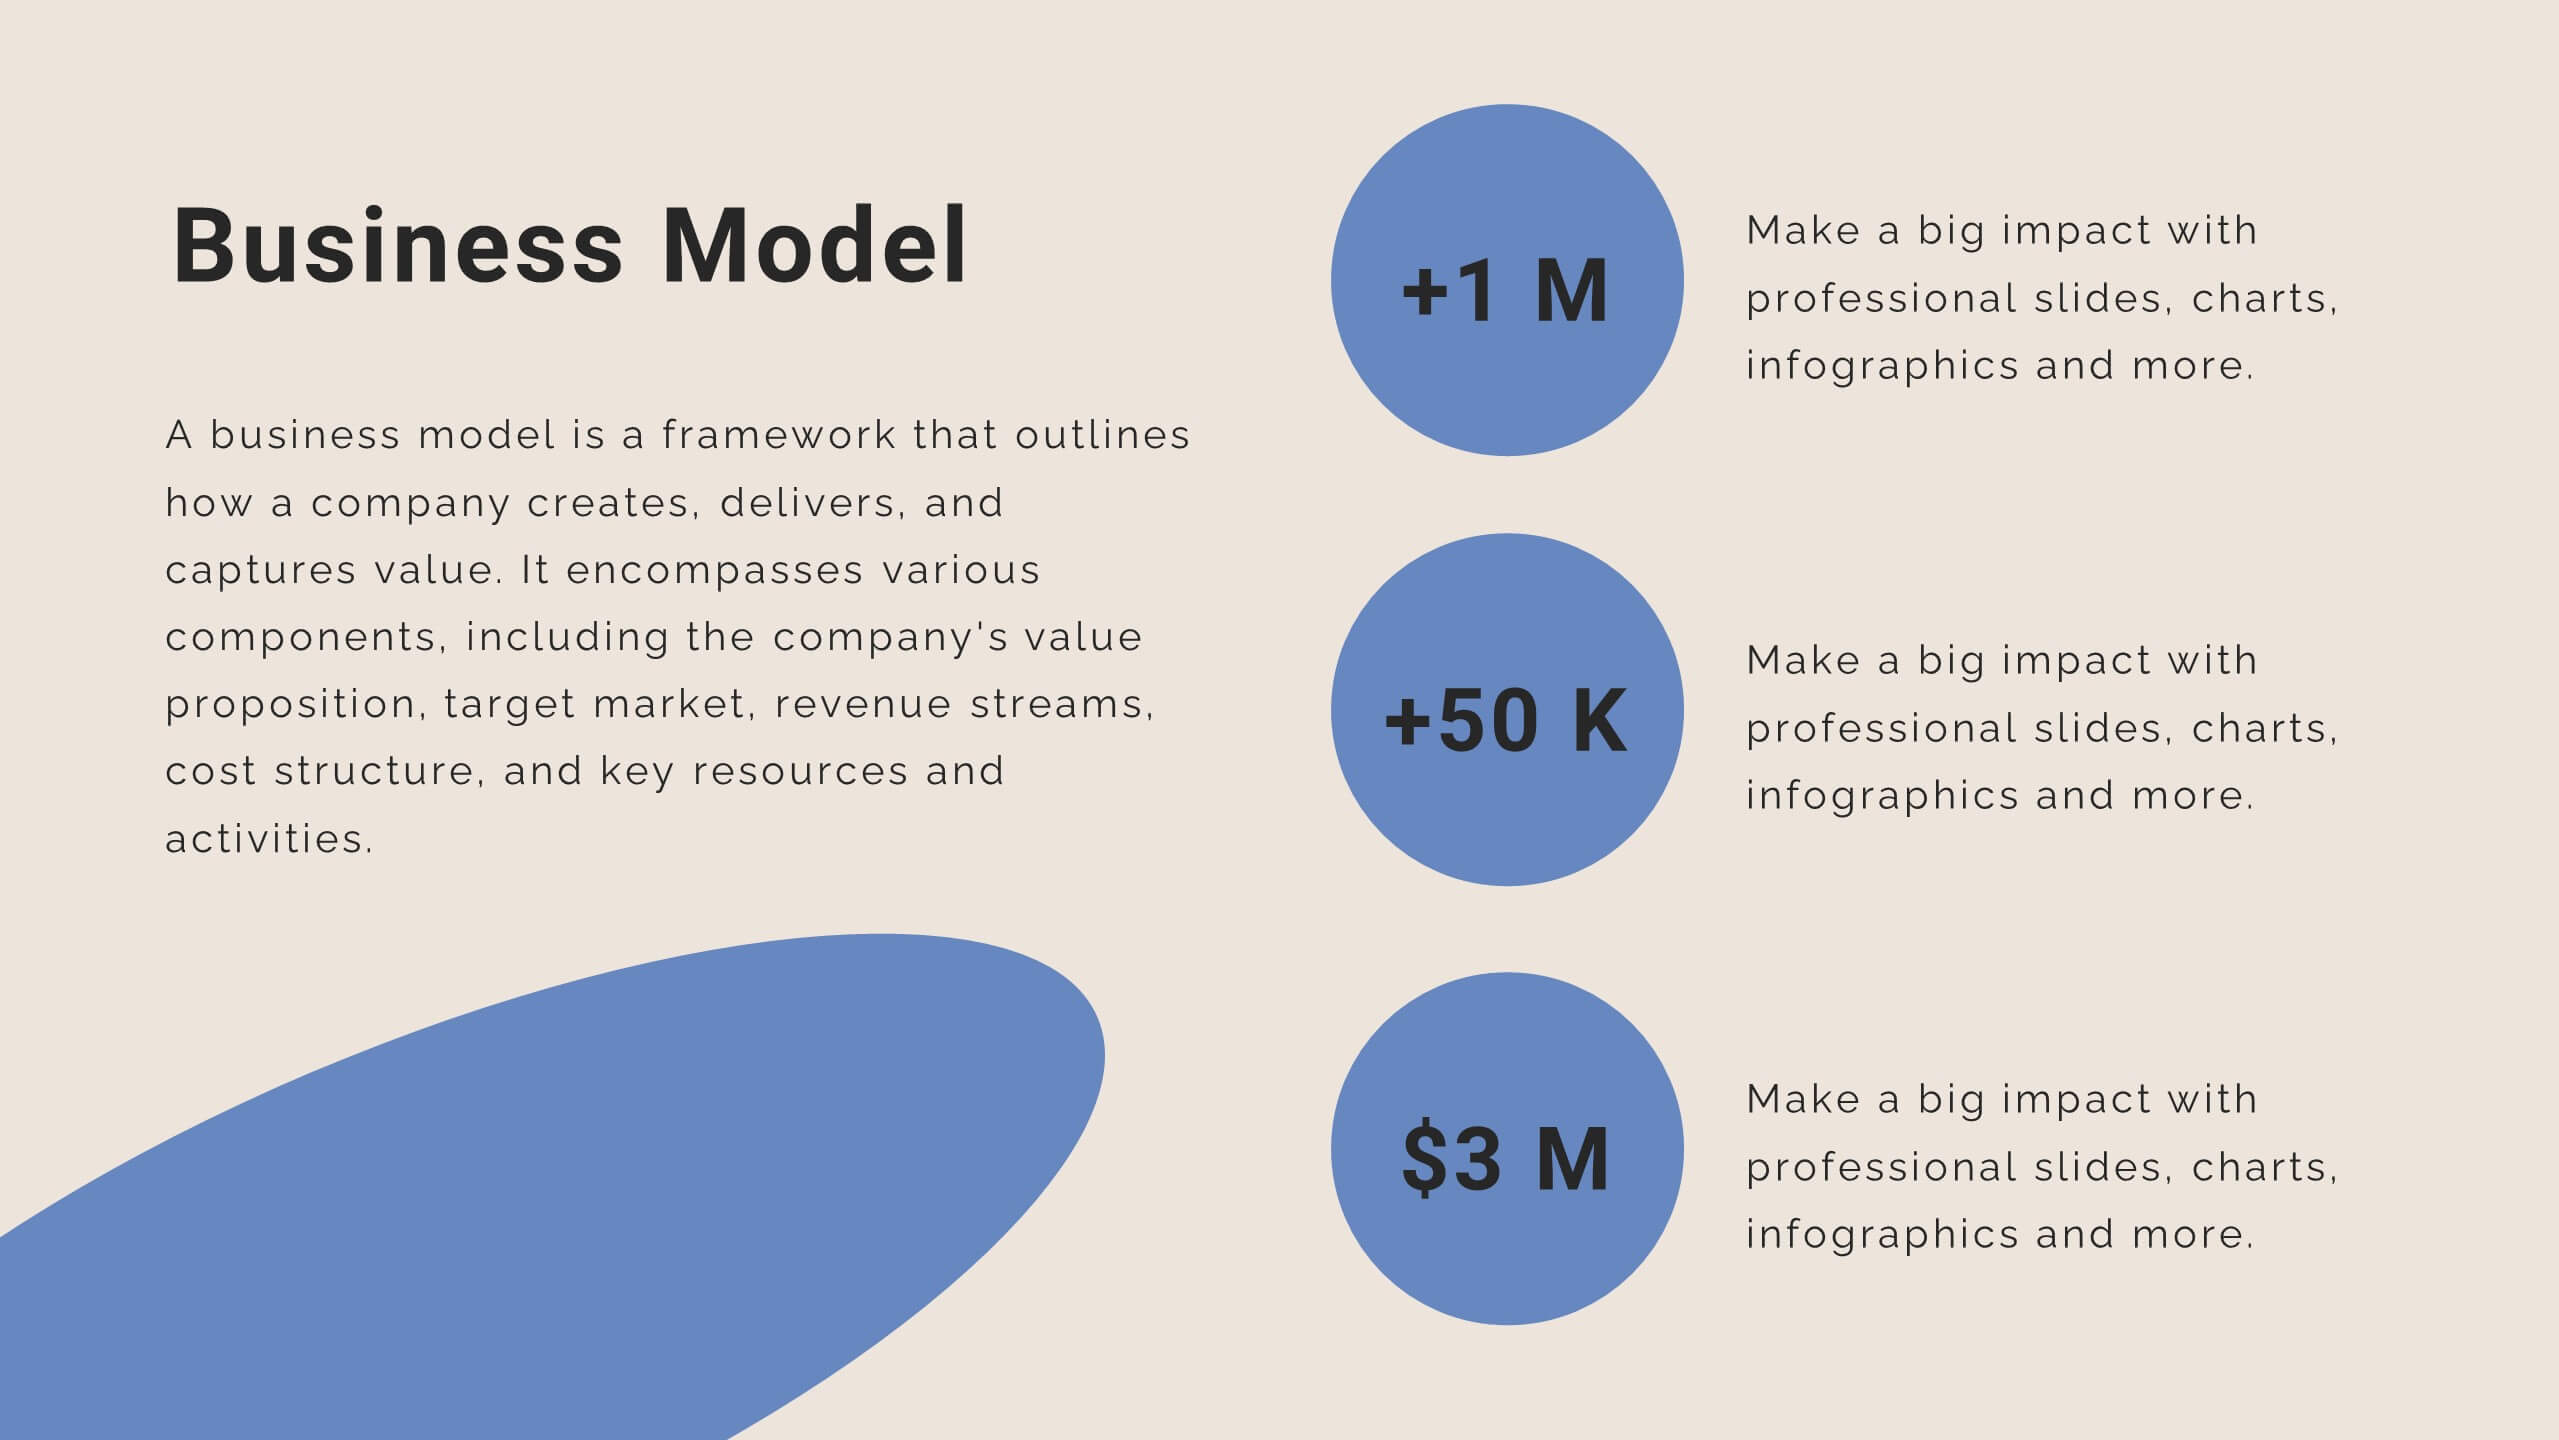
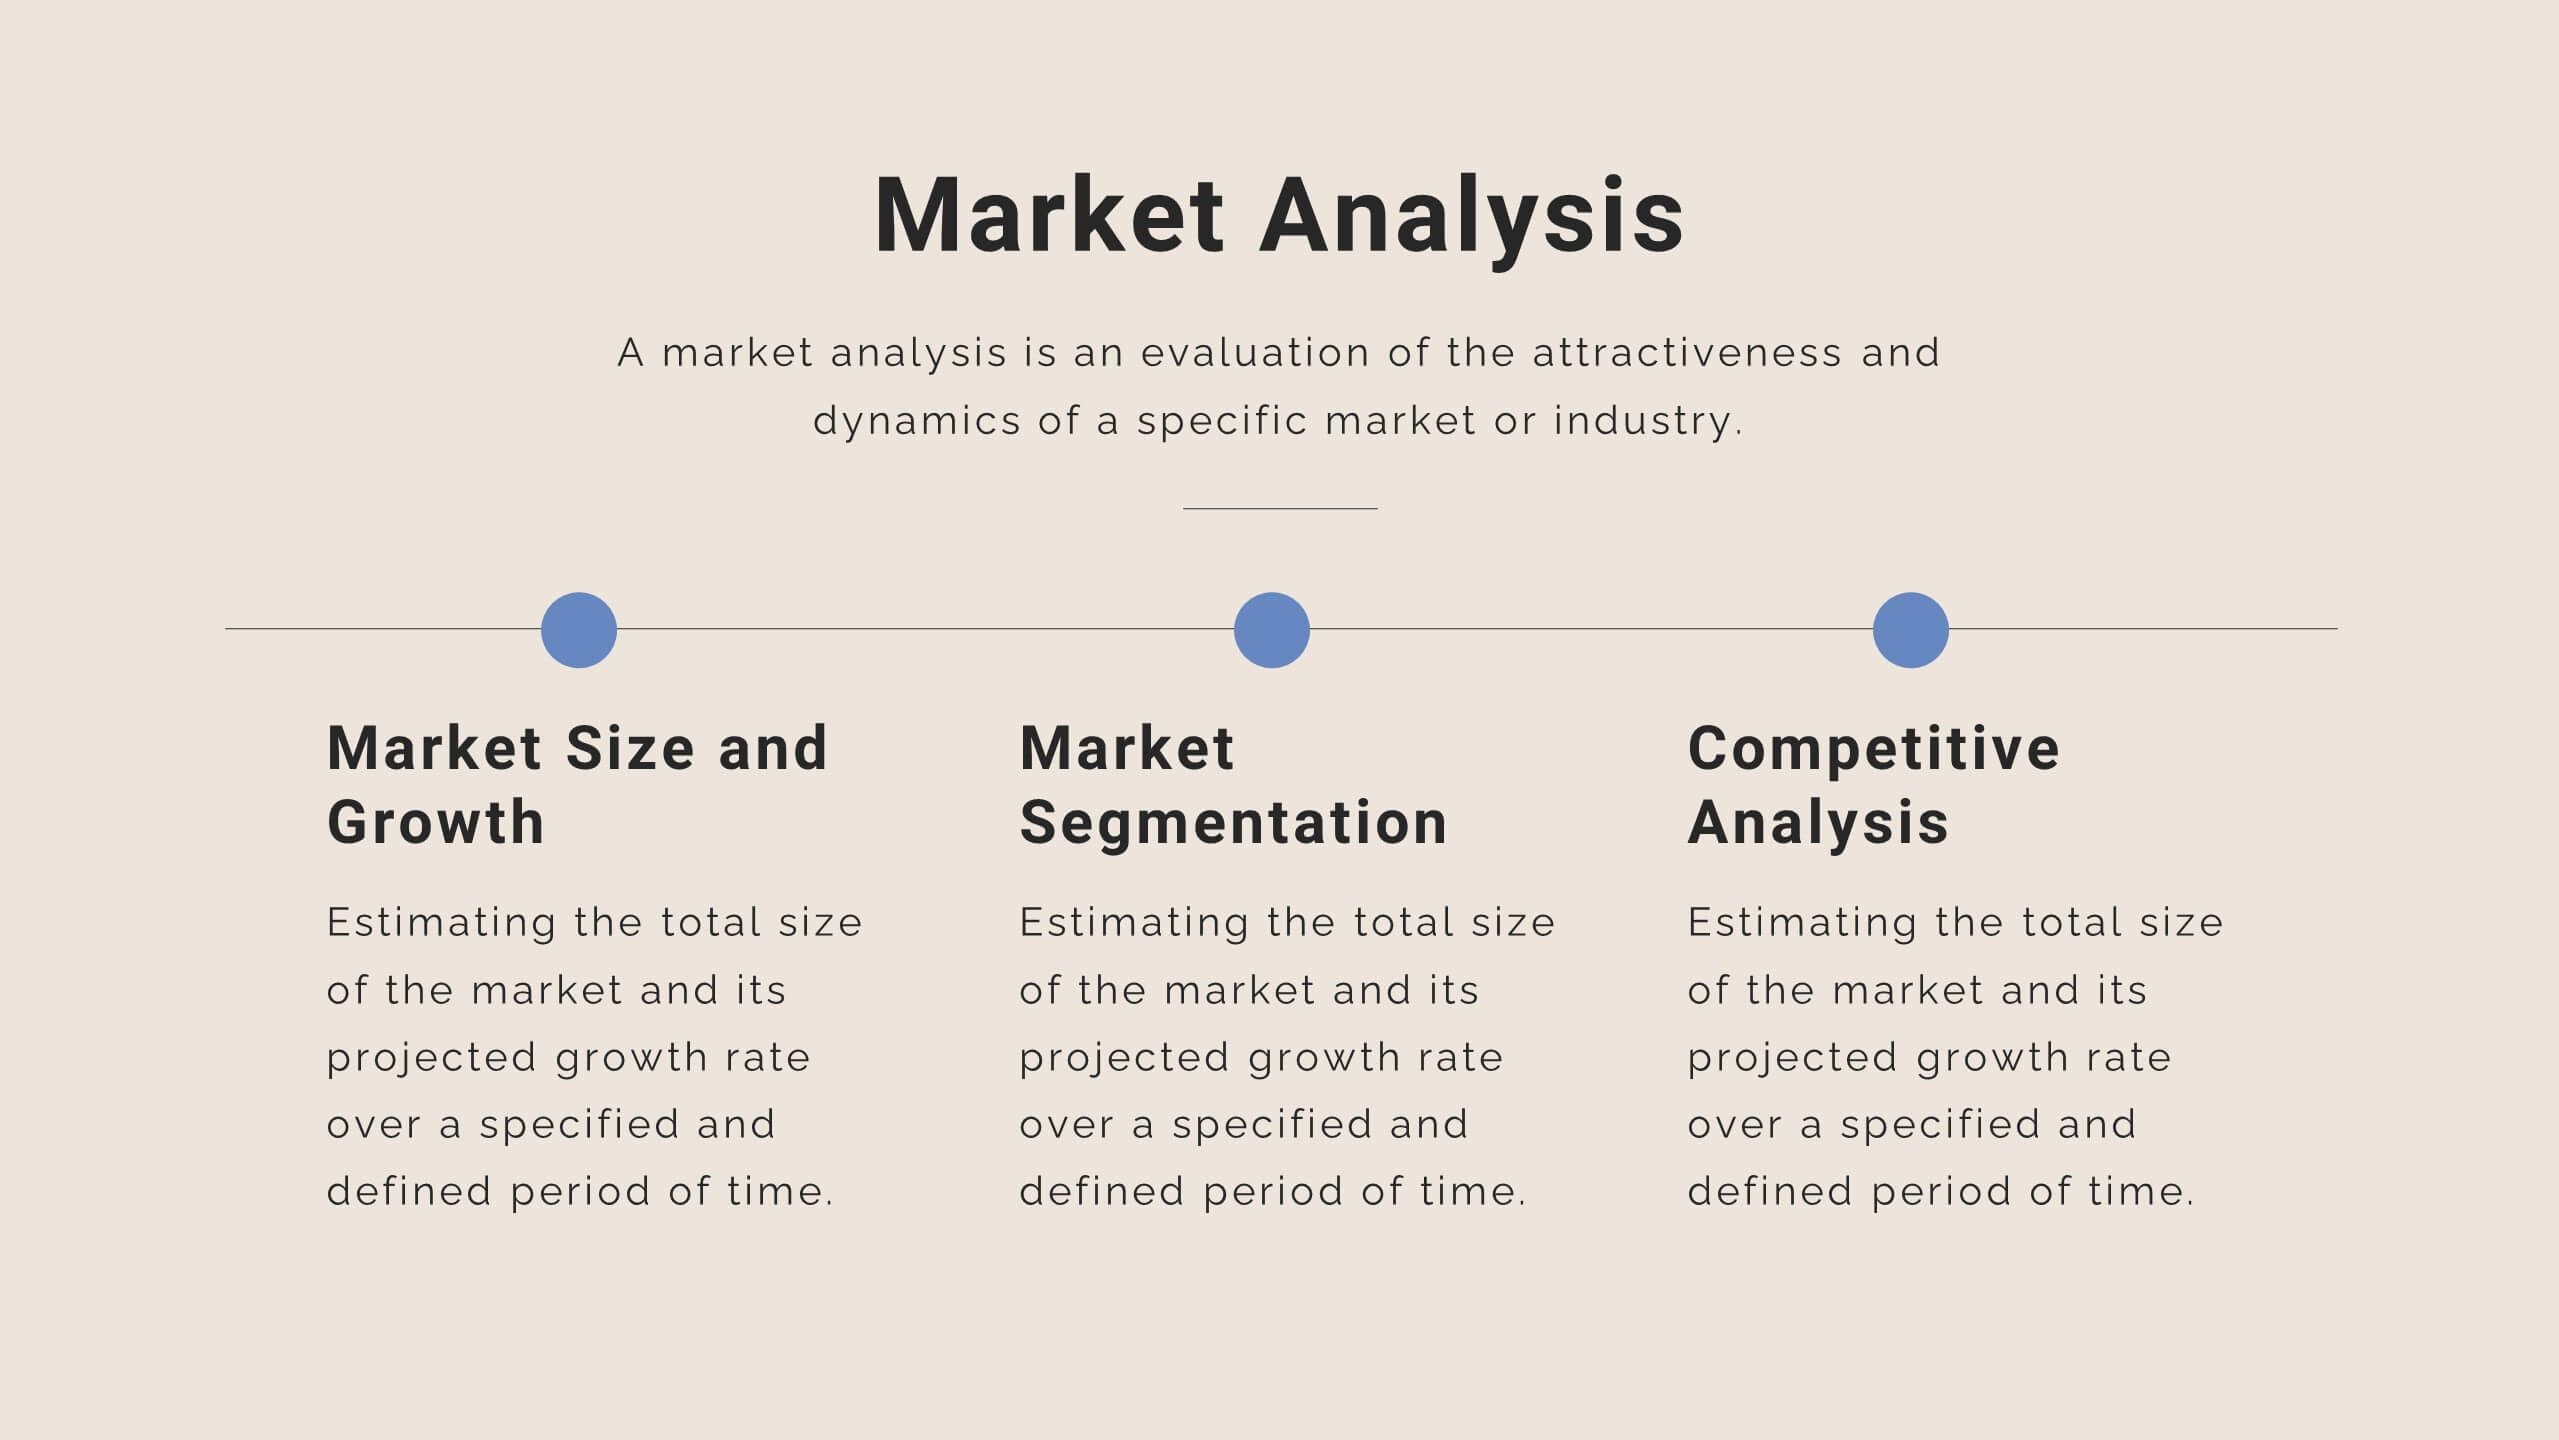
Mystic Startup Strategy Presentation
Launch your startup with confidence using this comprehensive funding proposal template! Perfect for showcasing your mission, vision, and business model to potential investors. Highlight your unique value proposition and growth plan with style. Compatible with PowerPoint, Keynote, and Google Slides, this template ensures your pitch stands out and secures the funding you need.


26 diapositivas
Boost Presentation Template
Our Boost Crossfit Gym Presentation is a great template for getting your target audience motivated. With it, you can create an attractive and informative presentation that contains the most relevant information about your business. This template has an appealing design that will help you convey your message in a professional and interesting way. Our template comes with a ton of customizable sections, which will help you achieve all your presentation goals. You can easily customize this template to match your brand, add some unique header slides and get your own unique style going!


7 diapositivas
AIDA Selling Model Infographic
The AIDA model is a widely used marketing and advertising framework that outlines the stages a consumer typically goes through when engaging with a product or service. This infographic template is a dynamic and compelling tool designed to conquer the attention and minds of your audience. AIDA, the cornerstone of marketing, stands for Attention, Interest, Desire, and Action—an unyielding formula for successful engagement. Fully customizable and compatible with Powerpoint, Keynote, and Google Slides. Prepare to take your marketing strategies to exhilarating heights with this infographic.


4 diapositivas
Sustainability in Water Conservation Presentation
Highlight your eco-initiatives with this visually engaging Sustainability in Water Conservation presentation. Featuring a puzzle-style water drop diagram, this slide helps communicate four core strategies or ideas clearly and effectively. The clean layout and modern icons ensure your message is both professional and impactful, making it ideal for presentations on sustainability goals, environmental education, or water-saving initiatives. Fully editable and compatible with PowerPoint, Keynote, and Google Slides.


12 diapositivas
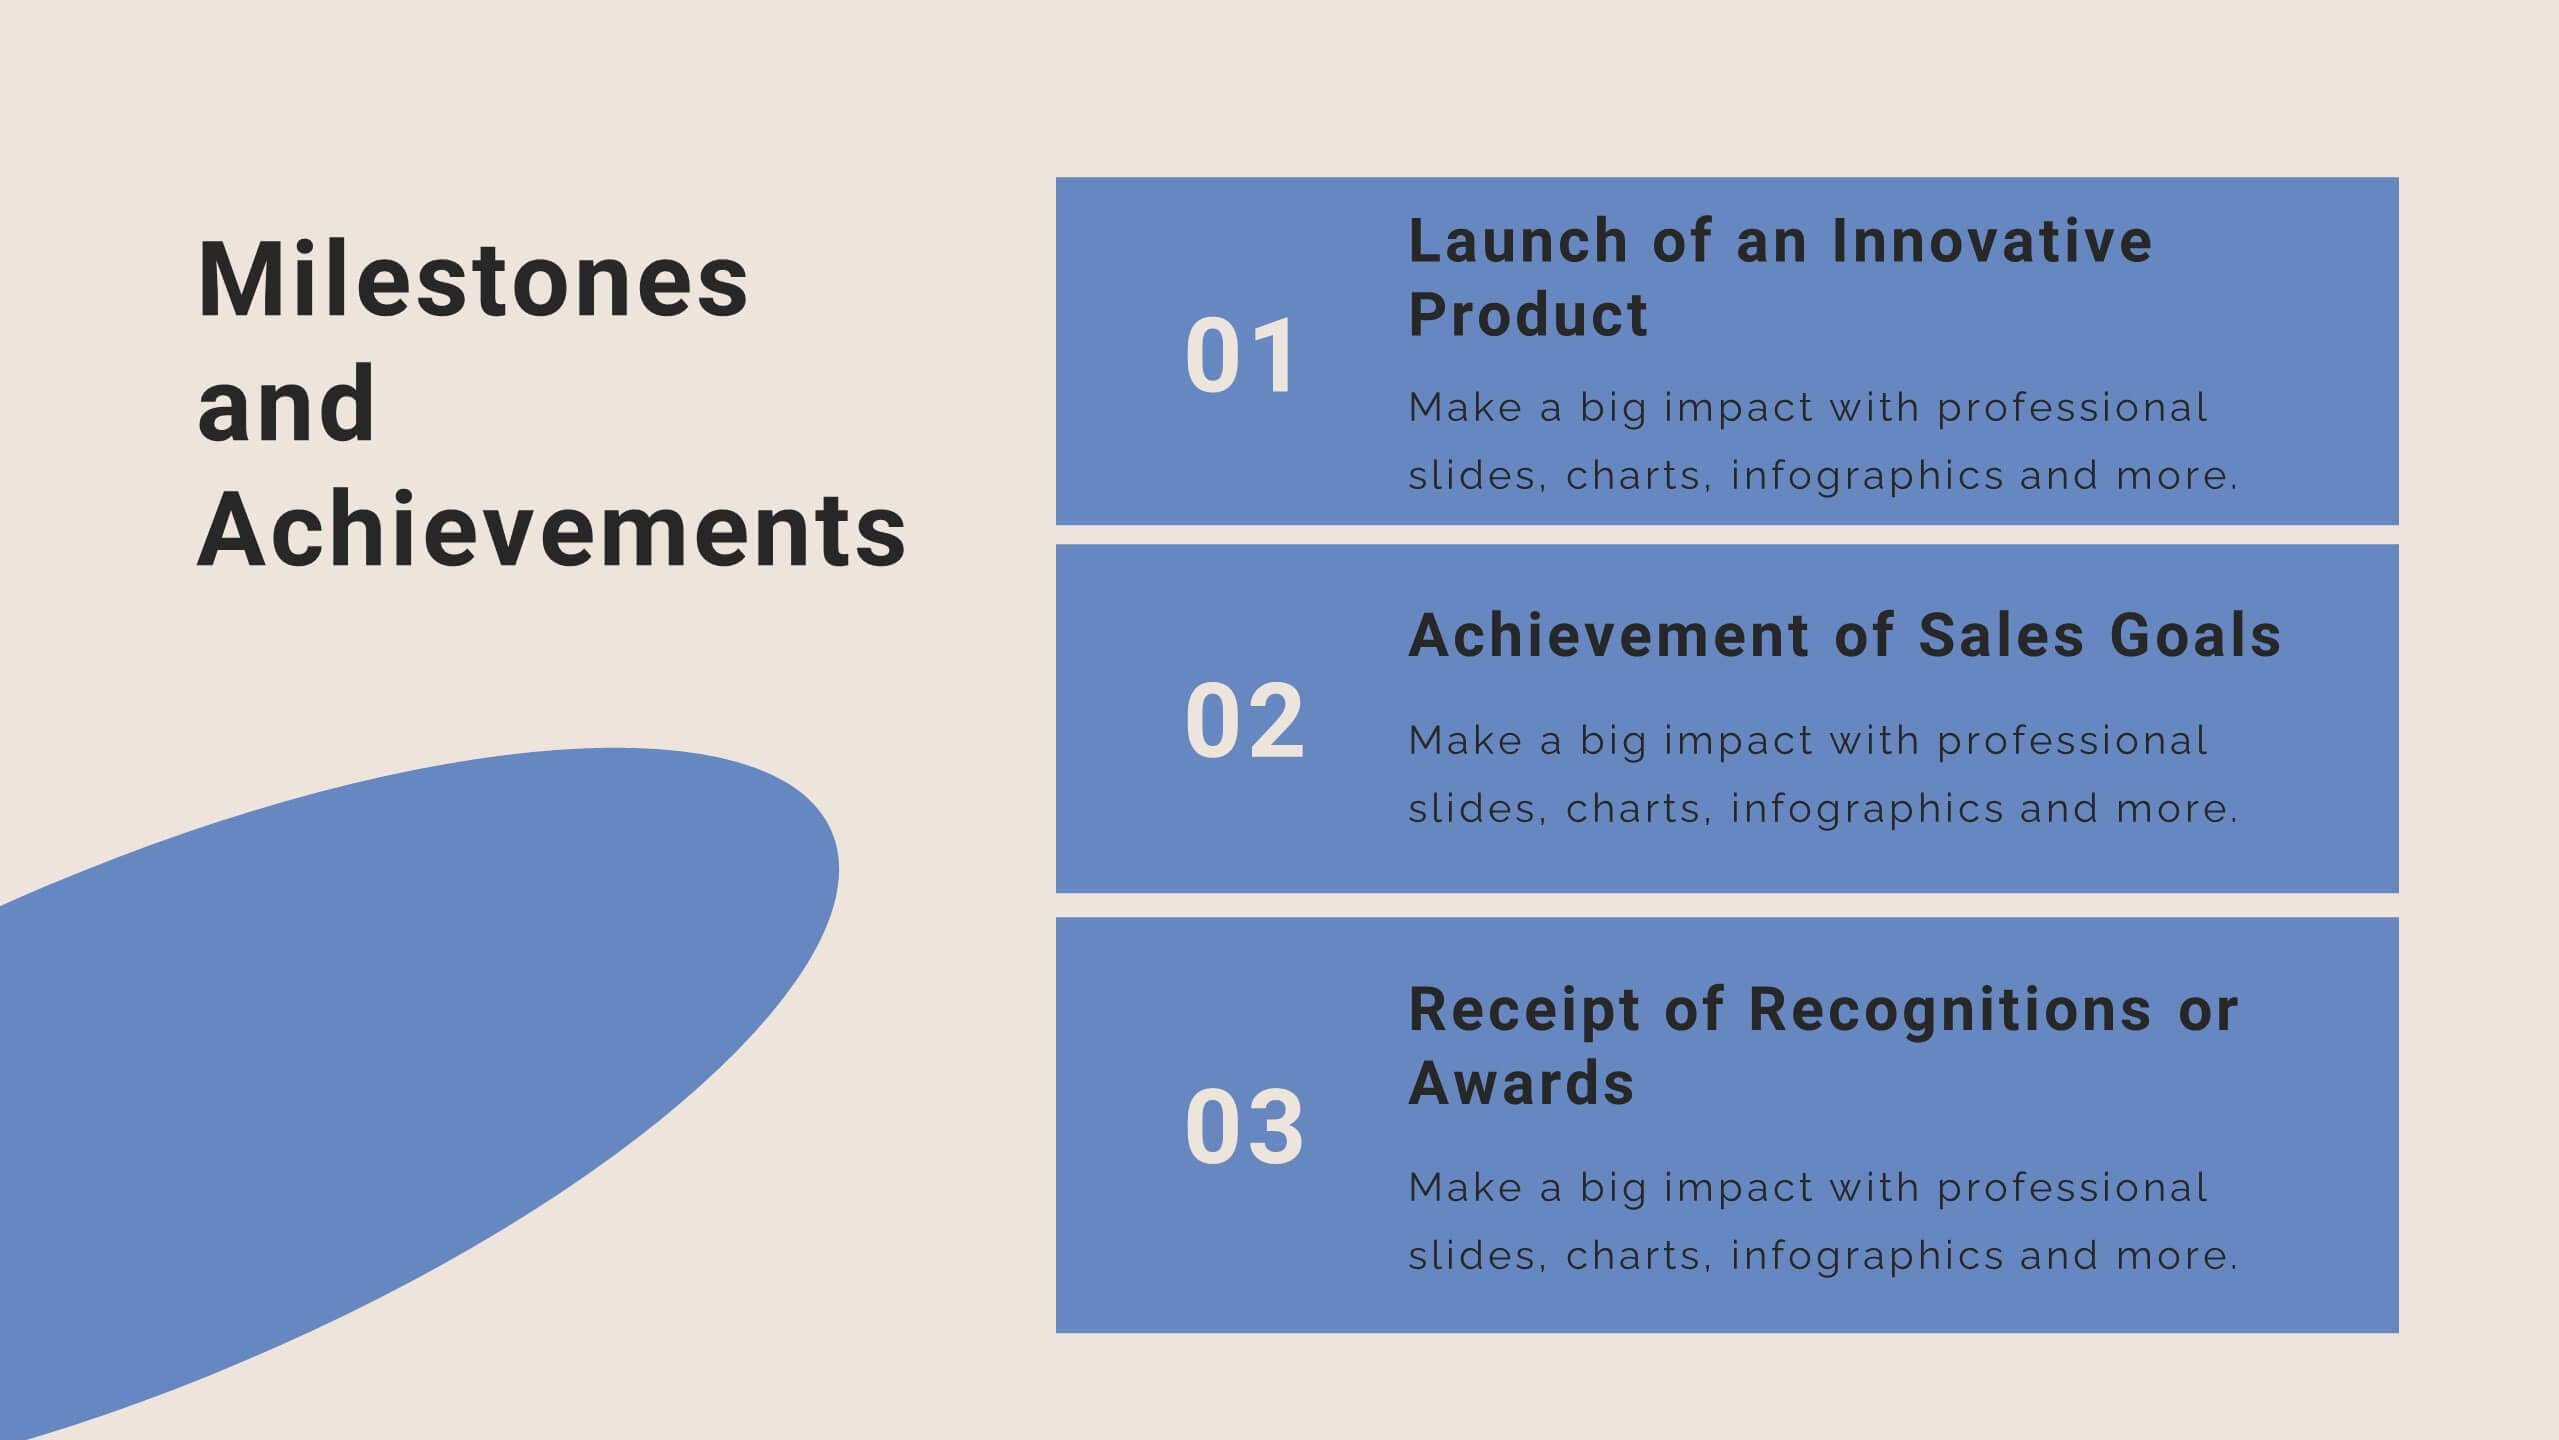
Milestone Achievement Progress Map Presentation
Visualize progress with clarity using this dynamic Milestone Achievement Progress Map. Each slide combines bar charts and upward arrows to showcase key accomplishments, performance phases, or goal tracking. With three customizable titles and color-coded segments, this layout is perfect for project updates, strategy reviews, or performance recaps. Fully editable in PowerPoint, Keynote, and Google Slides.


3 diapositivas
Transportation Services Workflow Presentation
Showcase your delivery process with clarity. This template tracks each transportation step—from port to truck to doorstep—with minimal, modern visuals and editable callouts. It’s perfect for workflow overviews, operations planning, or client onboarding. Use it in PowerPoint, Keynote, or Google Slides without losing style or structure.


4 diapositivas
Agricultural Market Trends Presentation
Highlight industry insights with this Agricultural Market Trends presentation template, featuring tractor and landscape graphics for a modern, rural-inspired look. Perfect for market reports, crop production analysis, or agribusiness proposals. Fully editable in Canva, PowerPoint, and Google Slides, allowing you to customize icons, text, and colors to match your brand.
8 diapositivas
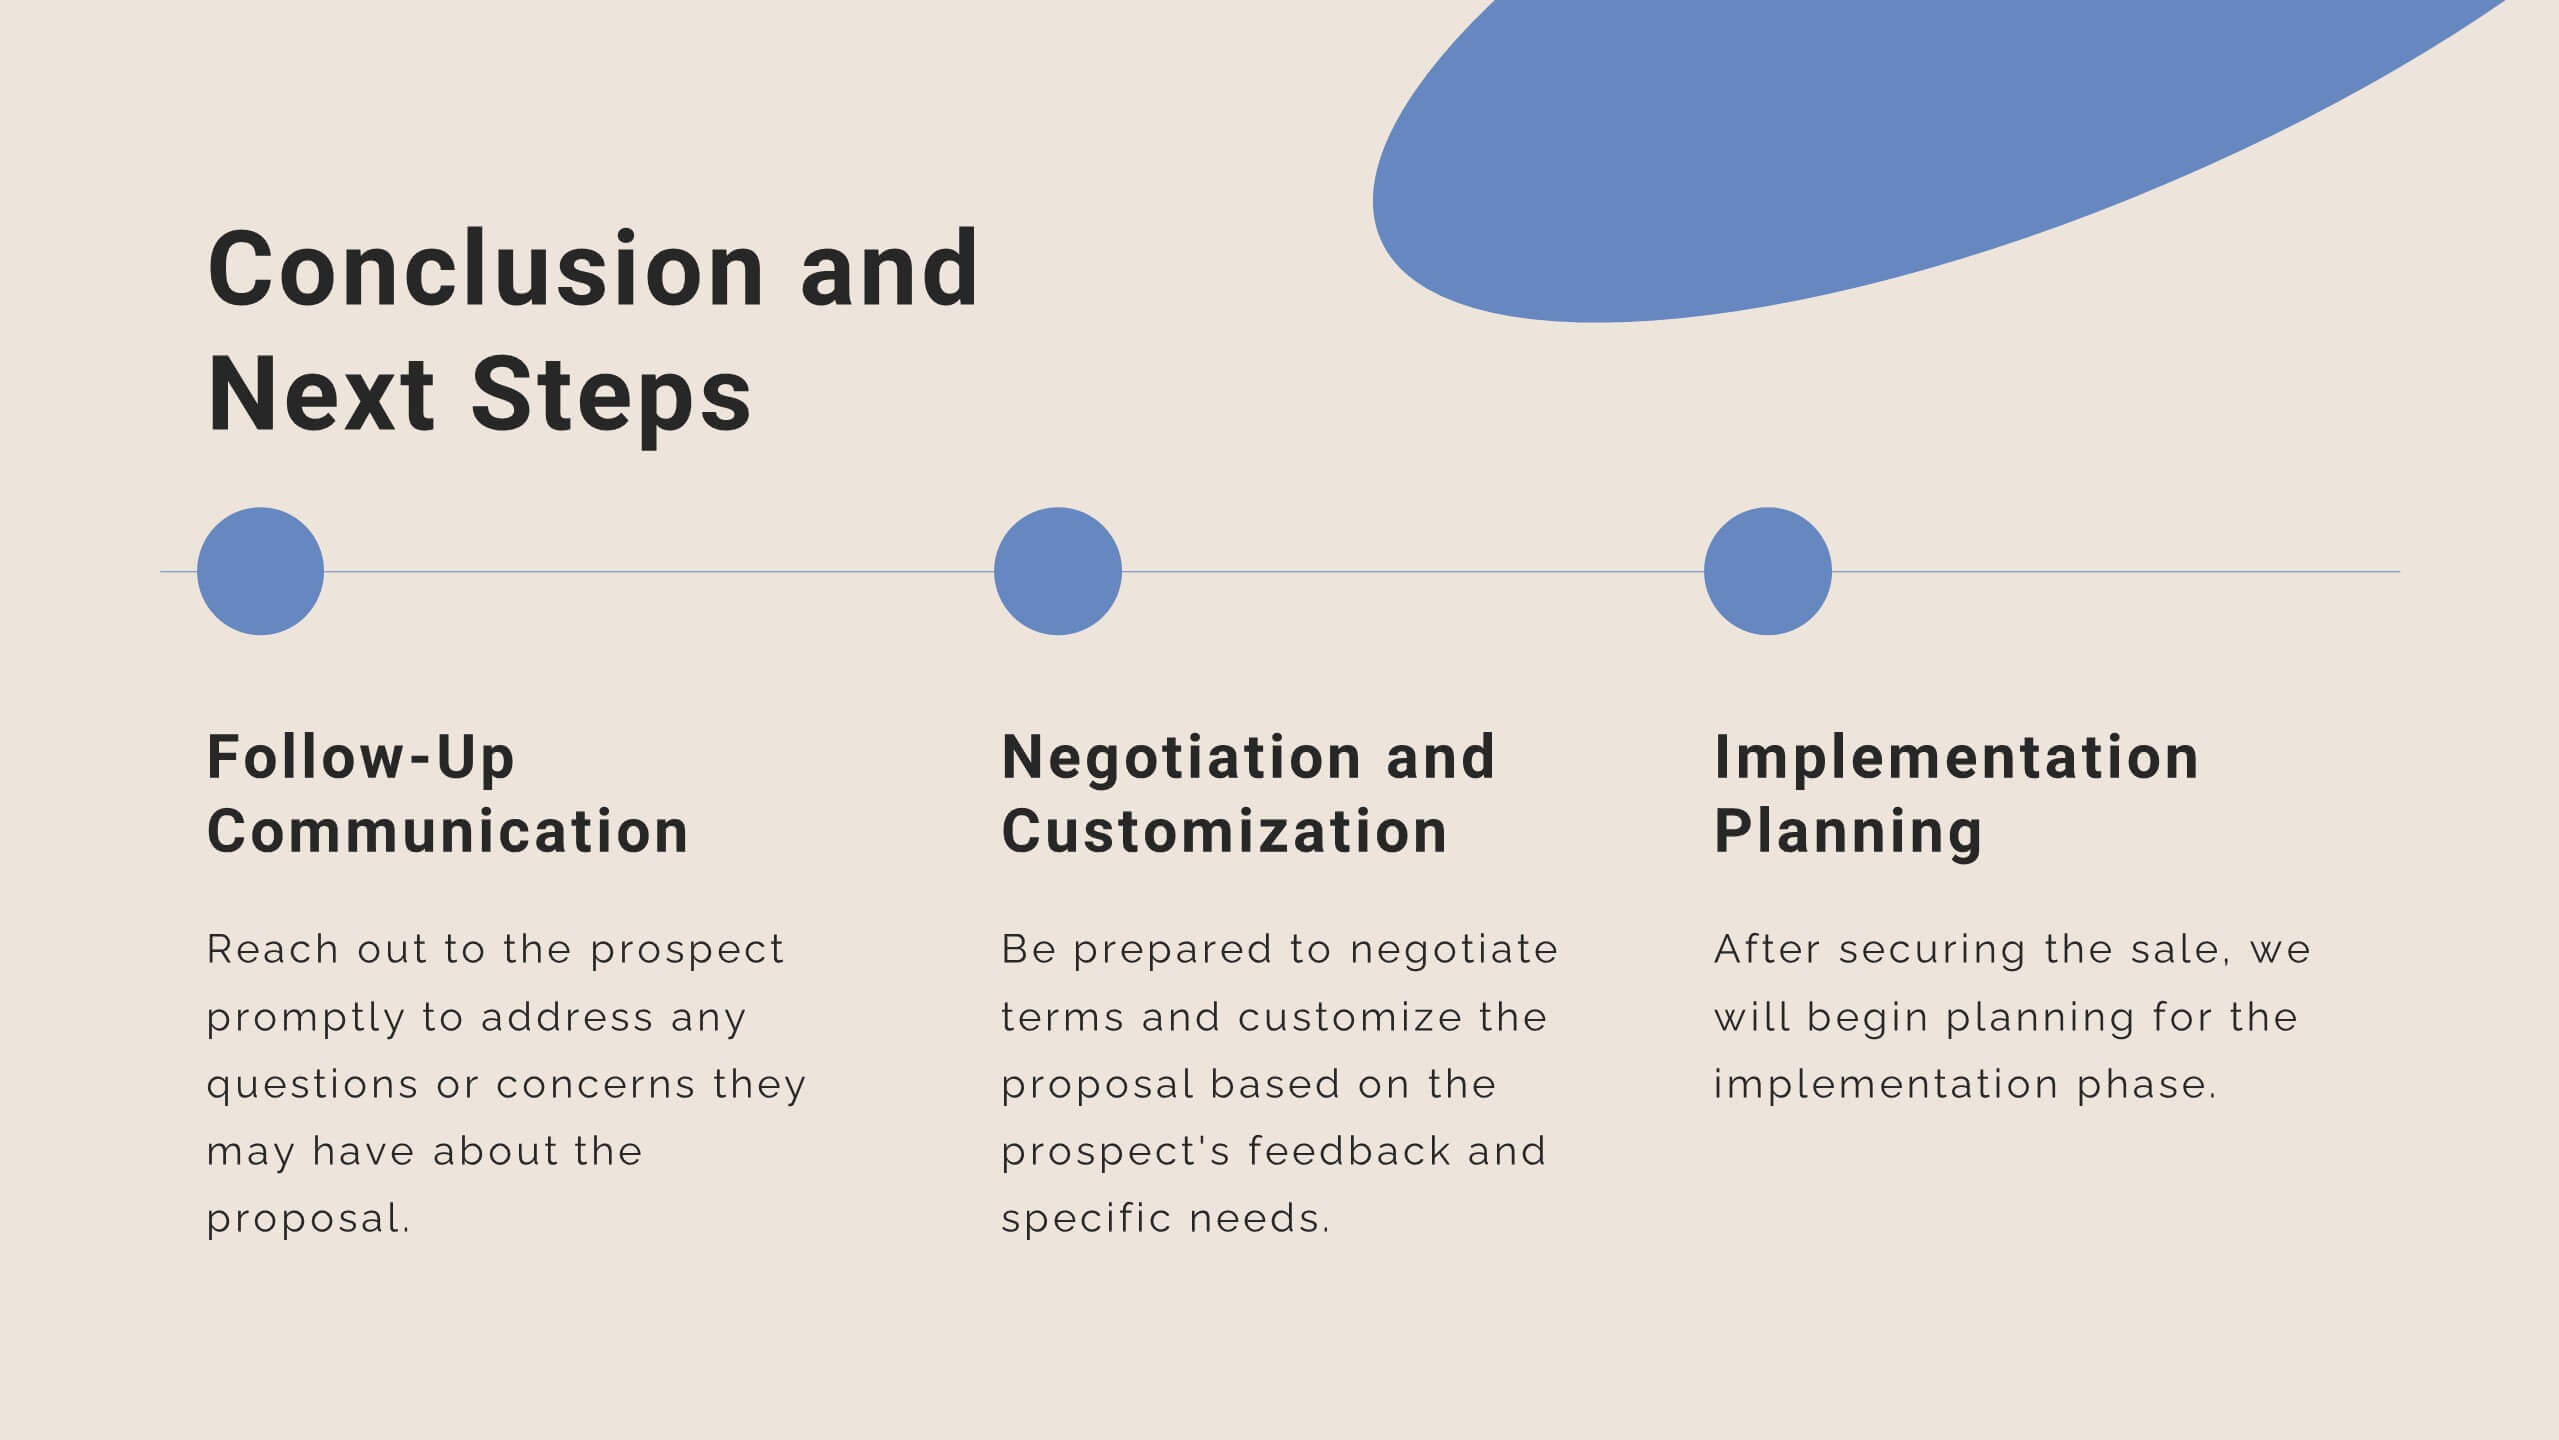
3-Step Arrow Diagram Presentation
Streamline your presentations with the 3-Step Arrow Diagram Presentation. Designed for process flows, strategic planning, and step-by-step guides, this visually engaging template simplifies complex ideas into clear, structured steps. Customize colors, text, and icons effortlessly to match your brand. Fully compatible with PowerPoint, Keynote, and Google Slides for seamless editing and professional results.


4 diapositivas
Project Responsibility Chart
Streamline team coordination with this Project Responsibility Chart. Clearly define who is Responsible, Accountable, Consulted, and Informed across key tasks. Ideal for project managers and team leads ensuring role clarity. Fully editable in PowerPoint, Keynote, and Google Slides.


5 diapositivas
Corporate Messaging Strategy Presentation
Clarify your company’s voice with this corporate messaging strategy slide. Designed to outline your core communication pillars, this layout helps you present messaging priorities across different channels or audiences. Perfect for marketing teams, branding sessions, or executive briefings. Fully editable in Canva, PowerPoint, and Google Slides for quick customization.


6 diapositivas
Tourism and Hospitality Industry Trends Presentation
Visually map out emerging trends with this engaging circular infographic layout. This slide features six labeled segments connected to a central tourism icon, ideal for highlighting key industry insights, traveler behavior shifts, or hospitality service updates. Sleek and professional, it's perfect for travel agencies, hotel chains, or tourism reports. Fully customizable in PowerPoint, Keynote, and Google Slides.


21 diapositivas
Argentis UX Strategy Plan Presentation
Craft a seamless user experience with this professional UX strategy plan presentation. Covering key topics like user research, interaction design, wireframes, and accessibility considerations, this template helps you present a structured and insightful design approach. Fully customizable and compatible with PowerPoint, Keynote, and Google Slides for a smooth and impactful presentation.


7 diapositivas
Veterinary Medical Center Infographic
Dive into the world of animal healthcare with our comprehensive veterinary medical center infographic. Infused with refreshing shades of green, blue, and white, this template provides a clear snapshot of veterinary services, pet care essentials, and more. Designed especially for veterinarians, pet care professionals, and educators, its captivating graphics and icons make complex medical topics more digestible and engaging. With adorable pet-themed elements, it ensures audiences instantly connect with the content. Perfect for presentations, workshops, and seminars, it's optimized for PowerPoint, Keynote, and Google Slides, making information dissemination both appealing and efficient.


7 diapositivas
Medical Insurance Infographic
The Medical Insurance Infographic provides a clear and concise visualization of insurance policy features, coverage details, and benefits. Ideal for insurance companies, healthcare professionals, and policyholders, this infographic simplifies complex insurance information into digestible segments. With a clean and professional design, the infographic outlines key insurance concepts such as premium rates, deductibles, copayments, and coverage limits. It also offers a visual comparison of different plans, aiding customers in making informed decisions regarding their healthcare coverage. Customizable for different audiences, this SEO-optimized infographic can be used on websites, in marketing materials, or during consultations to enhance understanding of medical insurance options. Employ our Medical Insurance Infographic to effectively communicate the value of insurance plans and help individuals navigate their healthcare needs with confidence.


5 diapositivas
5G Use Cases and Industry Applications Presentation
Unlock the possibilities of next-generation connectivity with a clear, visual explainer designed to showcase how different industries benefit from faster, smarter networks. This presentation breaks down key applications, technology shifts, and real-world 5G impact in an easy, engaging format. Fully compatible with PowerPoint, Keynote, and Google Slides.


5 diapositivas
Customer Relationship Strategy Presentation
Refine your approach to customer interactions with the "Customer Relationship Strategy" presentation templates. Perfect for delineating clear, actionable strategies to enhance client engagement and satisfaction, these templates are a must-have for businesses focused on building lasting customer relationships. Compatible with PowerPoint, Keynote, and Google Slides, they provide the tools to effectively communicate your customer relationship policies and goals.


5 diapositivas
Building Timeline Presentation
Bring structure and progress to your ideas with this visually engaging presentation design. Ideal for showcasing project milestones, construction phases, or business growth timelines, it helps you communicate progress clearly and professionally. Fully customizable and compatible with PowerPoint, Keynote, and Google Slides for seamless presentation editing and delivery.