


Características


¿Tienes alguna pregunta?
Recomendar
7 diapositivas
Arrow Infographic Presentation Template
Arrow Infographics are a great tool to visualize changes, positioning and processes. You can use the arrows to show the direction of your startup or to explain the stages of a business plan. Present your strategies, stages, and plans in a clear & concise way. Use this arrow Infographic template to present complex topics. Arrows are great for highlighting the progress of a project and its relationship with other projects. Use this template to visualize the process of a business strategy. This Arrow Infographic Template gives you all the essentials you need when it comes to creating your own.


7 diapositivas
Business Structure Infographic
Understanding a business's organizational structure is pivotal for effective operations, strategy, and growth. Our business structure infographic, colored in shades of blue, white, green, and yellow, lays out these intricacies in a visually compelling manner. Whether you're showcasing hierarchies, operational roles, or departmental divides, this infographic captures it all. Tailored for business students, entrepreneurs, and corporate trainers, this tool simplifies complex concepts. Seamlessly integrated with PowerPoint, Keynote, and Google Slides, it provides a dynamic aid to ensure your presentations are both enlightening and engaging.


20 diapositivas
Celestique Photography Portfolio Template Presentation
This Photography Portfolio Presentation offers a sleek and modern design to showcase your work professionally. Featuring sections for project highlights, creative process, client testimonials, and pricing, it's fully customizable and easy to edit in PowerPoint, Keynote, and Google Slides. Perfect for photographers looking to impress potential clients.


6 diapositivas
Market Trends and Insights Year in Review Presentation
Analyze seasonal shifts with clarity using the Market Trends and Insights Year in Review Presentation. This quarterly layout lets you break down key trends, data, and highlights by month, helping stakeholders visualize market behavior throughout the year. Ideal for analysts, marketers, and strategy teams. Fully customizable and works seamlessly with PowerPoint, Keynote, and Google Slides.


22 diapositivas
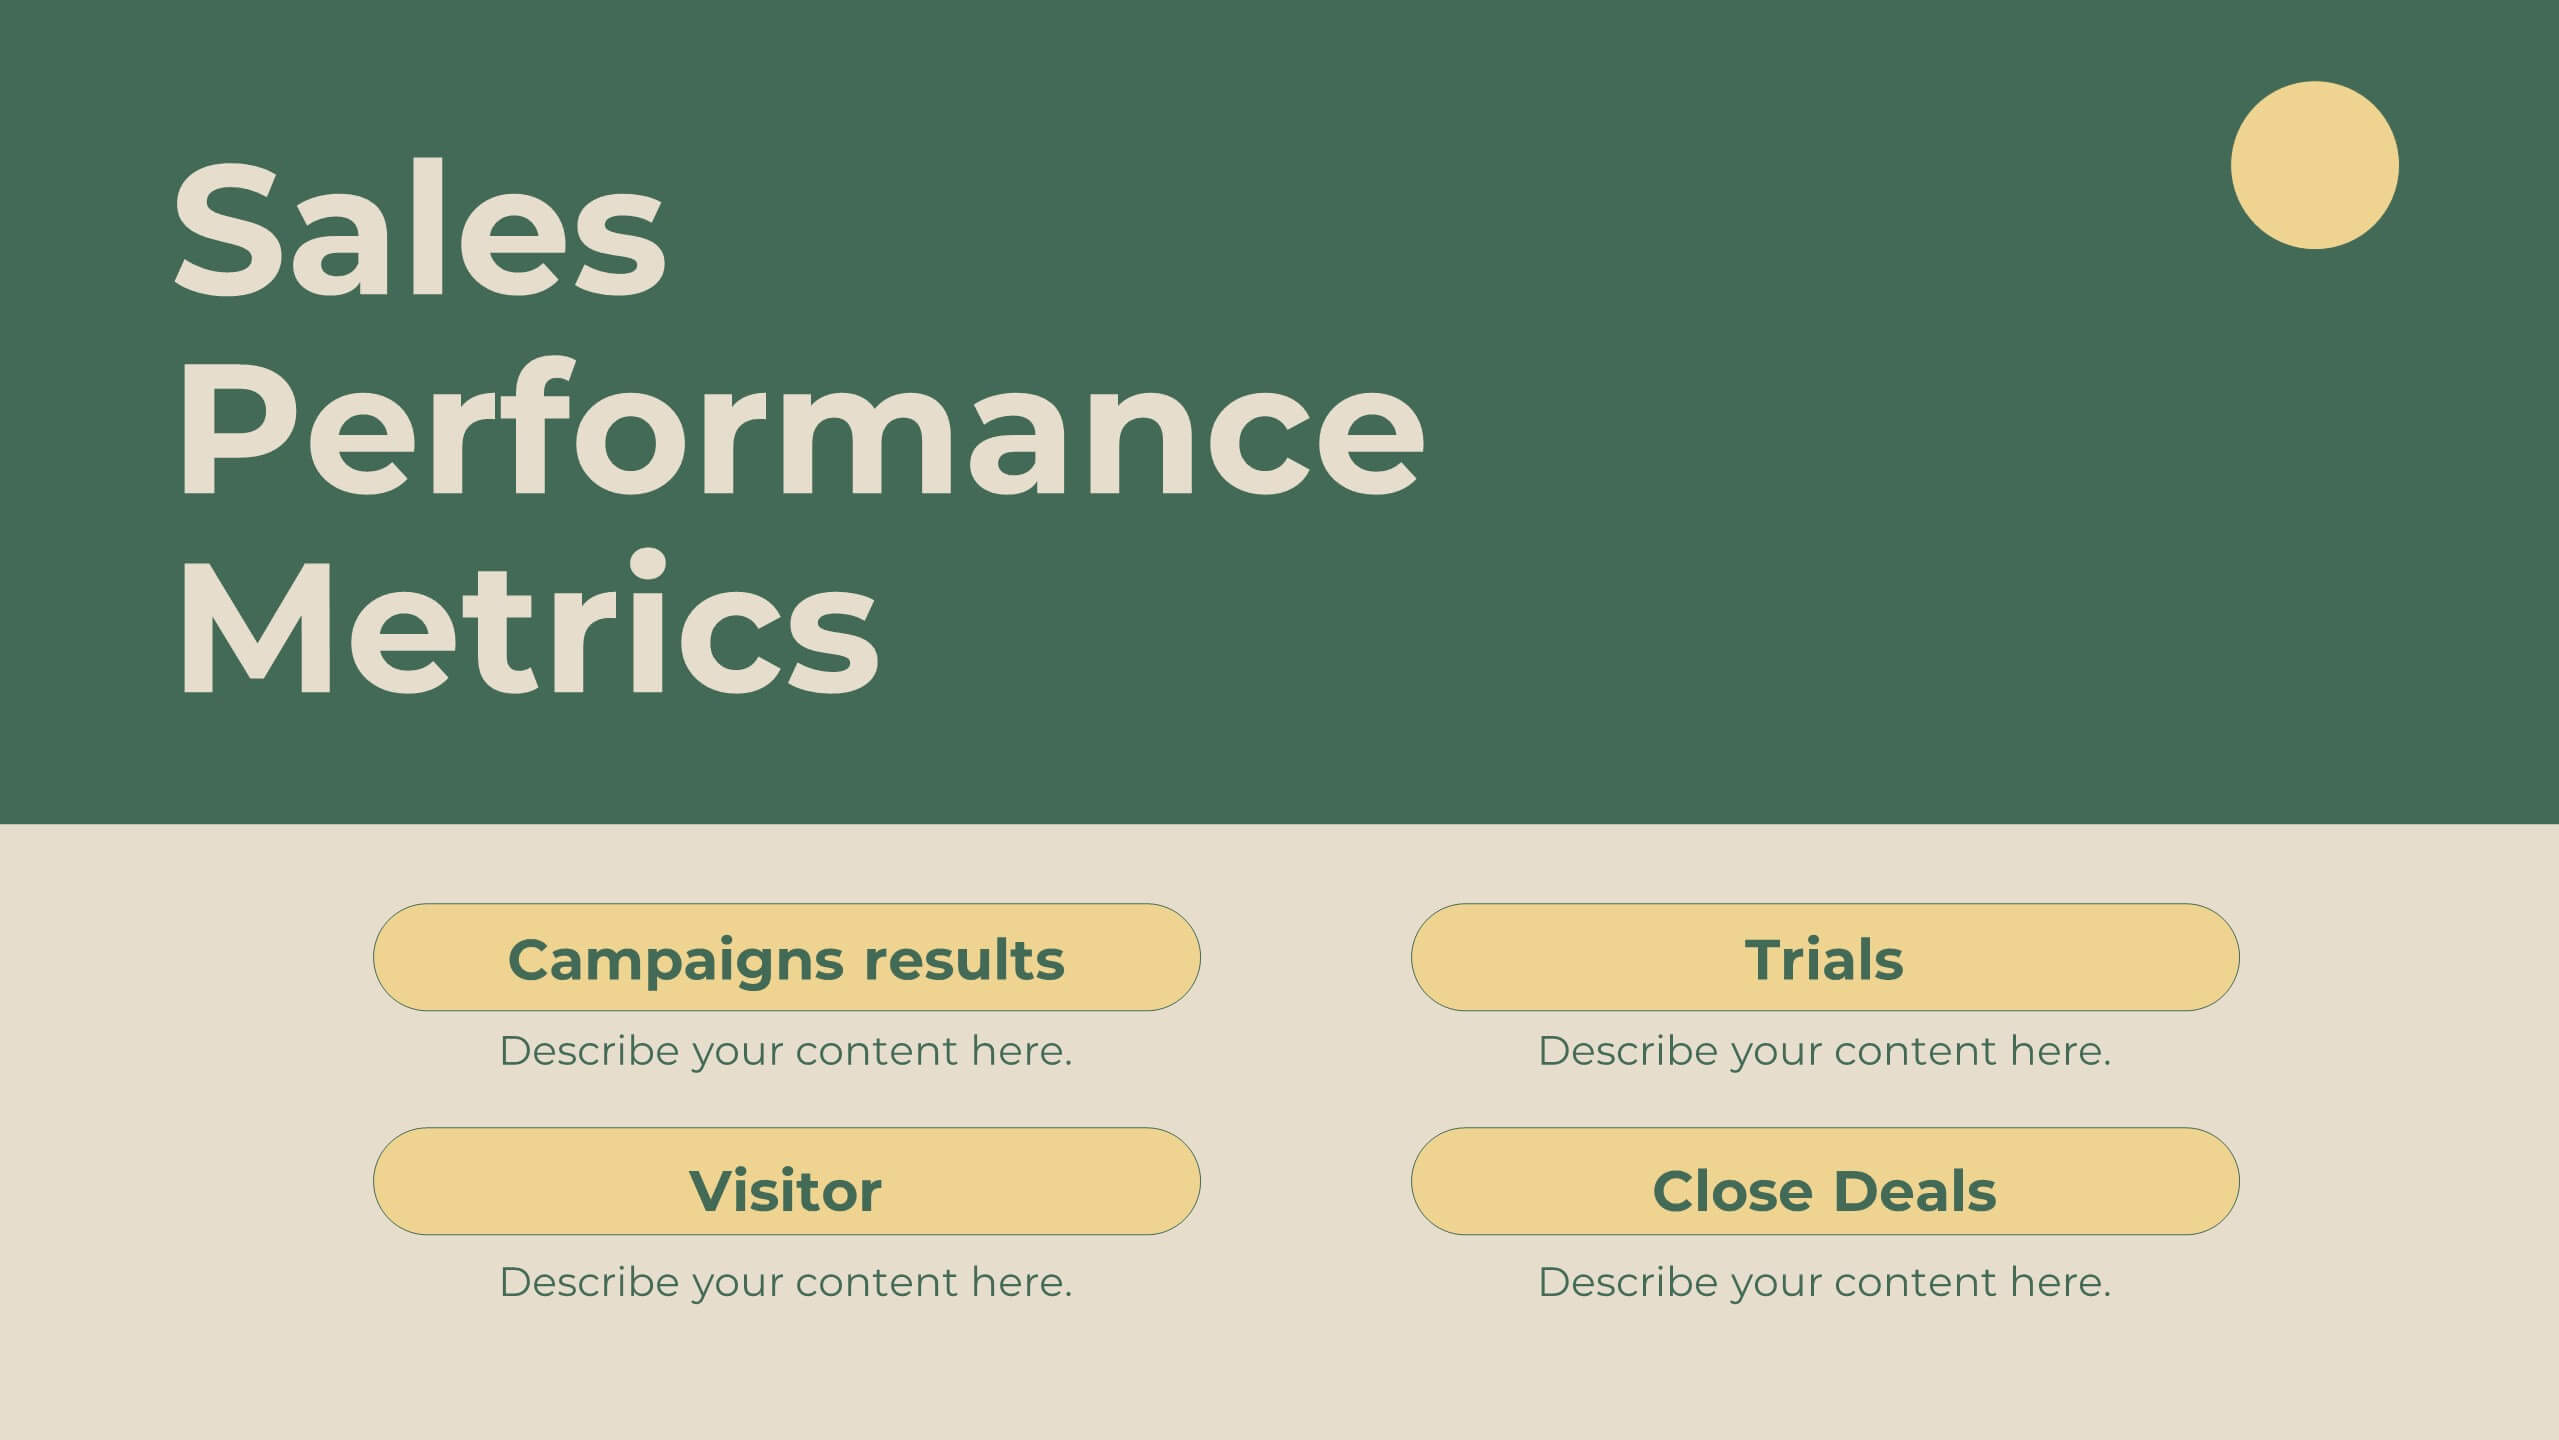
Inspirae Project Status Report Presentation
This sleek and modern project status report presentation template is designed to help you effectively communicate progress, challenges, and key insights. It covers essential sections such as performance metrics, sales performance, risk assessments, and strategic initiatives, ensuring a comprehensive overview. Compatible with PowerPoint, Keynote, and Google Slides for seamless customization.


20 diapositivas
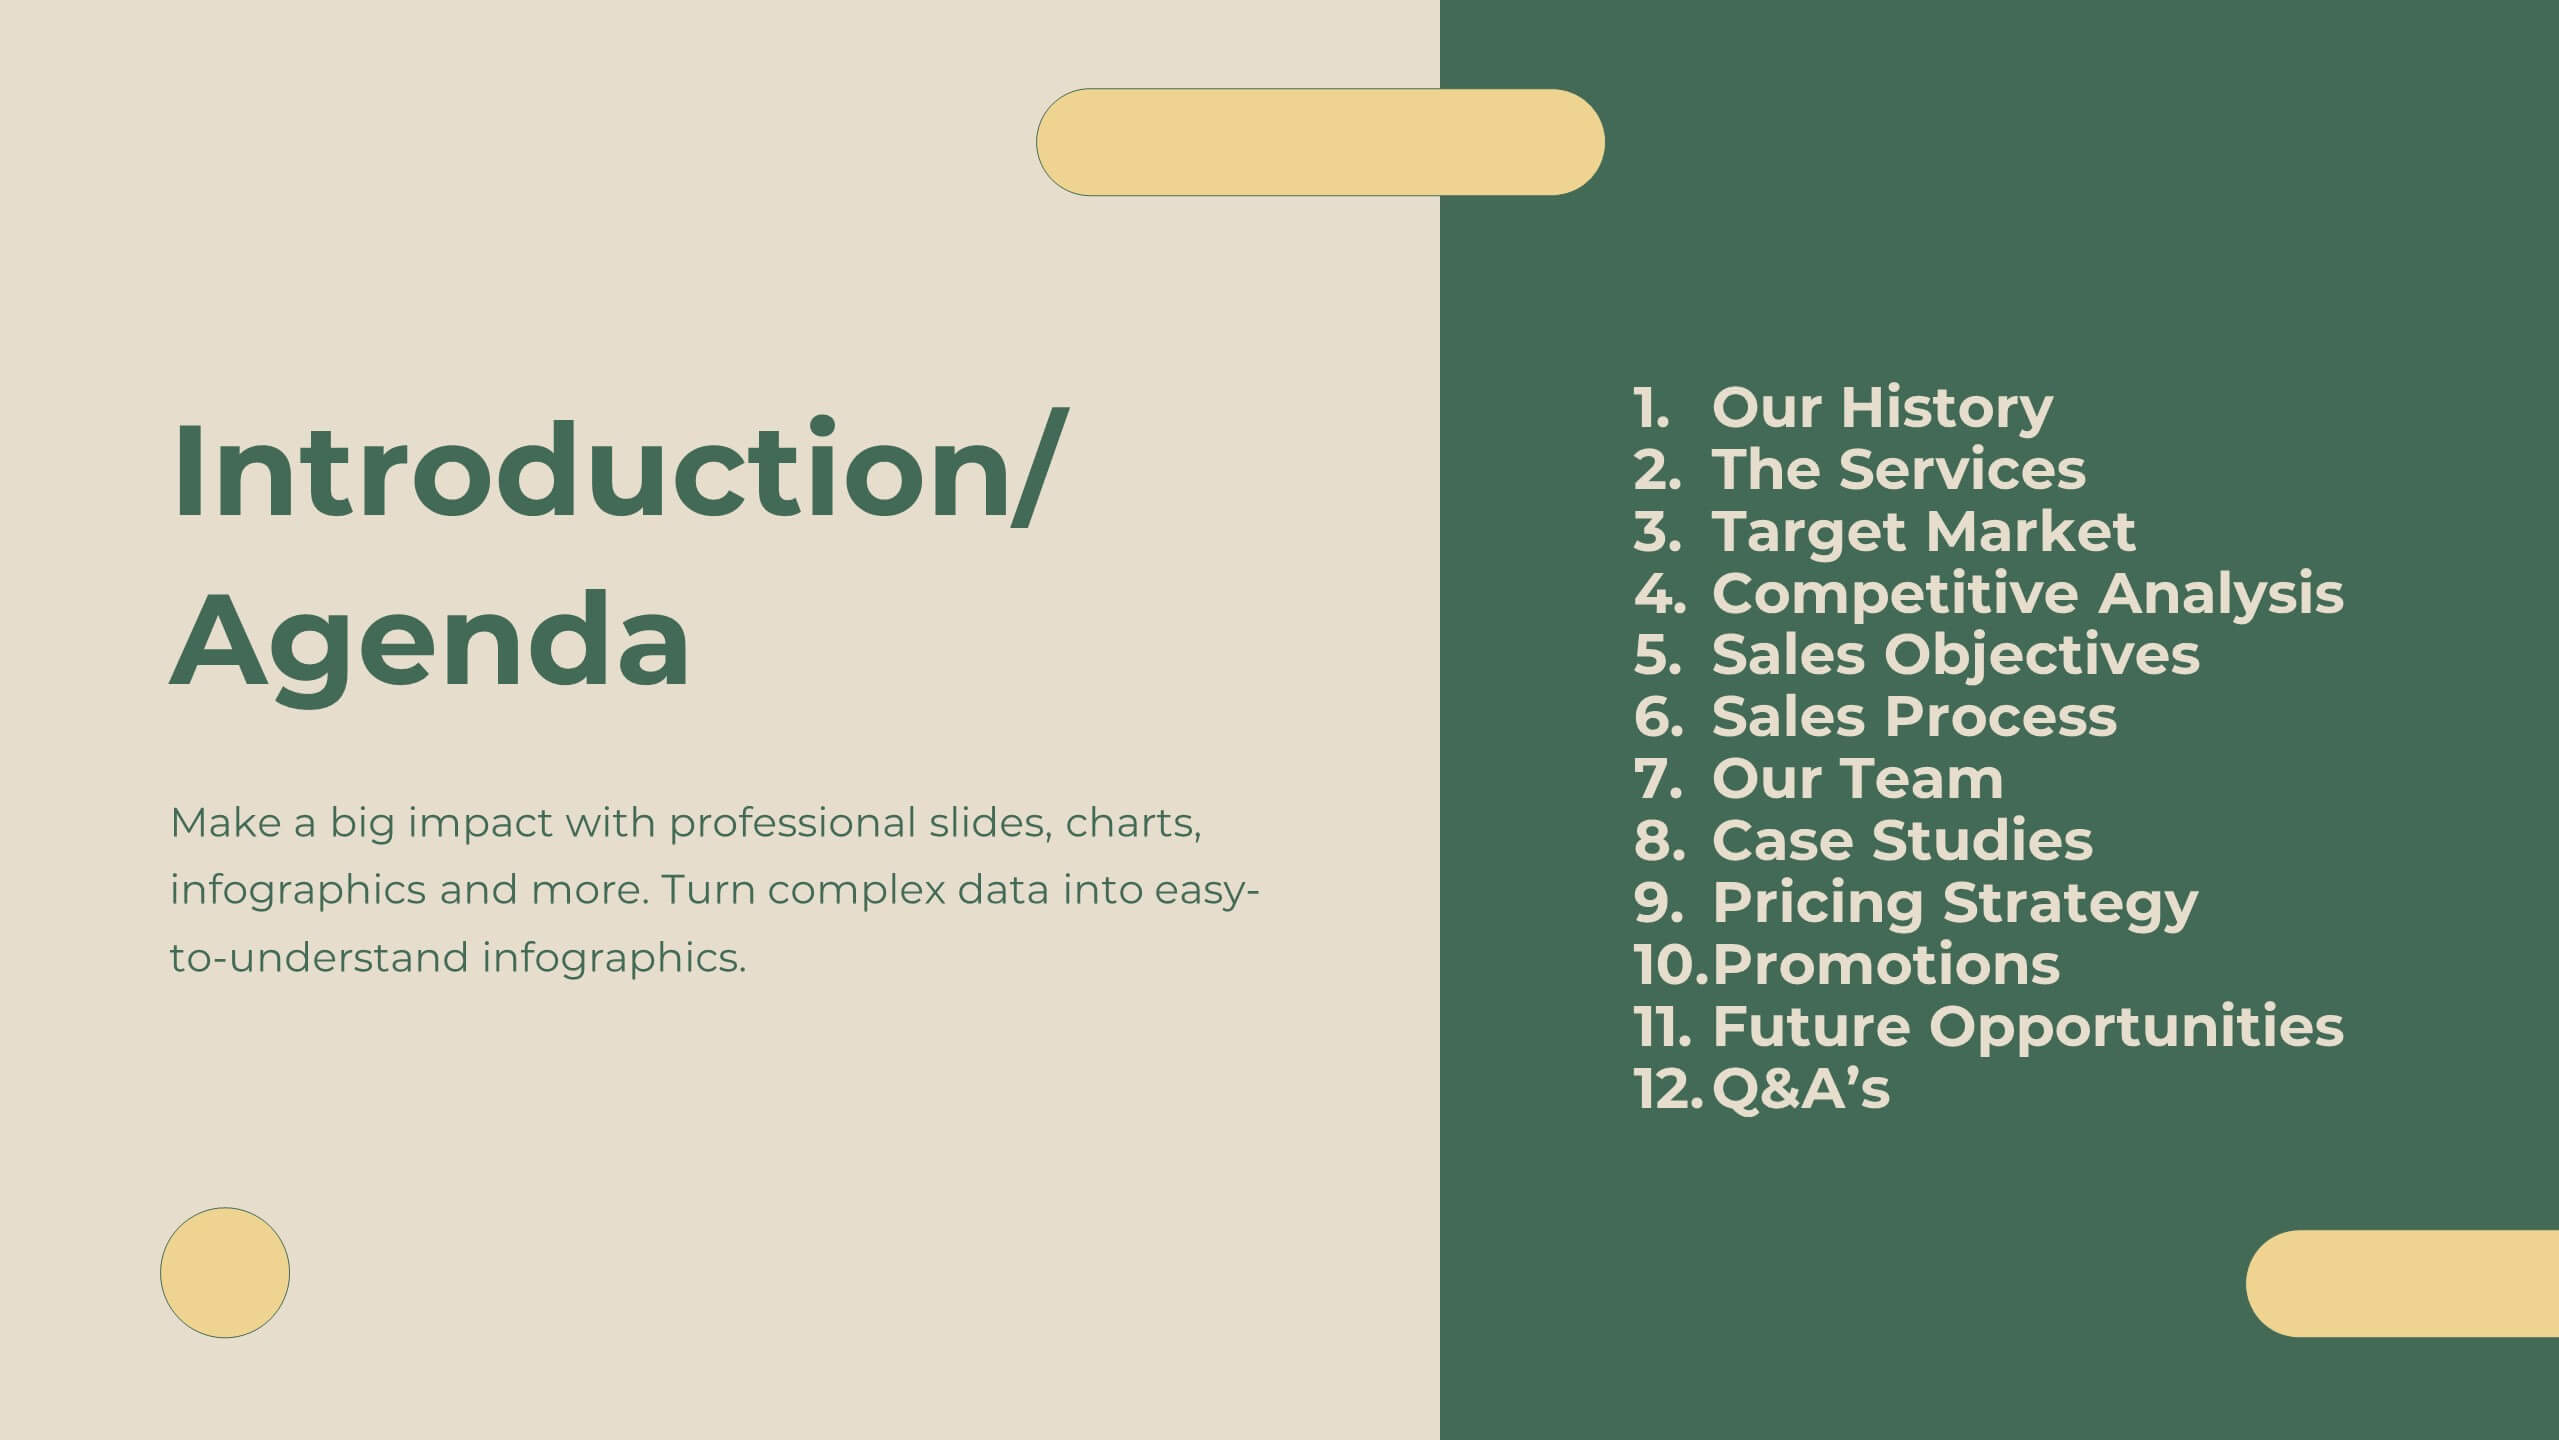
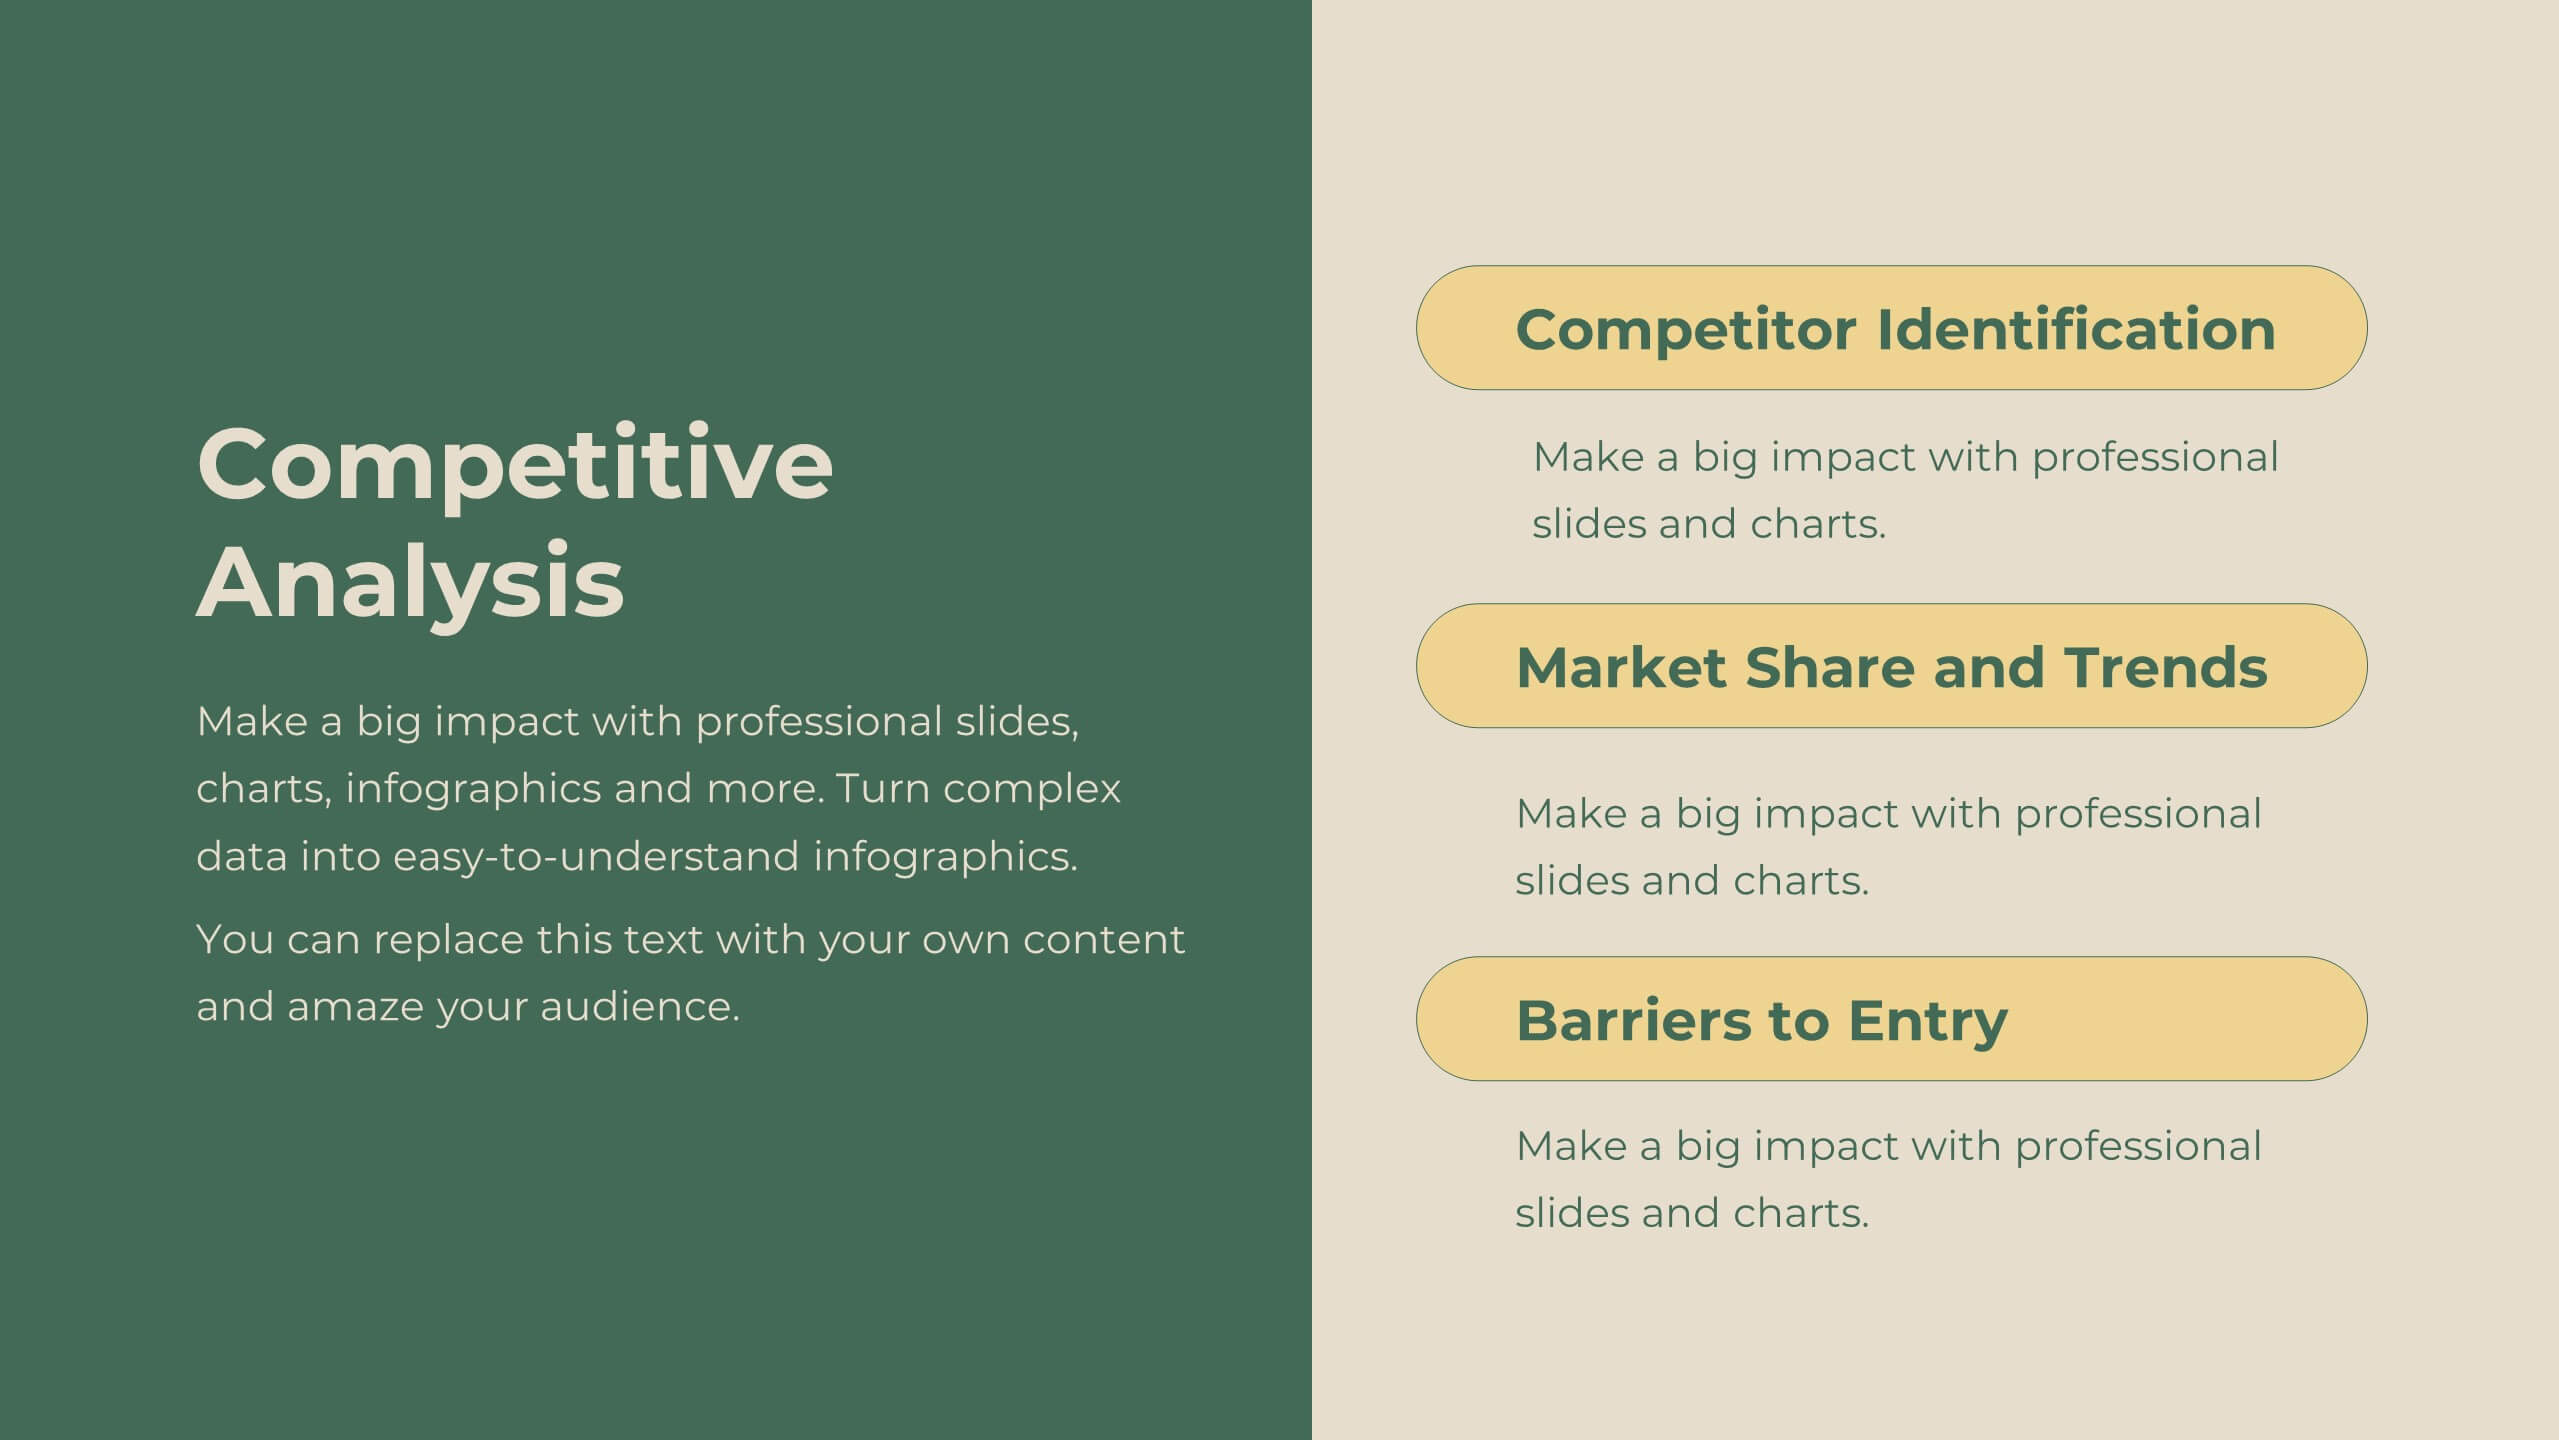
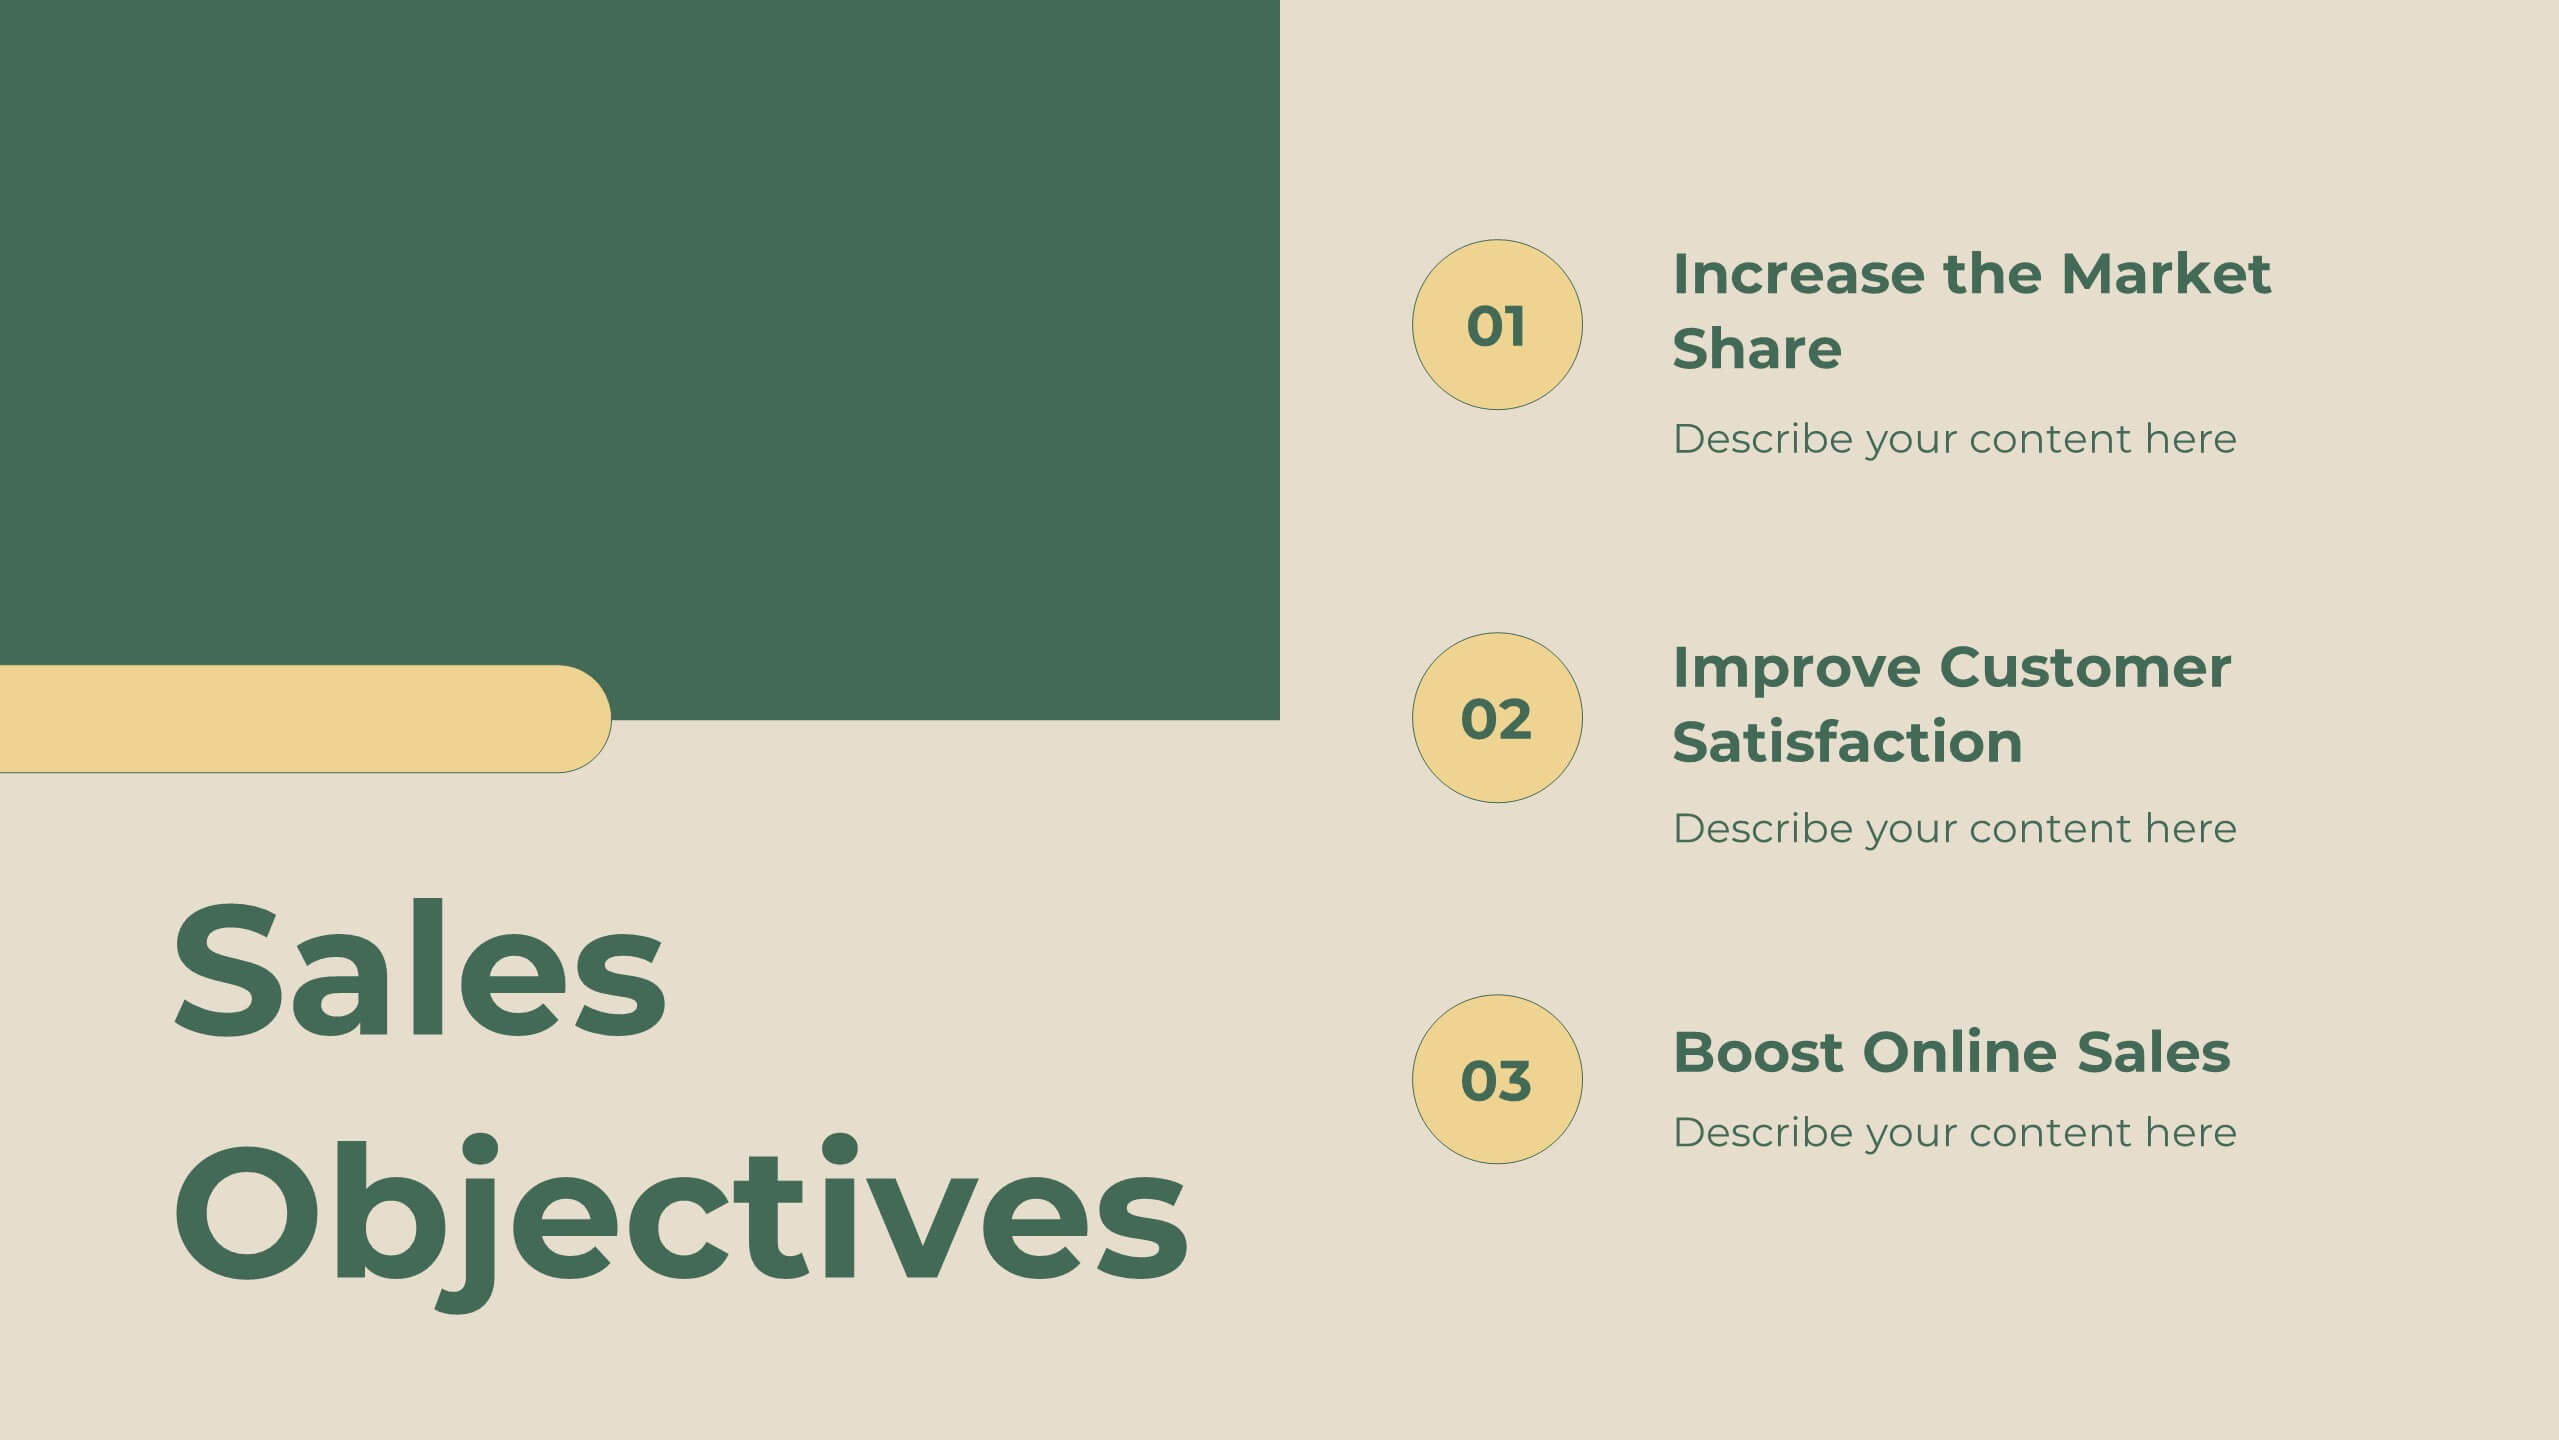
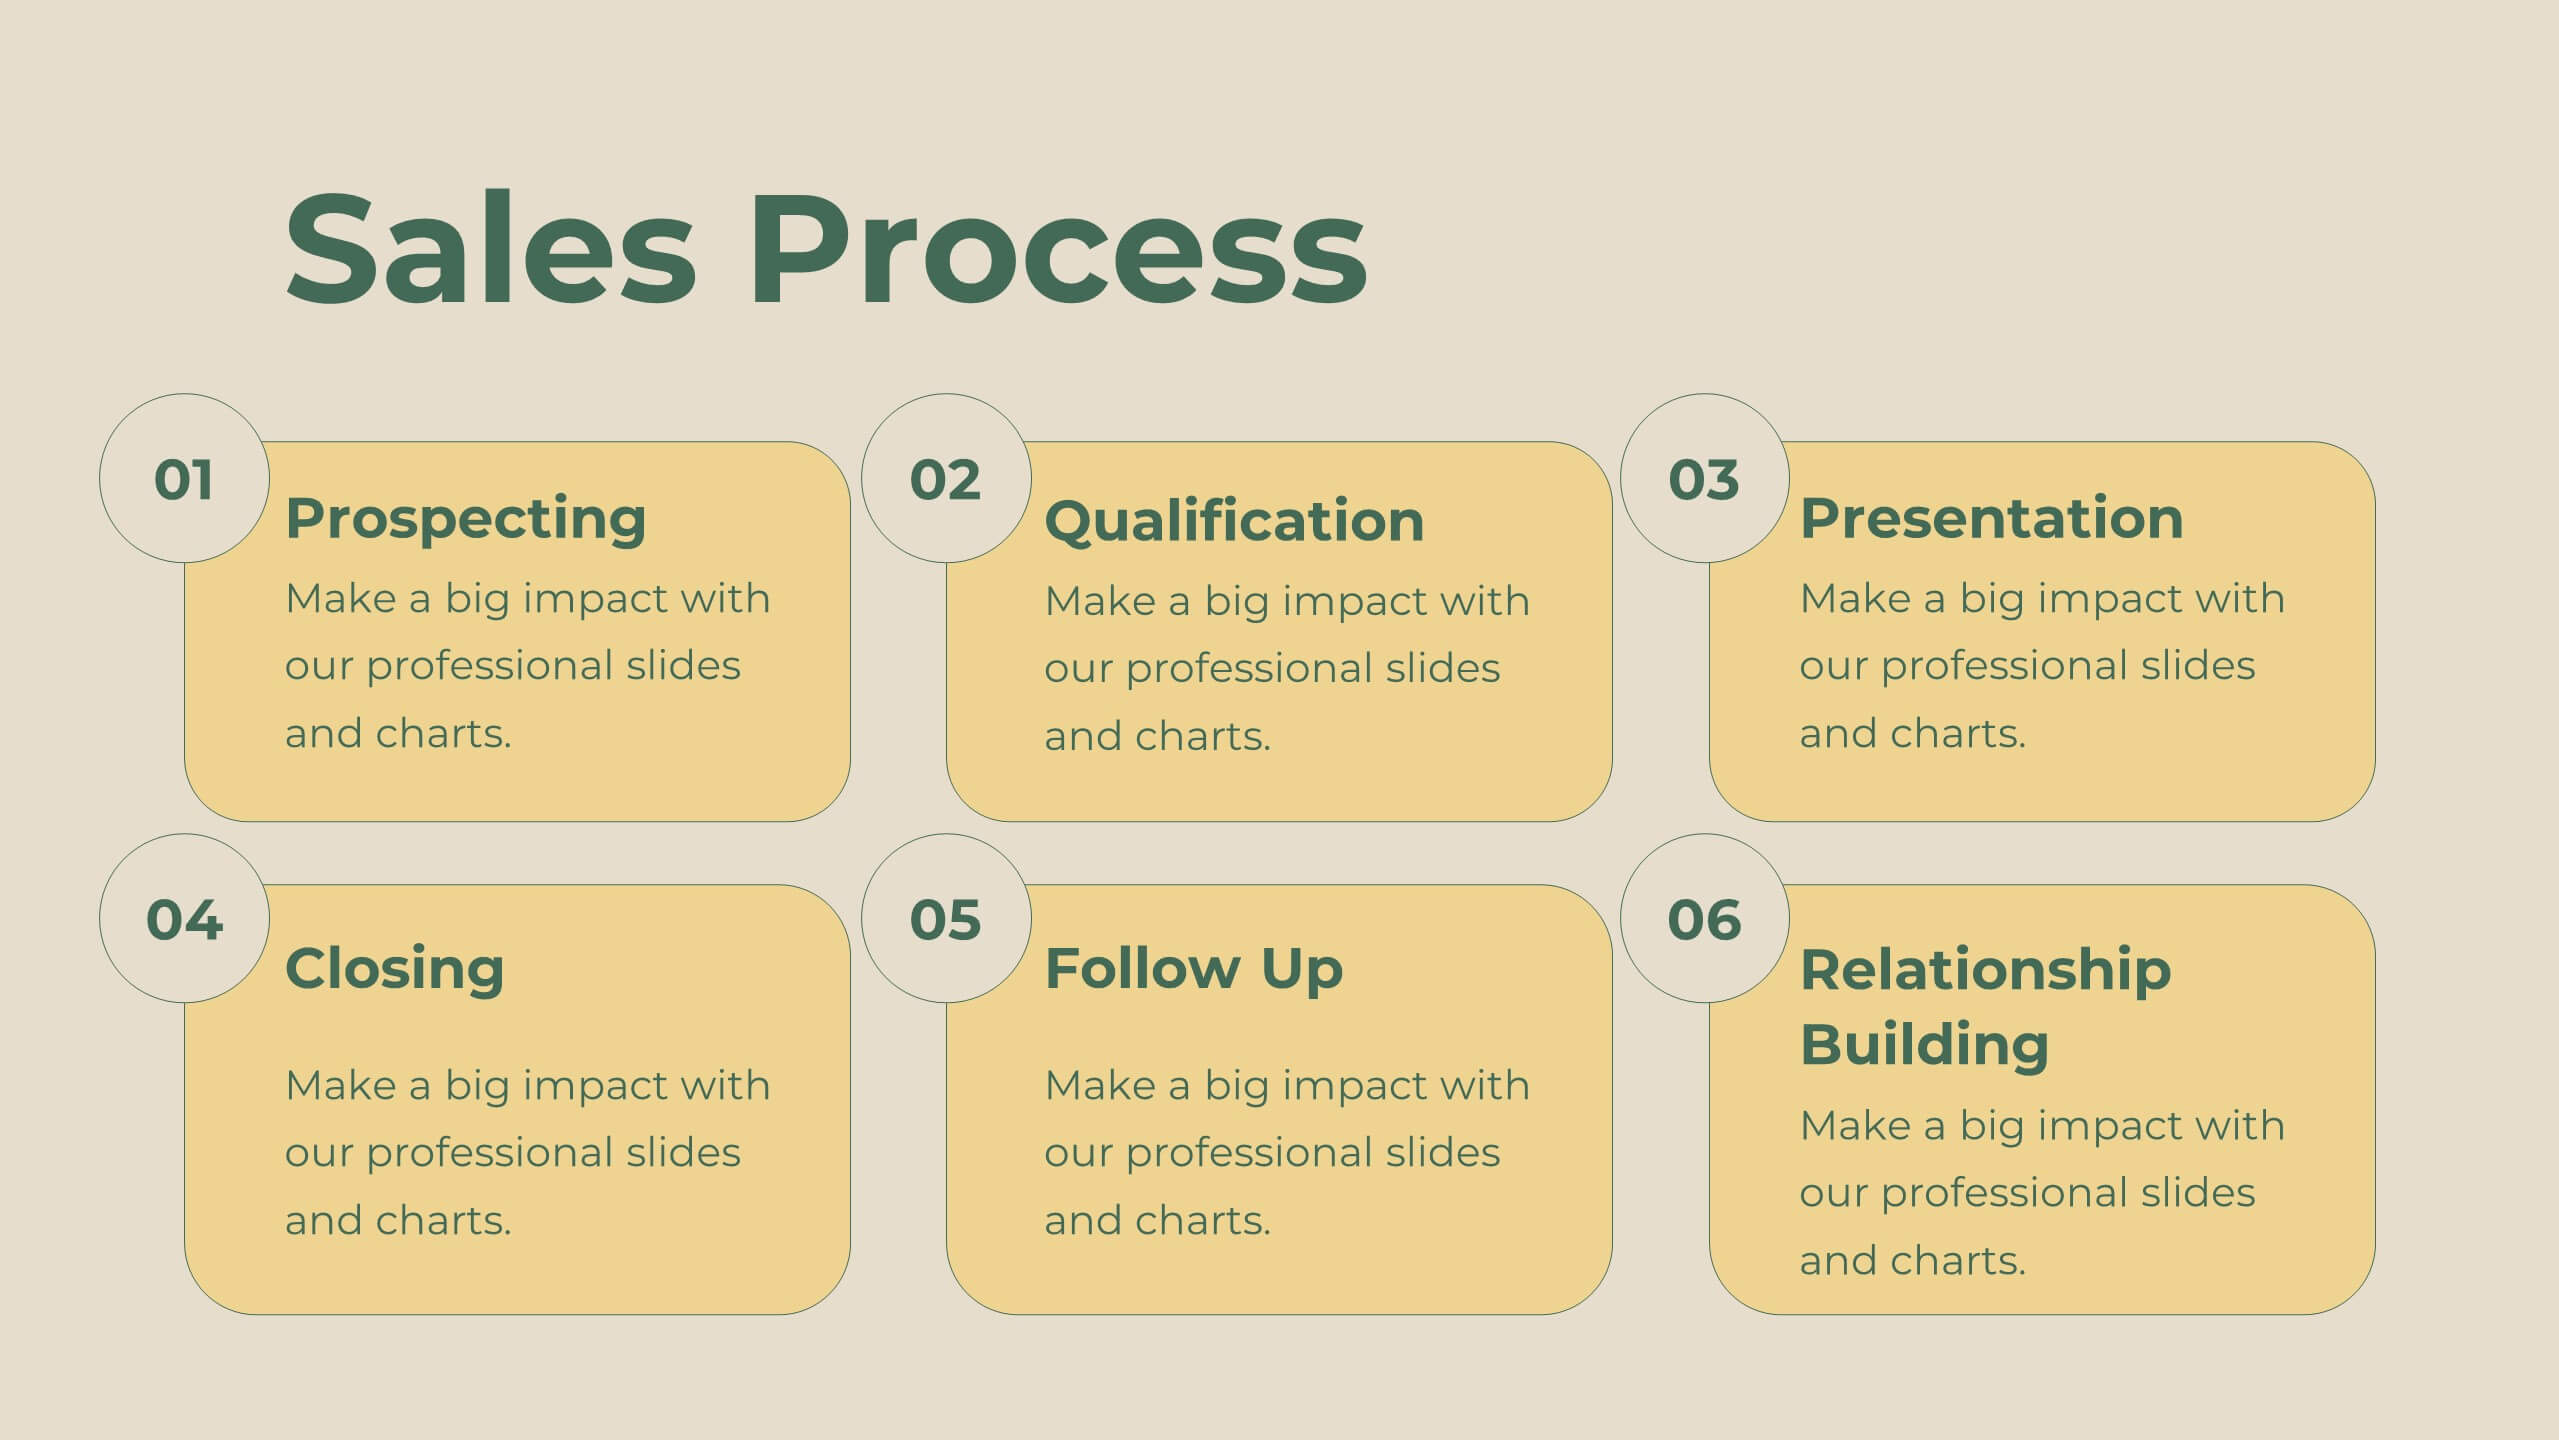
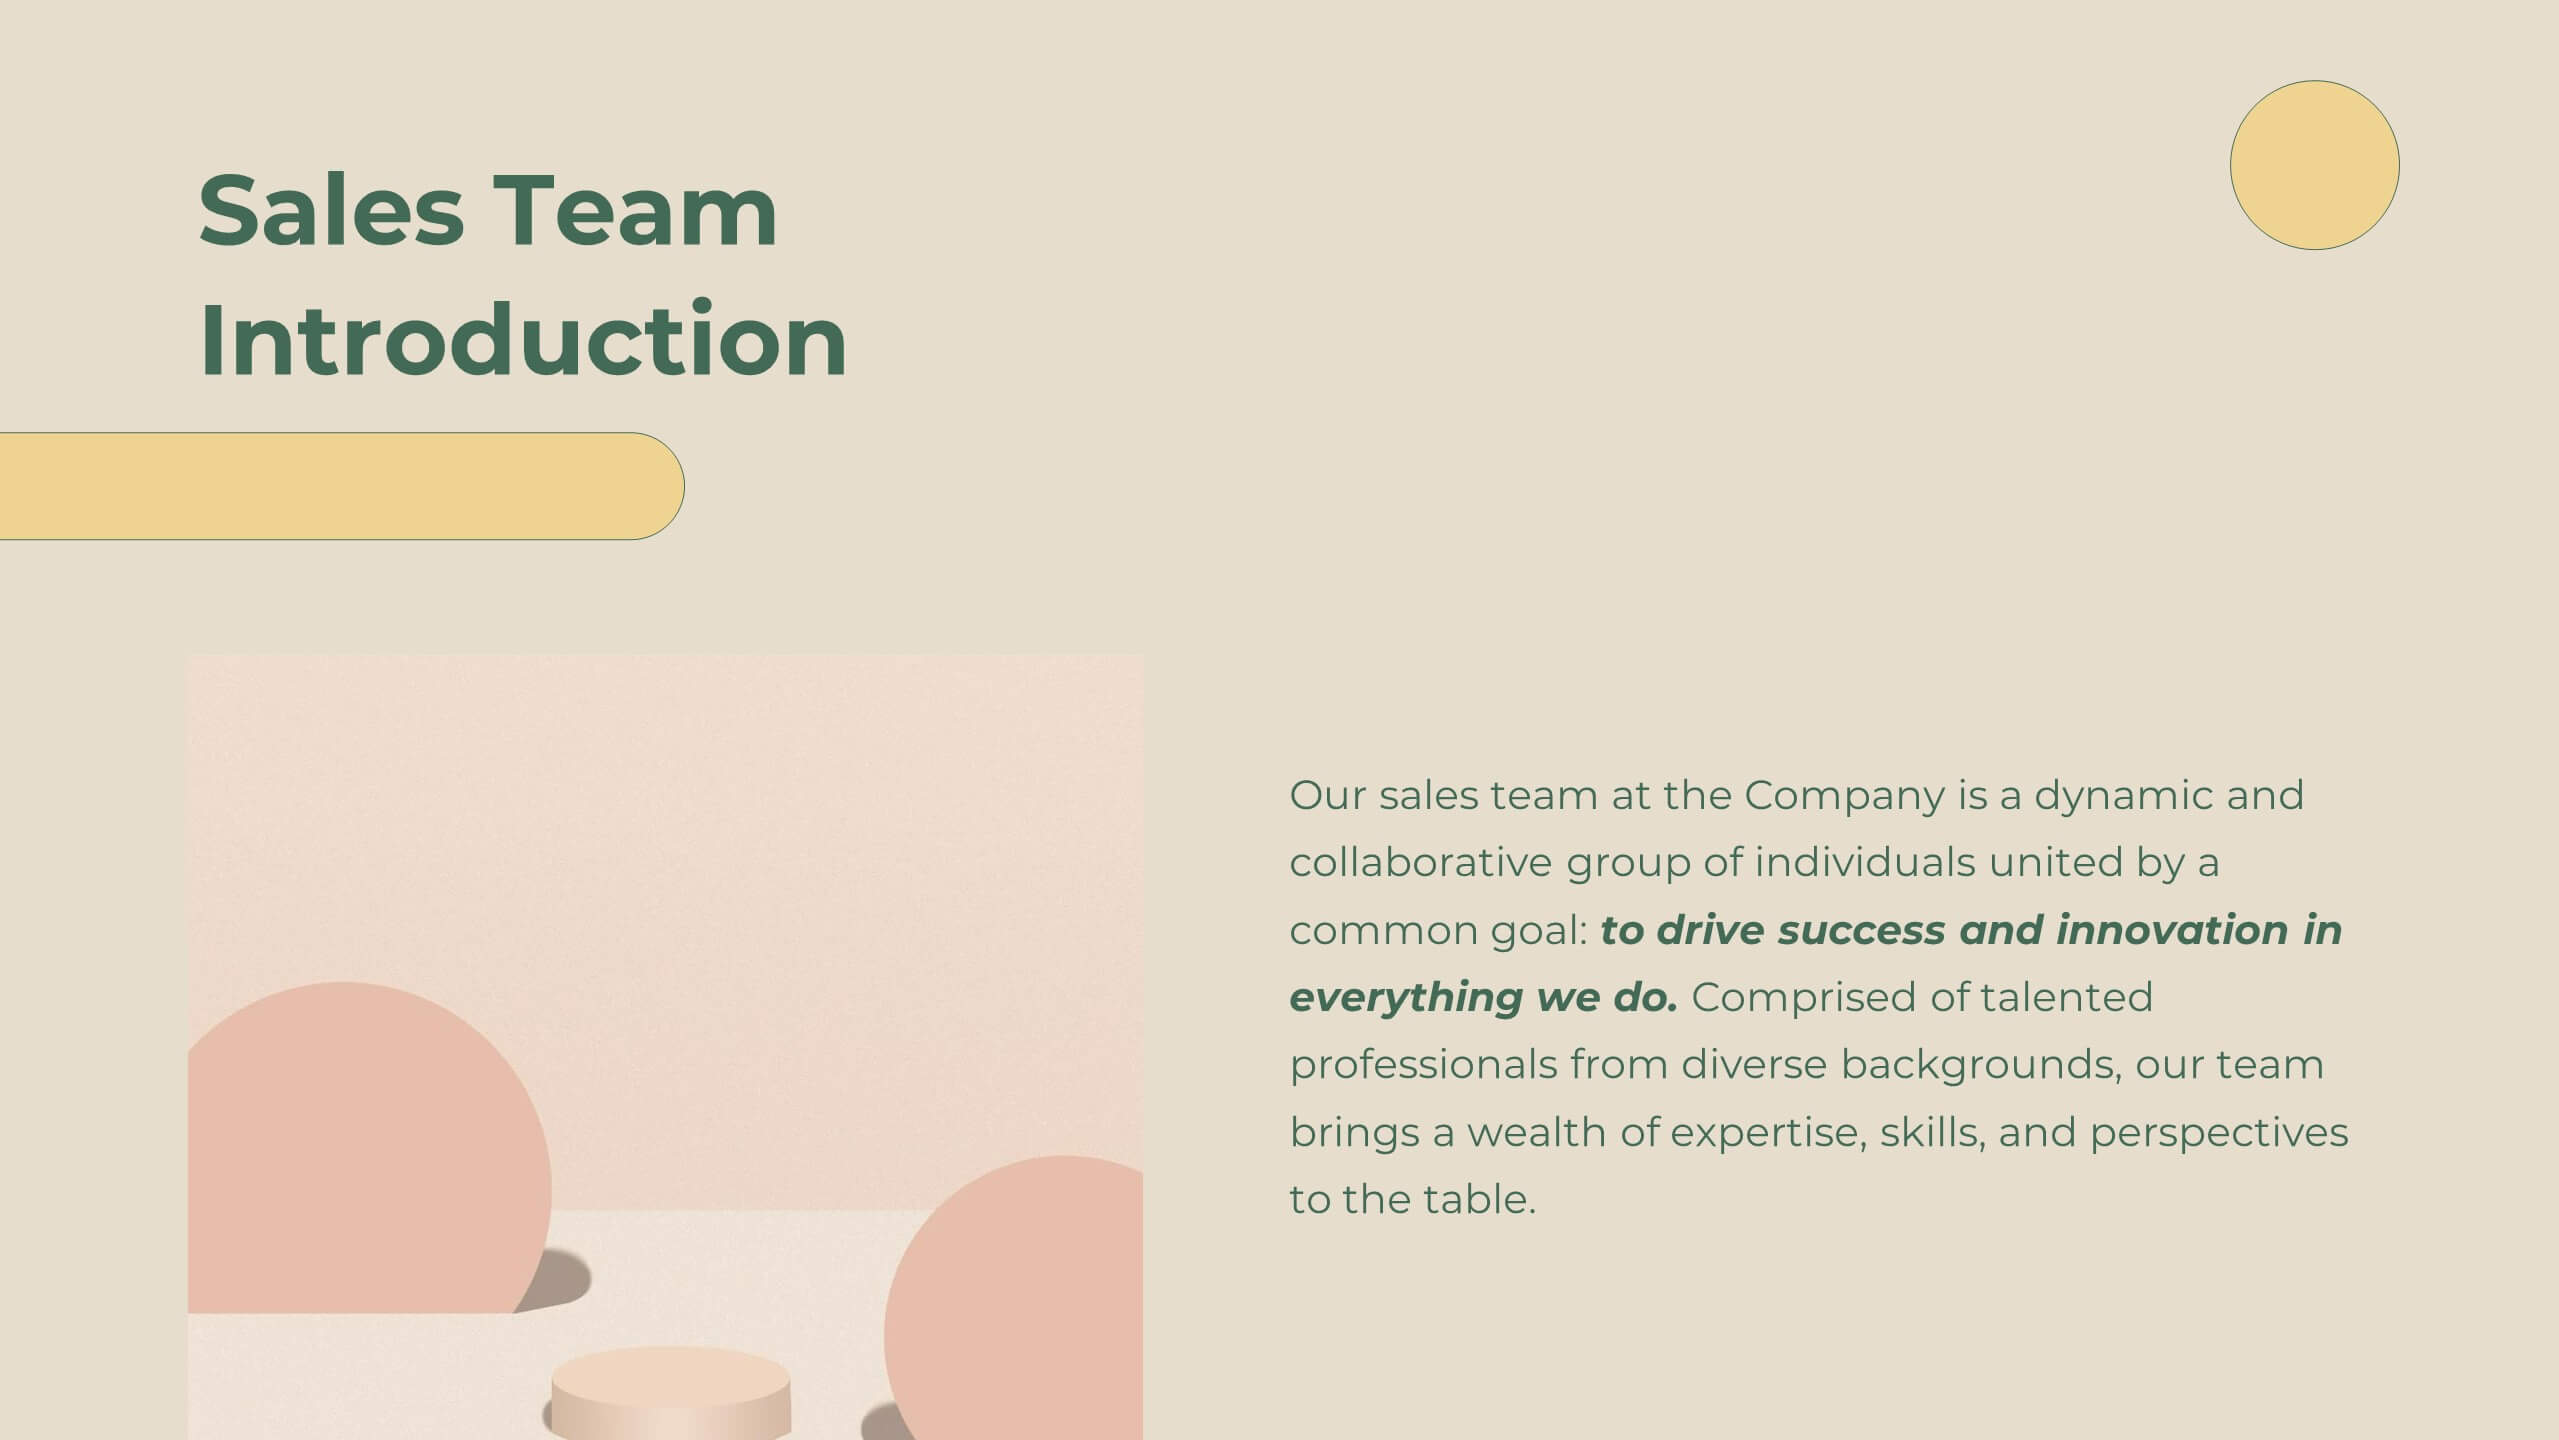
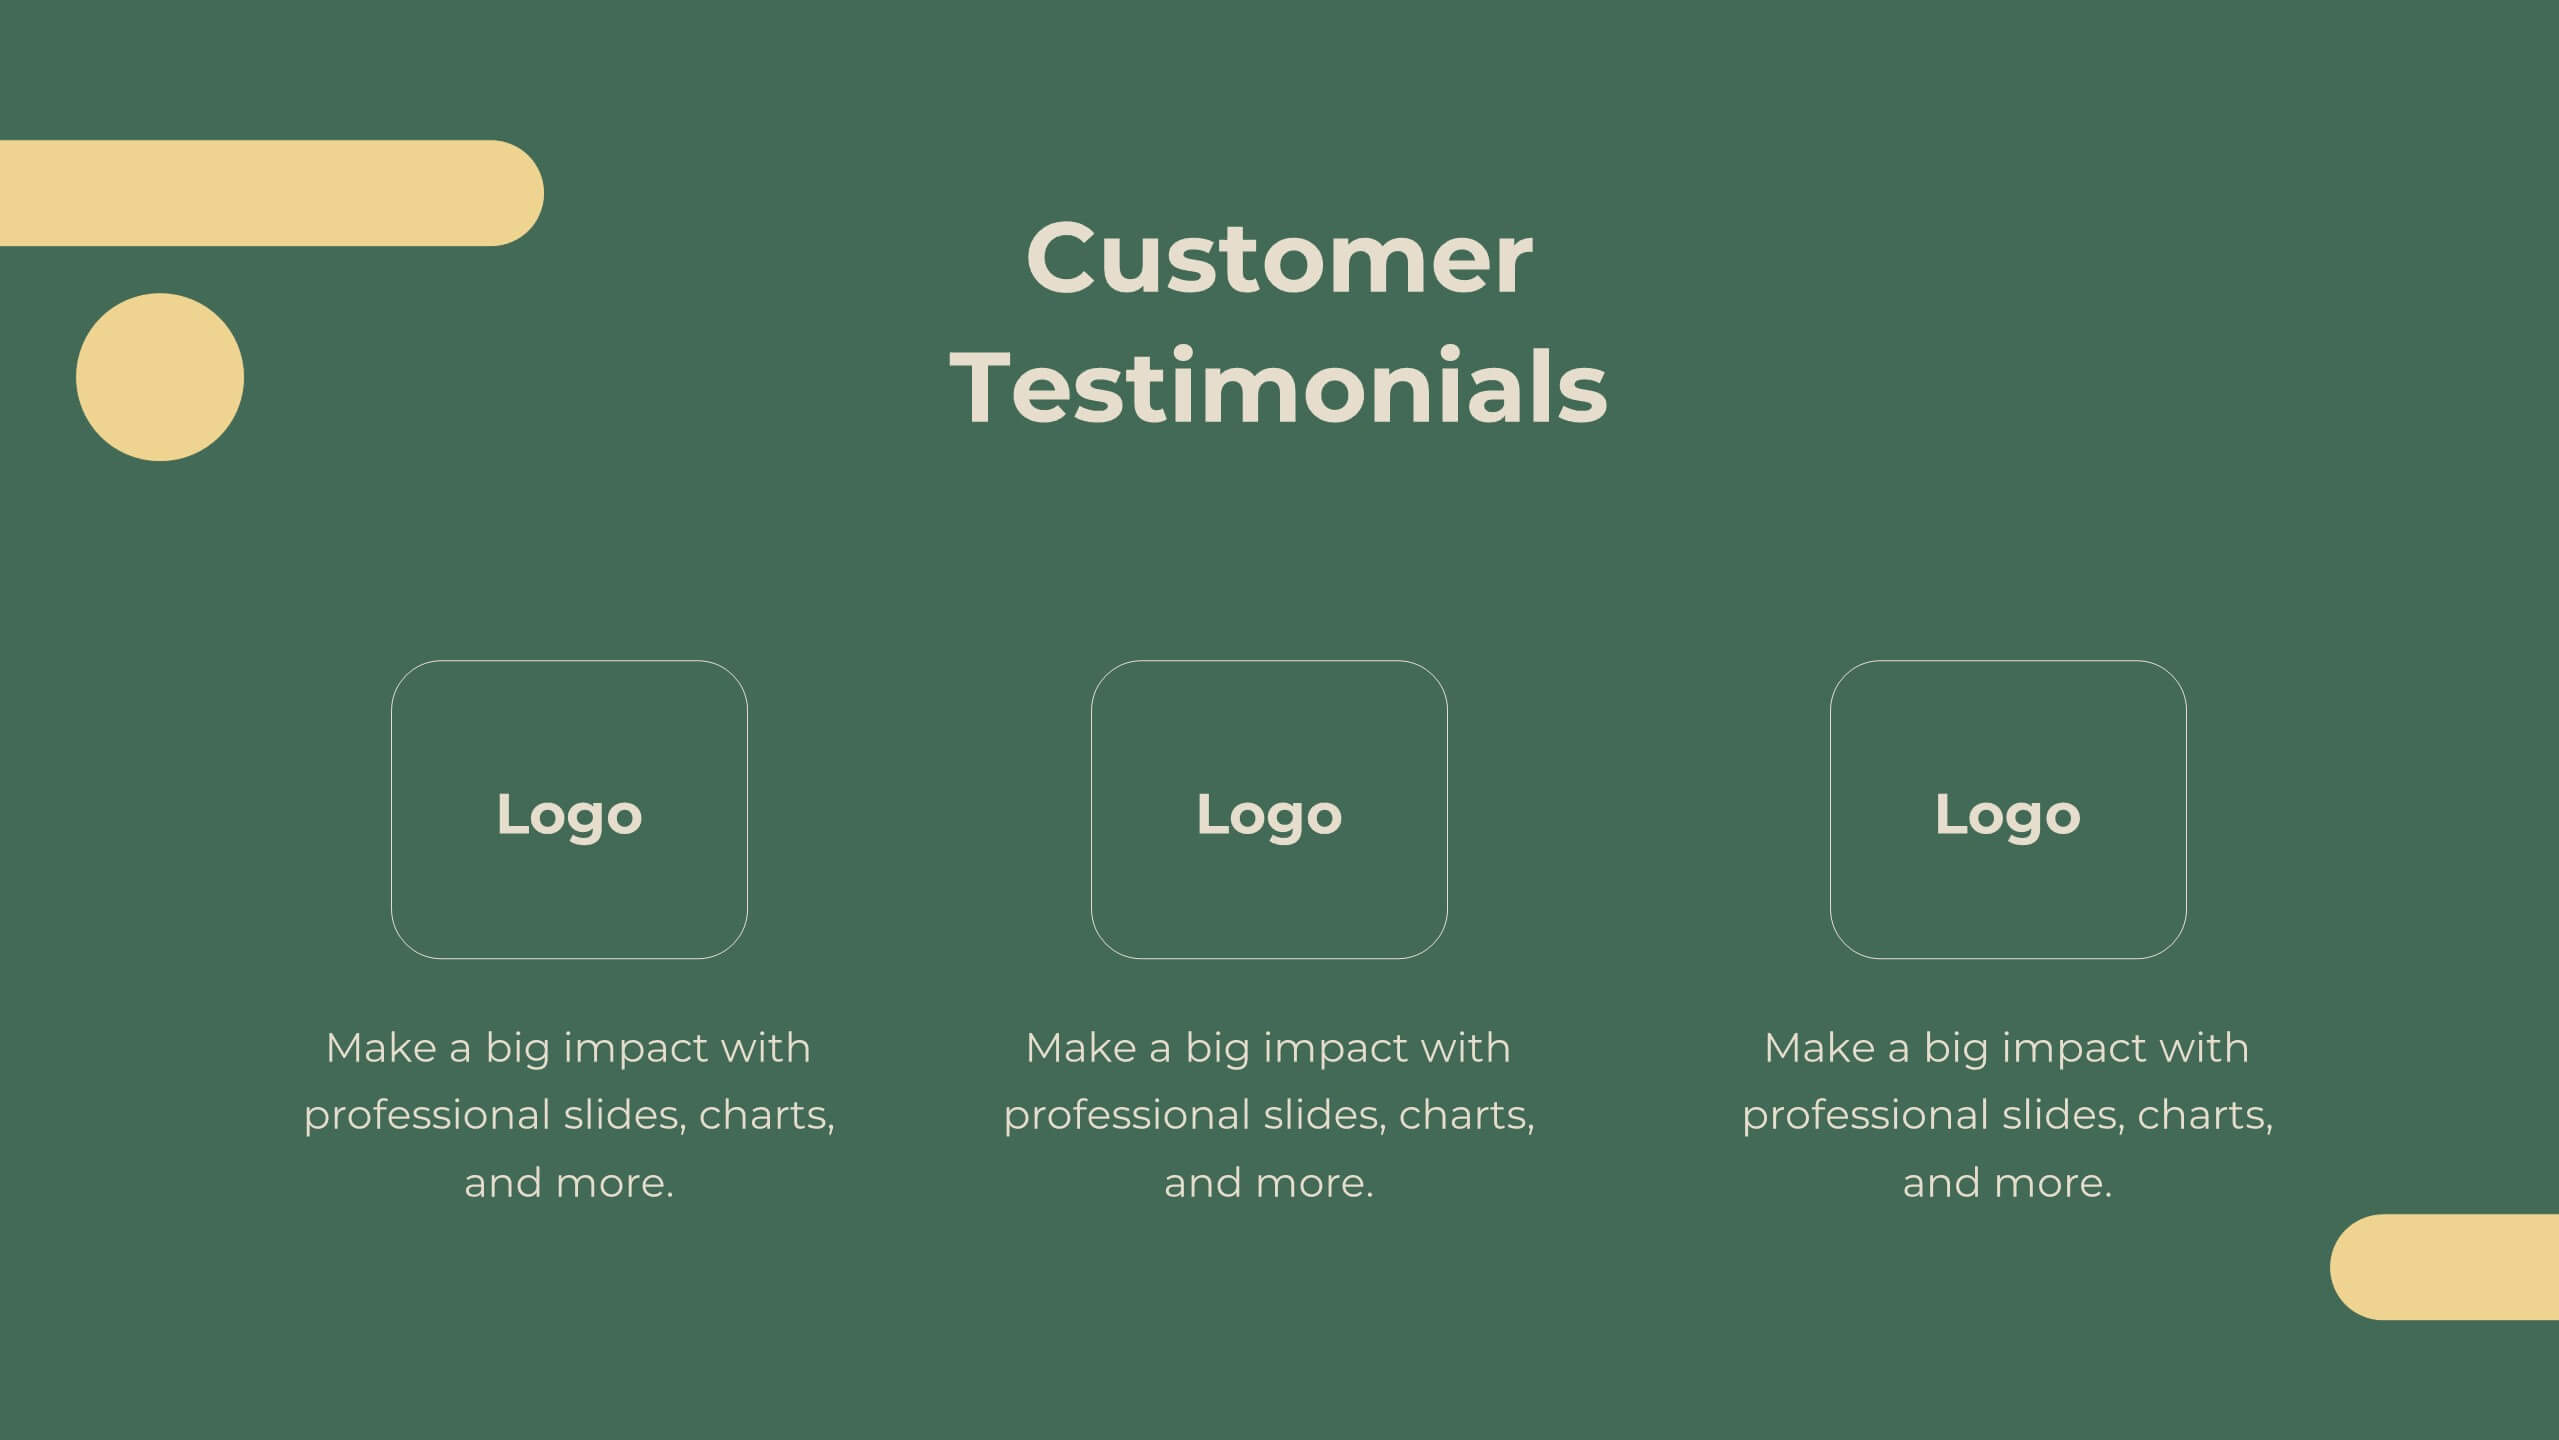
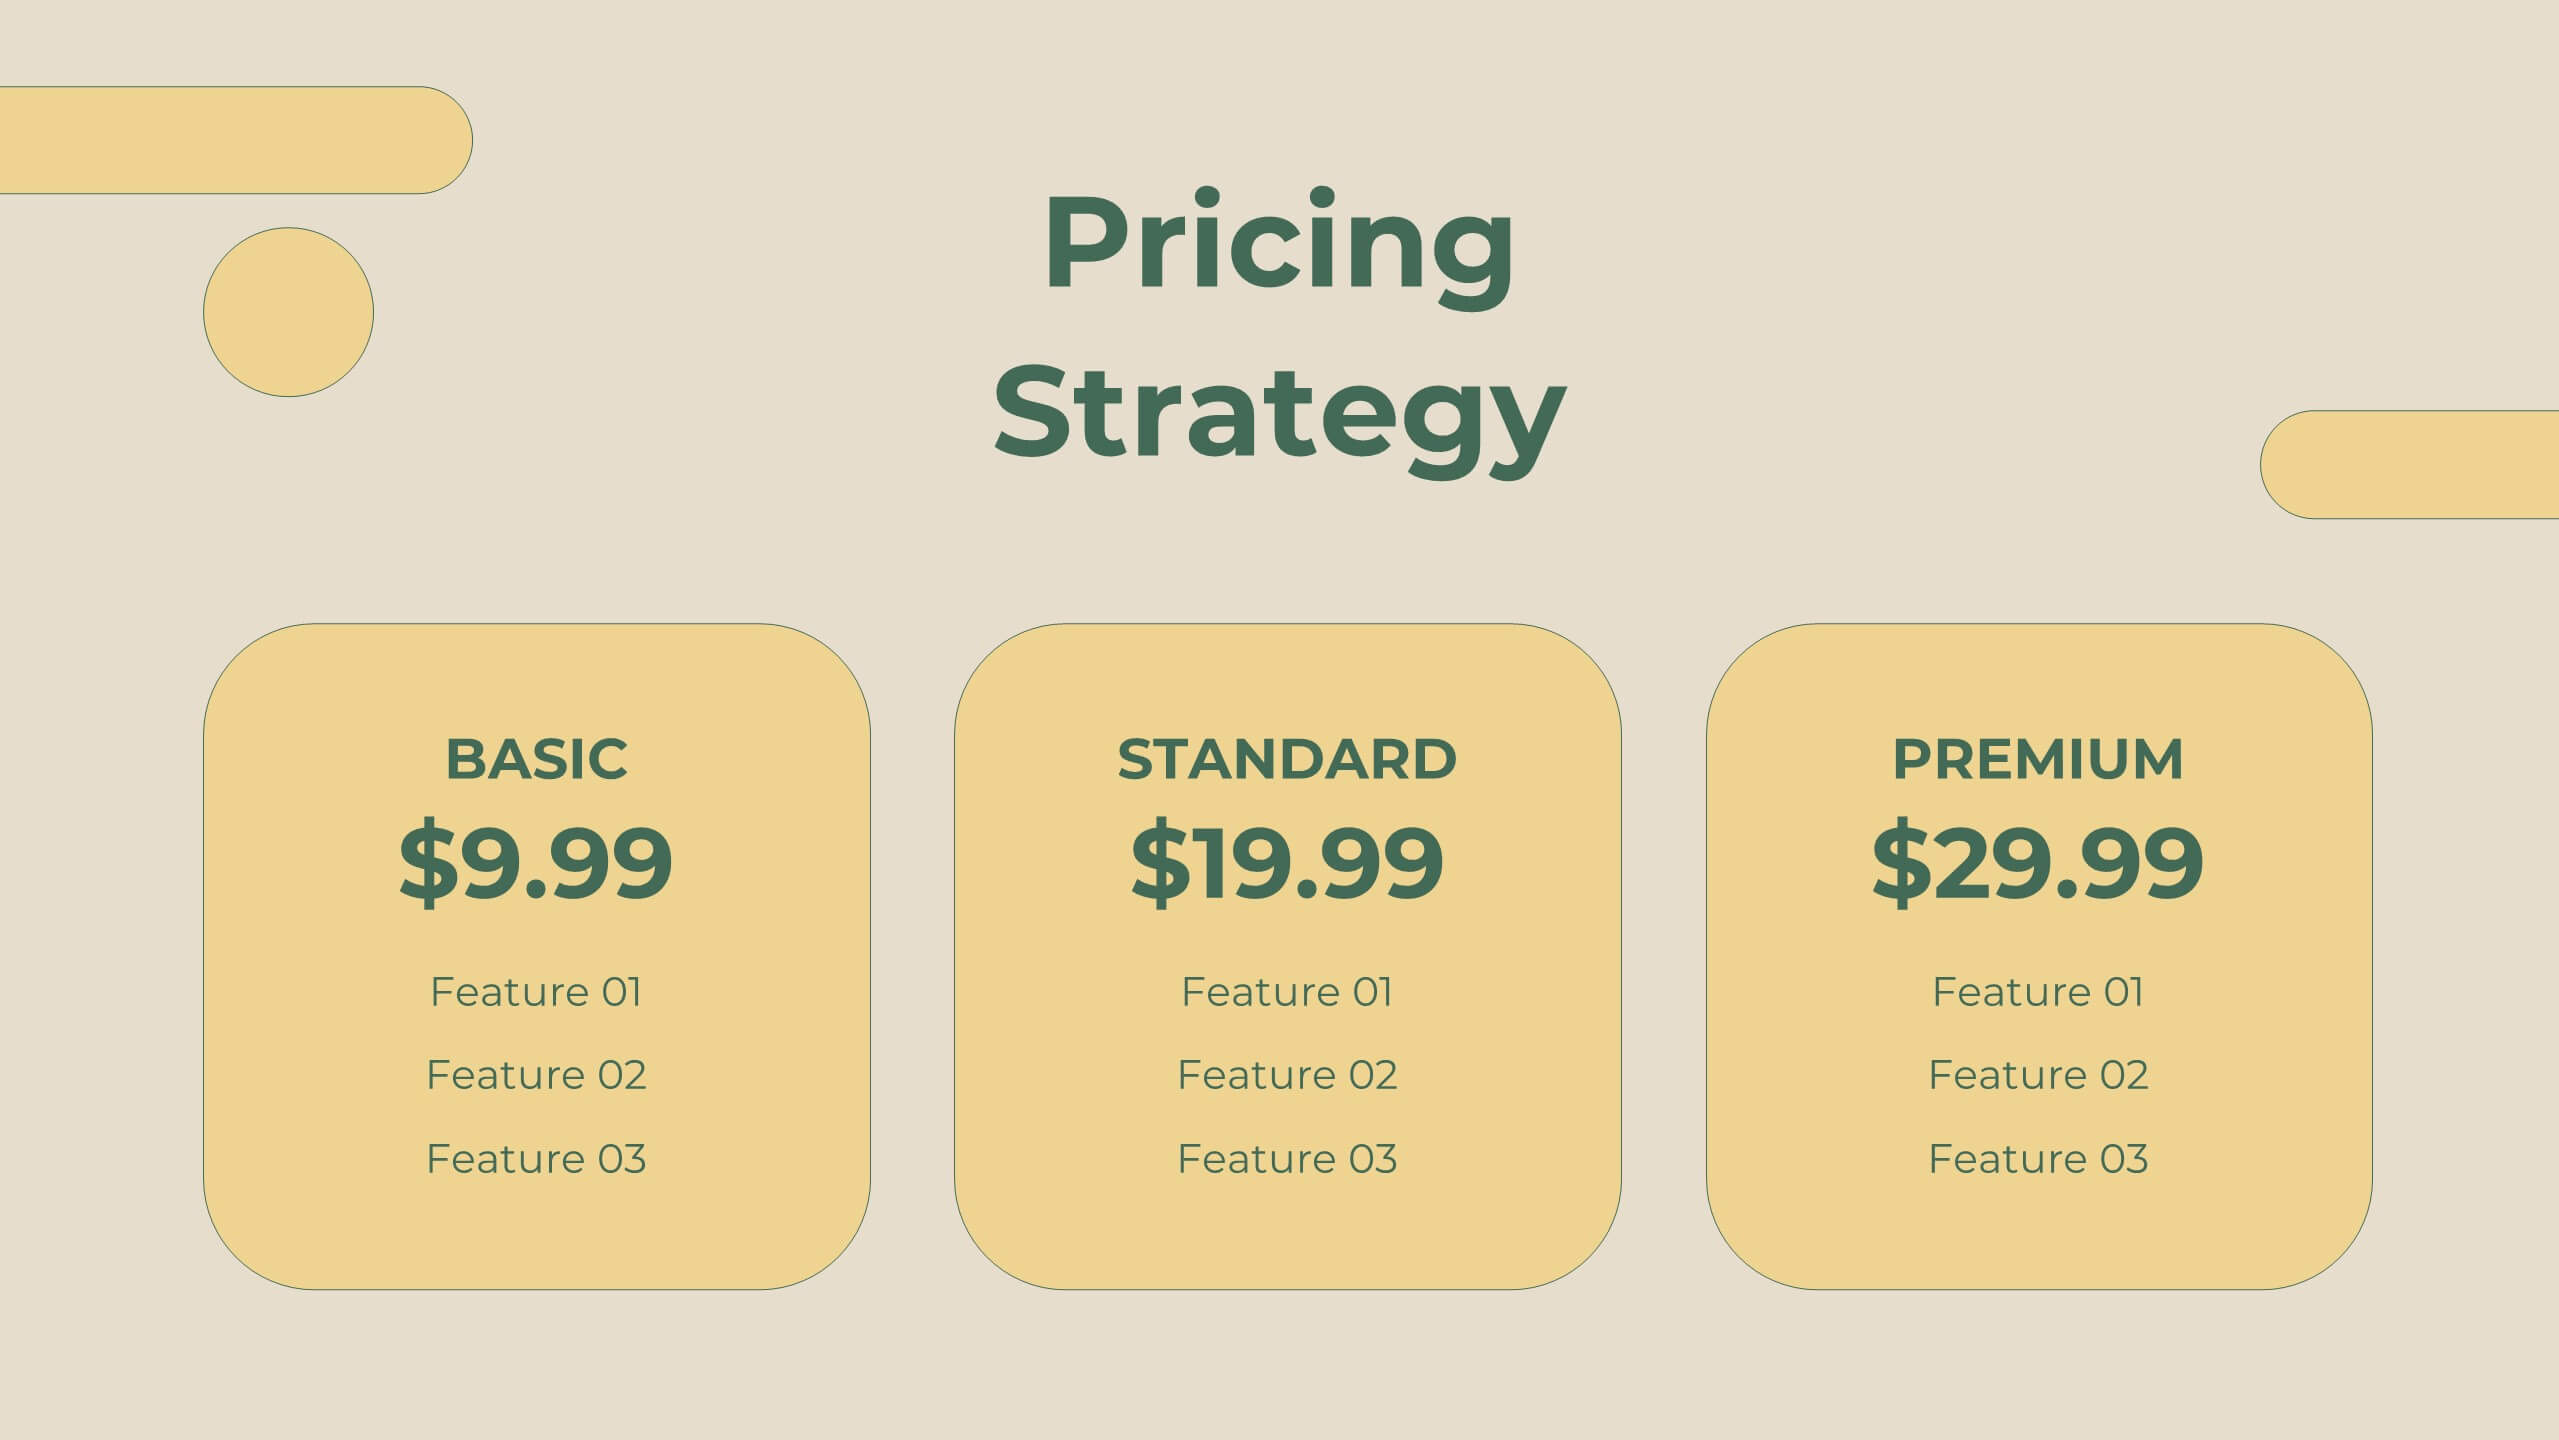
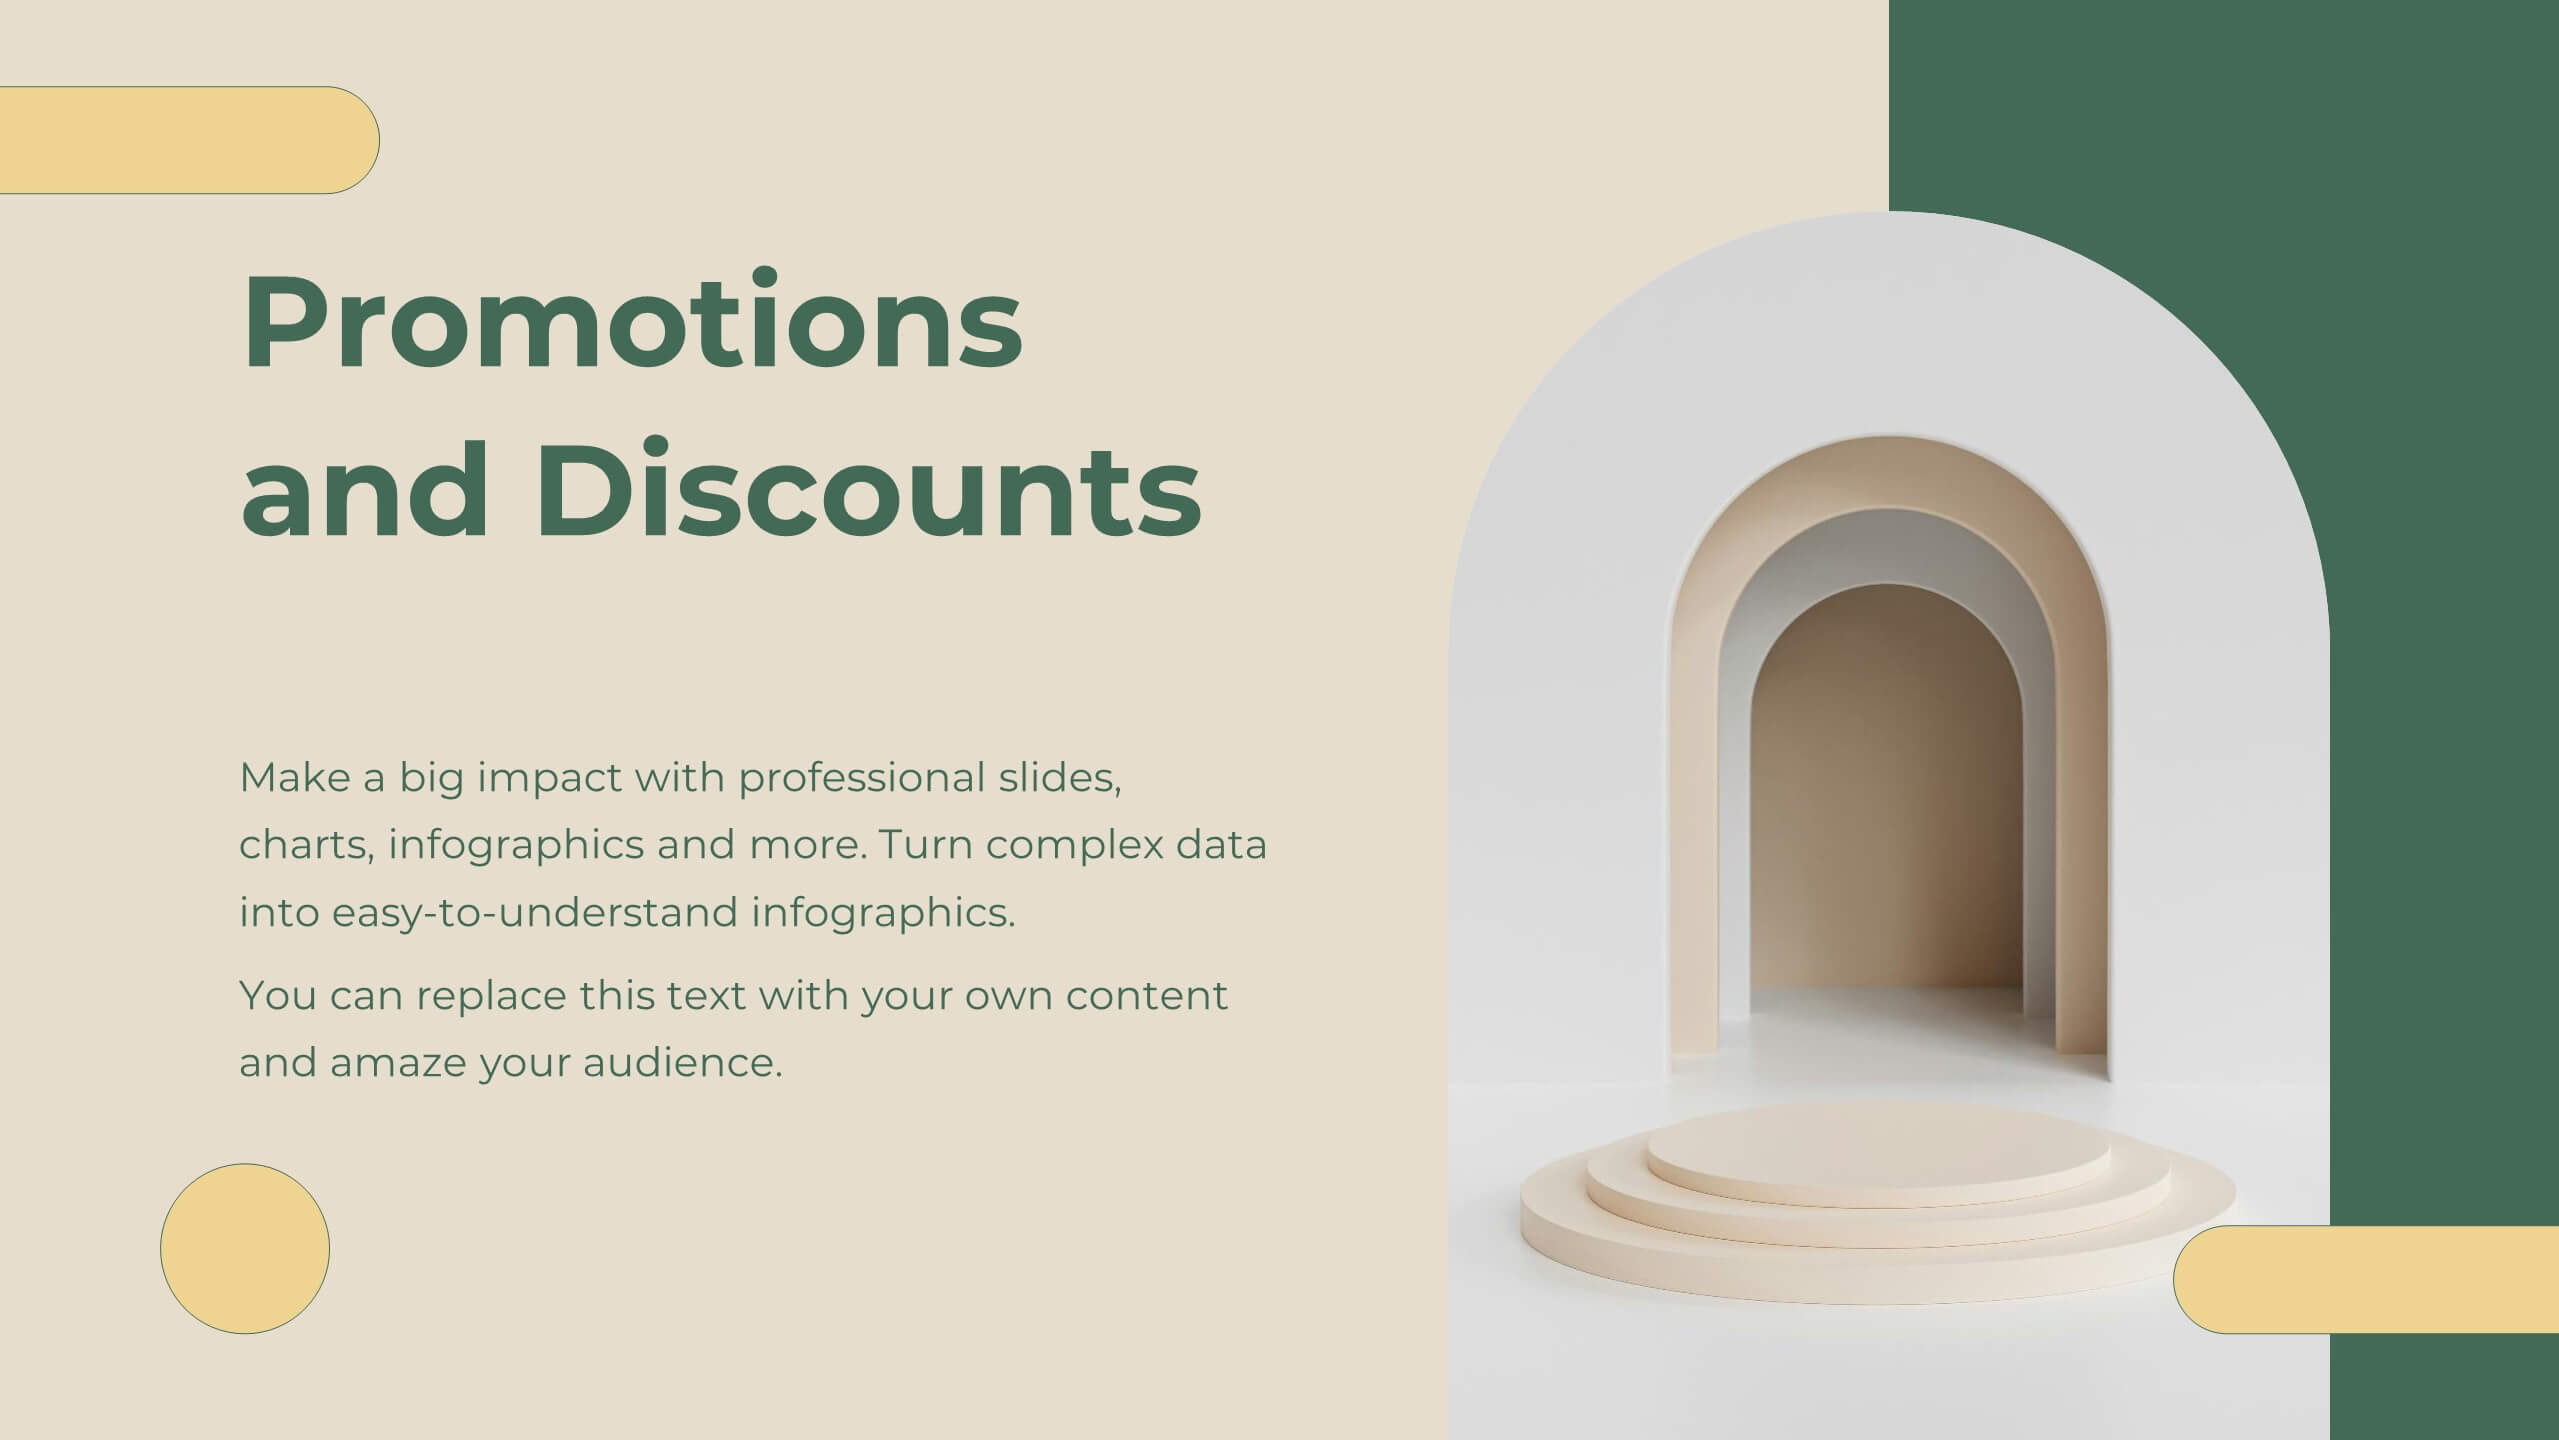
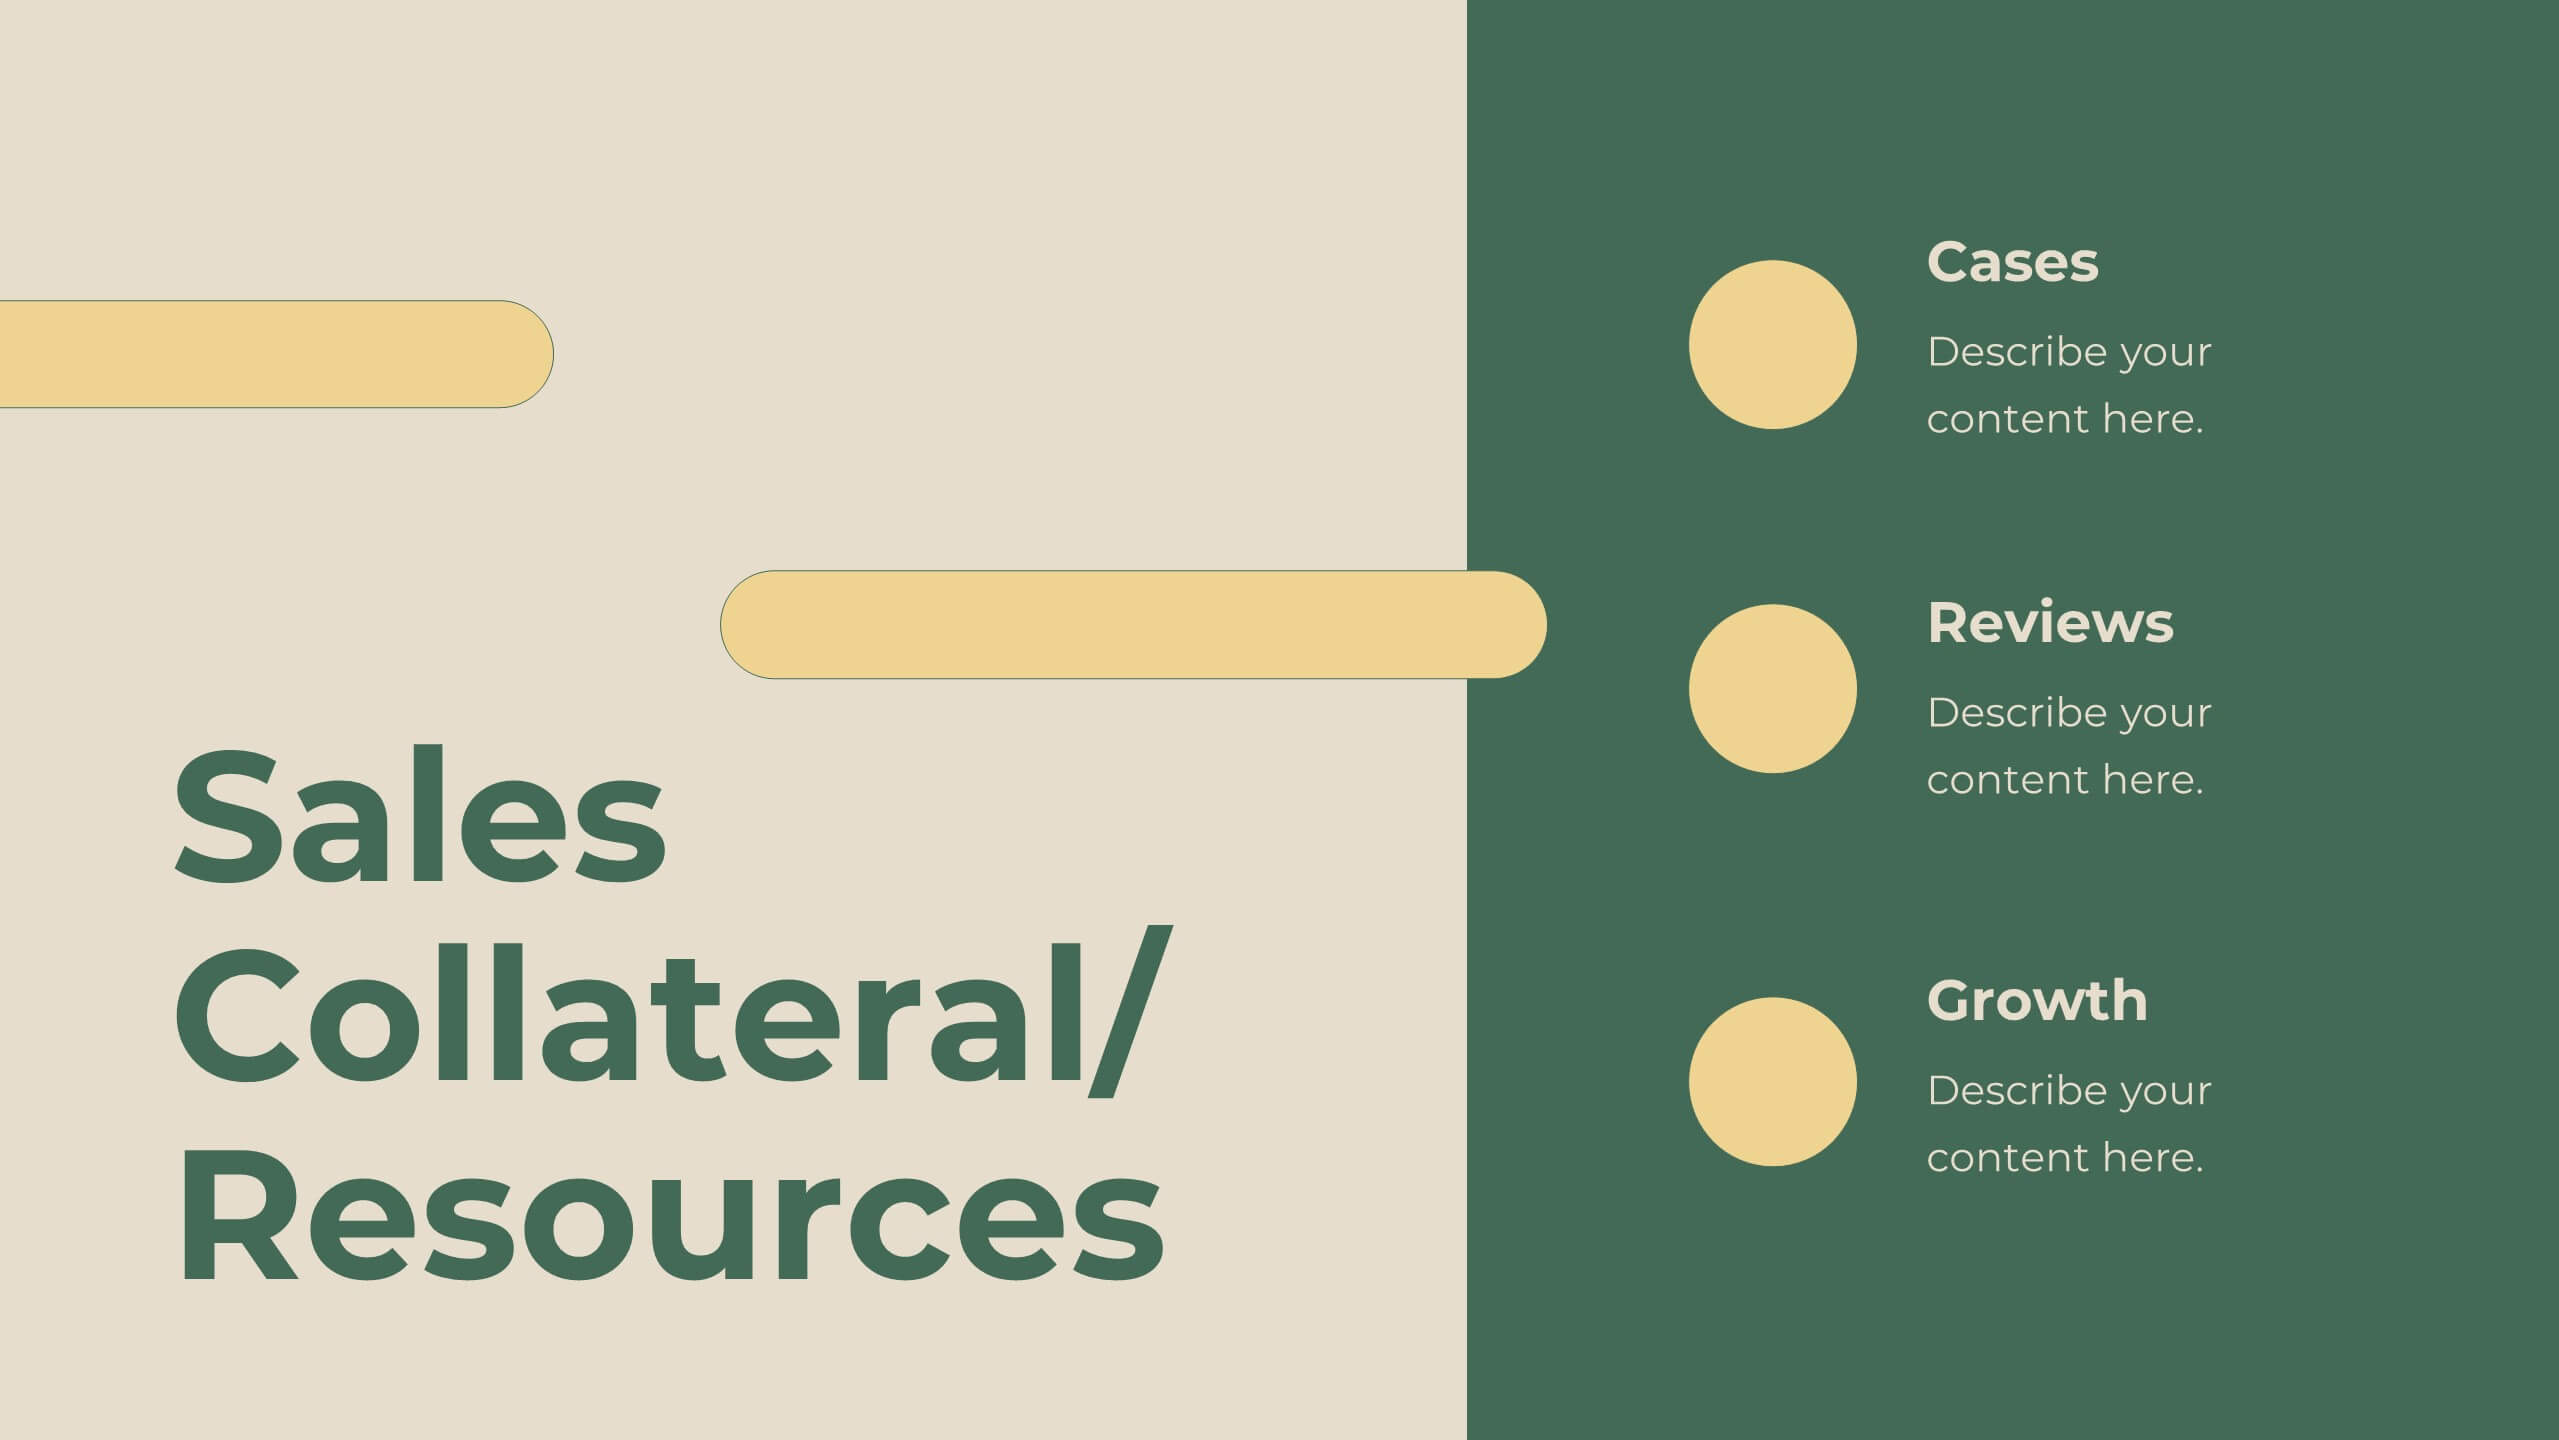
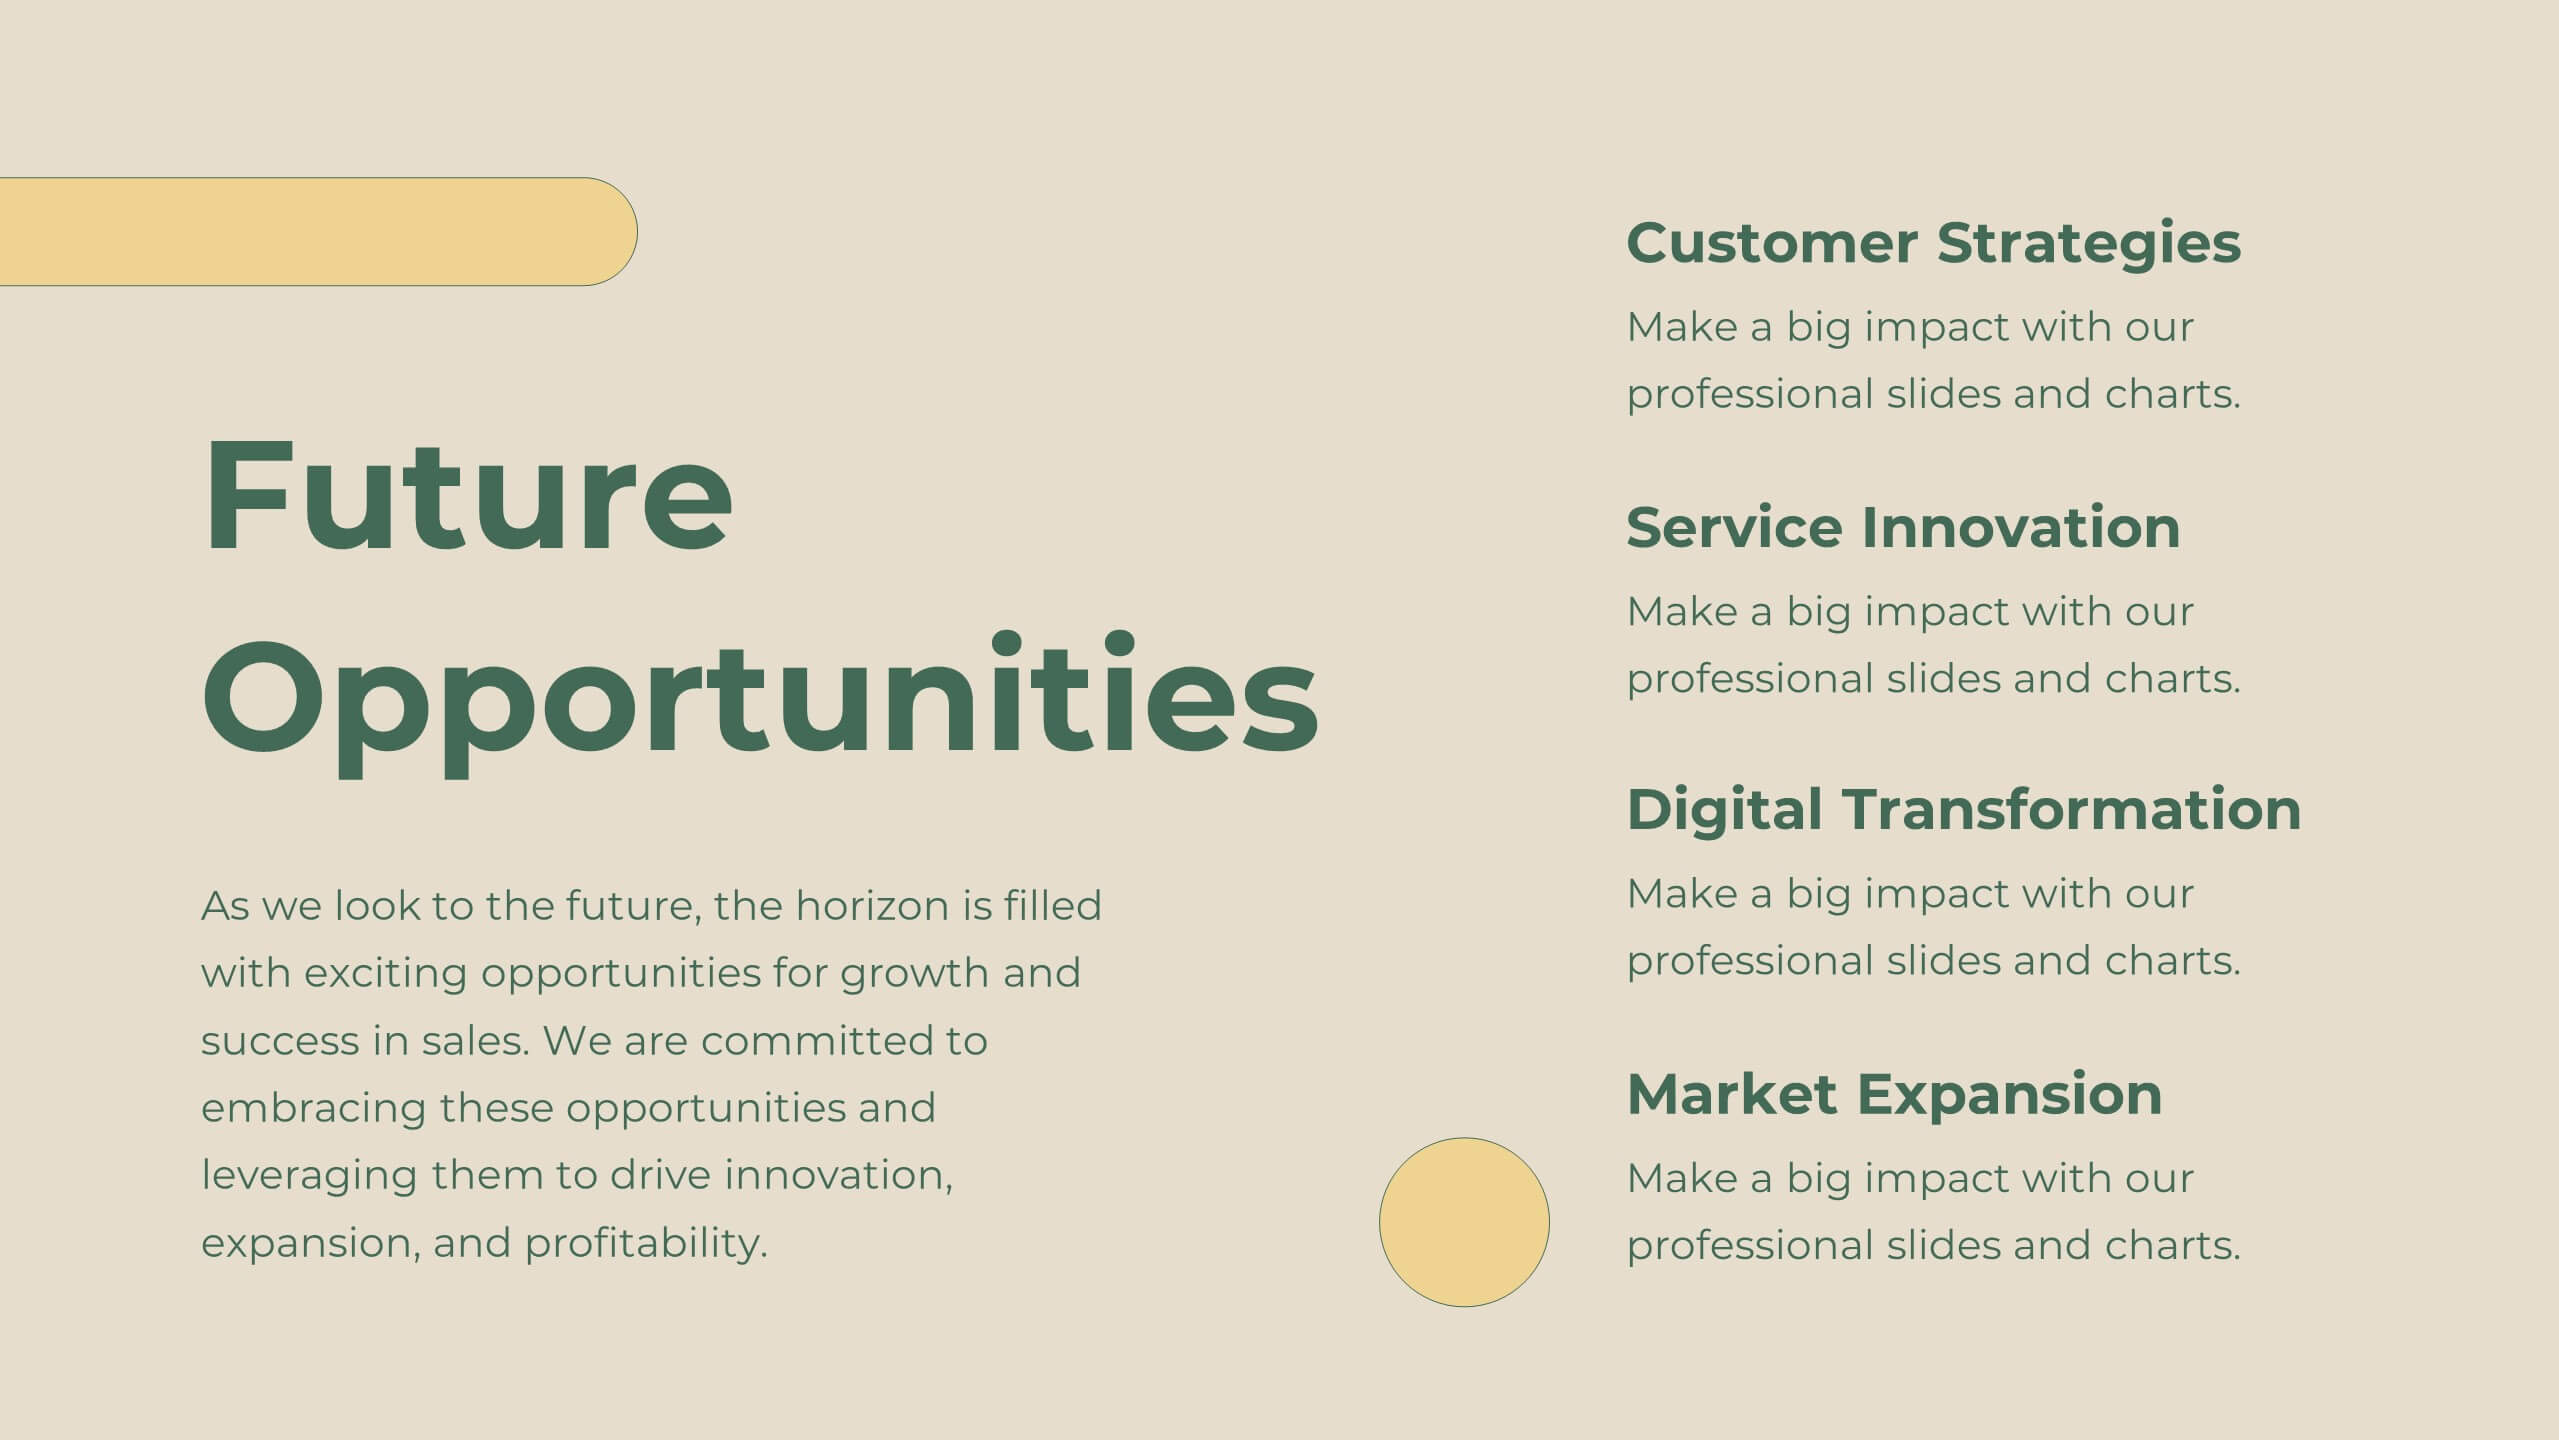
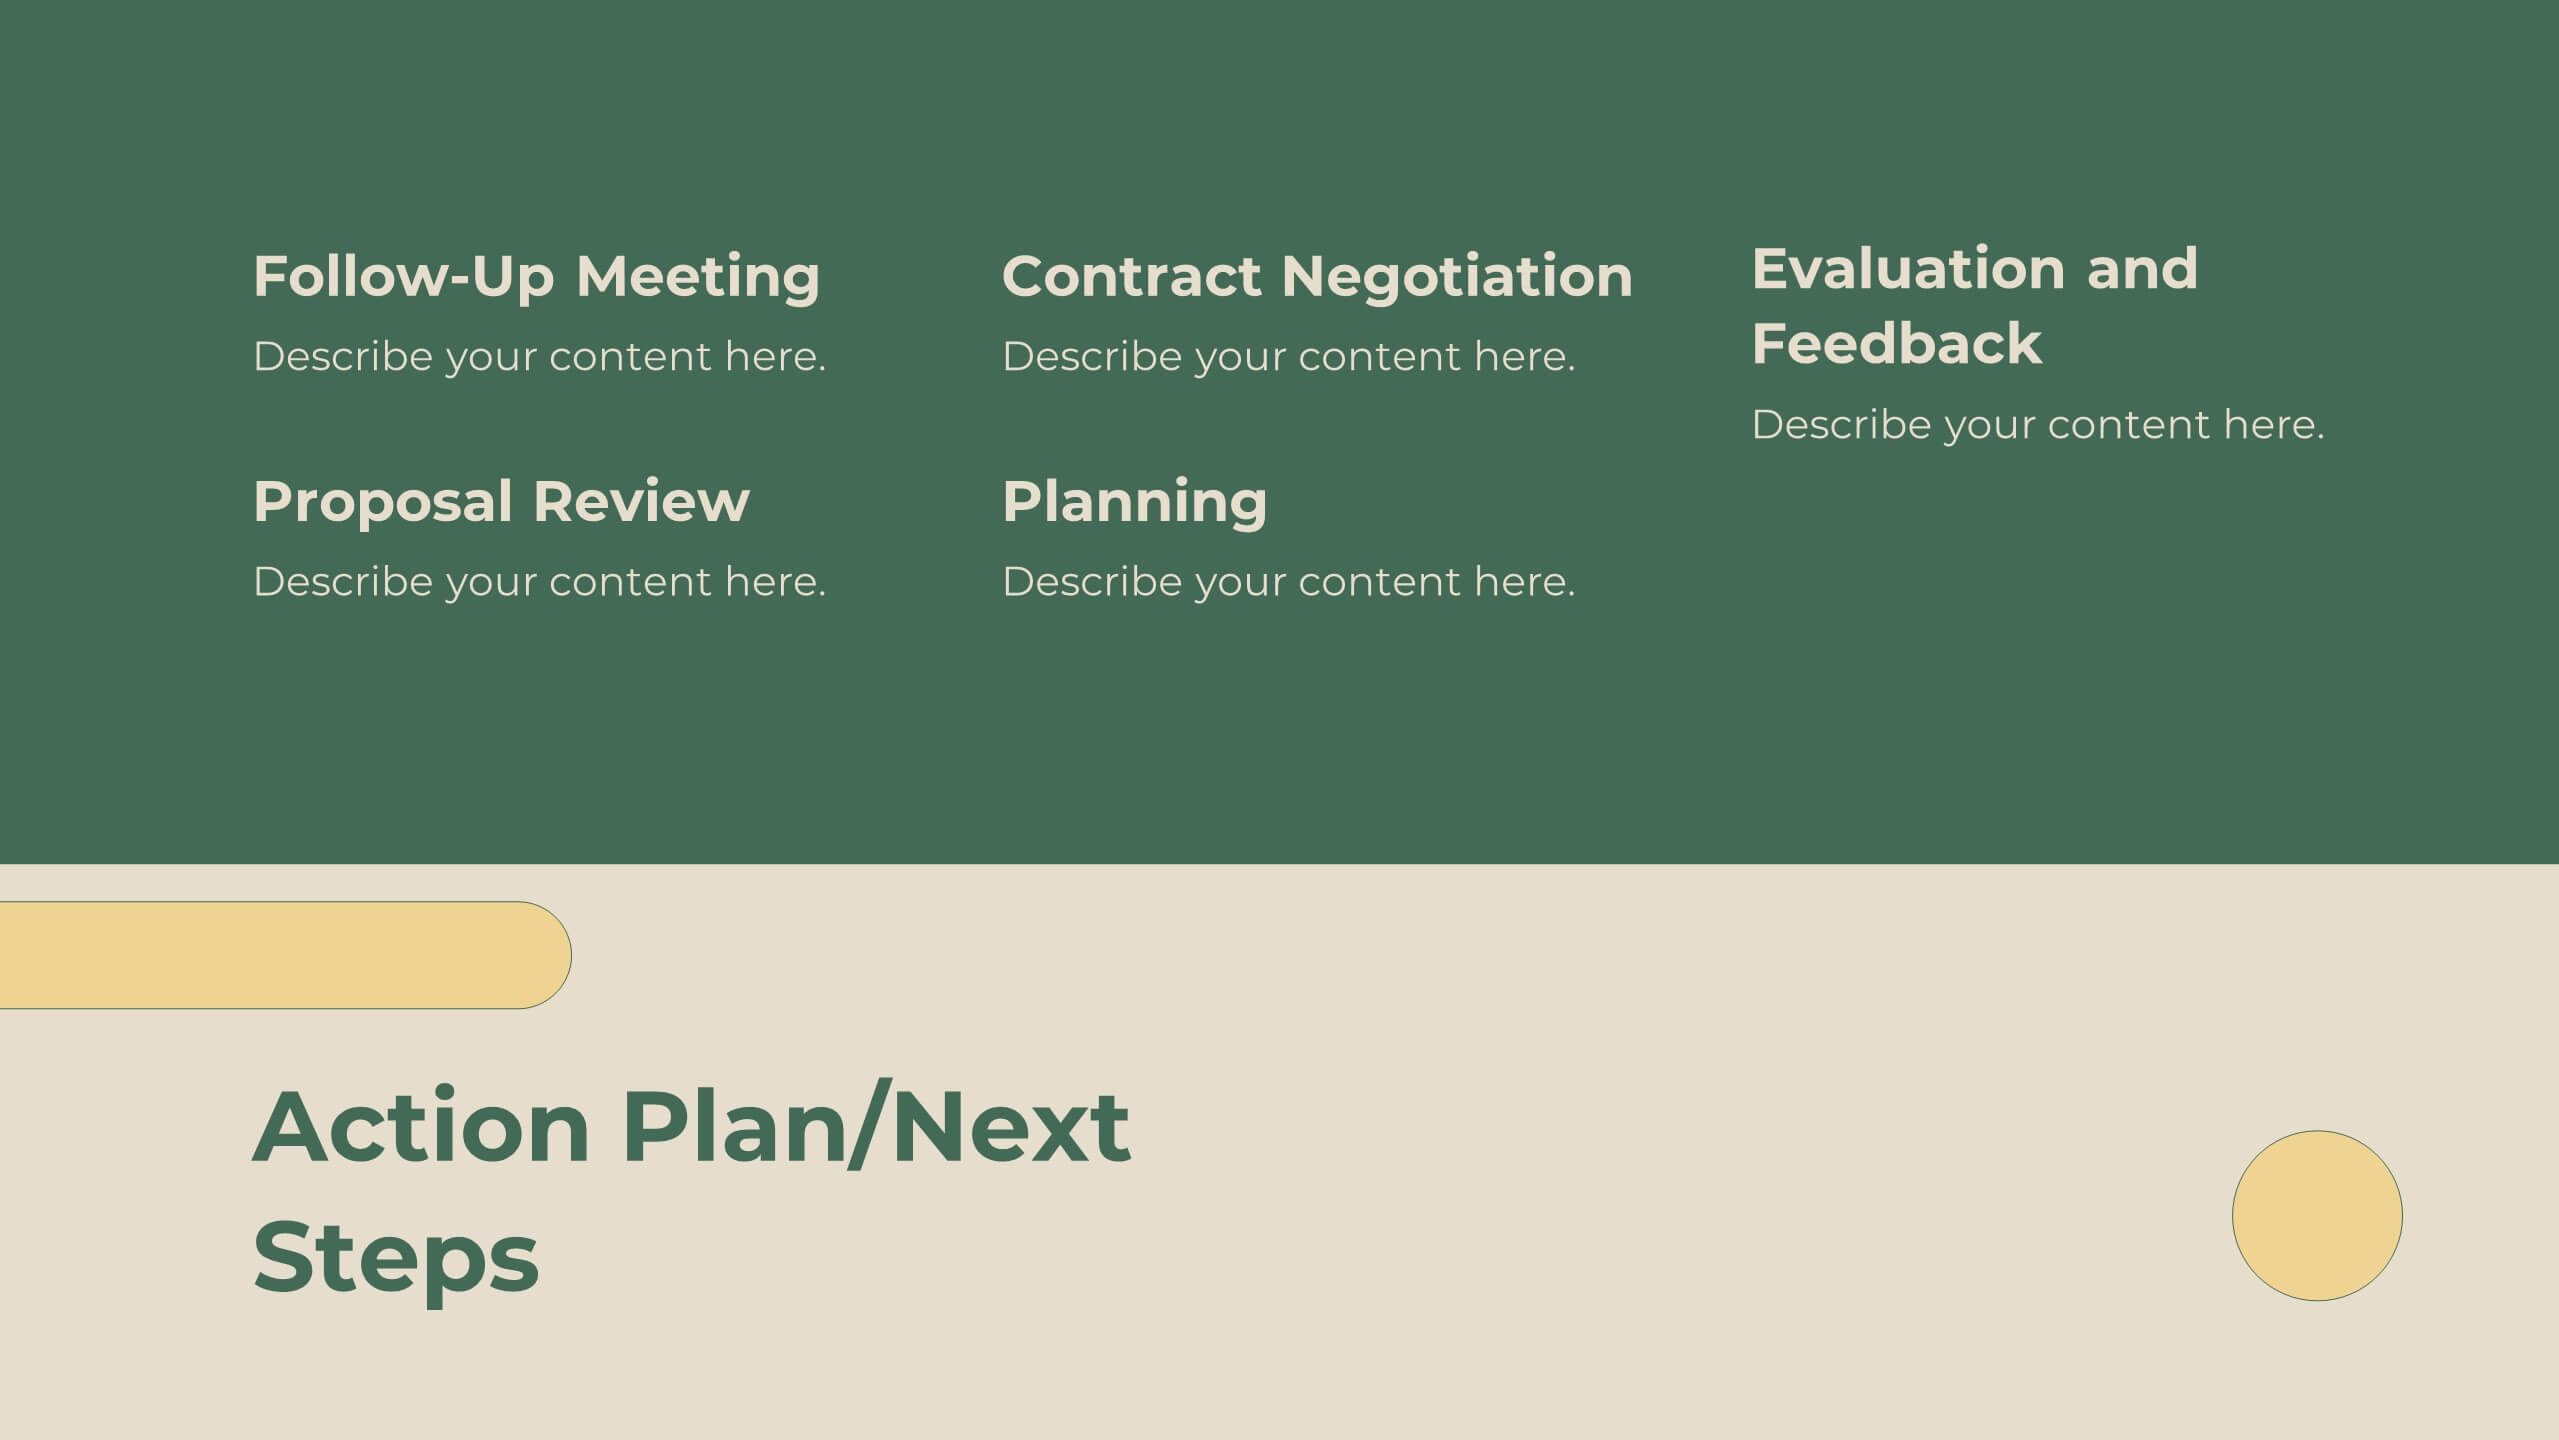
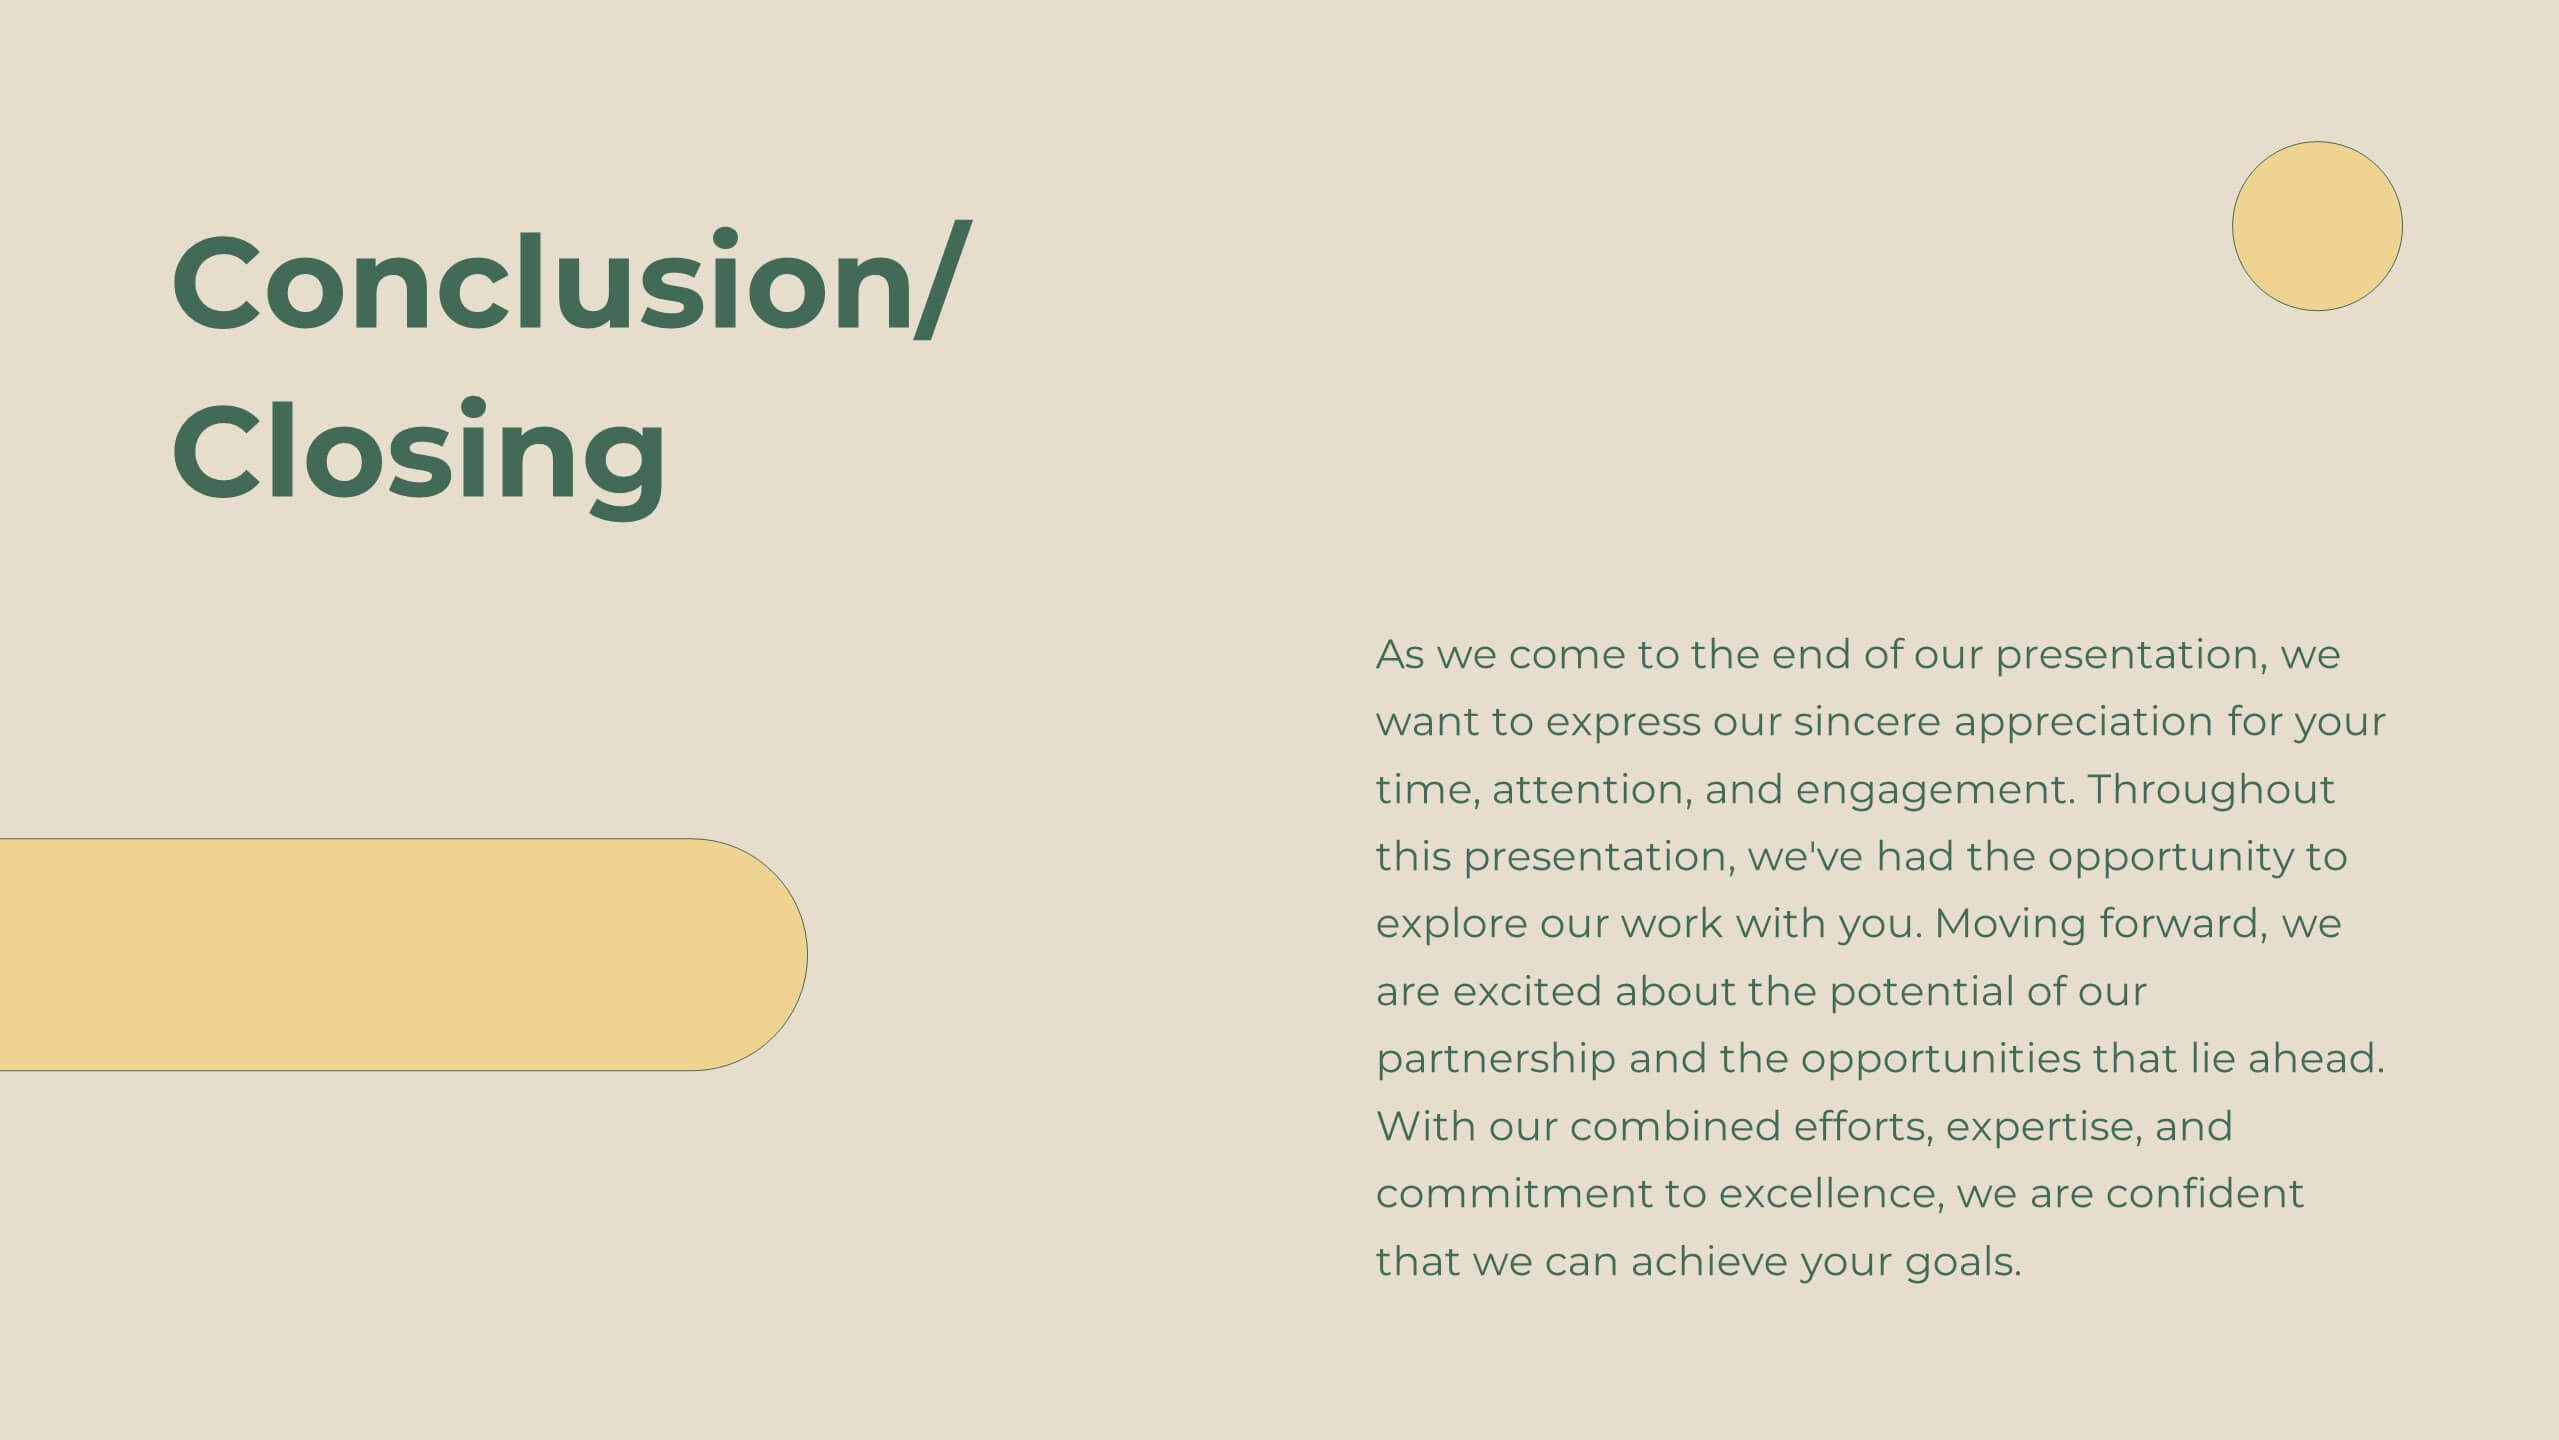
Legacy Sales Strategy Presentation
Boost your sales presentations with this modern template! It features sections for objectives, process, team introduction, customer testimonials, and performance metrics. Ideal for outlining strategies, opportunities, and pricing. Engage your audience with a professional, clean design. Compatible with PowerPoint, Keynote, and Google Slides for seamless integration. Make your sales strategy stand out!


4 diapositivas
Scrum & Agile Sprint Presentation
Bring movement and clarity to your workflow with a dynamic loop-and-sprint visual that makes progress feel intuitive and easy to track. This presentation helps you outline iterations, refine tasks, and communicate team priorities with confidence. Fully editable and compatible with PowerPoint, Keynote, and Google Slides.


7 diapositivas
World Map Infographic Presentation Template
The world map includes 195 recognized countries around the globe. This geographic world map template includes detailed background information and facts on each country, with flags and outline images of each country. You can easily see where all 195 countries are located on this map, and which countries share borders with each other. This overall template design is easy to read and highly informative for any geography enthusiast who wants to learn more about the different countries in the world. This World map template include all continents, regions of the world, oceans and seas.


4 diapositivas
Current vs Future State Gap Presentation
Take your audience on a journey of progress with this dynamic slide, designed to clearly compare where things stand today and where they’re headed next. It helps highlight key gaps, improvement areas, and strategic opportunities with a simple, visual flow. Fully compatible with PowerPoint, Keynote, and Google Slides.


21 diapositivas
Duskflare Corporate Strategy Proposal Presentation
Present your corporate strategy effectively with this comprehensive template, featuring sections on market trends, SWOT analysis, strategic initiatives, and risk management. Designed for clarity and impact, it’s ideal for outlining high-level goals and action plans. Compatible with PowerPoint, Keynote, and Google Slides for seamless presentations.


22 diapositivas
Etherwind Advertising Agency Proposal Presentation
This Advertising Agency Proposal Presentation Template offers a sleek and professional layout, perfect for showcasing your agency's capabilities, services, and success stories. Covering essential sections such as market analysis, strategy development, campaign execution, and client testimonials, it ensures a compelling pitch to potential clients. Designed for easy customization in PowerPoint, Keynote, and Google Slides, making it a versatile choice for agencies looking to impress their audience.


7 diapositivas
Law Infographics Presentation Template
Featuring our Law Infographic template it is a modern and stylish template for making a presentation about law. It comes with a clean design, typography and plenty of space for annotations and is compatible with powerpoint. This template is suitable for a presentation about business, management, finance or marketing. It contains a one page design, illustrations and many different elements to help you build a strong and compelling presentation. Essential and easy to use, this law Infographic template is a great tool for anyone who wants to make an attractive and professional presentation.


4 diapositivas
Startup Business Plan Executive Overview Presentation
Present your startup vision with this bold, rocket-themed executive overview template. Perfect for outlining growth strategies, milestones, and launch plans, it combines vibrant visuals with a clean layout. Fully editable in Canva, PowerPoint, and Google Slides, it’s ideal for inspiring investors and stakeholders with a clear, professional business roadmap.


5 diapositivas
Scrum Methodology for Project Management Presentation
Visualize your team’s process with this Scrum Methodology for Project Management Template. Featuring dynamic arrow and gear illustrations, this slide helps convey product development cycles, sprint planning, reviews, and retrospectives in a clean, engaging format. Fully editable and ready for PowerPoint, Keynote, and Google Slides.


5 diapositivas
Financial Budget Infographics
Financial goals refer to specific objectives and targets that individuals or businesses set to manage their finances effectively and achieve financial success. These vertical infographics are designed to help individuals and businesses effectively present their financial budgets and plans. Whether you're a financial analyst or a business owner, this template is perfect for conveying complex financial information in a clear and concise manner. These infographics provide an overview of the budget, showcasing key financial goals, total income, and total expenses. This features visuals to help users set and track financial goals.


8 diapositivas
Leadership and Management Presentation
The "Leadership and Management" presentation template uses a mountain metaphor to visually depict the challenges and achievements in leadership and management roles. Each slide features a series of peaks, symbolizing different stages or goals within a project or initiative. The climbers on various parts of the mountain can represent team members or leaders at different phases of their tasks. This template is versatile, suitable for presentations aimed at discussing strategies, milestones, or team dynamics in corporate settings. It offers a clear and engaging way to present complex information through a straightforward visual narrative.


5 diapositivas
Logistics Flow Diagram Presentation
Turn complex processes into a clear visual journey with this dynamic presentation design. Ideal for illustrating workflows, delivery systems, or operational stages, it helps simplify how goods or data move from start to finish. Fully editable and compatible with PowerPoint, Keynote, and Google Slides for seamless customization and presentation.