


Características


¿Tienes alguna pregunta?
Recomendar


10 diapositivas
Corporate Governance and Law Presentation
Master the essentials of organizational oversight with the "Corporate Governance and Law" template, which offers a structured approach to business management, effectively illustrating key elements such as performance, strategy, governance, talent, and integrity. This layout ensures easy comprehension and is ideal for illustrating the hierarchical relationships and regulatory frameworks in corporate environments. Compatible with PowerPoint, Keynote, and Google Slides.


6 diapositivas
Supply Chain Management Strategy Presentation
Enhance your logistics planning with the Supply Chain Management Strategy template. This visually structured design simplifies key supply chain components, from procurement to distribution, making it ideal for analysts and operations teams. Fully customizable and compatible with PowerPoint, Keynote, and Google Slides for a seamless and professional presentation experience.


7 diapositivas
Circle Chart Infographic Presentation
This unique design incorporates both circular and star-shaped elements to convey information in charts. Whether your goal is to showcase market shares, highlight trends, or simply enhance your academic presentation, this infographic will help you achieve it. You can edit this template without any need of design skills or technical knowledge. This presentation includes 7 slides, chart shapes with colors and fonts, all fully customizable. This template is an excellent choice for presenting content on any topic, in a circular format. Simply put your data on the design, add a title, and you're done!


6 diapositivas
South America Language Map Infographics
South America is located in the Western Hemisphere and is known for its diverse landscapes, cultures, and countries. This infographic template can provide a visual representation of the countries and key information about the continent's geography, culture, economy, and more. This template is designed to help your audience gain insights into the diverse and rich continent, making it a valuable tool for educational, promotional, and informative purposes. This map infographic can be shared on websites, social media platforms, presentations, and marketing materials targeting audiences interested in South America.


26 diapositivas
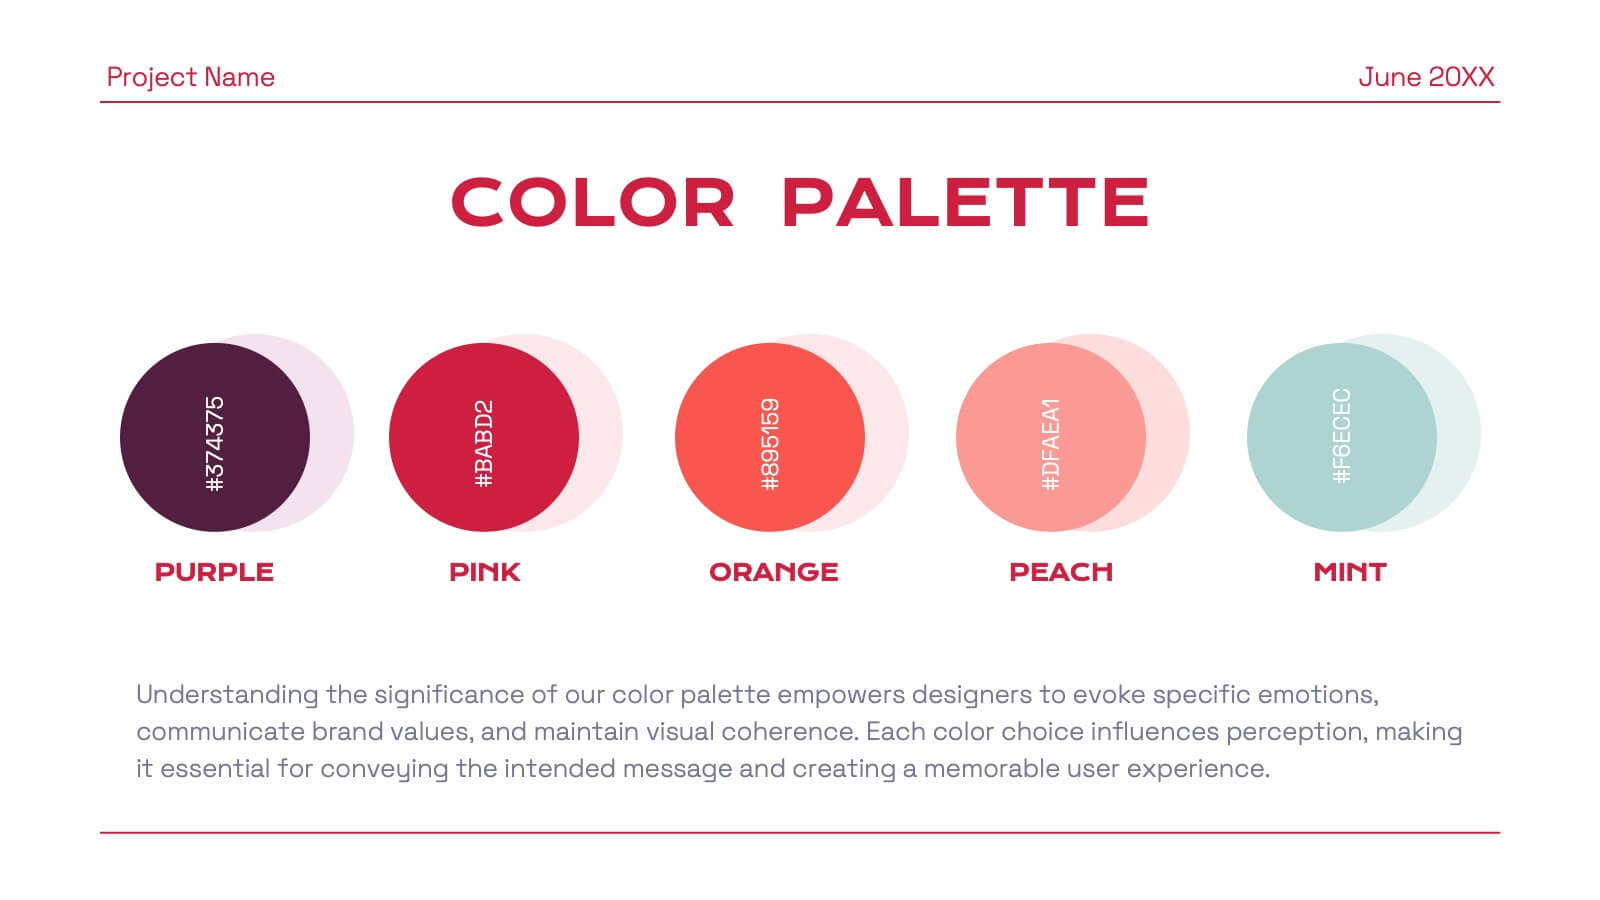
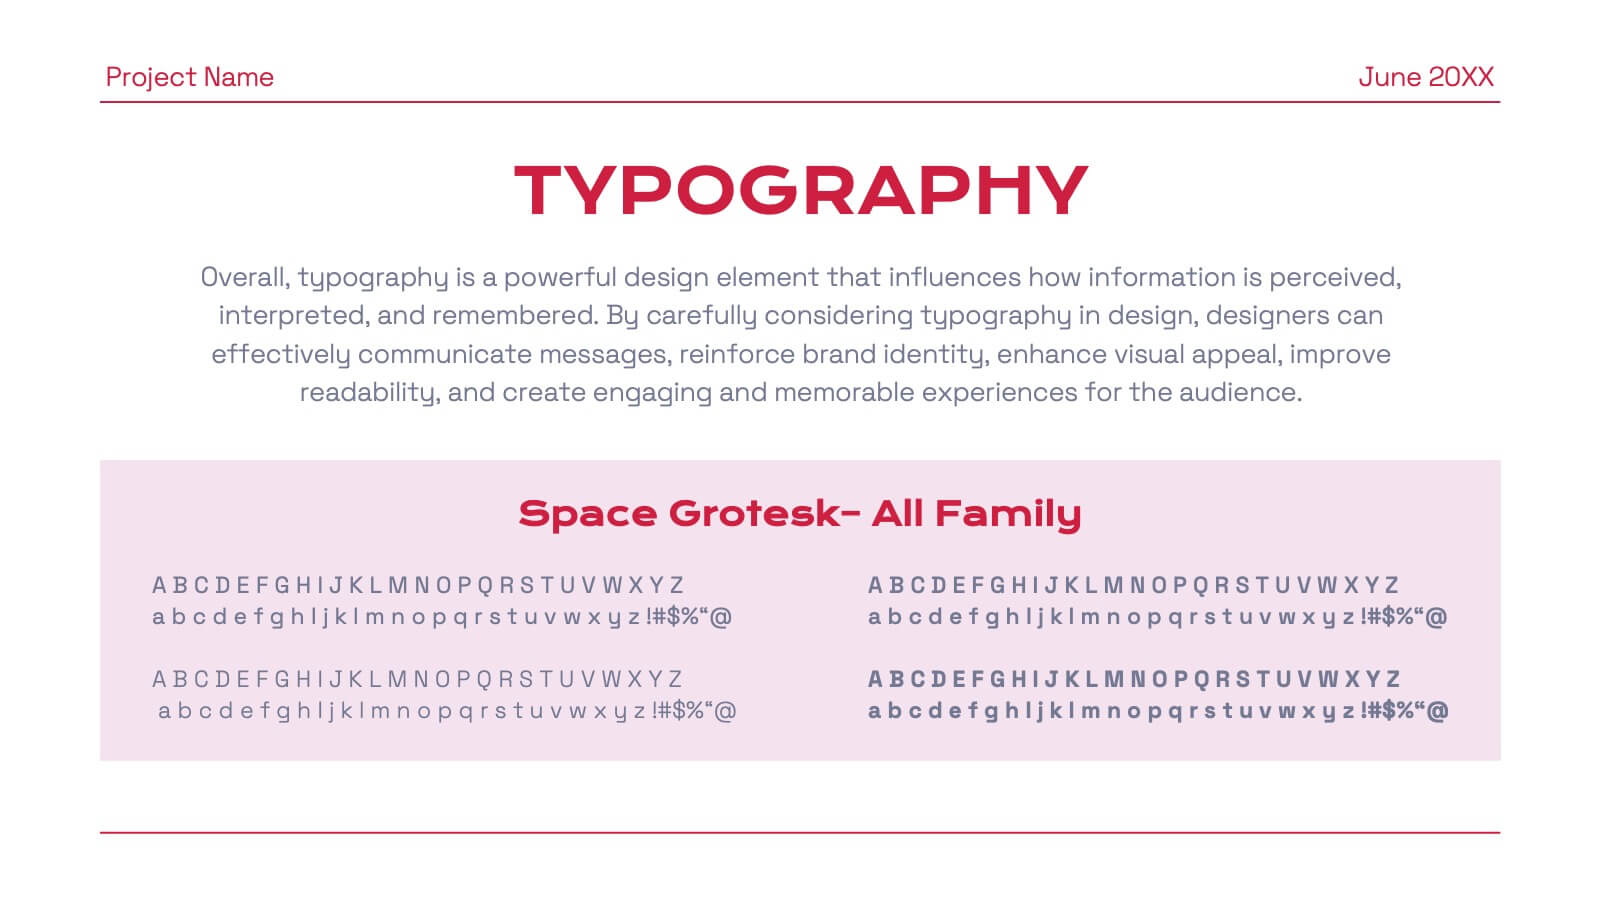
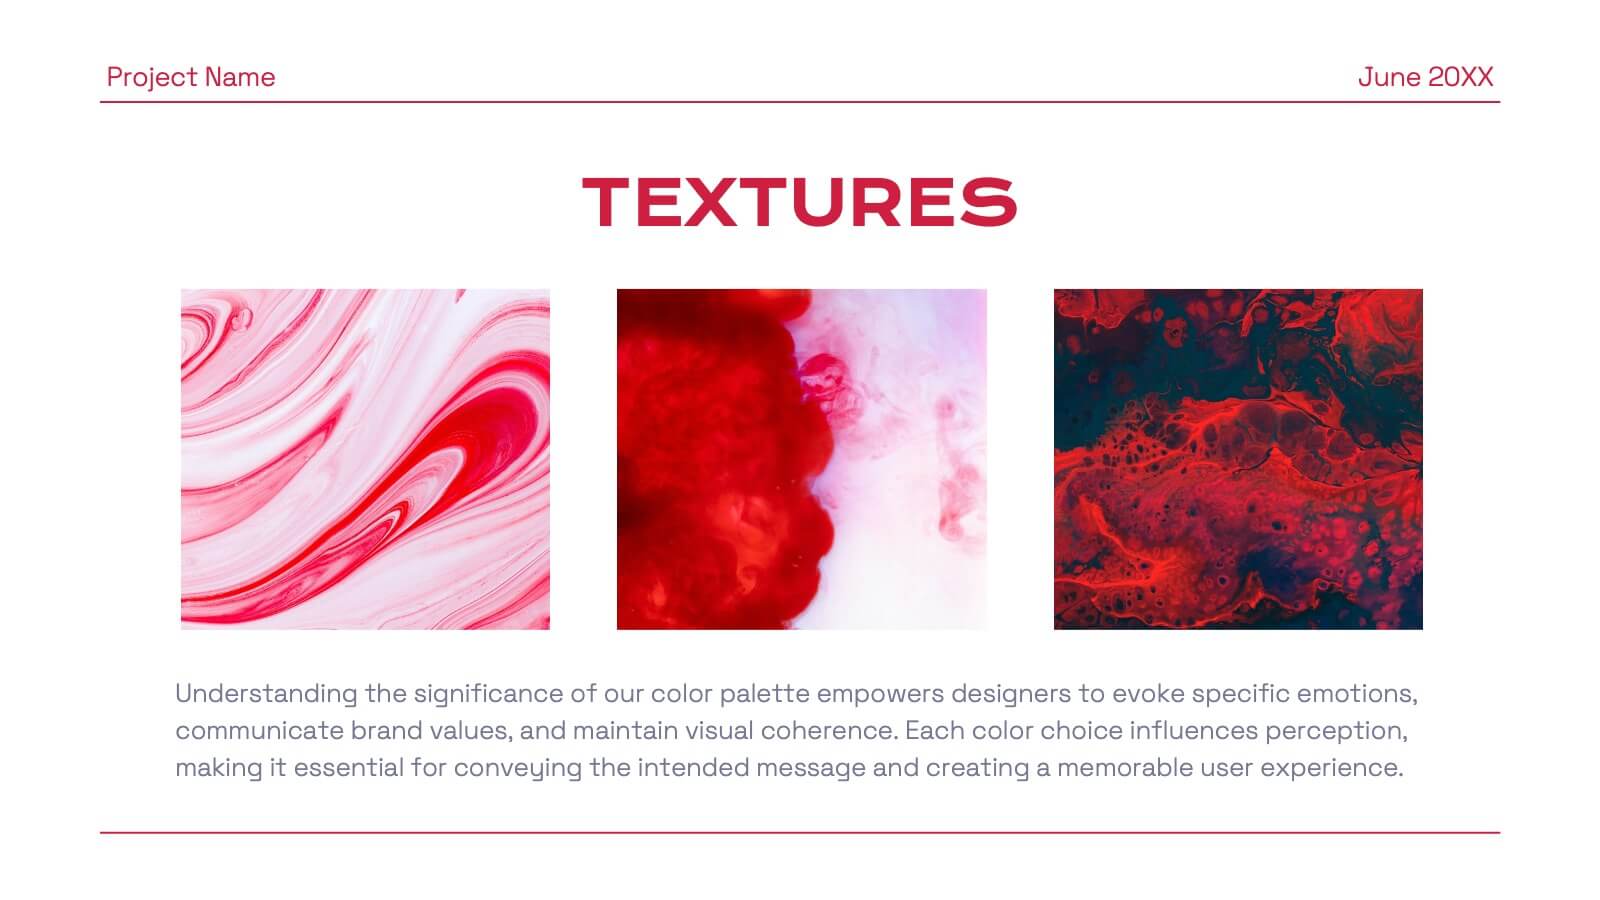
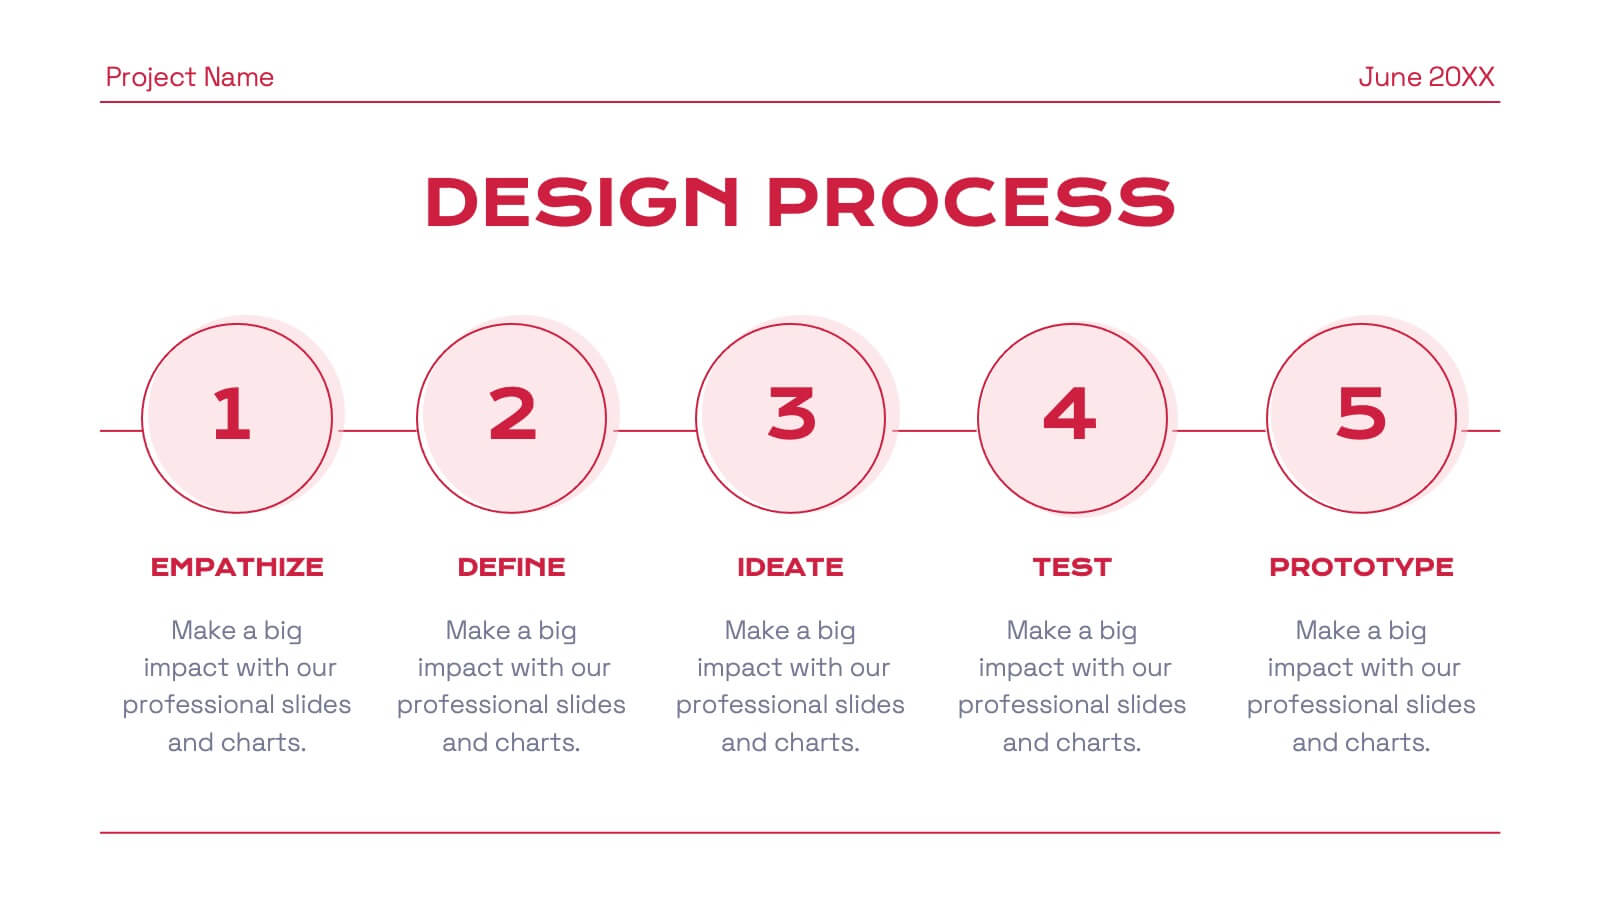
Tempo Brand Identity Presentation
Introduce and elevate your brand with this versatile presentation template designed to reflect your company's vision and values. Perfect for businesses looking to showcase their brand strategy, components, and touchpoints with clarity and professionalism. This presentation features thoughtfully designed slides covering brand identity components, visual guidelines, target audience insights, and future development plans. Use dedicated sections to outline your unique selling proposition, positioning, and strategy. With its clean layout and attention to detail, it's ideal for presenting a cohesive and impactful brand narrative. Compatible with PowerPoint, Google Slides, and Keynote, this template is fully customizable. Edit colors, text, and images to align with your brand aesthetics and messaging. Deliver your presentation with confidence, ensuring your audience is inspired by a polished and professional brand identity.


5 diapositivas
Pet Care Infographics
Pet care refers to the practices and actions taken to ensure the well-being, health, and happiness of pets. These vertical infographic templates are perfect for providing essential information and tips for pet owners to ensure the well-being and proper care of their furry companions. This infographic is designed to present key aspects of pet care in a concise and engaging manner, making it a valuable resource for pet owners, veterinarians, pet stores, or any organization related to pet care. Compatible with Powerpoint, Keynote, and Google Slides. Use the text boxes and graphs to promote responsible pet ownership and provide valuable information about pet care.


6 diapositivas
Evolution of an Industry Through Time Presentation
Visualize industry transformation with the Evolution of an Industry Through Time Presentation. This timeline-style layout is perfect for highlighting key milestones, technological shifts, or growth stages across decades. Ideal for consultants, educators, or corporate strategists. Fully editable in Canva, PowerPoint, Keynote, and Google Slides for easy adaptation.


6 diapositivas
Creative Thinking and Innovation Presentation
Unleash Creative Thinking and Innovation with this engaging infographic. Featuring a visually dynamic brain puzzle design, this template is perfect for presenting problem-solving strategies, brainstorming techniques, and creative business solutions. Fully editable and compatible with PowerPoint, Keynote, and Google Slides.


5 diapositivas
Strategic Objectives and Goals Presentation
Bring your strategy to life with a clear, forward-moving layout that makes every milestone feel achievable. This presentation guides audiences through key objectives, breakthrough goals, and measurable progress, helping teams stay aligned and inspired. Fully editable and easy to adapt, it works seamlessly with PowerPoint, Keynote, and Google Slides.


5 diapositivas
Dynamic Pricing Strategies
Make pricing strategy look smart and data-driven with this bold, modern infographic template. Designed to explain how pricing evolves with demand, value, and profit margins, this slide visually guides viewers through key steps in your dynamic pricing model. Fully editable and compatible with PowerPoint, Keynote, and Google Slides for seamless use.


7 diapositivas
PESTEL Analysis Infographic Presentation Template
A PESTEL Analysis Infographic is a great tool to highlight the risks and opportunities of a market. Based on the needs of your customers, this Infographic can help you communicate key information about competition, regulatory environment and economic outlook. This template can also be used for stocks of any company from any industry. This is a comprehensive pestel analysis infographic that will show you the factors that are driving and restraining the growth of your industry. This template can help companies to identify their weaknesses and drive their strengths with the pestel analysis.


6 diapositivas
Business RAPID Model Diagram Presentation
Turn decision-making into a visual story with this bold, professional diagram that highlights each stage of responsibility and collaboration. Designed to simplify complex workflows, it’s perfect for outlining business strategies, performance reviews, or team structures. Fully compatible with PowerPoint, Keynote, and Google Slides for easy editing and presentation.


7 diapositivas
Regular Smile Rating Infographic
In the age of customer feedback and reviews, understanding satisfaction levels is paramount. Our regular smile rating infographic, bursting with vibrant shades of green, red, yellow, and orange, offers a visually engaging method to gauge emotions and sentiments. Designed with expressive faces, it showcases a range of sentiments from displeasure to sheer joy. This template is an indispensable tool for businesses, educators, and surveyors eager to capture genuine responses and sentiments. With compatibility across PowerPoint, Keynote, and Google Slides, this infographic is poised to make your presentations more interactive and insightful.

22 diapositivas
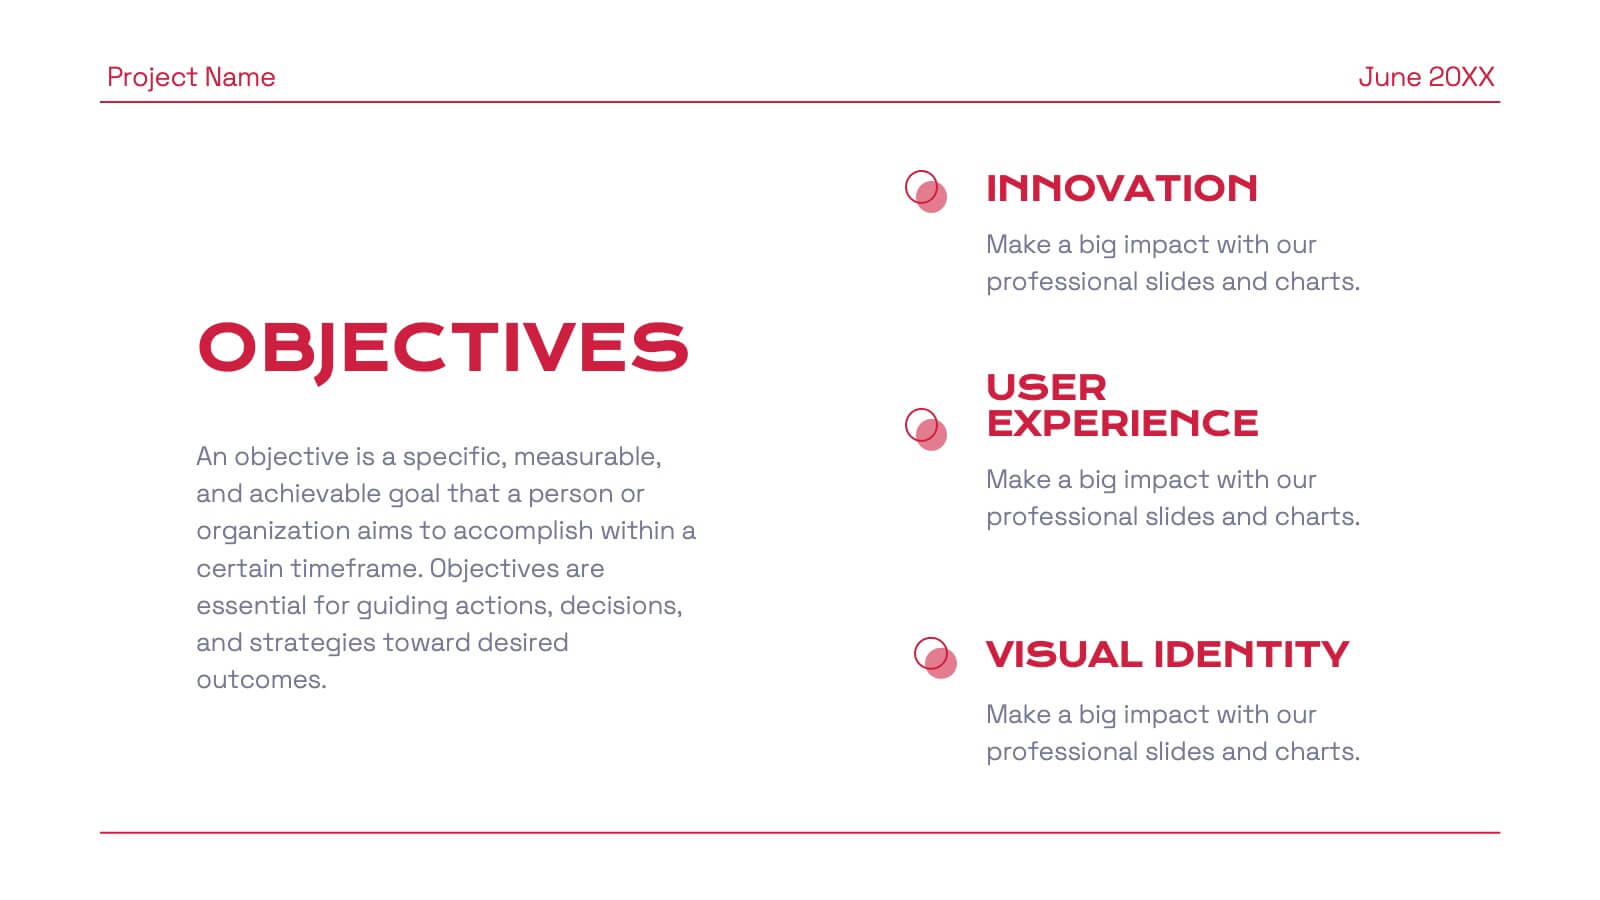
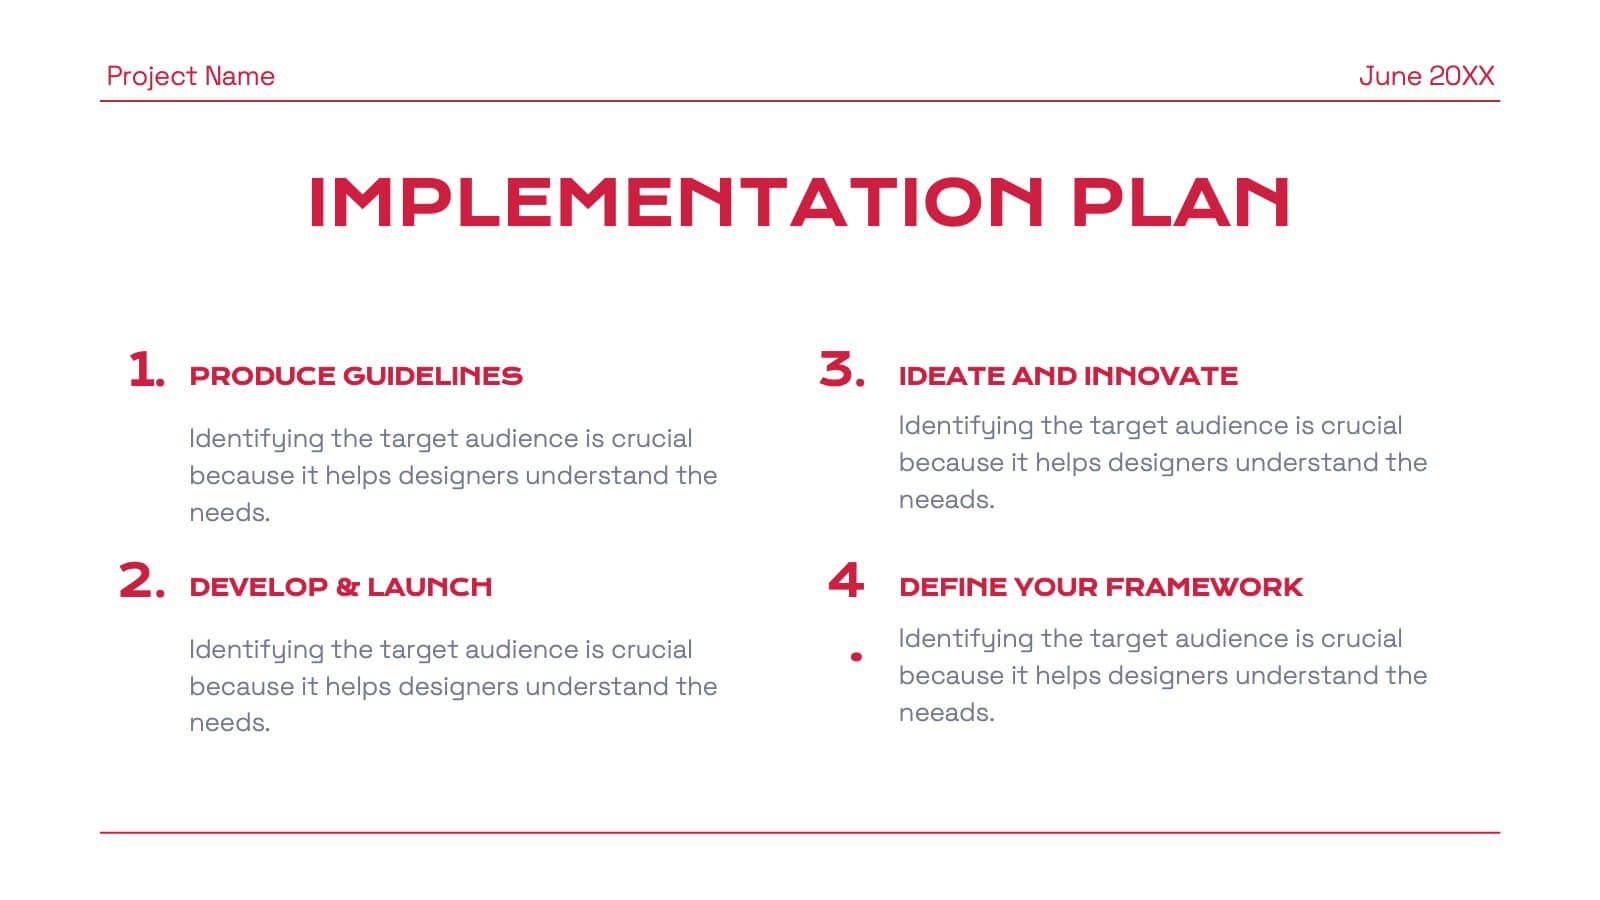
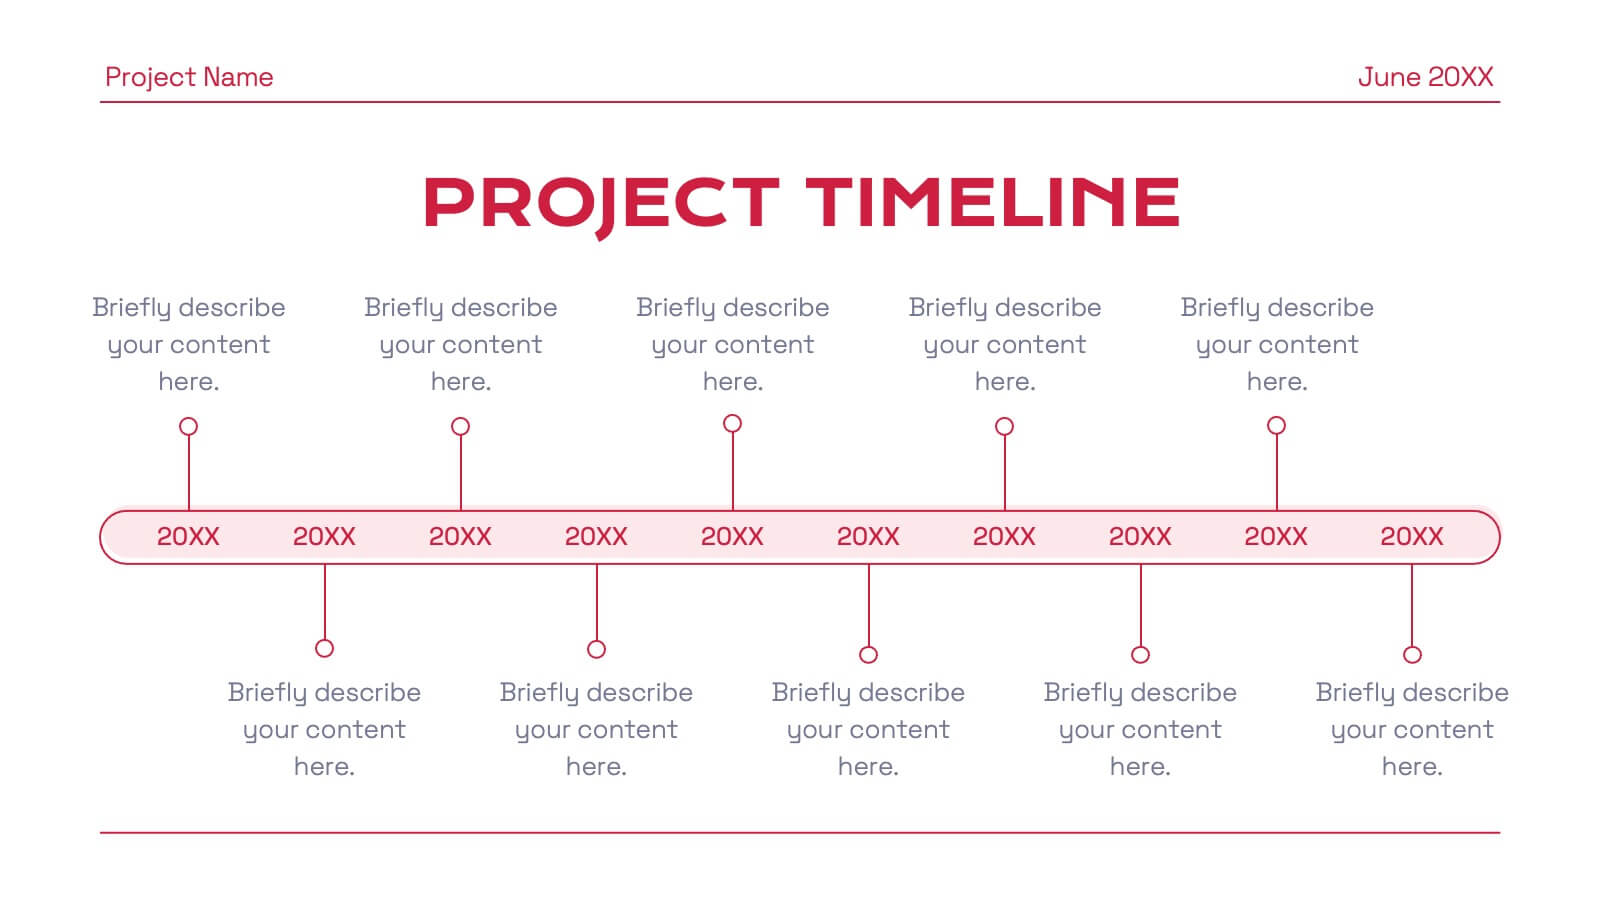
Eclipse Graphic Design Project Plan Presentation
Develop a winning marketing strategy with this dynamic template. Dive into current trends, consumer behavior, and innovative techniques. Perfect for social media, influencer marketing, and data-driven campaigns. Fully compatible with PowerPoint, Keynote, and Google Slides.


6 diapositivas
Cause-and-Effect Chain Using Fishbone Diagram Presentation
Break down complex issues step by step with the Cause-and-Effect Chain Using Fishbone Diagram Presentation. Ideal for project managers, analysts, or educators, this template helps you visually map out relationships between causes and outcomes. Fully editable in Canva, PowerPoint, and Google Slides for seamless integration into your workflow.


5 diapositivas
Cloud Security and Data Storage Presentation
Visually explain your cloud architecture and data protection strategy with this sleek horizontal diagram. Each layered icon represents different aspects of storage, access, and security control—perfect for IT audits, cloud infrastructure briefs, and risk management reports. Fully editable in PowerPoint, Keynote, and Google Slides.


5 diapositivas
Easy Asian Recipes Infographics
Asian cuisine is incredibly diverse and offers a wide range of delicious and flavorful recipes from various countries and regions. These vertical infographics are designed in a user-friendly design that showcase a collection of simple and delicious Asian recipes. These are perfect for home cooks, food bloggers, and anyone interested in exploring the flavors of Asian cuisine. These infographics include beautifully designed recipes for a variety of popular Asian dishes, such as ramen, teriyaki chicken, and more. Each recipe provides a list of ingredients needed and step-by-step instructions to guide users through the cooking process.