


Características


¿Tienes alguna pregunta?
Recomendar


6 diapositivas
Targeted Segment Analysis and Mapping Presentation
Highlight your market focus with the Targeted Segment Analysis and Mapping Presentation. This circular layout is perfect for breaking down five audience segments, using subtle icons and visual emphasis for clarity. Ideal for marketers, strategists, and business analysts presenting niche targeting. Fully editable in Canva, PowerPoint, Keynote, and Google Slides.


6 diapositivas
Behavioral Psychology Insights
Discover what drives decision-making with the Behavioral Psychology Insights Presentation. This template is perfect for exploring user behavior, mindset patterns, or psychological triggers in business, marketing, or HR. Professionally designed for PowerPoint, Keynote, and Google Slides—fully editable and easy to adapt.


6 diapositivas
Technology Stack and Platform Design
Visualize your full tech ecosystem with the Technology Stack and Platform Design Presentation. This layered pyramid layout helps you break down five key platform levels, from cloud services to core infrastructure. Clean, professional, and fully editable in PowerPoint, Keynote, and Google Slides for seamless customization. Ideal for developers and IT teams.


26 diapositivas
HIIT Workout Pink Presentation
Unleash the energy with our vibrant HIIT gym workout presentation template, a dynamic blend of pink, red, orange, and yellow, designed to bring your fitness regime to life. This energetic palette is perfect for gym owners, fitness influencers, and personal trainers aiming to showcase the high-intensity intervals that promise fast results. The template offers various graphics, icons, and image placeholders that add a visual punch to your information. Dive into creating an engaging, motivational fitness journey that highlights the benefits, routines, and transformative power of HIIT workouts, ensuring your audience is pumped and ready to go!


7 diapositivas
Abstract Business Diagrams in Geometry
Showcase your ideas with visual impact using the Abstract Business Diagrams in Geometry Presentation. This modern layout features a six-part hexagonal structure, ideal for presenting categories, segments, or processes. Each shape is numbered, icon-supported, and color-coded for clarity and emphasis. Perfect for strategy, planning, or data overviews. Fully editable in PowerPoint, Keynote, and Google Slides.


6 diapositivas
RAPID Responsibility Matrix Infographics
Efficiently manage responsibilities and tasks with our RAPID Responsibility Matrix infographic template. This template is fully compatible with popular presentation software such as PowerPoint, Keynote, and Google Slides, allowing you to easily customize it to meet your specific project needs. The RAPID Responsibility Matrix infographic template offers a structured framework for defining roles and responsibilities within your team or organization. Whether you're a project manager, team leader, or simply looking to streamline workflows, this template provides a user-friendly platform to create clear and concise matrices for your projects. Optimize your project management processes with this SEO-optimized RAPID Responsibility Matrix infographic template, thoughtfully designed for clarity and ease of use. Customize it to assign and communicate responsibilities effectively, ensuring smooth collaboration and project success. Start crafting your personalized infographic today!


20 diapositivas
Amethyst Marketing Proposal Template Presentation
Bring your marketing ideas to life with this eye-catching amethyst-themed presentation! Tailored for presenting your marketing proposals, this template helps you outline key strategies, campaigns, and target audiences in a sleek, professional design. Its bold layout ensures your message shines through. Compatible with PowerPoint, Keynote, and Google Slides.


7 diapositivas
Job Title Infographic
The slides displayed offer a range of stylish and clear title designs for various business and creative presentations, ideal for introducing key concepts and sections within a professional document or presentation. Each slide is crafted to represent themes such as annual reports, digital strategies, and project retrospectives, as well as specialized areas like web design, strategic planning, and SEO. The designs incorporate modern aesthetics with clean lines, bold color palettes, and minimalist graphic elements, ensuring that the titles are not only eye-catching but also effectively convey the subject matter. This variety allows presenters to choose a slide that best fits the tone and topic of their presentation, making each section distinct and engaging for the audience. These slides are perfect for professionals looking to present complex information in an accessible and visually appealing format.


6 diapositivas
Next-Gen Wireless Solutions Overview Presentation
Give your wireless solutions pitch a sleek, professional edge with this futuristic globe-style layout. Perfect for tech-driven topics, this infographic highlights six key areas in a clear, visually engaging format. Fully customizable and easy to use in PowerPoint, Keynote, and Google Slides—ideal for product overviews, innovation briefings, or strategy updates.


3 diapositivas
Persona Mapping for Target Audience Presentation
Get clear on who you're speaking to with this visual persona mapping slide. Ideal for marketing plans, customer research, or segmentation strategies, this layout helps you define and compare target audience types with clean icons and text space. Fully editable and works with PowerPoint, Keynote, and Google Slides.


6 diapositivas
Stakeholder Management Analysis Infographics
Efficiently manage stakeholders with our Stakeholder Management Analysis infographic template. This template is fully compatible with popular presentation software like PowerPoint, Keynote, and Google Slides, allowing you to easily customize it to analyze and communicate your stakeholder management strategies. The Stakeholder Management Analysis infographic template offers a visually engaging platform to assess, categorize, and prioritize stakeholders based on their influence and interest in your projects or initiatives. Whether you're a project manager, business leader, or involved in stakeholder engagement, this template provides a user-friendly canvas to create informative presentations and reports on stakeholder management. Optimize your stakeholder relationships with this SEO-optimized Stakeholder Management Analysis infographic template, thoughtfully designed for clarity and ease of use. Customize it to showcase stakeholder mapping, engagement strategies, and communication plans, helping you ensure that your stakeholders' needs and expectations are met effectively. Start crafting your personalized infographic today to excel in stakeholder management.


8 diapositivas
Business Revenue and Profit Analysis Presentation
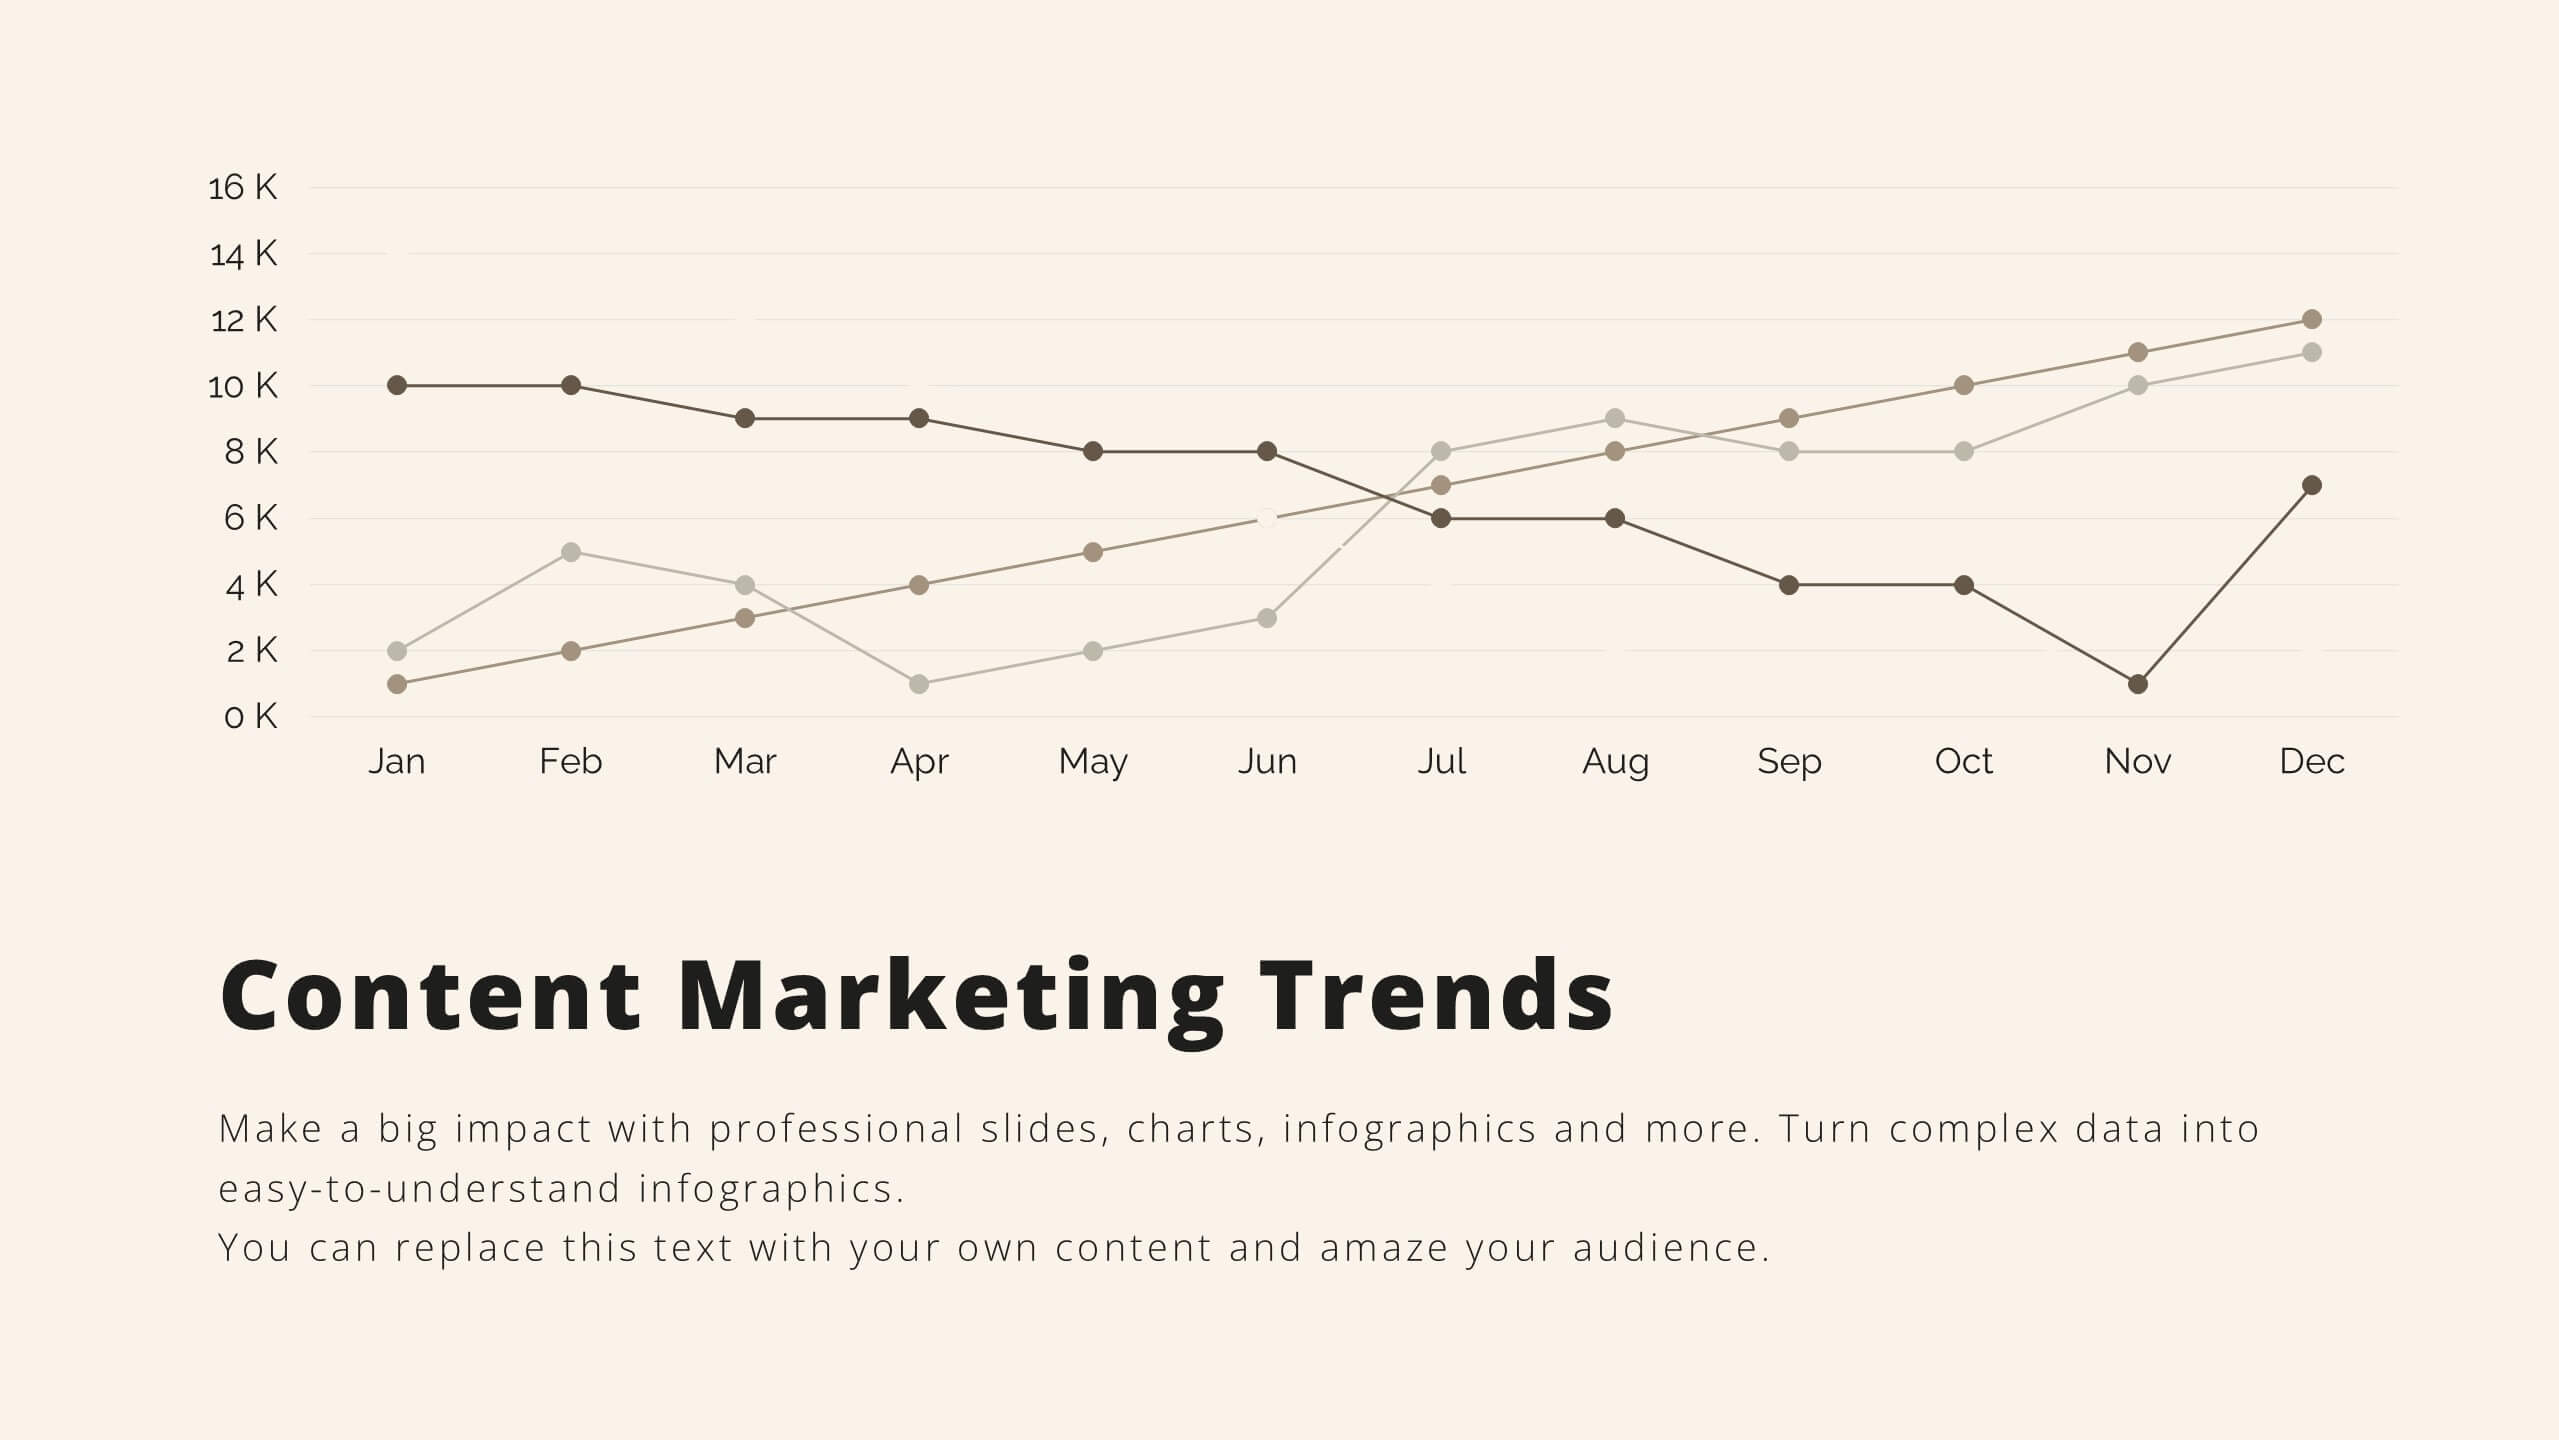
Analyze and visualize Business Revenue and Profit trends effectively with this modern and data-driven slide template. Featuring a dual-chart layout with reseller performance trends and purchase breakdowns, this slide is ideal for financial reports, sales presentations, and strategic business meetings. Fully customizable, you can edit the text, colors, and data to fit your specific needs. Compatible with PowerPoint, Keynote, and Google Slides for easy editing and seamless integration.


5 diapositivas
Social Media Management Infographics
Social Media Management refers to the process of creating, scheduling, analyzing, and engaging with content posted on social media platforms on behalf of a business or individual. With these infographic templates, you can effectively communicate social media management strategies, educate your team or clients, and enhance your social media presence to achieve your marketing objectives. These are designed to showcase key concepts, strategies, and best practices for effective social media management. It is a valuable resource for social media managers, digital marketers, and business owners looking to enhance their social media presence and engagement.


6 diapositivas
Governance Tools Infographics
Enhance your understanding of Governance Tools with our customizable infographic template. This template is fully compatible with popular presentation software like PowerPoint, Keynote, and Google Slides, allowing you to easily customize it to illustrate and communicate various governance tools and practices. The Governance Tools infographic template offers a visually engaging platform to explore and explain the tools, frameworks, and strategies used to facilitate effective governance within organizations. Whether you're a governance professional, business leader, or interested in corporate governance, this template provides a user-friendly canvas to create informative presentations and educational materials. Deepen your knowledge of Governance Tools with this SEO-optimized infographic template, thoughtfully designed for clarity and ease of use. Customize it to showcase governance frameworks, compliance mechanisms, risk management tools, and best practices, ensuring that your audience gains valuable insights into this critical field. Start crafting your personalized infographic today to delve into the world of Governance Tools.


7 diapositivas
Science Infographic Presentation Template
A science infographic is a visual representation of scientific information or knowledge that aims to simplify and communicate complex scientific concepts in a clear and concise way. This template uses charts, images, and other elements to convey information, making it easier for your audience to understand and retain scientific information. Use this Science infographic to cover a wide range of scientific topics, from biology and physics to climate change and space exploration. This can be used in various settings, such as in educational settings, scientific publications, and popular media.


5 diapositivas
Detailed Company Plan with Financials Presentation
Present your growth strategy and numbers with this paper-plane-themed Detailed Company Plan with Financials template. The dynamic five-step layout is ideal for narrating a journey from concept to execution, complete with editable titles and icon markers. Ideal for corporate planning, business overviews, or financial strategy. Easy to use in PowerPoint, Keynote, and Google Slides.


8 diapositivas
Business KPI Dashboard Presentation
Track performance at a glance with the Business KPI Dashboard Presentation. This clean, professional layout includes a speedometer-style gauge and monthly bar chart to showcase progress, goals, or metrics clearly. Ideal for reporting, analysis, or executive summaries. Fully editable and compatible with PowerPoint, Keynote, and Google Slides.