


Características


¿Tienes alguna pregunta?
Recomendar
6 diapositivas
Performance Tracking Using OKRs
Visualize your team’s progress across people, process, and products with this OKR-focused performance tracking slide. Designed for managers and leaders aiming to align execution with key results. Compatible with PowerPoint, Keynote, and Google Slides for full customization.


5 diapositivas
Sports Legends Infographics
Sport Legends play a significant role in inspiring and motivating aspiring athletes to achieve their goals. These Infographics can provide an educational and visually appealing way to showcase the accomplishments and achievements of some of the greatest athletes in history. These infographics can highlight specific individuals, teams, or eras, and can include statistics, records, awards, and other notable accomplishments. All the design elements are customizable and can include illustrations of the athletes, logos or team colors, and text boxes to highlight statistics and provide additional information.


21 diapositivas
Drowsira Marketing Research Report Presentation
Present your market insights effectively with this professional and modern template. Covering key sections such as market presence, target audience, competitive landscape, and financial highlights, it offers a structured layout for impactful storytelling. Fully customizable and available for PowerPoint, Keynote, and Google Slides.


30 diapositivas
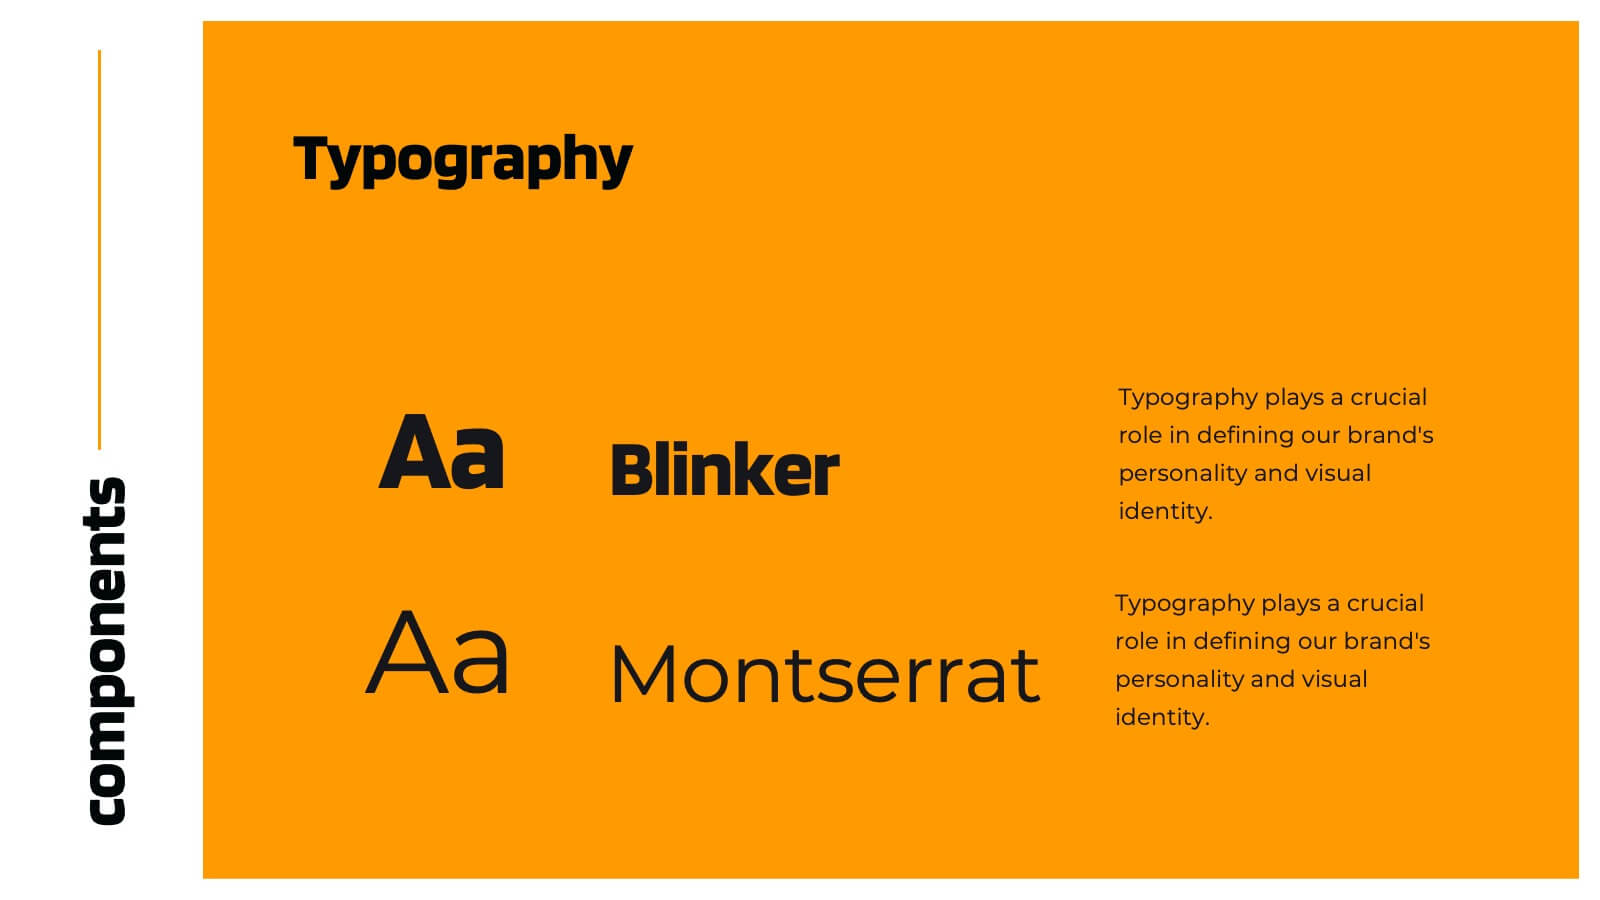
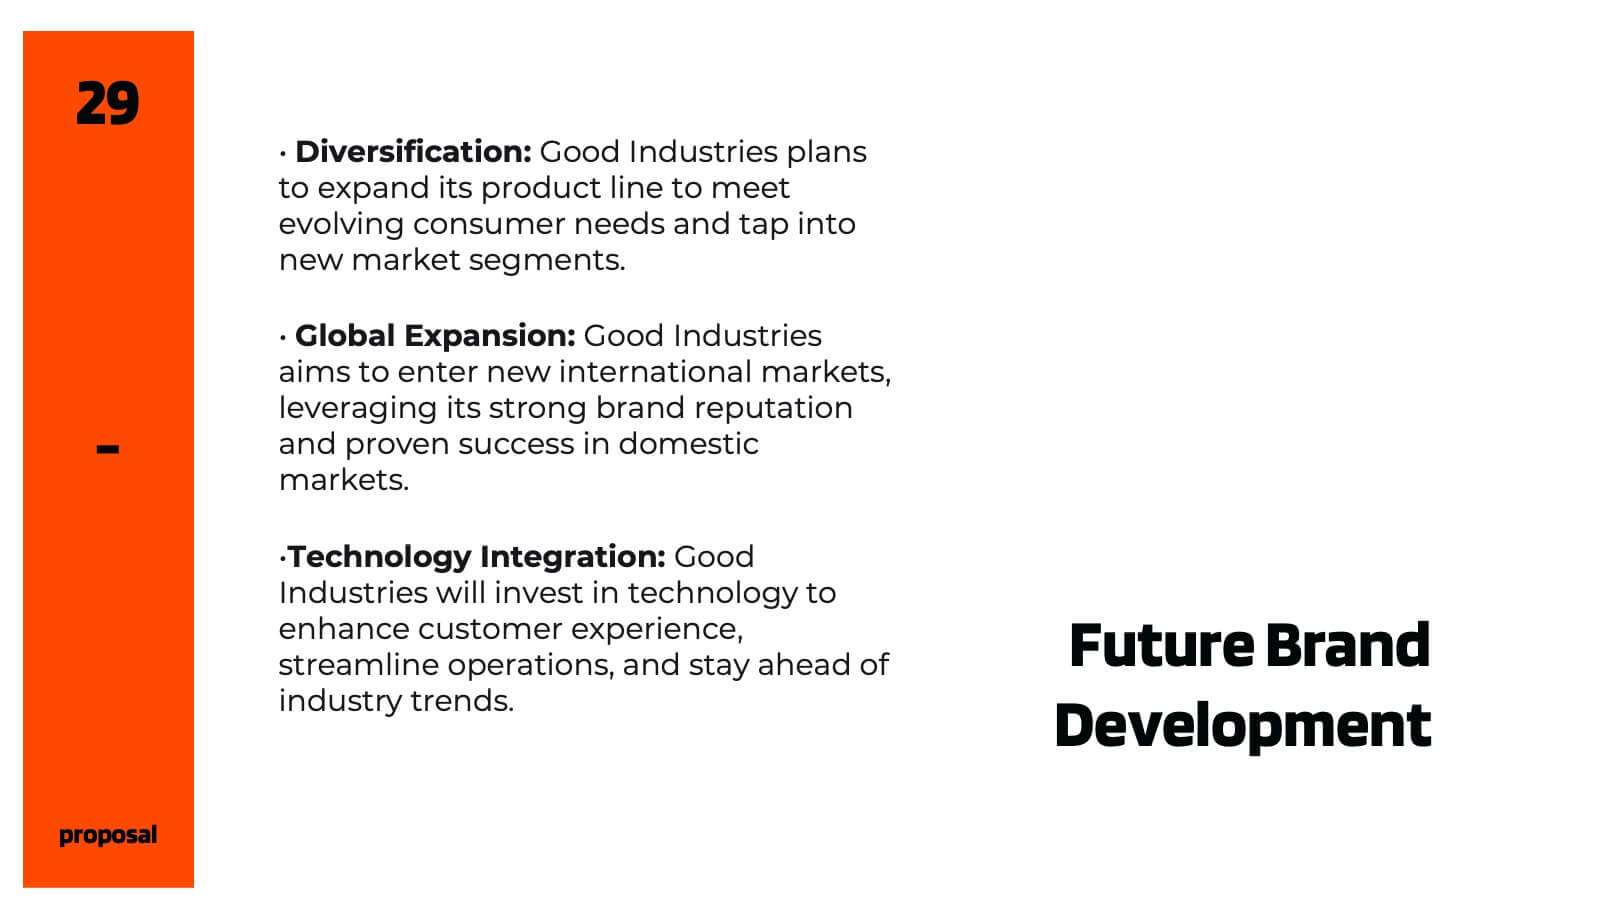
Chromalight Brand Guidelines Proposal Presentation
Elevate your brand's story with this visually engaging presentation template that embodies modern, professional aesthetics. From mission and vision statements to brand identity and market positioning, each slide is crafted to showcase your brand's core essence. Ideal for brand strategists and marketers, this template is compatible with PowerPoint, Keynote, and Google Slides.


26 diapositivas
Casey Presentation Template
Casey is a professionally designed modern, clean, and bold PowerPoint template that’s a great way to show off your data or highlight your services. This product is perfect for corporate customers who need an easy-to-edit template with bold colors and clean designs. With its easy to read charts, visible text, and bright colors this template will really captivate your audience. A perfect way to visualize your data and present your company in style to keep your audience engaged. Whether you are trying to get attention or just make your business stand out, this template will help you achieve that.


7 diapositivas
Stock Market Forecast Infographic Presentation
Introducing our brand new stock market infographic presentation template, the perfect tool for your next school project, classroom presentation or business adventure! Compatible with Powerpoint, Keynote, and Google Slides, our template is easy to use and customize to your liking. Our template features a fun and engaging color scheme, along with Infographics and editable text that make it easy to add your own personal touch. Whether you're presenting data or forecasting information, our template will help you stand out and make an impression on your audience. With our stock market infographic presentation, you can showcase your knowledge and impress your classmates and clients with your presentation skills.


5 diapositivas
Topic Organization with Bubble Mapping Presentation
Easily structure complex information with the Topic Organization with Bubble Mapping Presentation. This visually engaging layout uses a central idea with grouped supporting elements, making it perfect for brainstorming, mind mapping, or topic clustering. Fully editable in PowerPoint, Keynote, or Google Slides—ideal for educators, strategists, and project teams.


7 diapositivas
Six Sigma Project Infographic
Six Sigma is a data-driven methodology and quality improvement approach that aims to eliminate defects and reduce variation in processes. This infographic template is a visual representation of the Six Sigma methodology, which is a data-driven approach used by organizations to improve their processes and reduce defects. The infographic aims to explain the key concepts and steps involved in the Six Sigma process in a clear and concise manner. It is designed to help individuals understand the methodology and its benefits, and can be used as a reference tool for Six Sigma practitioners and those interested in process improvement.


5 diapositivas
Business Challenges and Solutions
Visualize your journey from problem to progress with this Business Challenges and Solutions infographic. Designed with a mountain path metaphor, it effectively communicates four key stages or issues alongside their respective solutions. Ideal for project timelines, team planning, or strategic overviews. Fully editable in PowerPoint, Keynote, and Google Slides.


10 diapositivas
Concentric Circles Business Model Presentation
Visualize Your Business Strategy with Clarity using this Concentric Circles Business Model Presentation template. This design helps you illustrate core business concepts, hierarchical structures, and strategic layers in a simple yet engaging format. Ideal for business planning, process optimization, and strategic growth presentations, this template makes complex relationships clear and easy to understand. Fully editable and available for PowerPoint, Keynote, and Google Slides.


4 diapositivas
Personal and Business Insurance Plans
Clearly present your insurance tiers with this easy-to-read comparison layout. Ideal for showcasing plan options for individuals, families, and businesses, this template highlights pricing, benefits, and coverage icons side-by-side. Clean and professional, it’s fully editable in PowerPoint, Keynote, and Google Slides.


4 diapositivas
Creative Thinking and Brain Functions Presentation
Illuminate cognitive processes with the Creative Thinking and Brain Functions Presentation. Featuring a clean mind map-style layout with illustrated heads and title blocks, this slide is ideal for showcasing mental models, decision paths, or concept relationships. Fully editable in PowerPoint, Canva, and Google Slides for effortless customization.


7 diapositivas
Strategic Matrix Comparison Framework Presentation
Easily compare business risks, priorities, or strategic choices with this matrix comparison framework. Featuring editable grids for mapping likelihood and impact, it’s perfect for decision-making and performance analysis. Highlight key categories using color-coded segments. Fully customizable and compatible with PowerPoint, Google Slides, and Keynote for professional presentations.


6 diapositivas
Lean Business Canvas Framework
Simplify your business strategy with the Lean Business Canvas Framework Presentation. This slide offers a structured layout to map out key elements like partners, activities, value propositions, customer segments, and revenue streams—all in one view. Ideal for startups, business plans, or internal strategy sessions. Fully editable in PowerPoint, Keynote, and Google Slides.


6 diapositivas
PESTEL Analysis Business Presentation
The "PESTEL Analysis Business Presentation" template effectively facilitates a comprehensive review of the political, economic, social, technological, environmental, and legal factors that impact strategic business decisions. This template is designed to help strategists, analysts, and managers evaluate and present external factors that could affect their business operations and market environment. Each segment of the analysis is visually represented through connected circles, making complex data easily understandable. This layout encourages a structured discussion on each PESTEL aspect, ensuring that all critical elements are covered, making it an essential tool for businesses looking to align their strategies with external conditions.


7 diapositivas
Communication Skills Infographics
Effective communication skills are essential in every aspect of life, including personal relationships, professional relationships, and societal interactions. This template provides you with a great resource for presenting your communication skills. This can help you present your ideas in an effective way. This template features customizable slide designs and graphics allowing you plenty of room to add your own content. The format makes this presentation easy to follow and understand visually as it focuses on what are the most important aspects of delivering effective communication skills.


6 diapositivas
Organizational Structure Infographic
Organizational structure refers to the way in which an organization is structured and how its roles, responsibilities, and functions are defined and coordinated. This infographic template provides a framework for how individuals and teams work together to achieve the organization's goals. This infographic visually represents the hierarchy, roles, and relationships within an organization. This template allows you to provides a clear overview of how different departments, teams, and individuals are organized and how they interact with each other. Fully customizable and compatible with Powerpoint, Keynote, and Google Slides.