


Características


¿Tienes alguna pregunta?
Recomendar


26 diapositivas
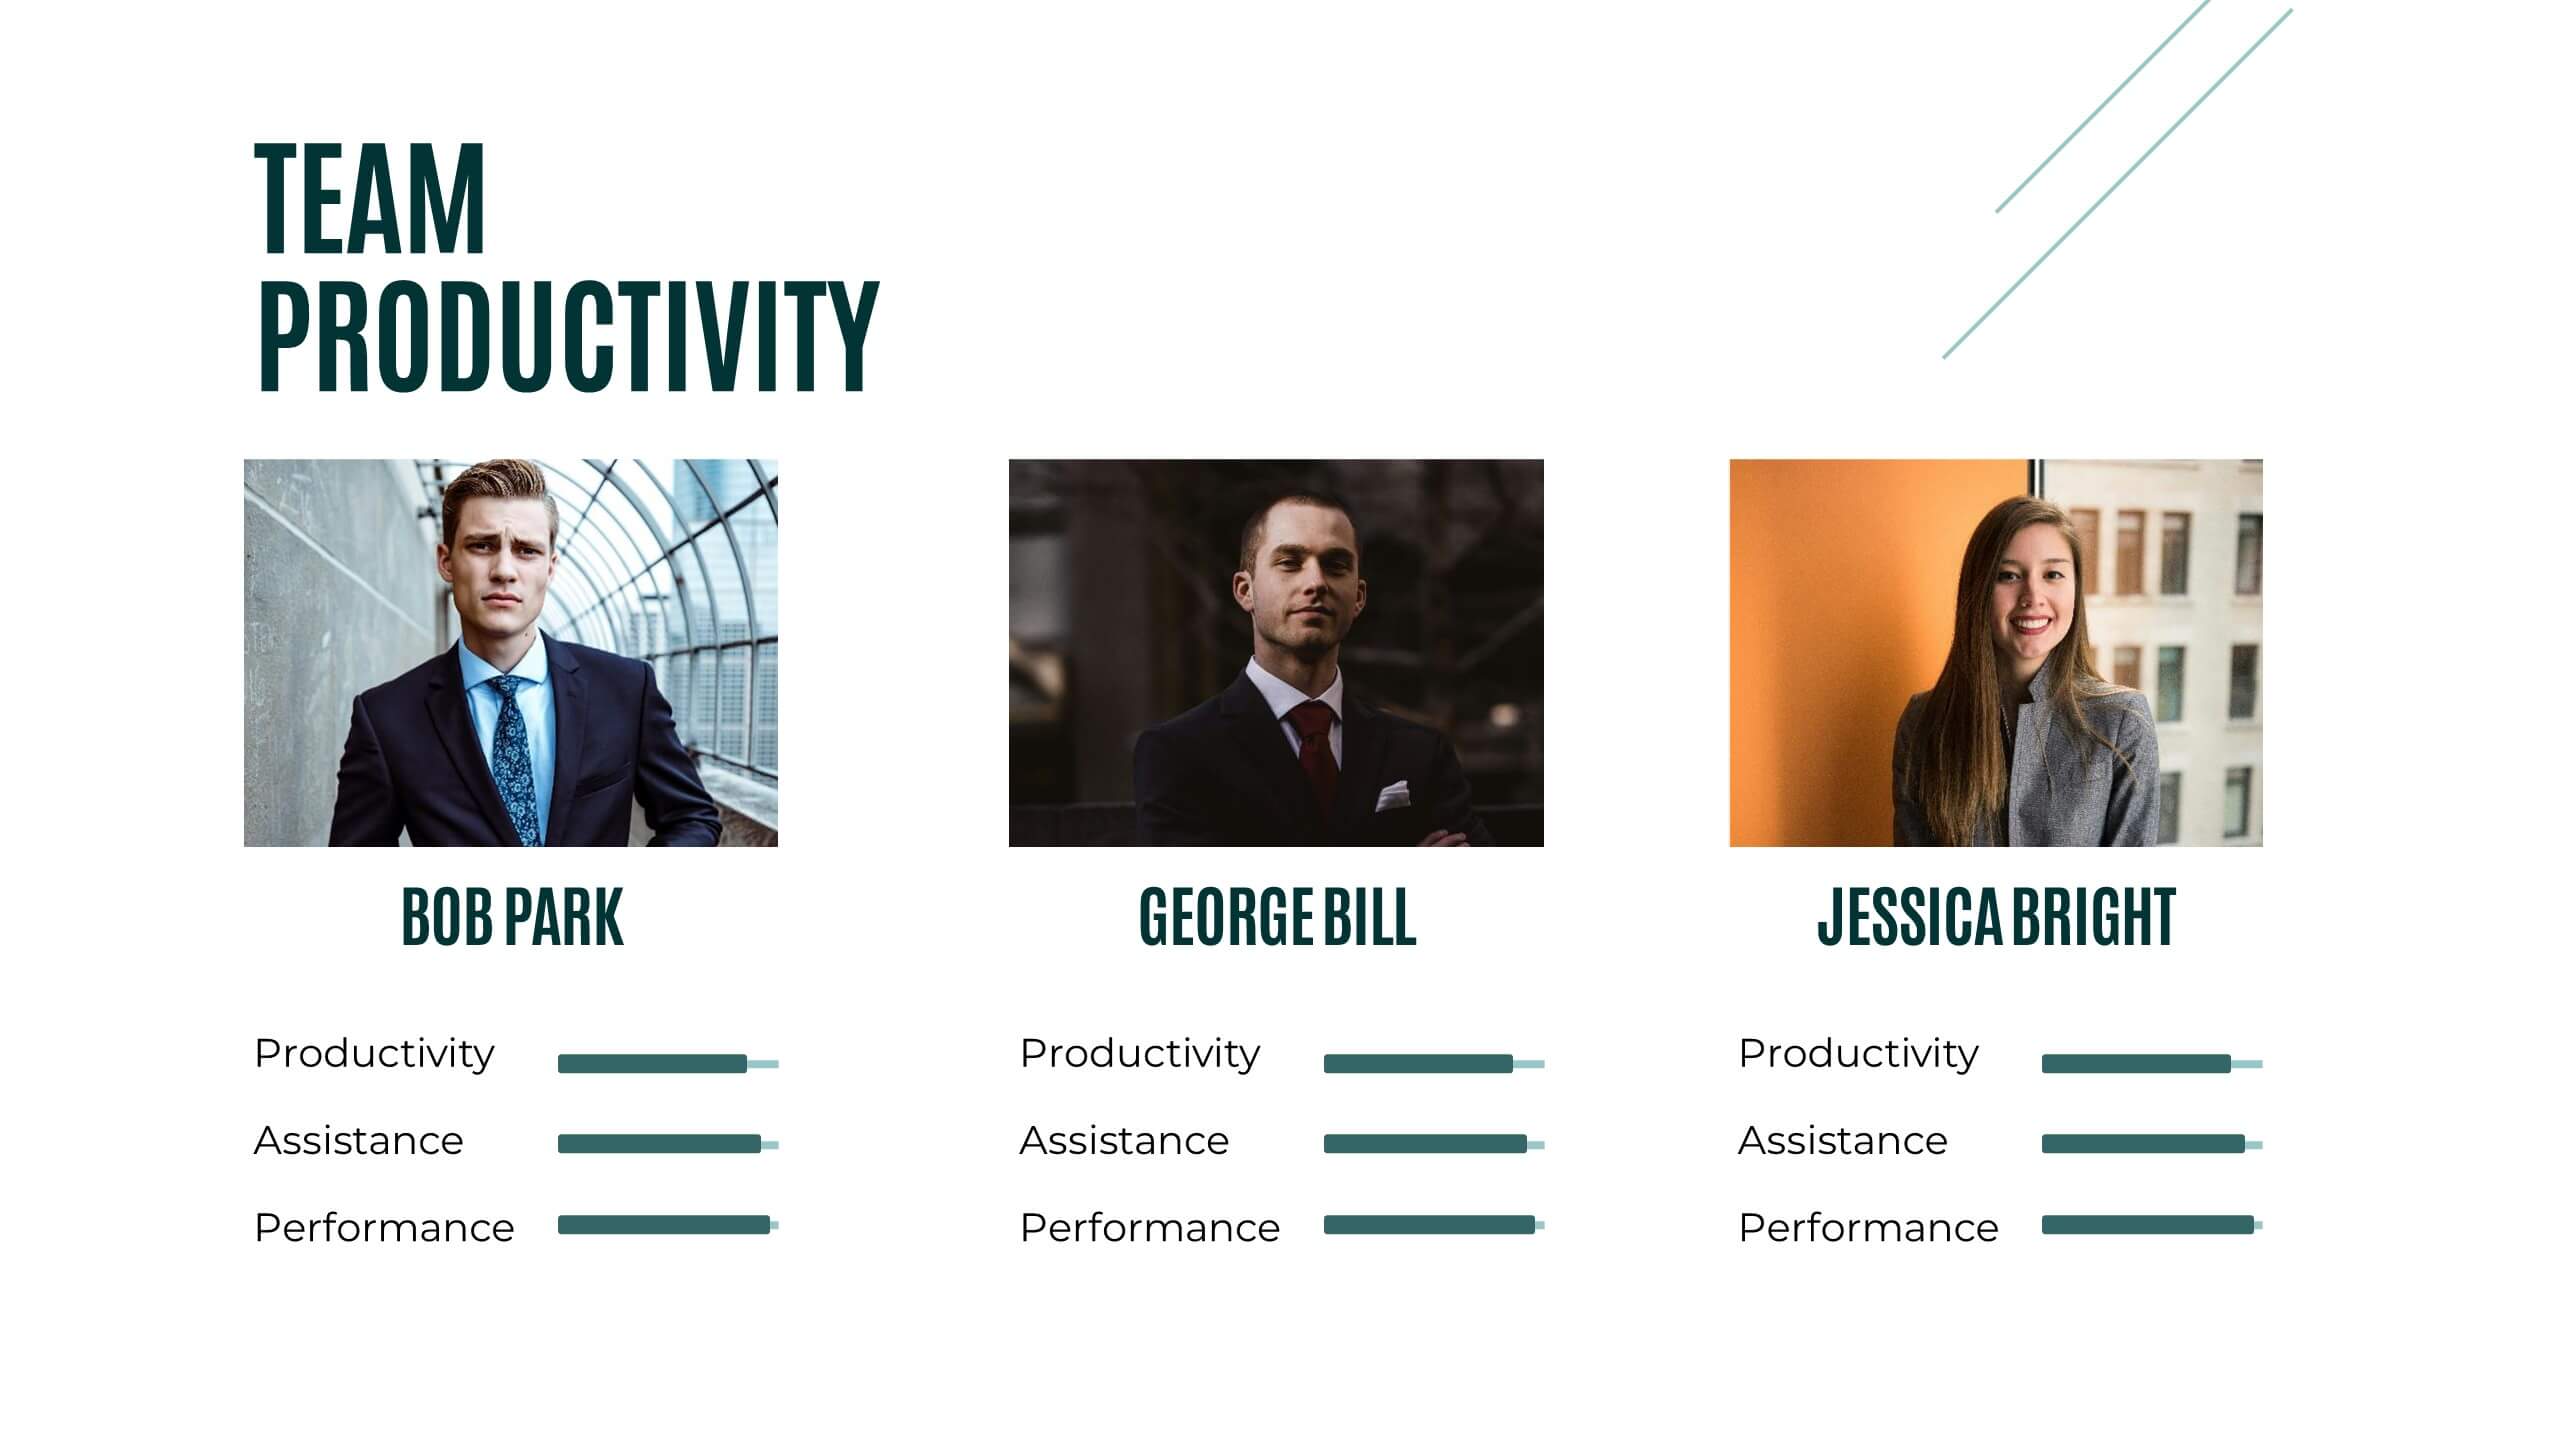
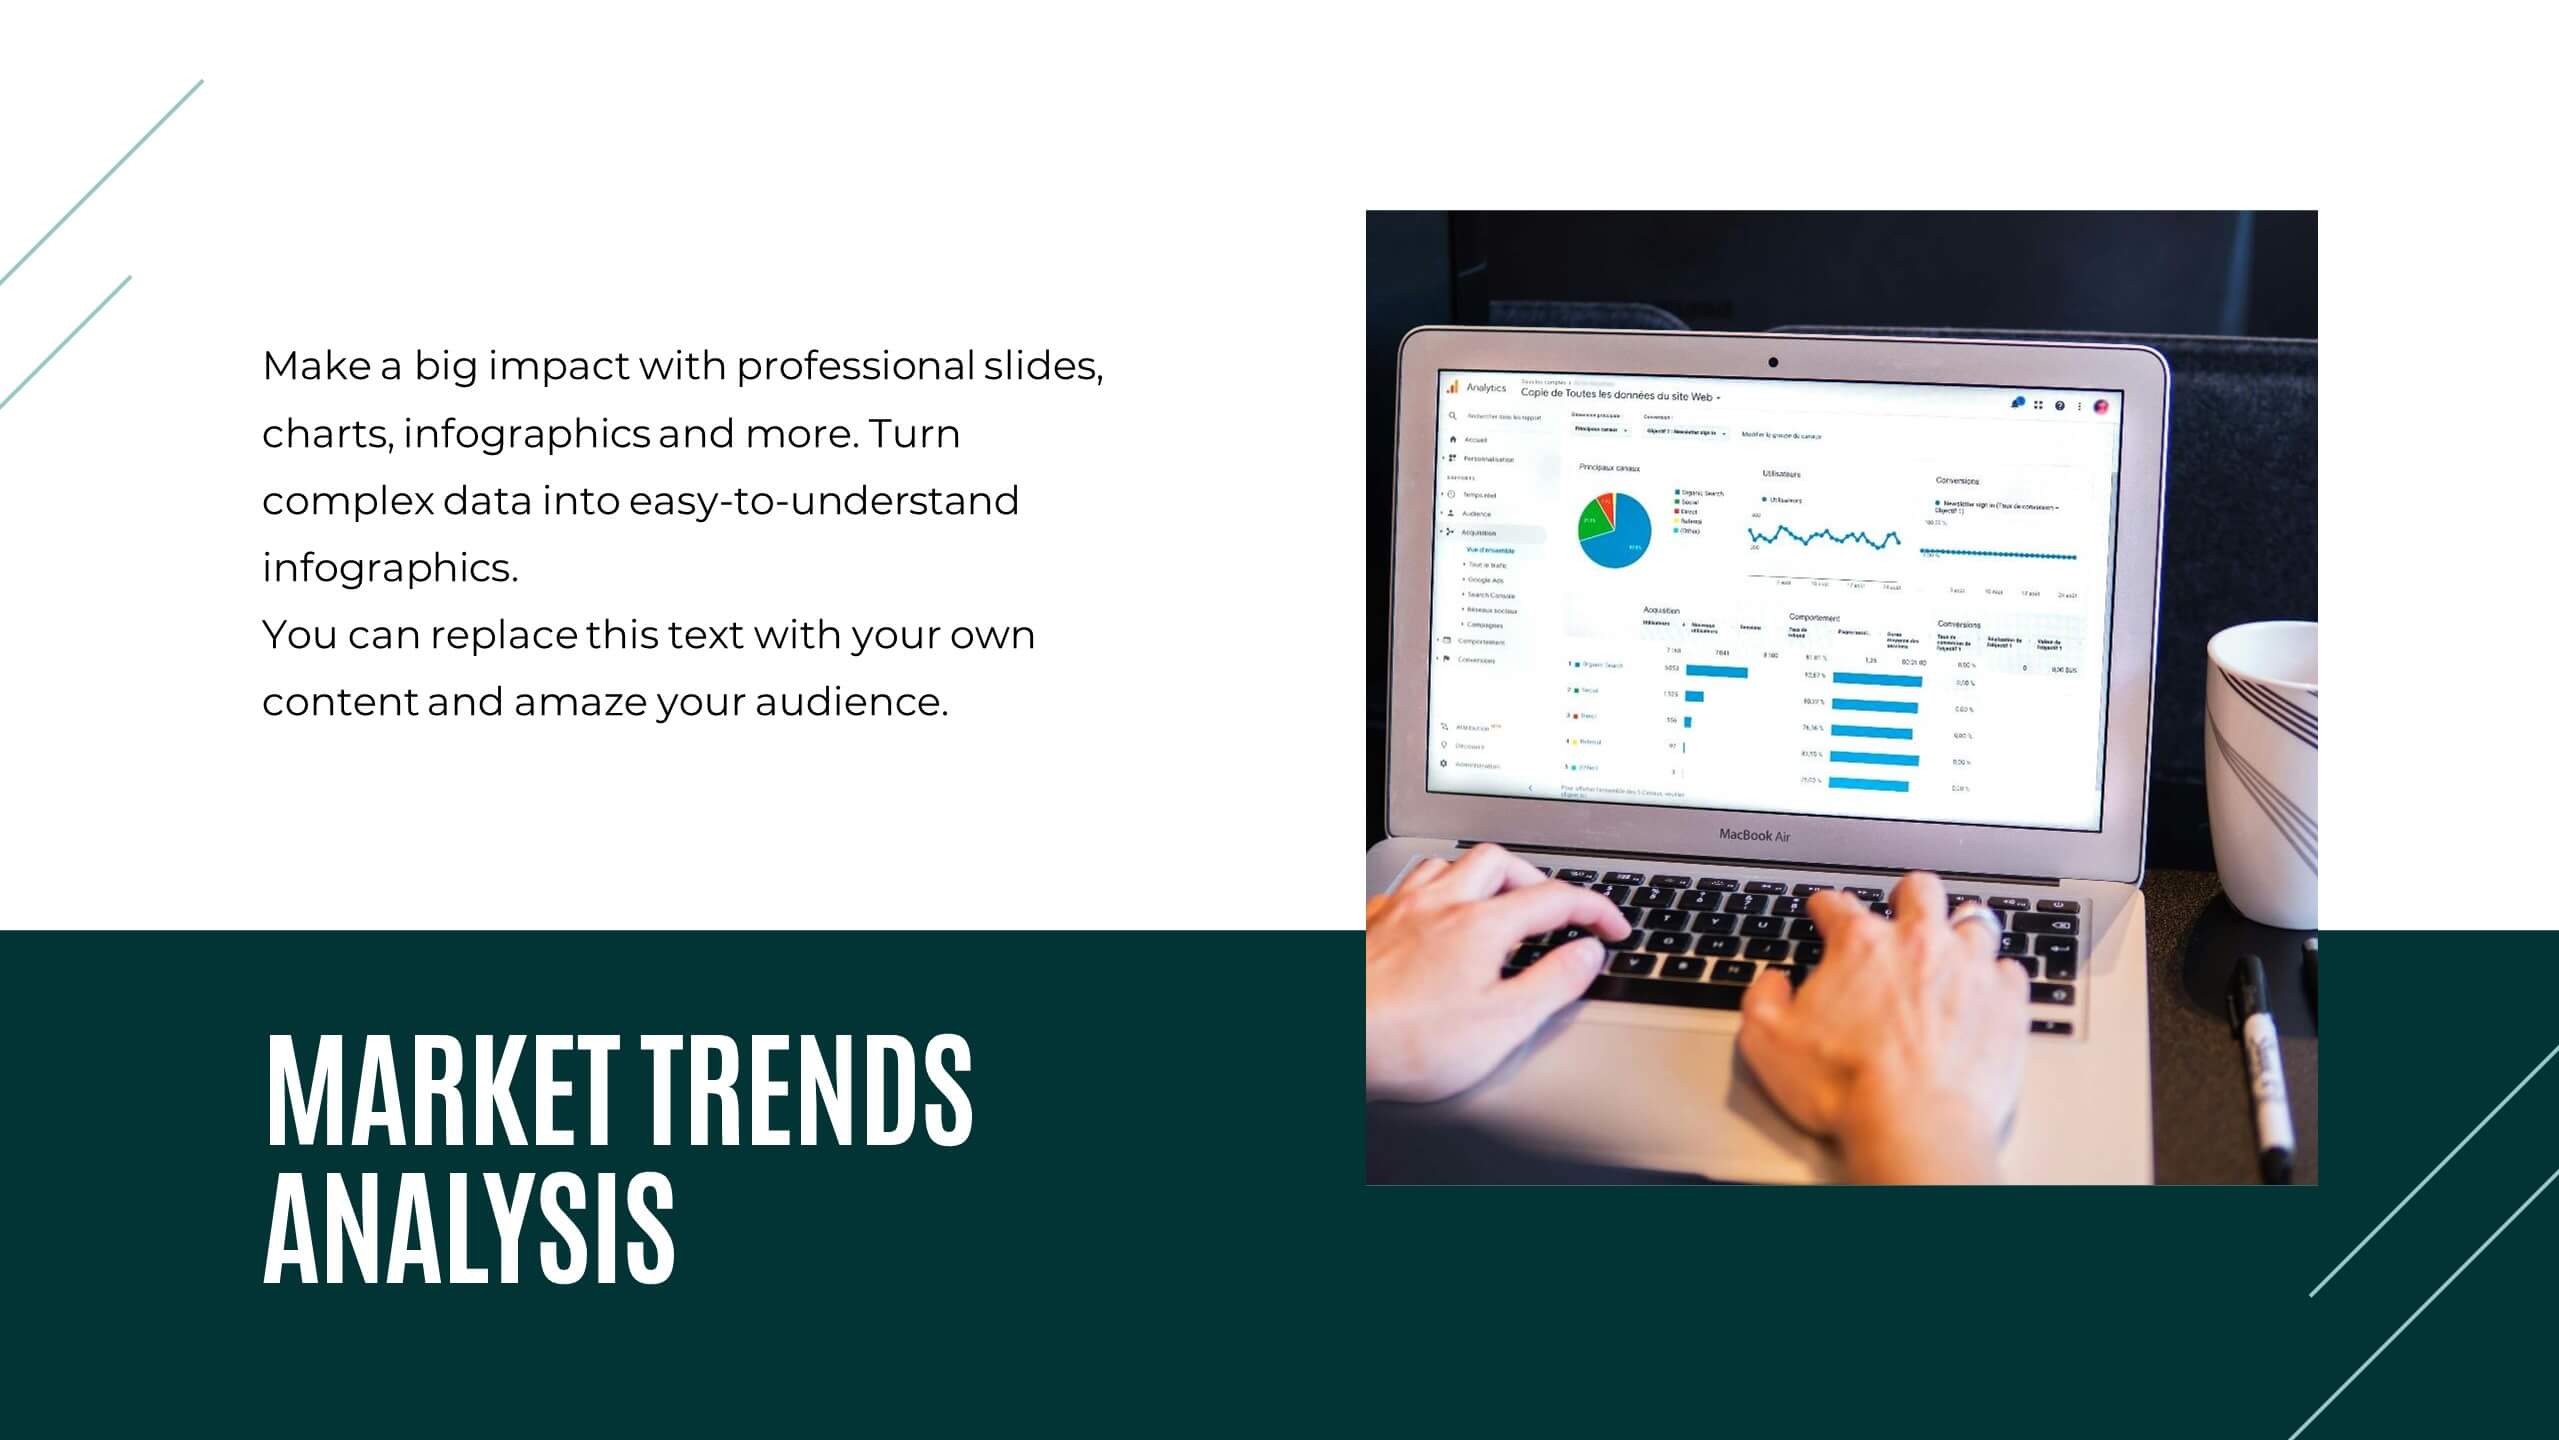
Doriyan Presentation Template
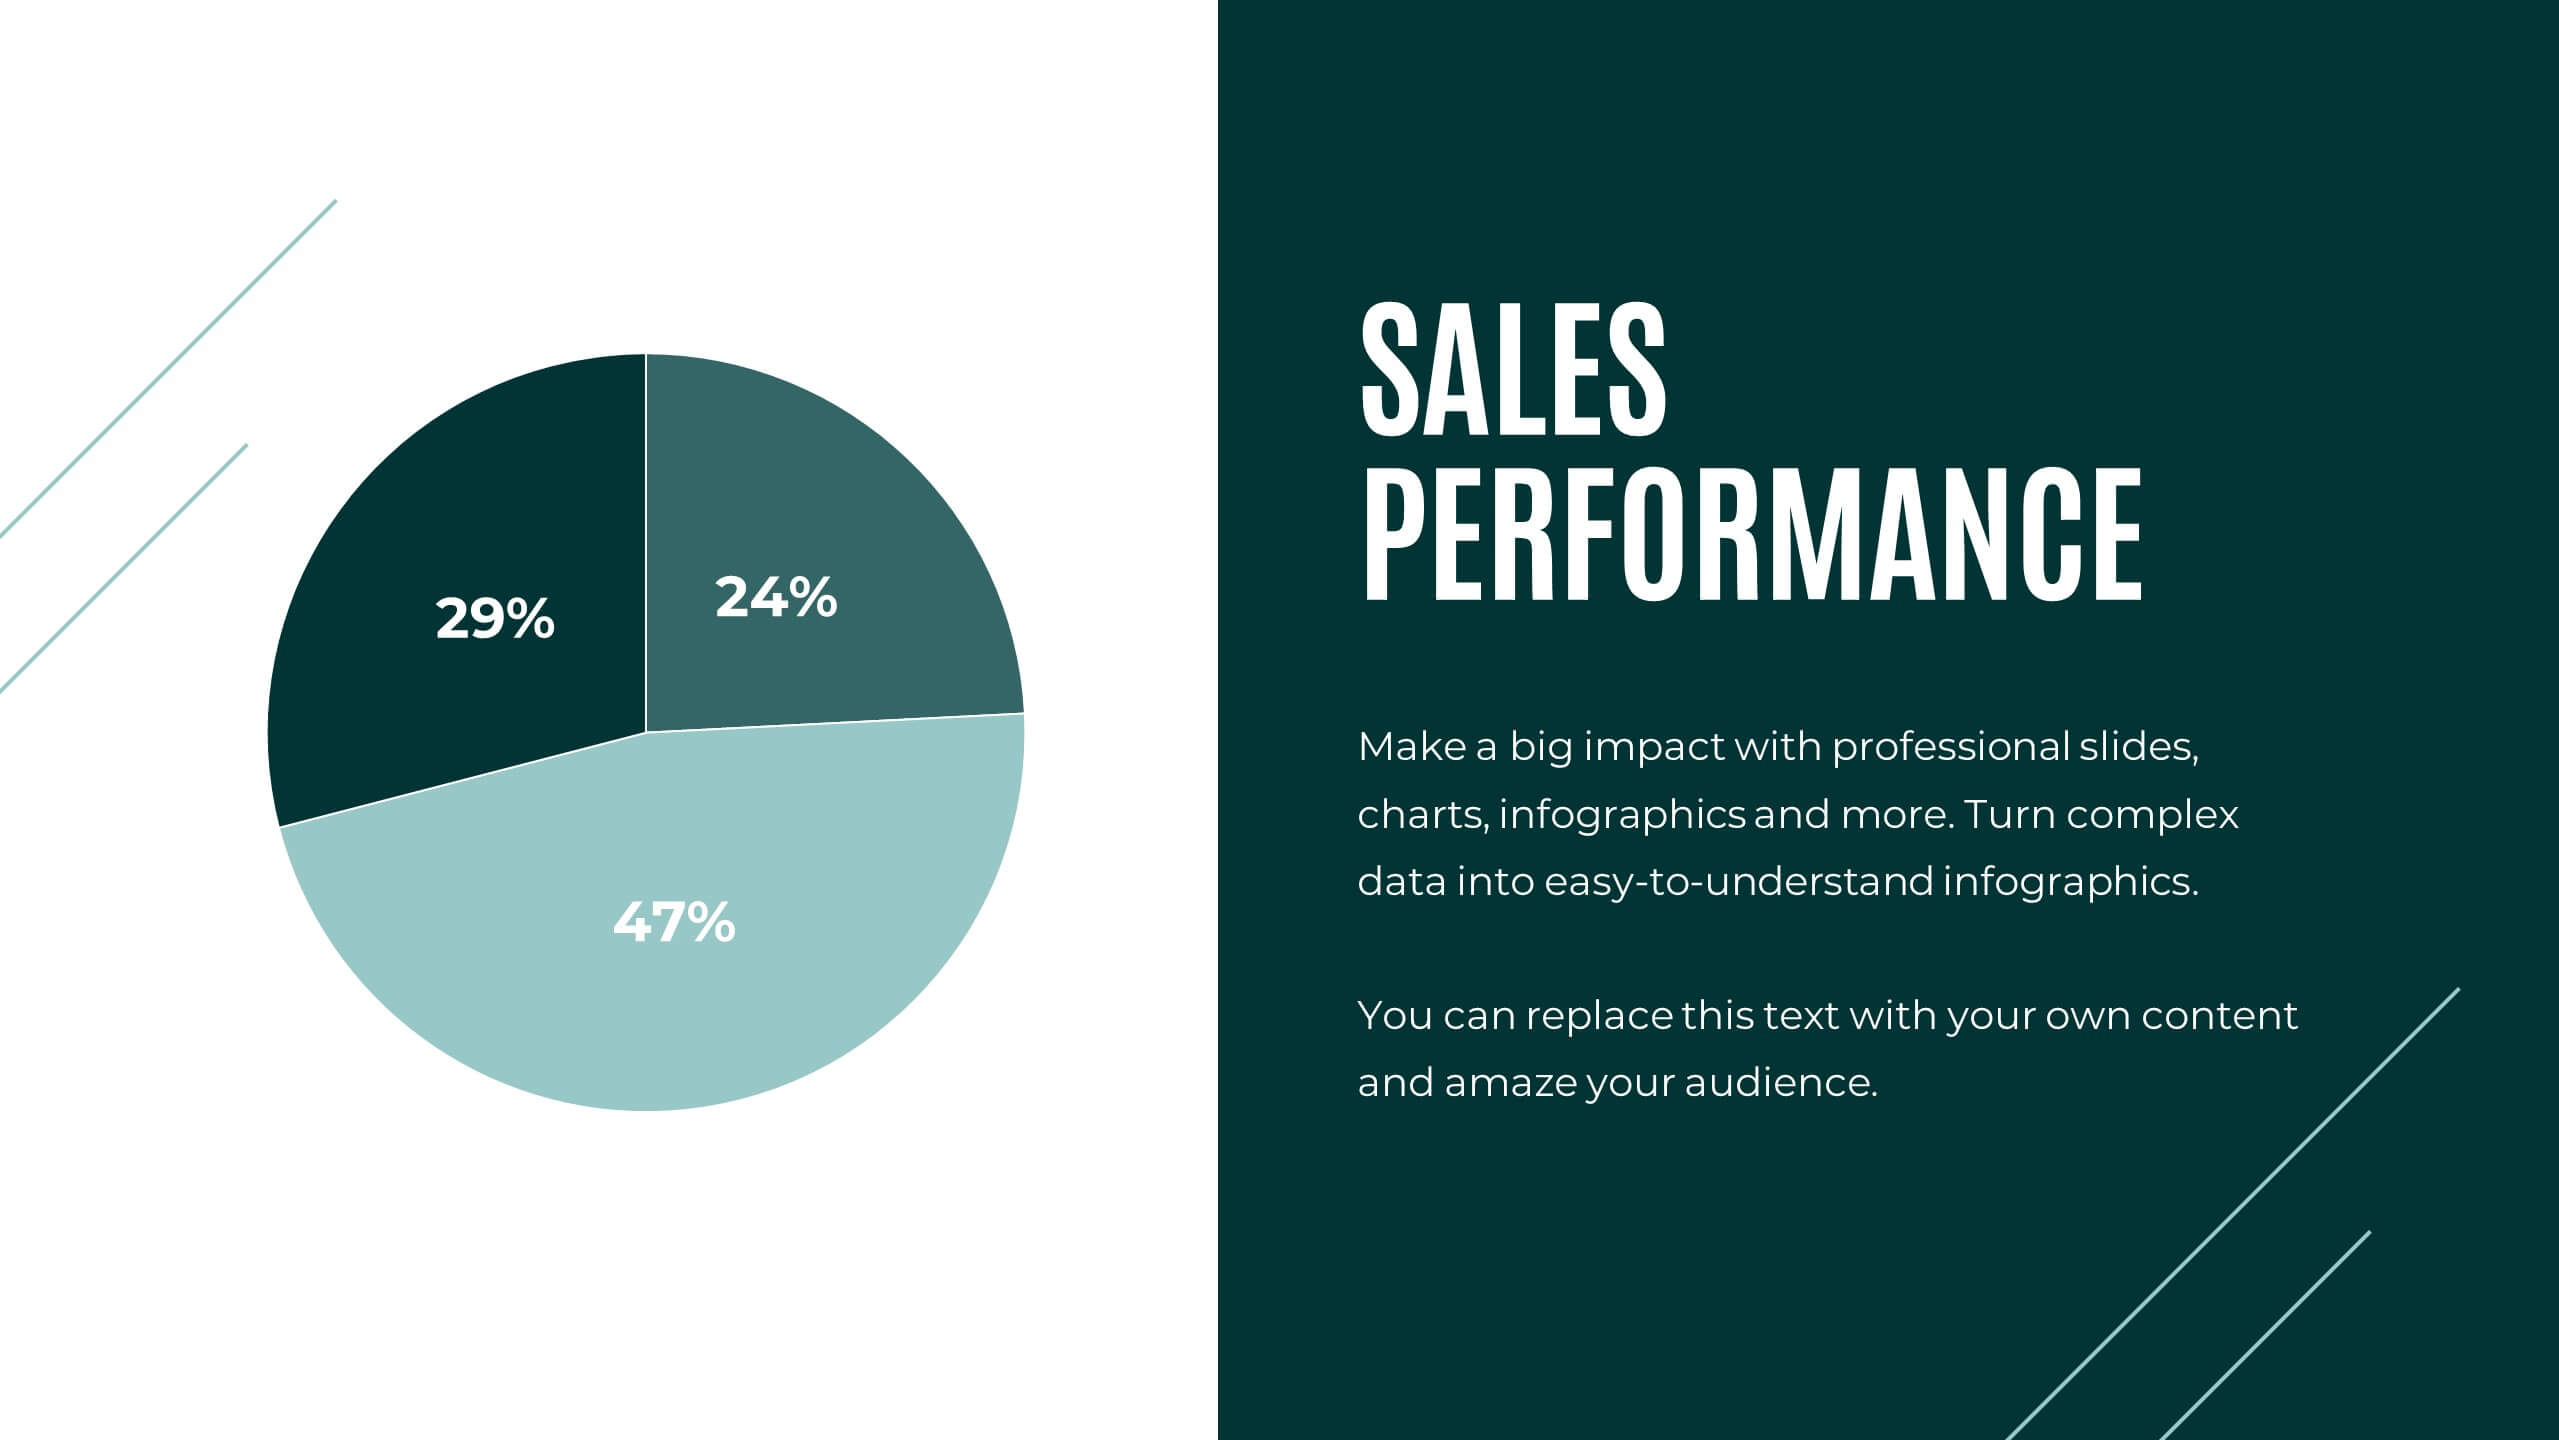
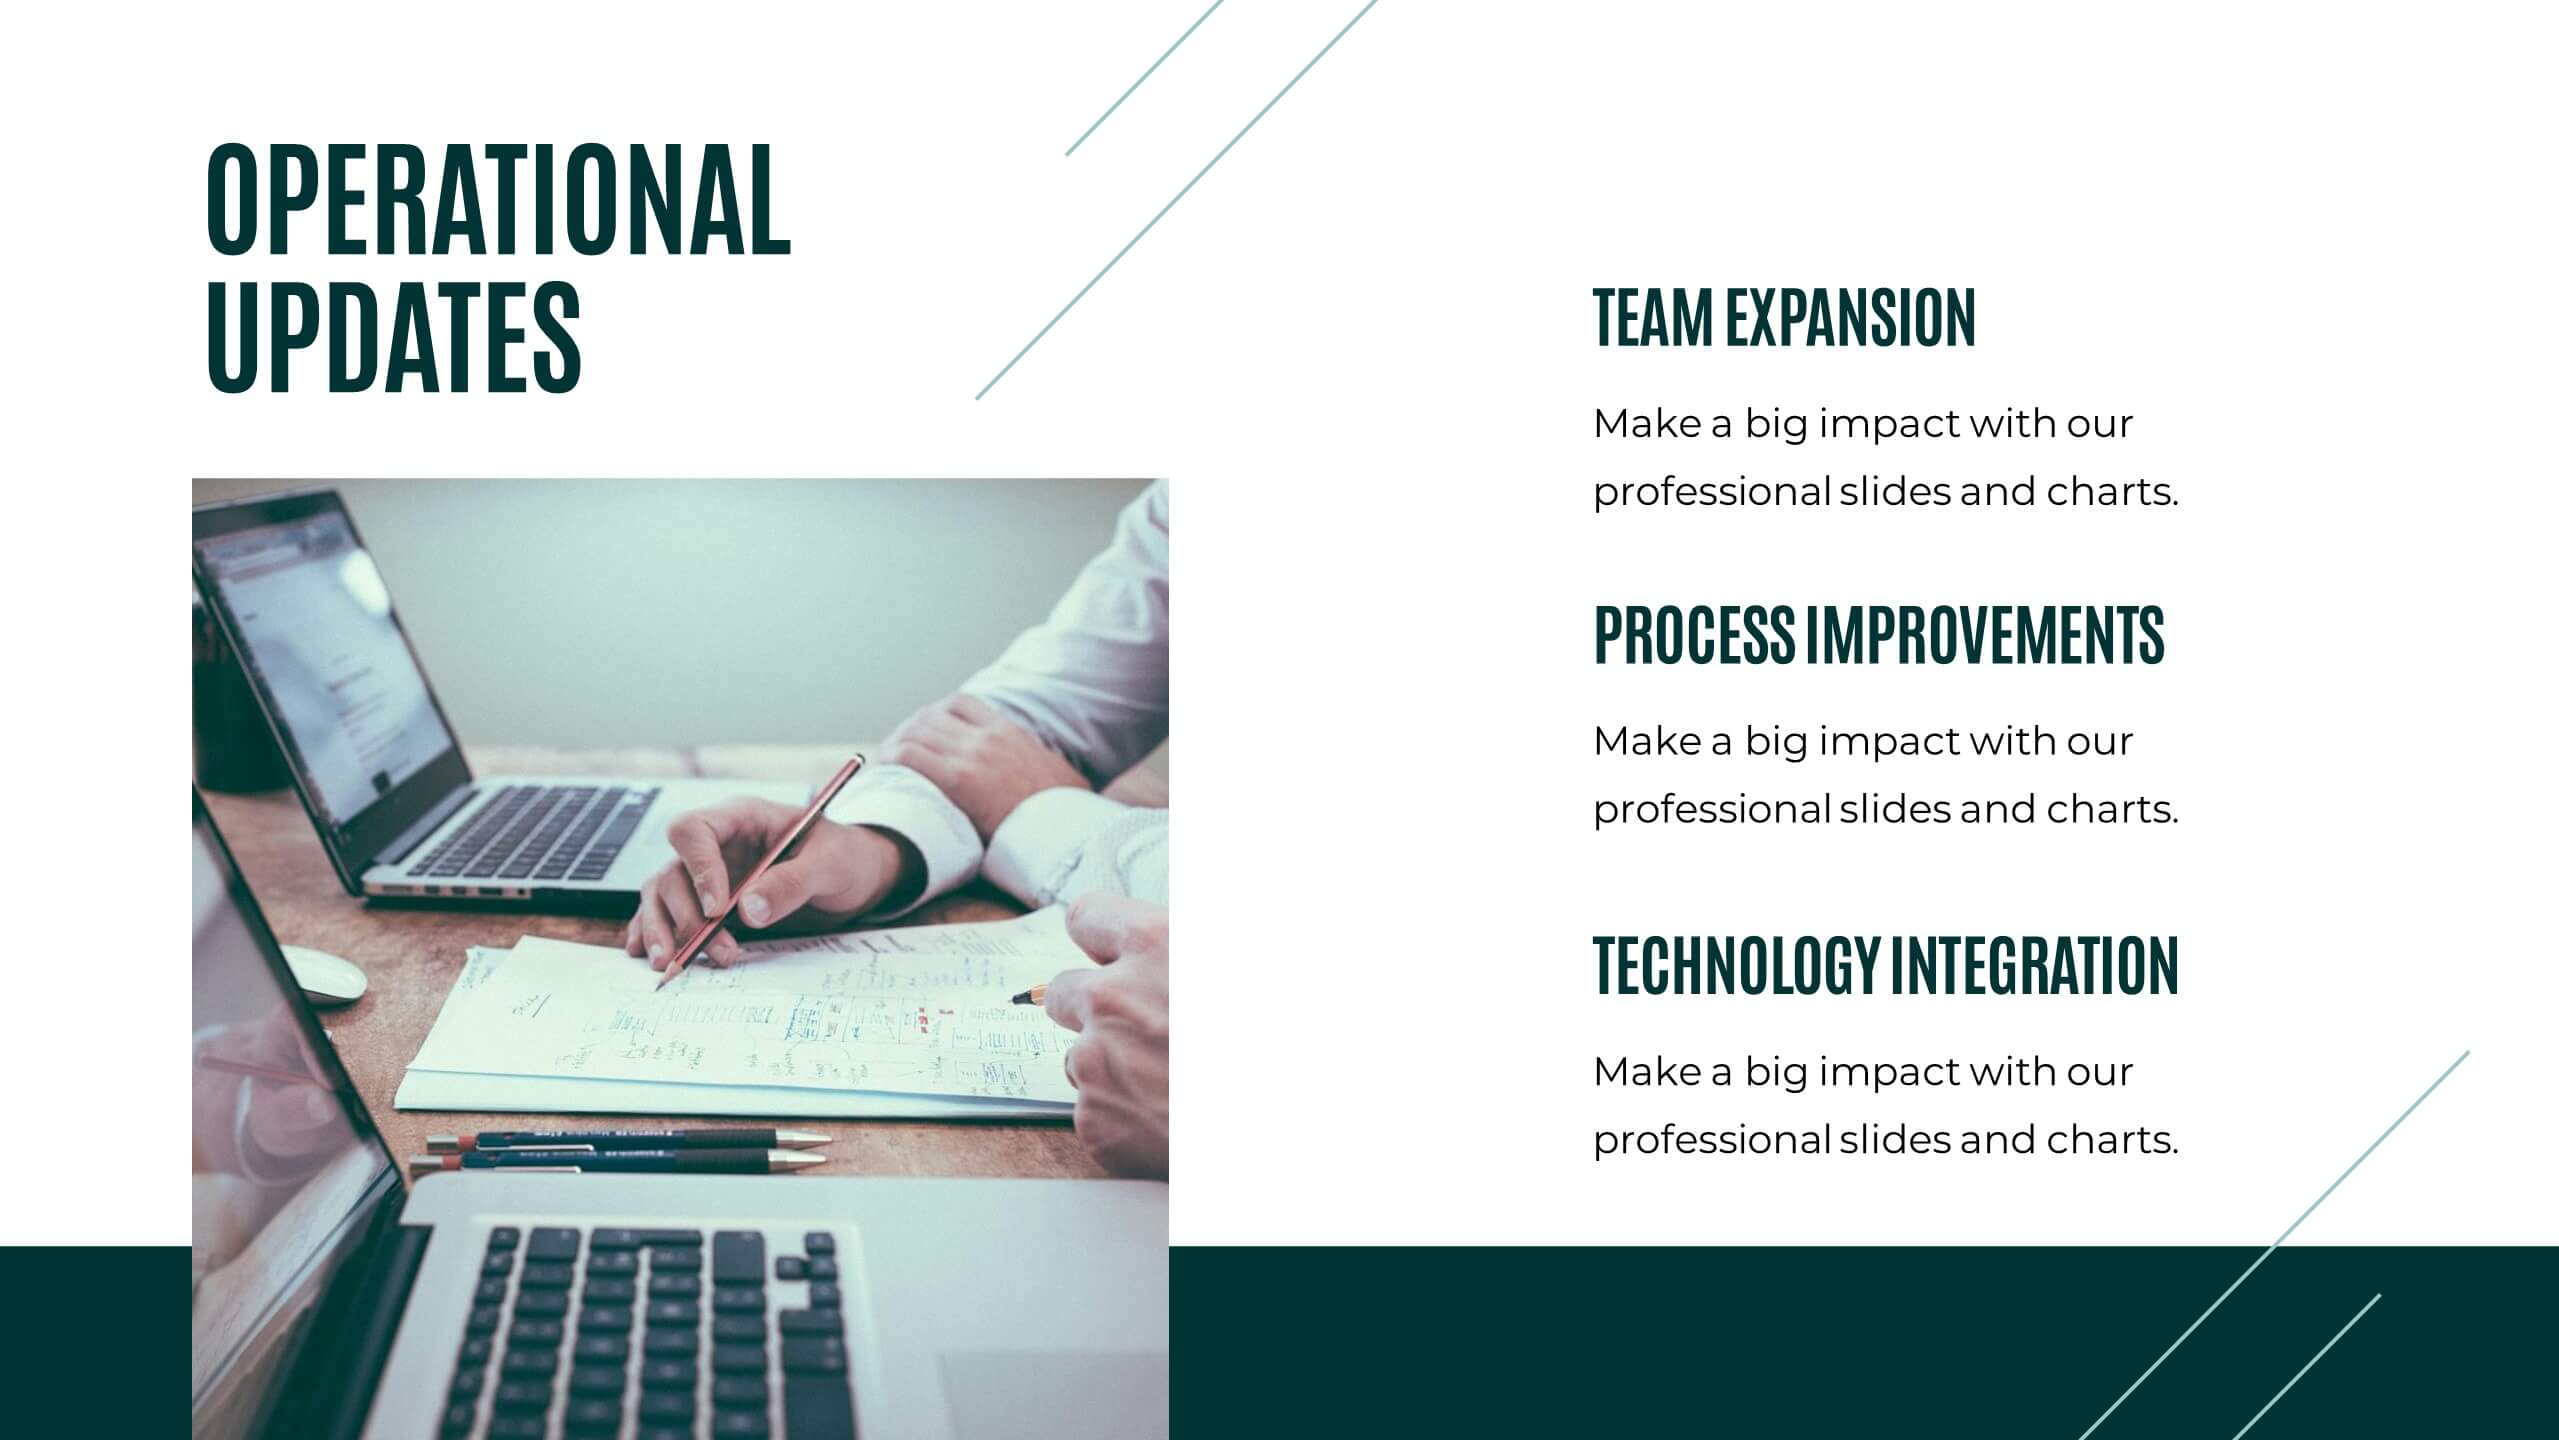
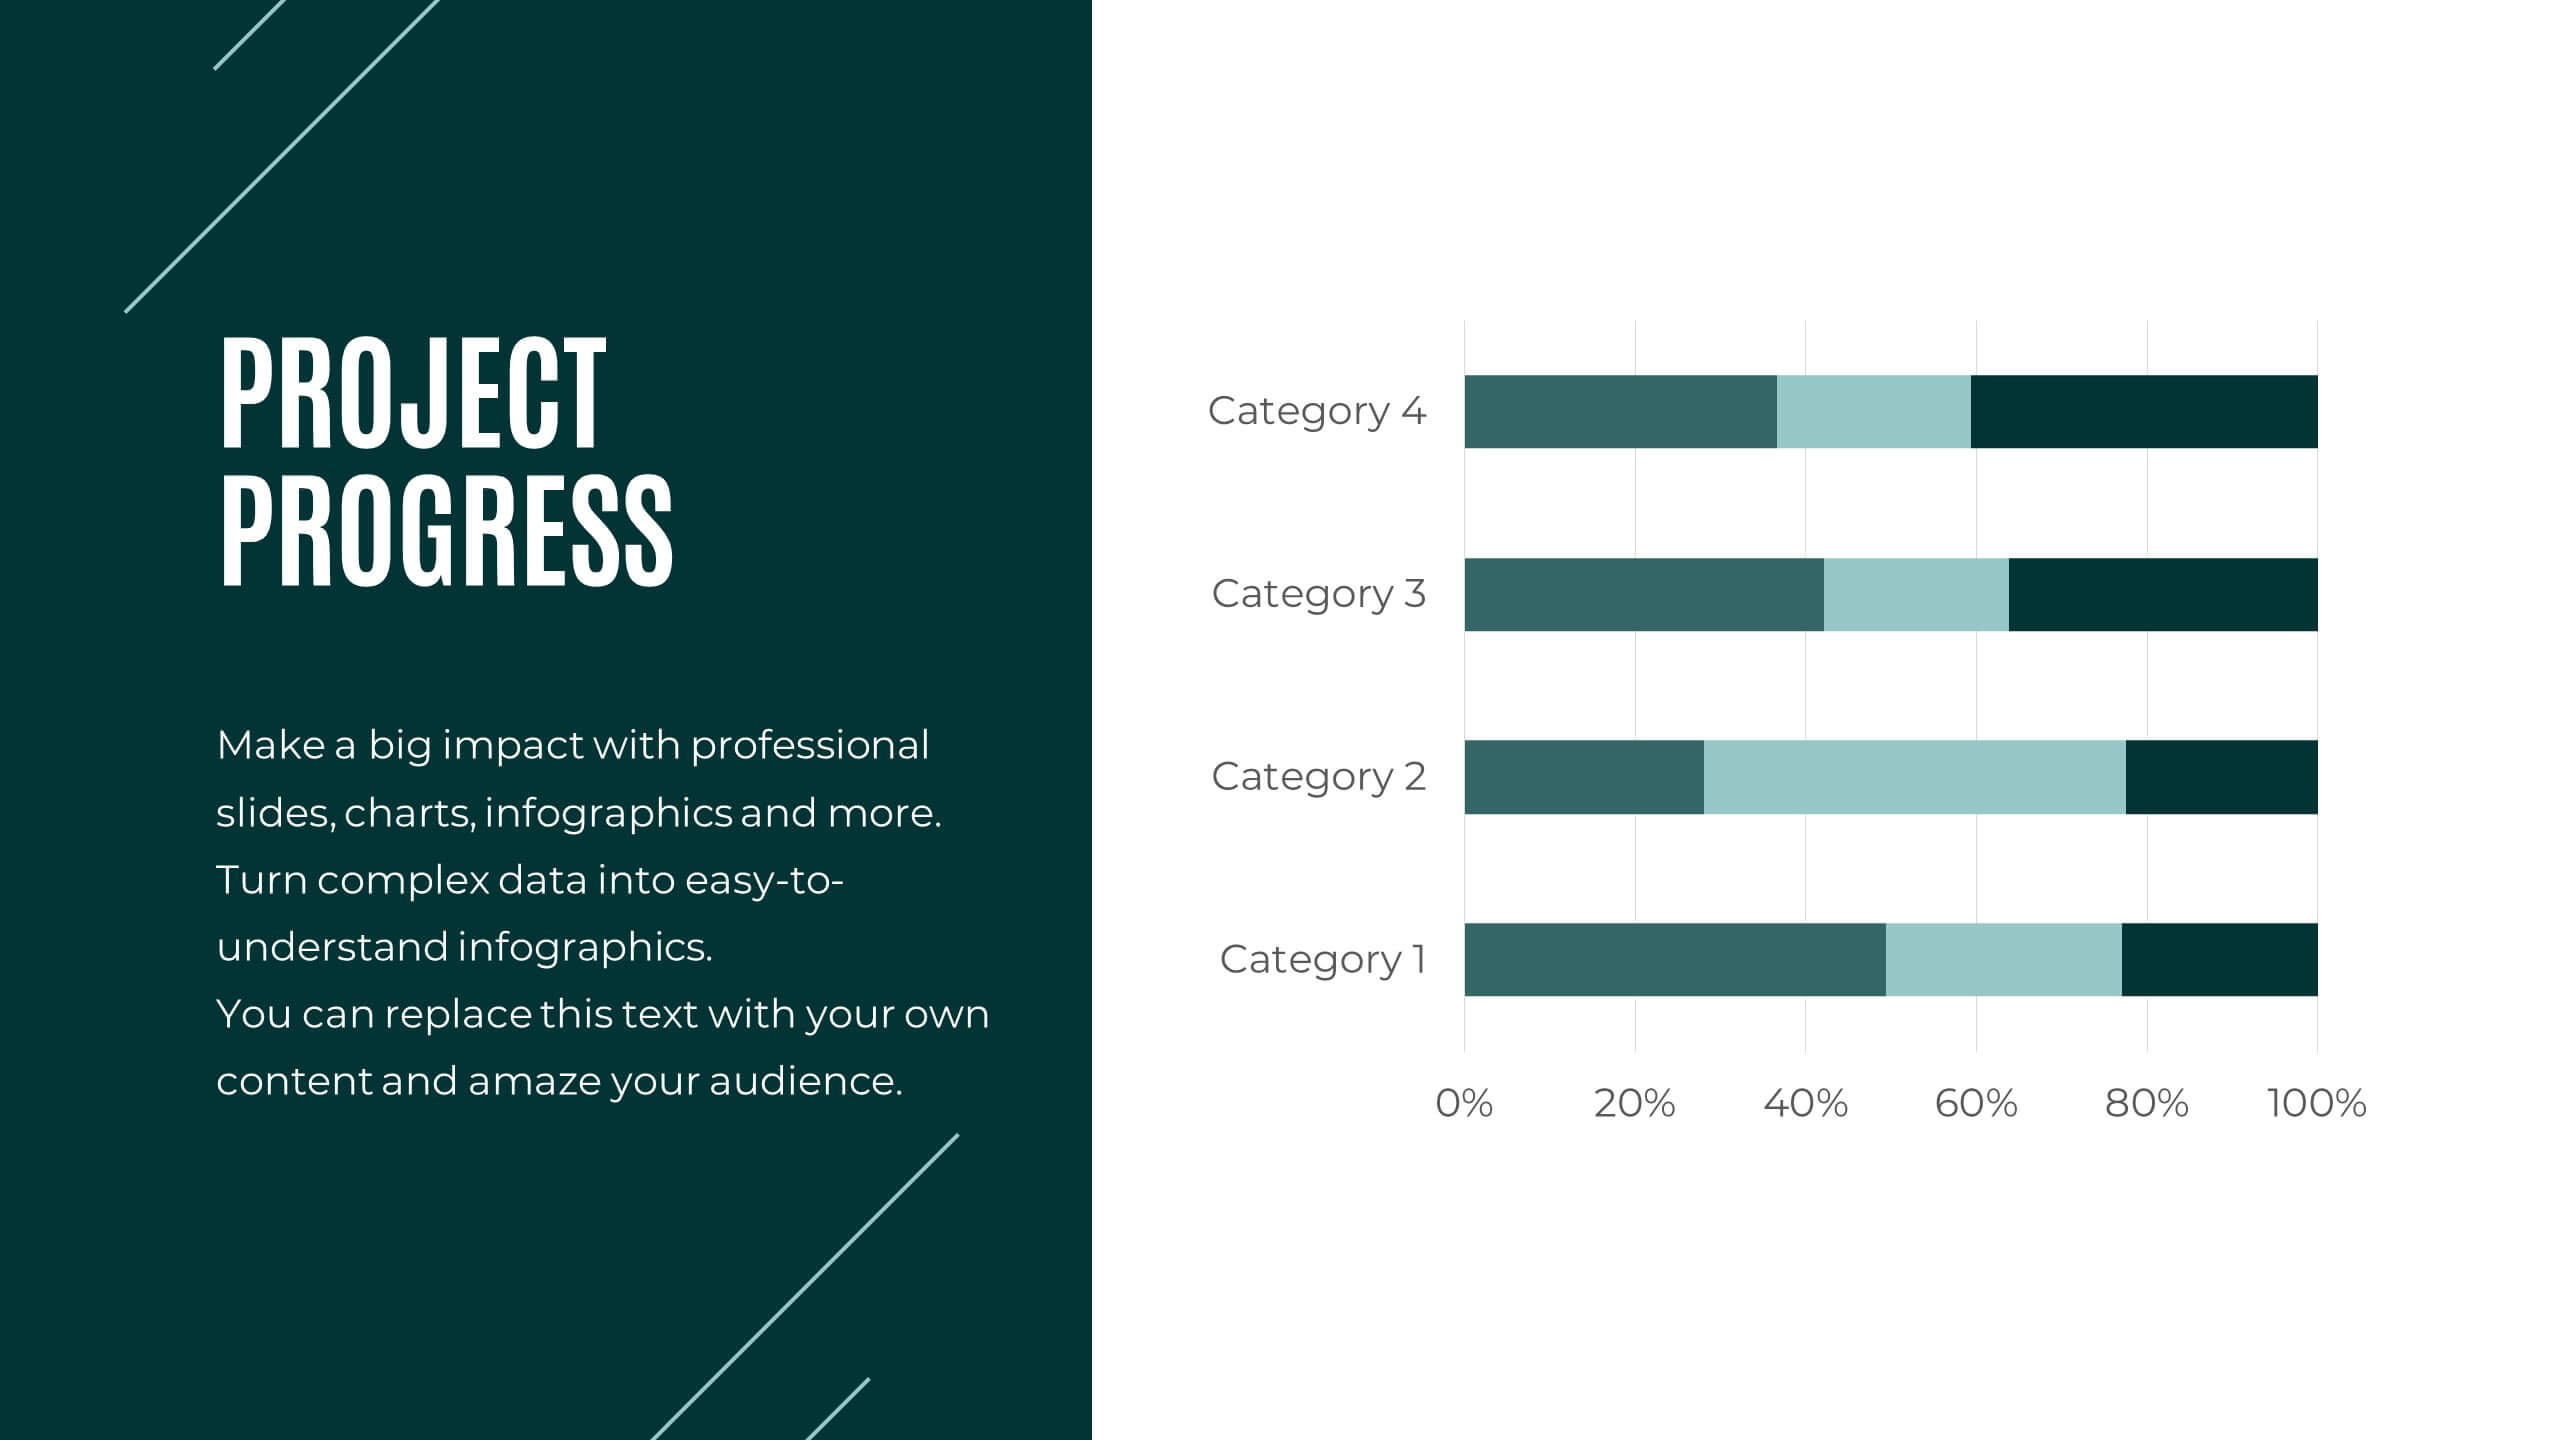
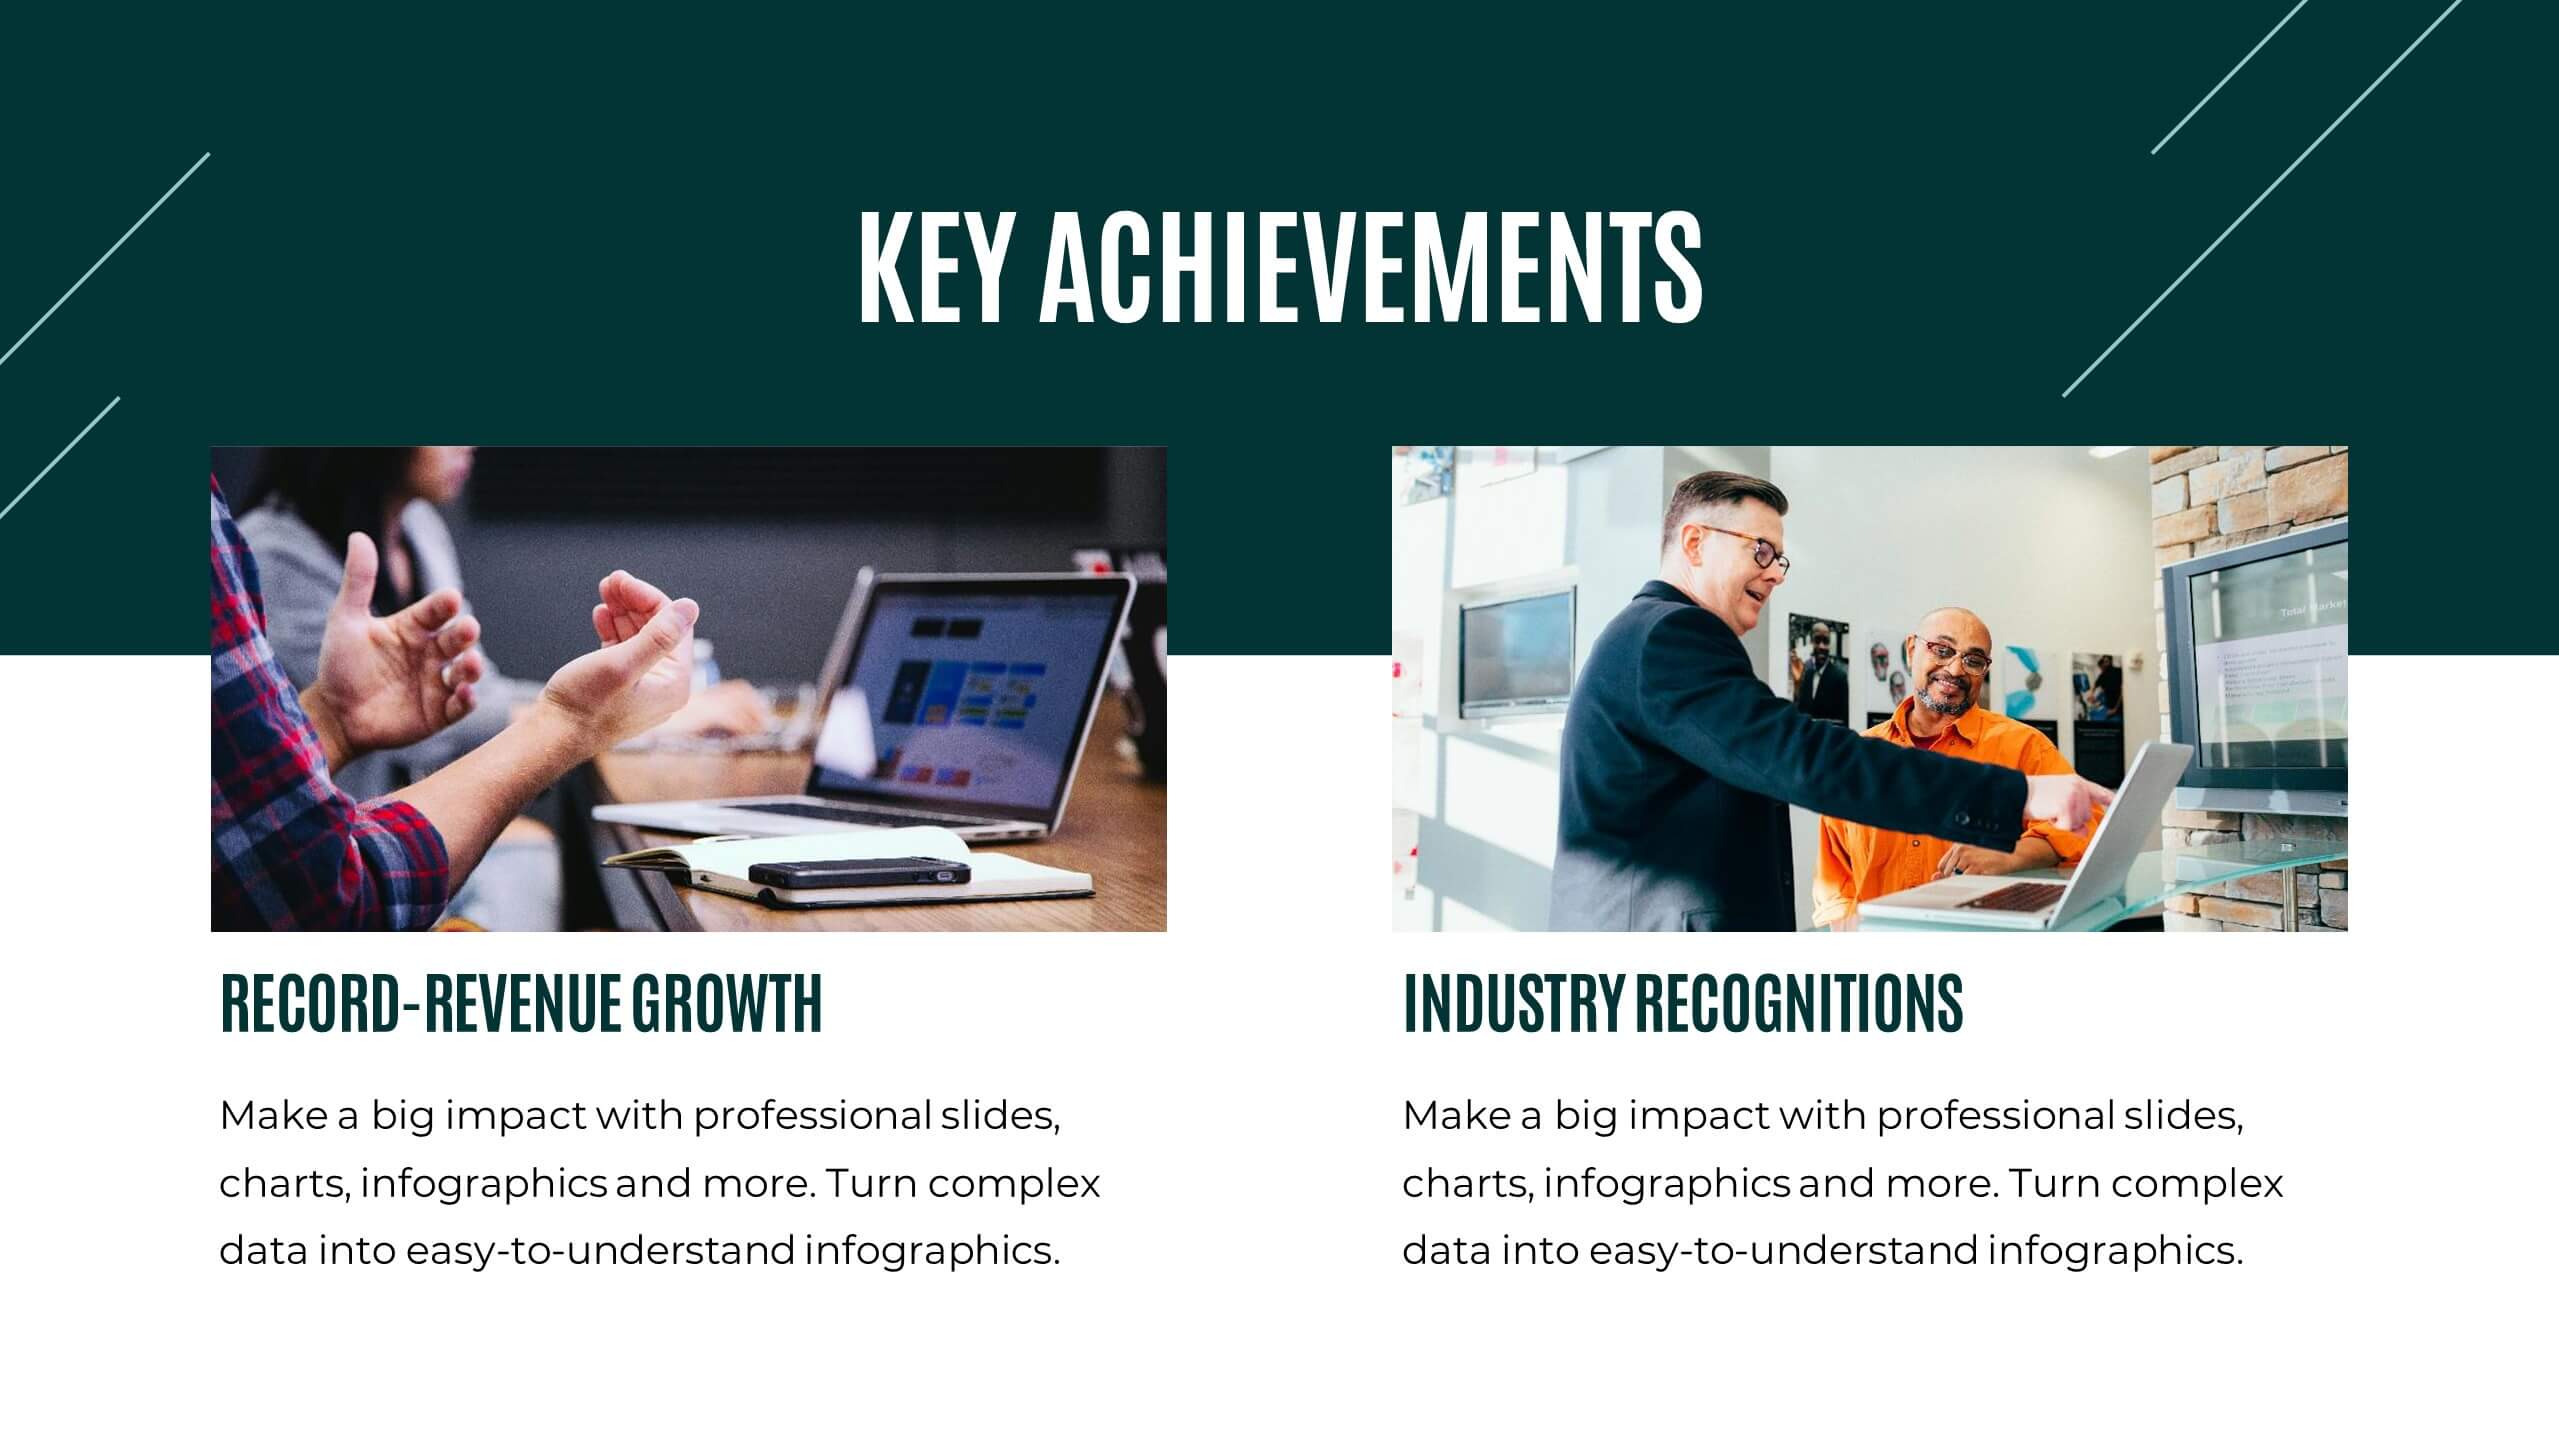
Doriyan is a beautiful, colorful, professional and descriptive presentation. This template has wonderful colors and graphics that are engaging and conveys the information to the audience. This template is suitable for all types of businesses especially those that are investors, realtors or other companies involved in investment advice. Charts, timelines and easy to edit text makes this template perfect for businesses seeking to introduce there business and services to make a great impression. Doriyan offers a way to boost your business. Present your information with this efficient template!


10 diapositivas
Corporate Growth Strategy Presentation
Elevate your corporate presentations with our "Corporate Growth Strategy Presentation" template. Designed to visually represent key growth strategies, this infographic uses a wrench graphic to symbolize the tools necessary for business expansion. Each segment of the wrench is color-coded, highlighting different strategic elements clearly and effectively. This format aids in discussing business objectives systematically, from foundational practices to advanced goals. Ideal for executives, strategists, and business analysts, this template ensures professional and coherent delivery of complex strategies. Compatible with PowerPoint, Keynote, and Google Slides, it is an indispensable tool for articulating and presenting sophisticated corporate strategies.


4 diapositivas
Customer Segment Breakdown Presentation
Bring clarity to your audience with a dynamic visual that highlights who your customers truly are and how each segment connects. This presentation helps you map behaviors, priorities, and shared traits in a clean, intuitive layout for smarter marketing and strategy decisions. Fully compatible with PowerPoint, Keynote, and Google Slides.


5 diapositivas
Investment Strategy and Growth Planning Presentation
Visualize your growth strategy using this clean and modern infographic layout. Each pawn-shaped graphic highlights key steps in your investment plan, ideal for financial planning, business development, or progress tracking. Fully customizable in PowerPoint, Google Slides, and Keynote—perfect for presenting strategic priorities and actionable insights with visual impact.


5 diapositivas
Process Improvement Cycle Mapping Presentation
Illustrate continuous growth and optimization with this modern process improvement cycle template. Featuring a dynamic circular flow design, it’s ideal for showcasing iterative strategies, workflow enhancements, or business development stages. Fully editable in Canva, PowerPoint, and Google Slides, it ensures clarity and professionalism in mapping each step toward better performance.


6 diapositivas
Virtual Team Collaboration and Productivity Presentation
Boost team synergy and streamline communication with this Virtual Team Collaboration and Productivity presentation. Designed around a 6-step path, this visual layout helps illustrate key strategies for remote teamwork, digital workflows, and efficient task distribution. Each step is clearly labeled with space for your insights, making it ideal for team training, project kickoff meetings, or collaboration tool tutorials. Fully editable and compatible with PowerPoint, Keynote, and Google Slides.


22 diapositivas
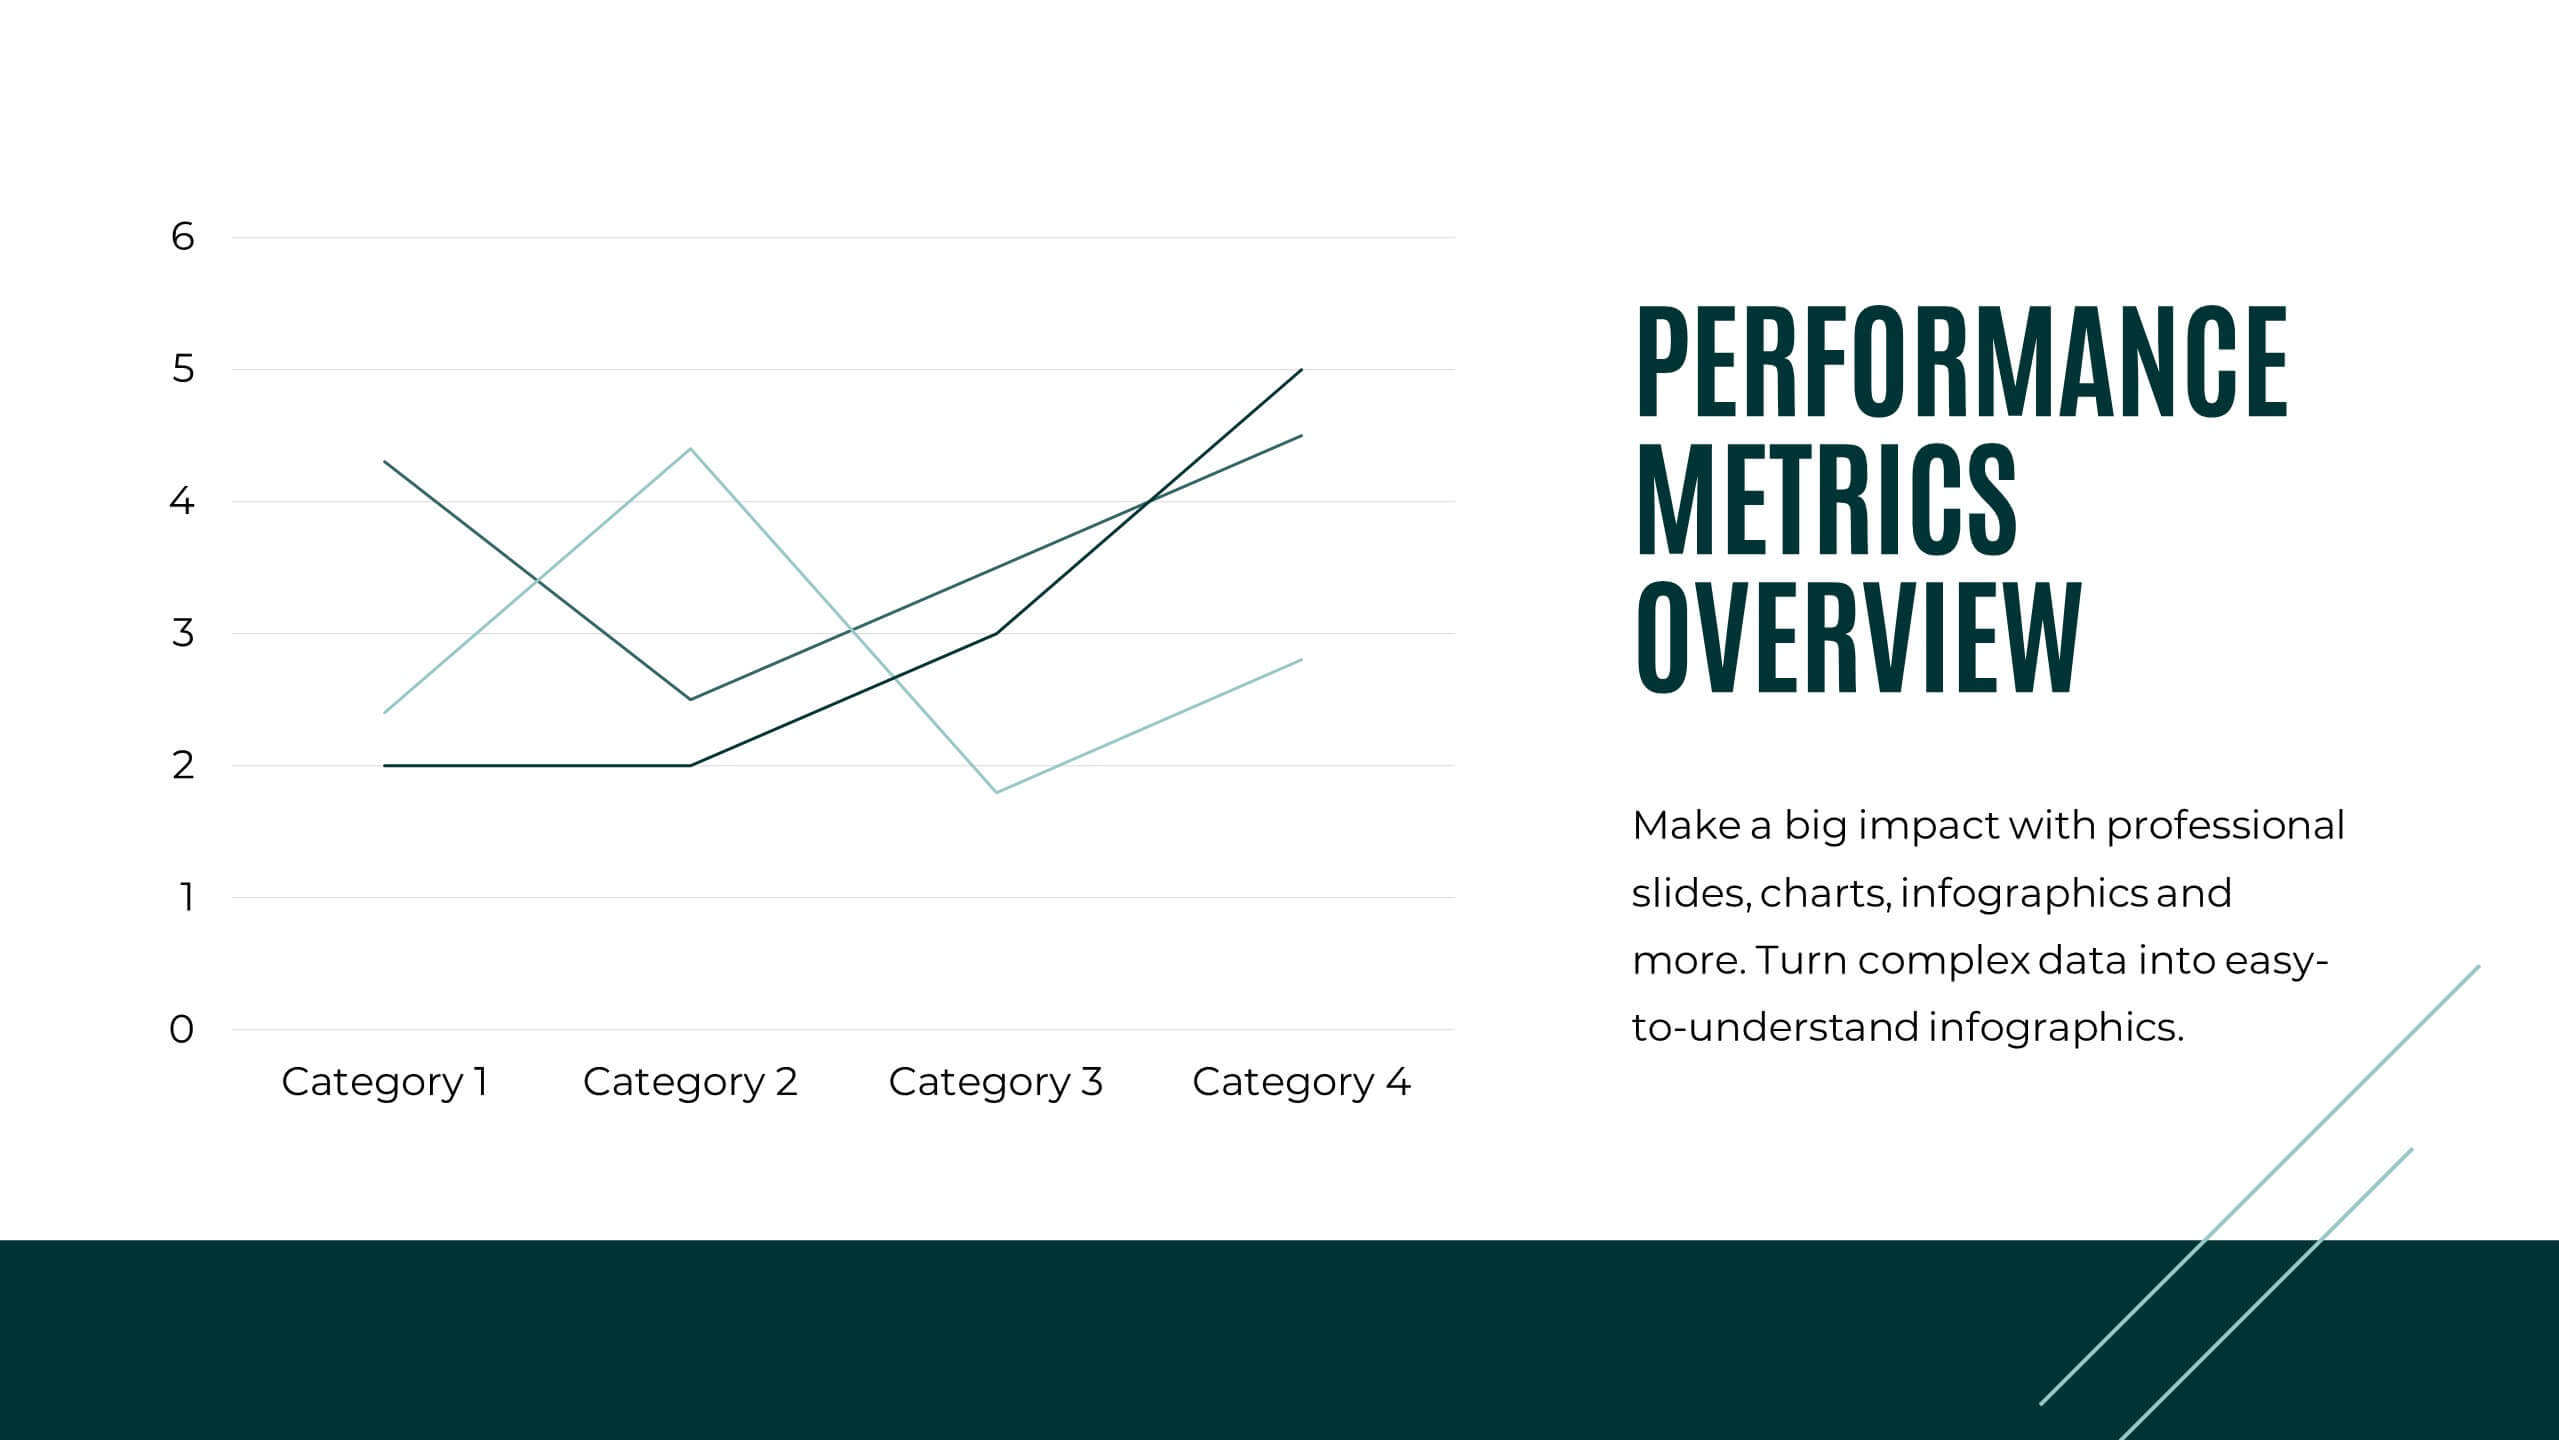
Prism Project Status Report Presentation
Deliver impactful updates with this comprehensive project status report template! Perfect for presenting key highlights, performance metrics, and strategic initiatives. Ideal for project managers aiming to keep stakeholders informed and aligned. Compatible with PowerPoint, Keynote, and Google Slides, this template ensures your reports are clear, professional, and engaging. Keep projects on track!


4 diapositivas
Minimal Company Profile Deck Presentation
Make a bold first impression with this sleek, minimal layout designed to showcase your company’s vision, services, and team with clarity and style. Perfect for startups or established brands, it balances professionalism and creativity effortlessly. Fully editable and compatible with PowerPoint, Keynote, and Google Slides for seamless customization.


5 diapositivas
IT Operations Management
Illustrate complex workflows with this gear-themed infographic designed for IT operations management. Each gear represents a key step or stage, perfect for showcasing interconnected processes, system automation, or IT service flow. Easy to customize in PowerPoint, Keynote, and Google Slides. Clean, professional layout with space for icons and concise text.


5 diapositivas
Business Advantages and Benefits Presentation
Showcase your company's strengths with this modern Business Advantages and Benefits Presentation. Featuring a sleek puzzle-style design, this slide is perfect for illustrating interconnected benefits, core features, or success factors. Ideal for business proposals, team briefings, and client meetings, the layout is fully customizable in PowerPoint, Keynote, or Google Slides to match your brand colors and message.


4 diapositivas
End Slide with Strategic Reflection Presentation
Wrap up your presentation with purpose using the End Slide with Strategic Reflection Presentation. Designed to highlight final insights, priorities, or key outcomes, this template features a visual pyramid layout ideal for summarizing growth, goals, or performance tiers. Fully editable in Canva, PowerPoint, and Google Slides for easy customization.


10 diapositivas
Revenue Growth Strategies and Metrics Presentation
Highlight your key success drivers with the Revenue Growth Strategies and Metrics Presentation. This upward arrow-based layout is perfect for showcasing growth phases, financial KPIs, or strategic revenue initiatives. Clean, professional, and fully editable in PowerPoint, Keynote, and Google Slides—ideal for business reviews, sales pitches, and quarterly updates.


6 diapositivas
Innovative Idea Pitching Guide Presentation
Present your ideas with clarity using the Innovative Idea Pitching Guide Presentation. This dynamic five-step circular flow design is perfect for showcasing pitch stages, idea development, or startup concepts. Each section includes icons and text blocks to clearly explain key points, keeping your message organized and impactful. Fully editable in Canva, PowerPoint, Keynote, and Google Slides.


21 diapositivas
Thunderbird Small Business Pitch Deck Presentation
Take flight with this dynamic Thunderbird-inspired presentation, perfect for pitching your small business! Designed to highlight your business model, market potential, and financial projections, this template ensures your pitch is clear, compelling, and professional. Its bold visuals will help you soar. Compatible with PowerPoint, Keynote, and Google Slides.


6 diapositivas
Green Business Practice Implementation Presentation
Showcase your sustainability strategy with this Green Business Practice Implementation Presentation. Featuring a segmented lightbulb diagram, this slide is ideal for outlining eco-friendly initiatives, sustainable development goals, or ESG compliance efforts. Perfect for corporate sustainability reports or green business planning. Fully compatible with PowerPoint, Keynote, and Google Slides.


6 diapositivas
Internal Communication Framework Presentation
Foster stronger collaboration with this visual internal communication framework template. Ideal for showcasing how information flows within departments, this layout helps clarify messaging channels, responsibilities, and feedback loops. Whether you're streamlining communication strategies or presenting team structures, it’s fully editable and works seamlessly with PowerPoint, Keynote, and Google Slides.


20 diapositivas
Cinderbark Product Launch Pitch Deck Presentation
Showcase your product launch with a sleek, modern, and professional pitch deck template. This design empowers you to captivate stakeholders by clearly presenting your problem statement, unique solutions, and market opportunity. Effectively highlight your target audience, revenue model, and competitive landscape to demonstrate market viability. Create impact with visuals detailing your sales strategy, growth projections, and financial summary, ensuring transparency and confidence in your business plan. Timeline and milestone slides keep the focus on key achievements and future goals, while team introduction pages establish credibility and expertise. Fully customizable and compatible with PowerPoint, Google Slides, and Keynote, this template is ideal for startups, entrepreneurs, and product managers aiming for a polished and compelling presentation. Tailor it to your needs and deliver your vision with clarity and style.