


Características


¿Tienes alguna pregunta?
Recomendar


21 diapositivas
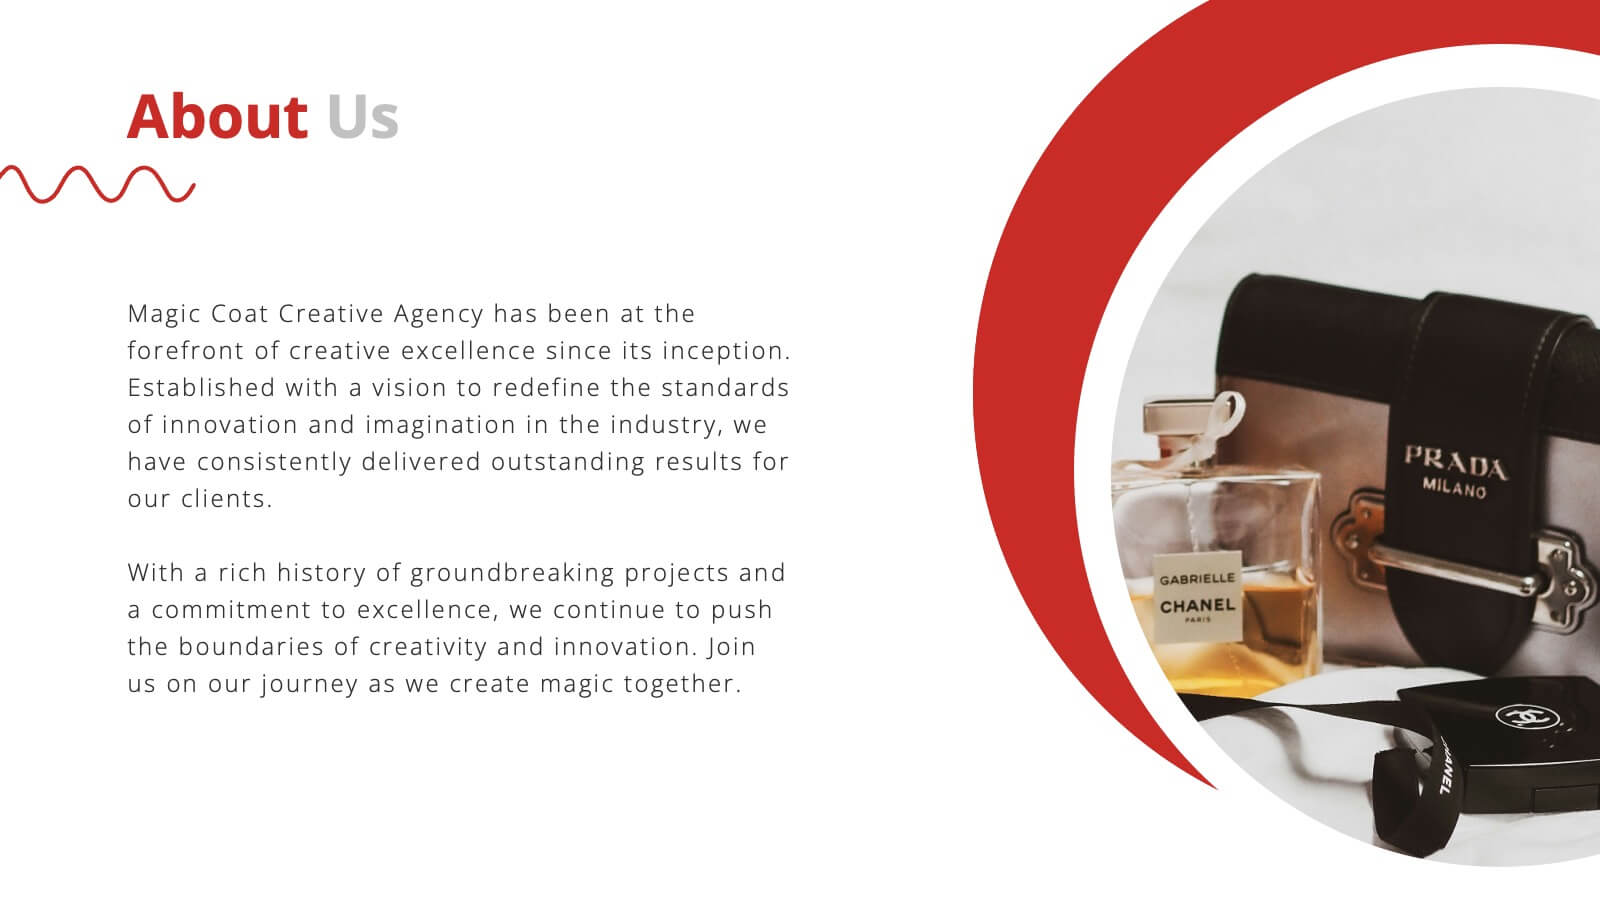
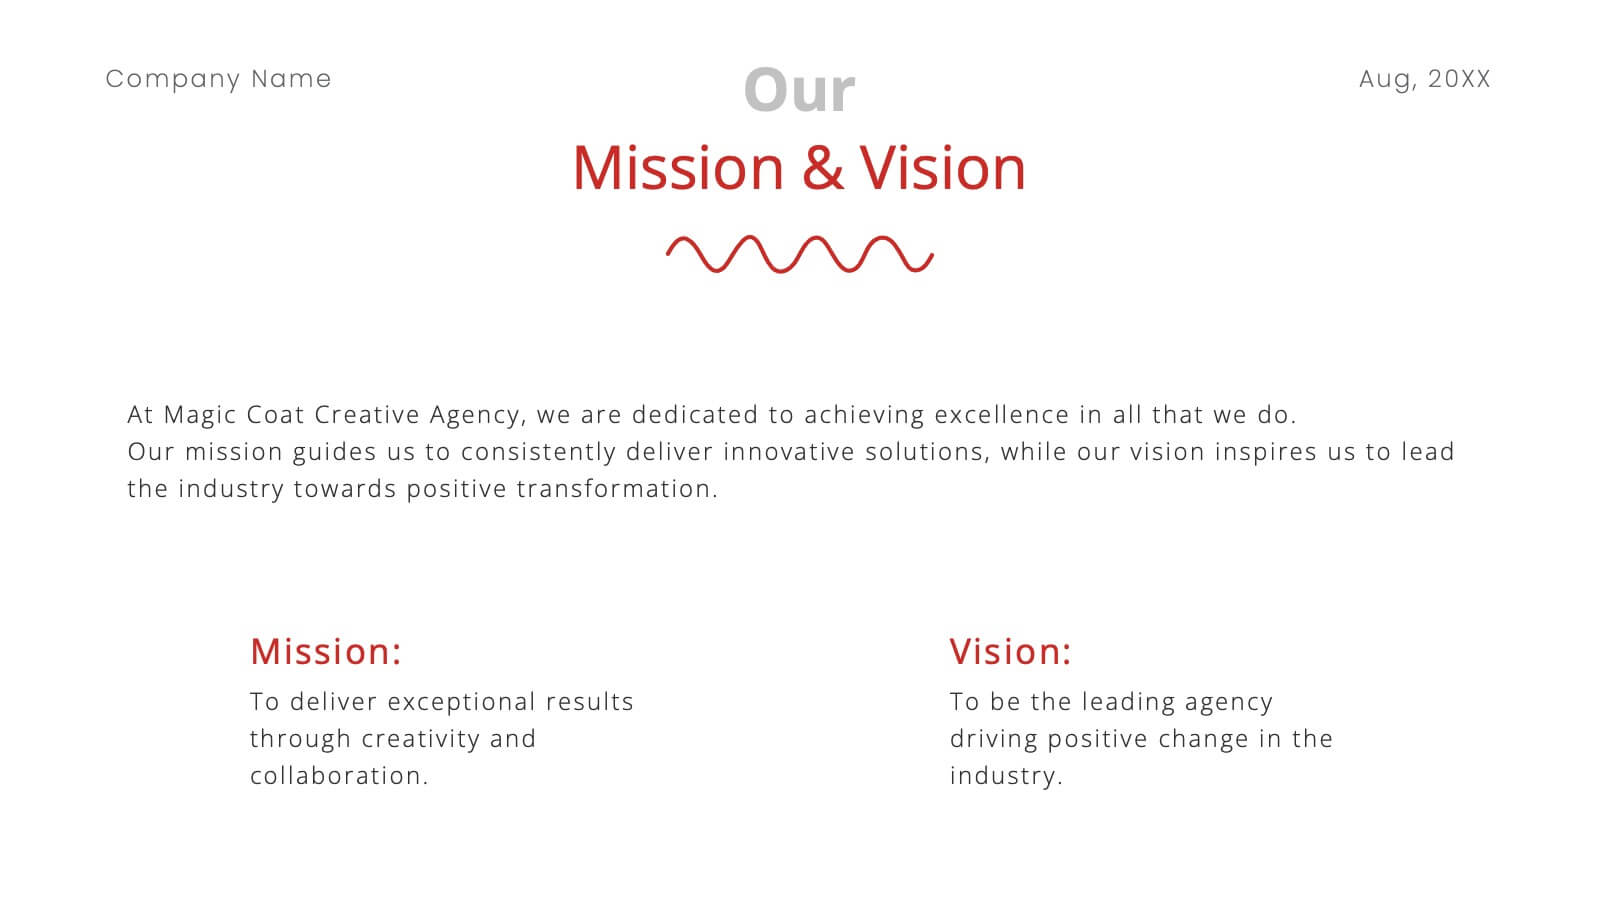
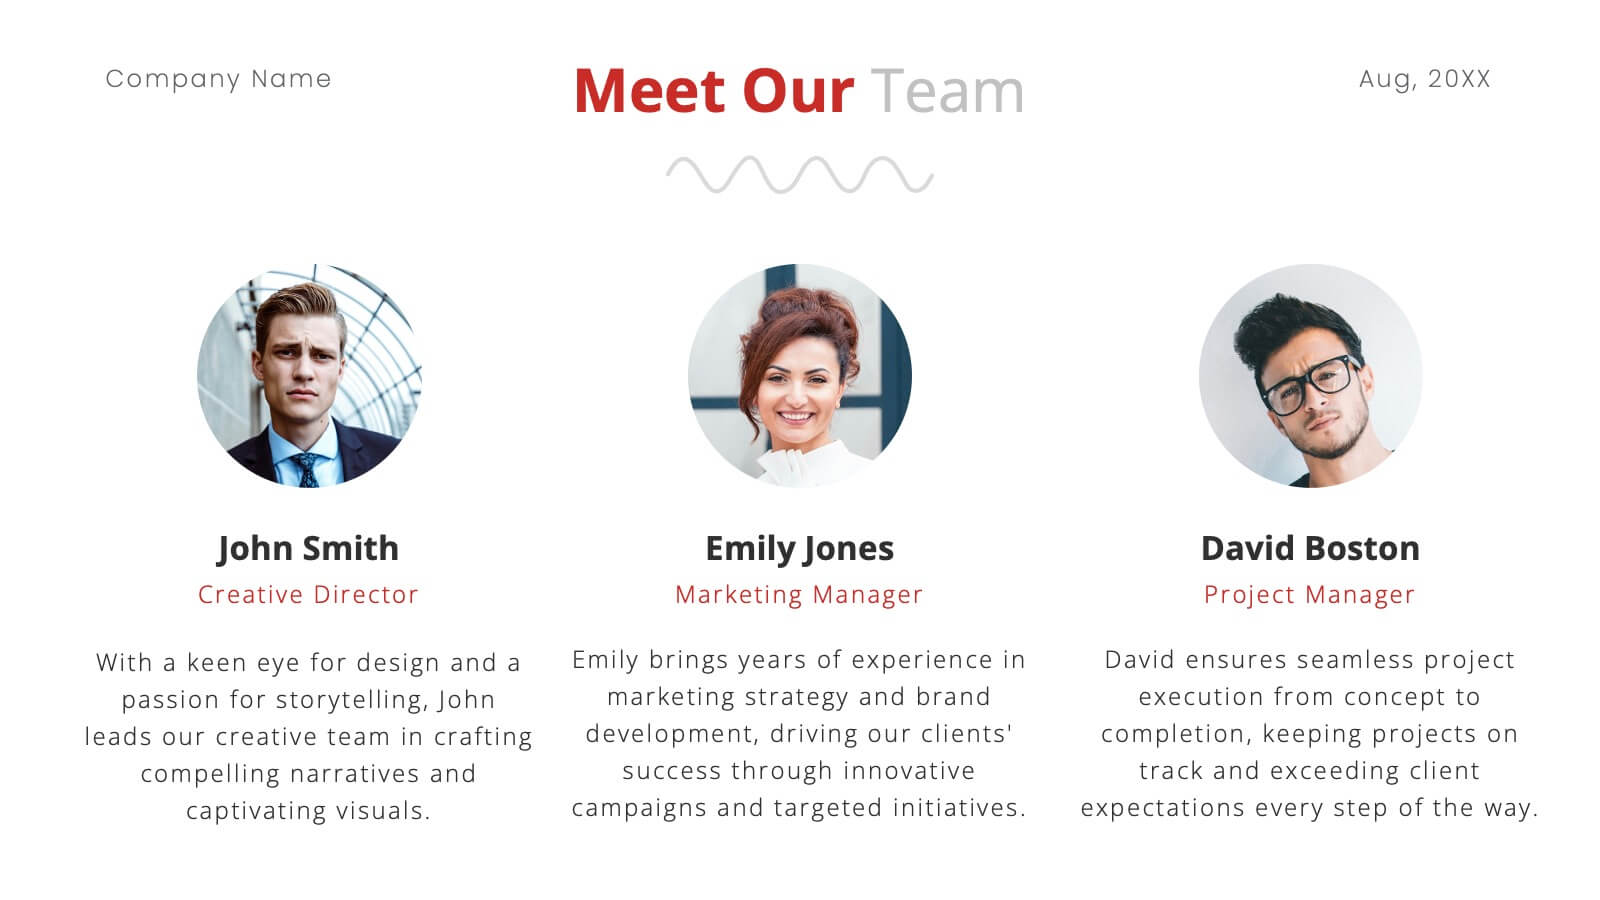
Seaspray Design Proposal Presentation
Present your design proposal with confidence and clarity using this sleek, professionally crafted template. Tailored for designers and creatives, this presentation includes slides for a company overview, project summary, and a clear articulation of the problem statement with a proposed solution. Walk your audience through your objectives and goals, detailed scope of work, and structured methodology for implementation. Highlight key aspects with a timeline and milestones, and deliver value with dedicated slides for budget breakdowns and pricing structures. Build trust and credibility through client testimonials and showcase expertise with a team introduction. End your presentation with actionable next steps and a well-crafted conclusion to leave a lasting impact. Fully customizable for PowerPoint, Google Slides, and Keynote, this template is perfect for creative professionals aiming to win clients and projects with precision and style.


7 diapositivas
Project Status Report Infographic Presentation
The importance of project status is related to the ability to monitor and control a project effectively. Project status is essential for effective project management. This template has been designed to help professionals gain more control over their projects. Use this template to enable project stakeholders to communicate, monitor progress, manage risks, make informed decisions, and promote accountability and continuous improvement. You can use this to manage all your projects, tasks and team members effortlessly. This template is available in PowerPoint, Keynote and Google Slides.


5 diapositivas
Comprehensive Sex Education Infographics
Navigate the sensitive landscape of human sexuality education with our comprehensive sex education infographics. Cast on a canvas of bold colors like black, yellow, and red, these infographics delicately handle the topics inherent to sex education. This tool is invaluable for educators, health professionals, advocacy groups, and policymakers who champion for informed, safe, and healthy choices. Compatible with Powerpoint, Keynote, and Google Slides. Ensuring the content resonates with audiences of diverse ages and backgrounds. The inclusion of compelling graphics and intuitive icons, fosters an environment of learning and openness, essential for impactful discussions.


7 diapositivas
Agriculture Infographics Presentation Template
Our Agriculture Infographic template is a great way to present your information about the structure, process and procedures of agricultural. This template includes a set of slides with illustrations and charts that will help you make an eye-catching presentation in just minutes. This template has been designed for use in PowerPoint, and is well-suited for both personal and business use. This infographic template is a perfect choice for presenting the statistical data about agriculture, such as product and service, market share and revenue, production levels and other information.


5 diapositivas
Retention and Loyalty Program Benefits Presentation
Showcase the value of your loyalty strategy with the Retention and Loyalty Program Benefits presentation. This template clearly communicates reward tiers, membership perks, and engagement incentives using a card-based visual structure. Perfect for marketing presentations, customer success teams, and subscription-based business models. Fully customizable in PowerPoint, Keynote, and Google Slides.


24 diapositivas
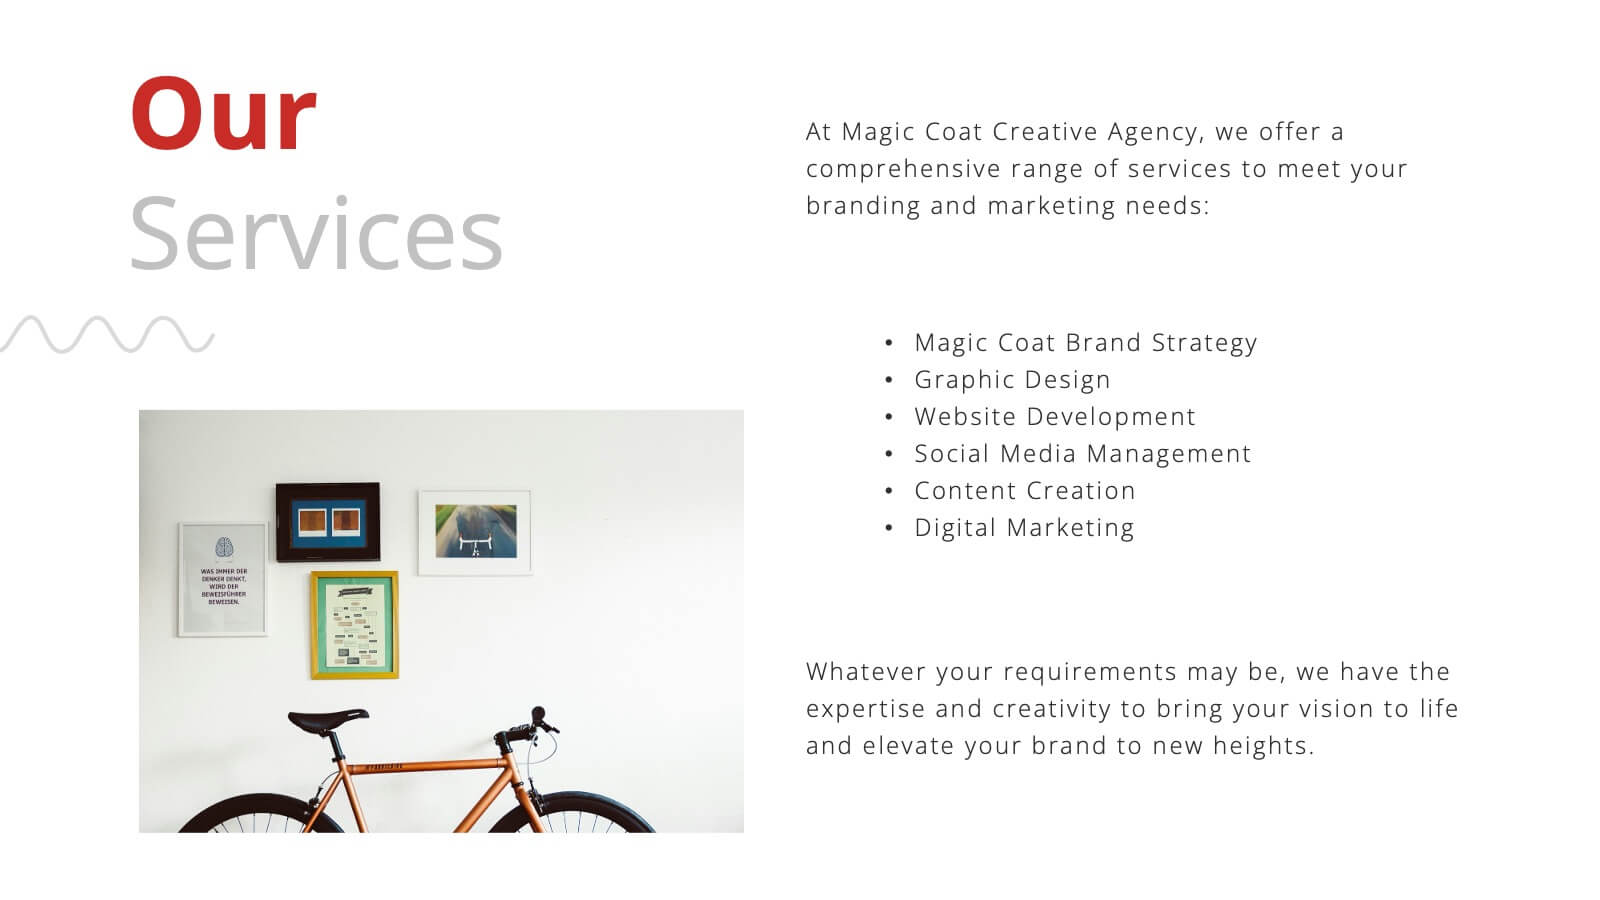
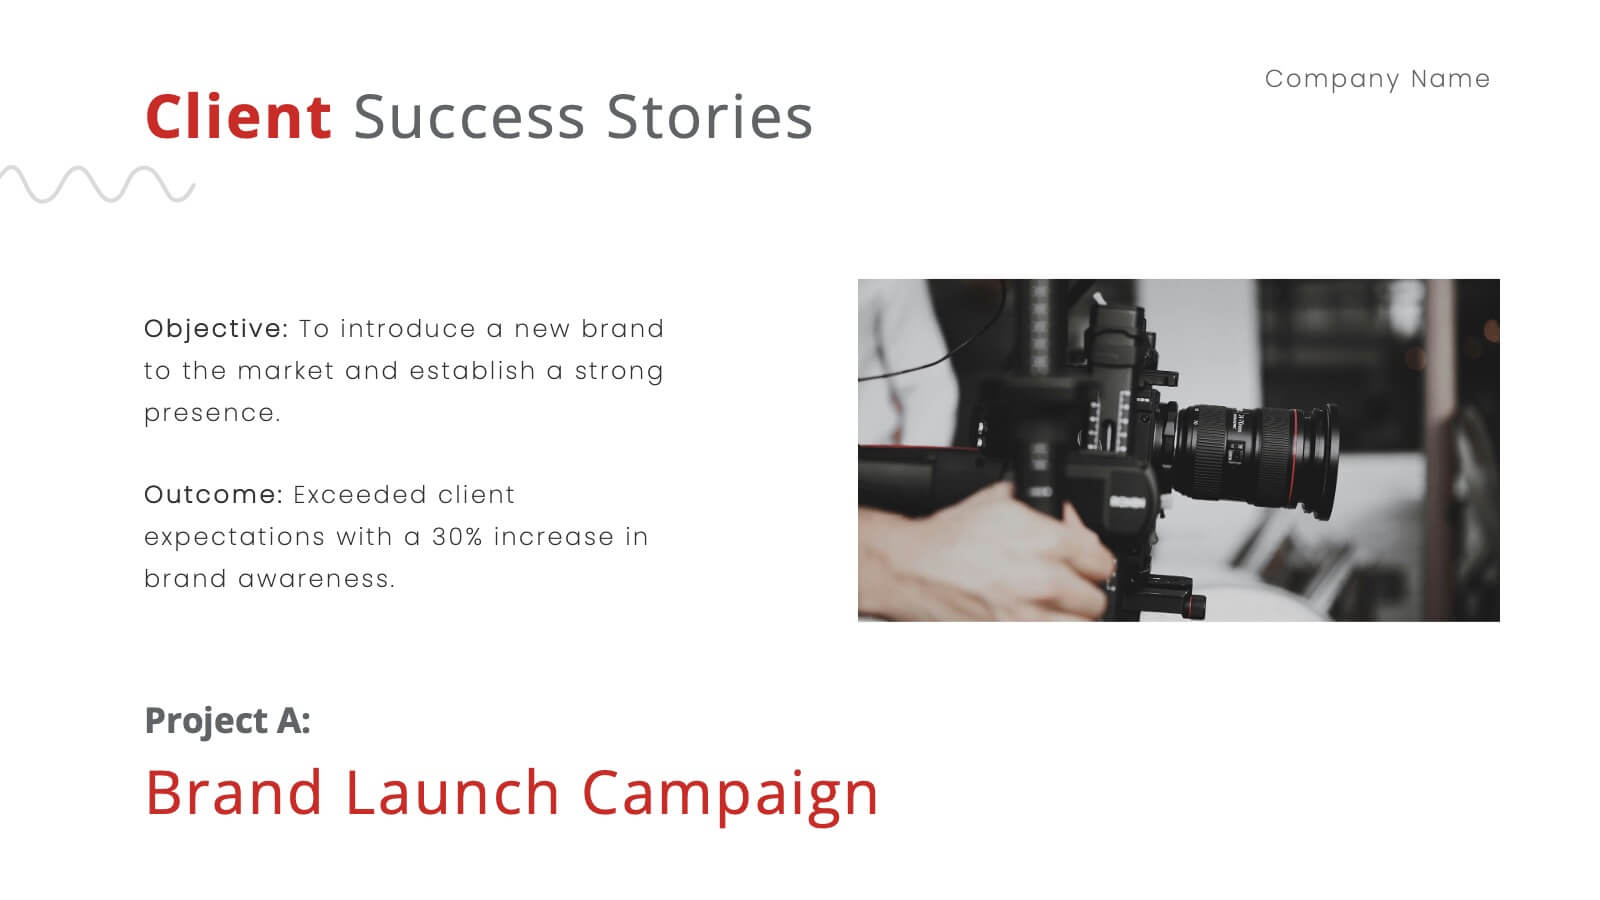
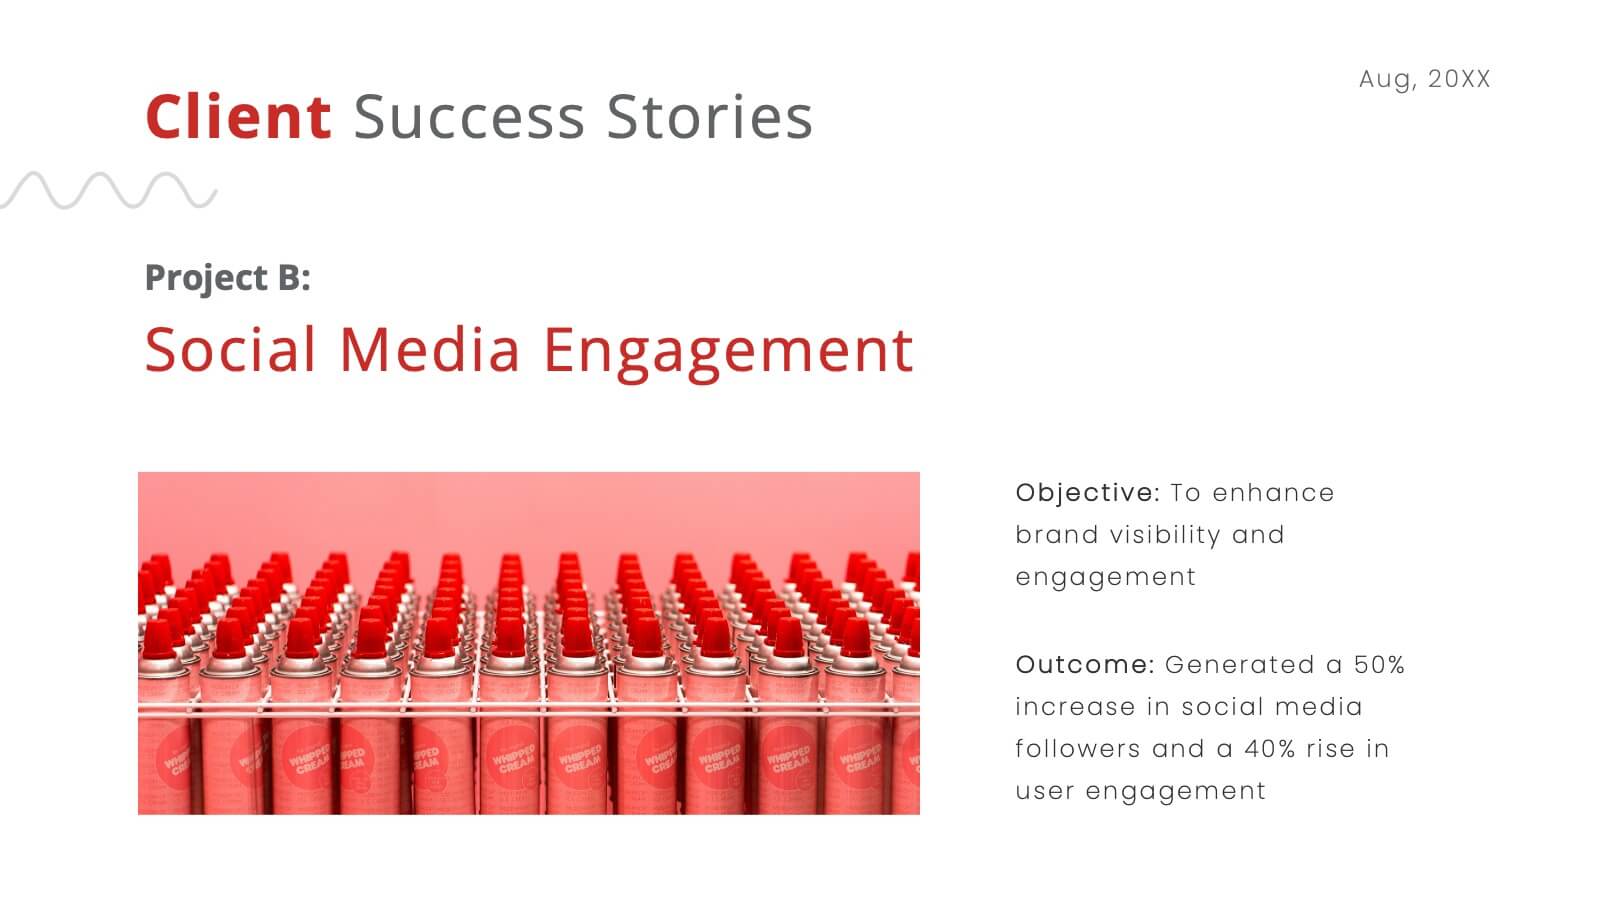
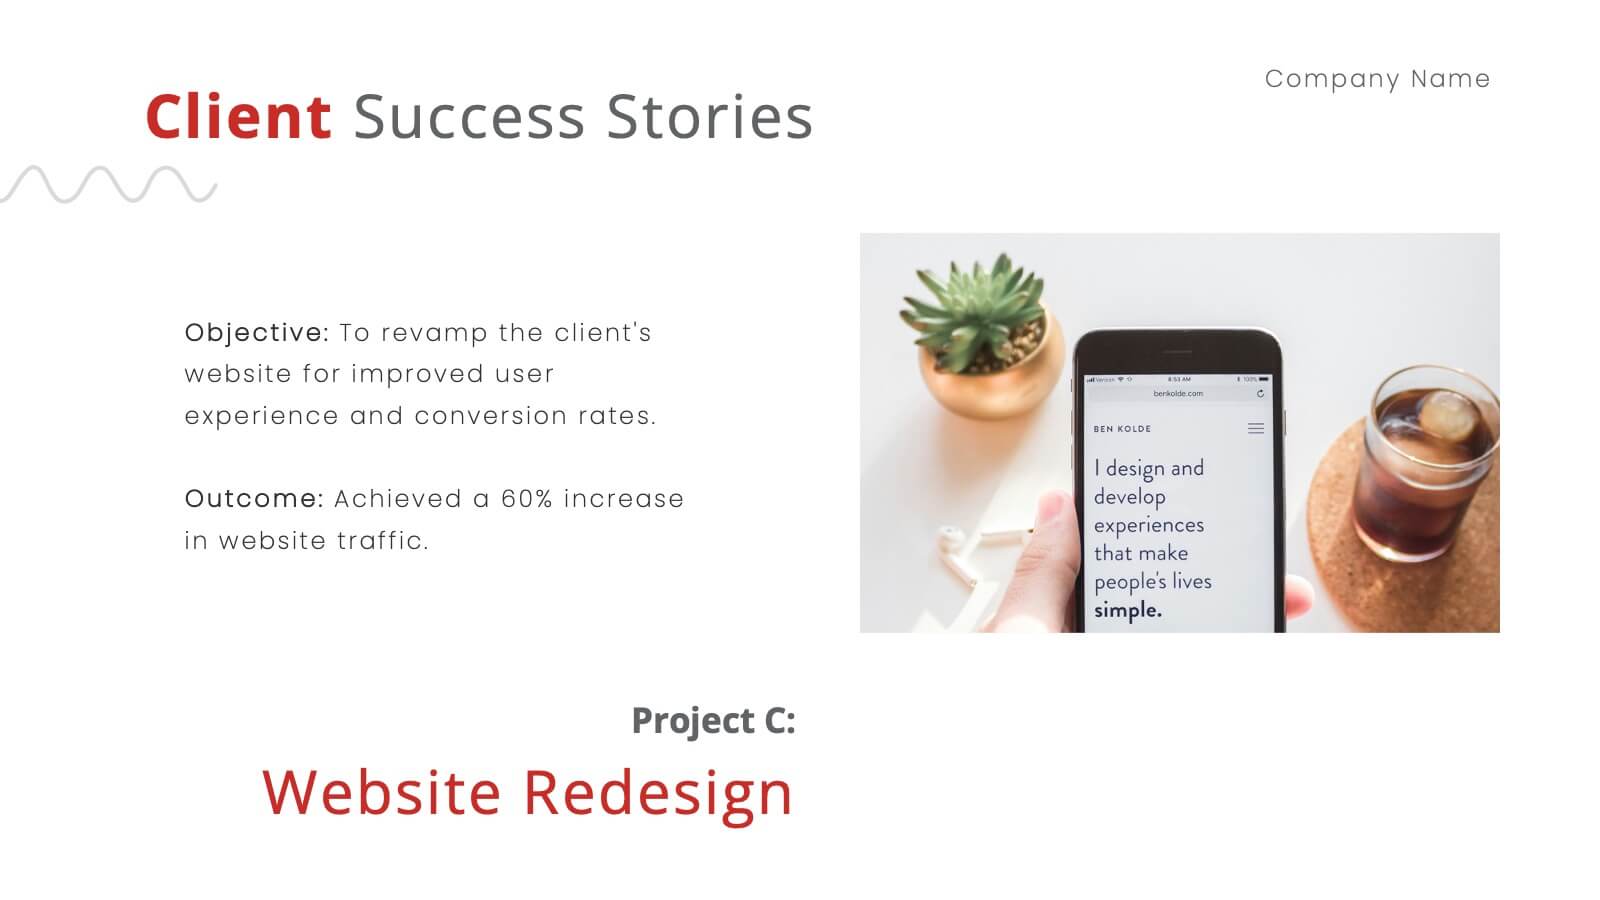
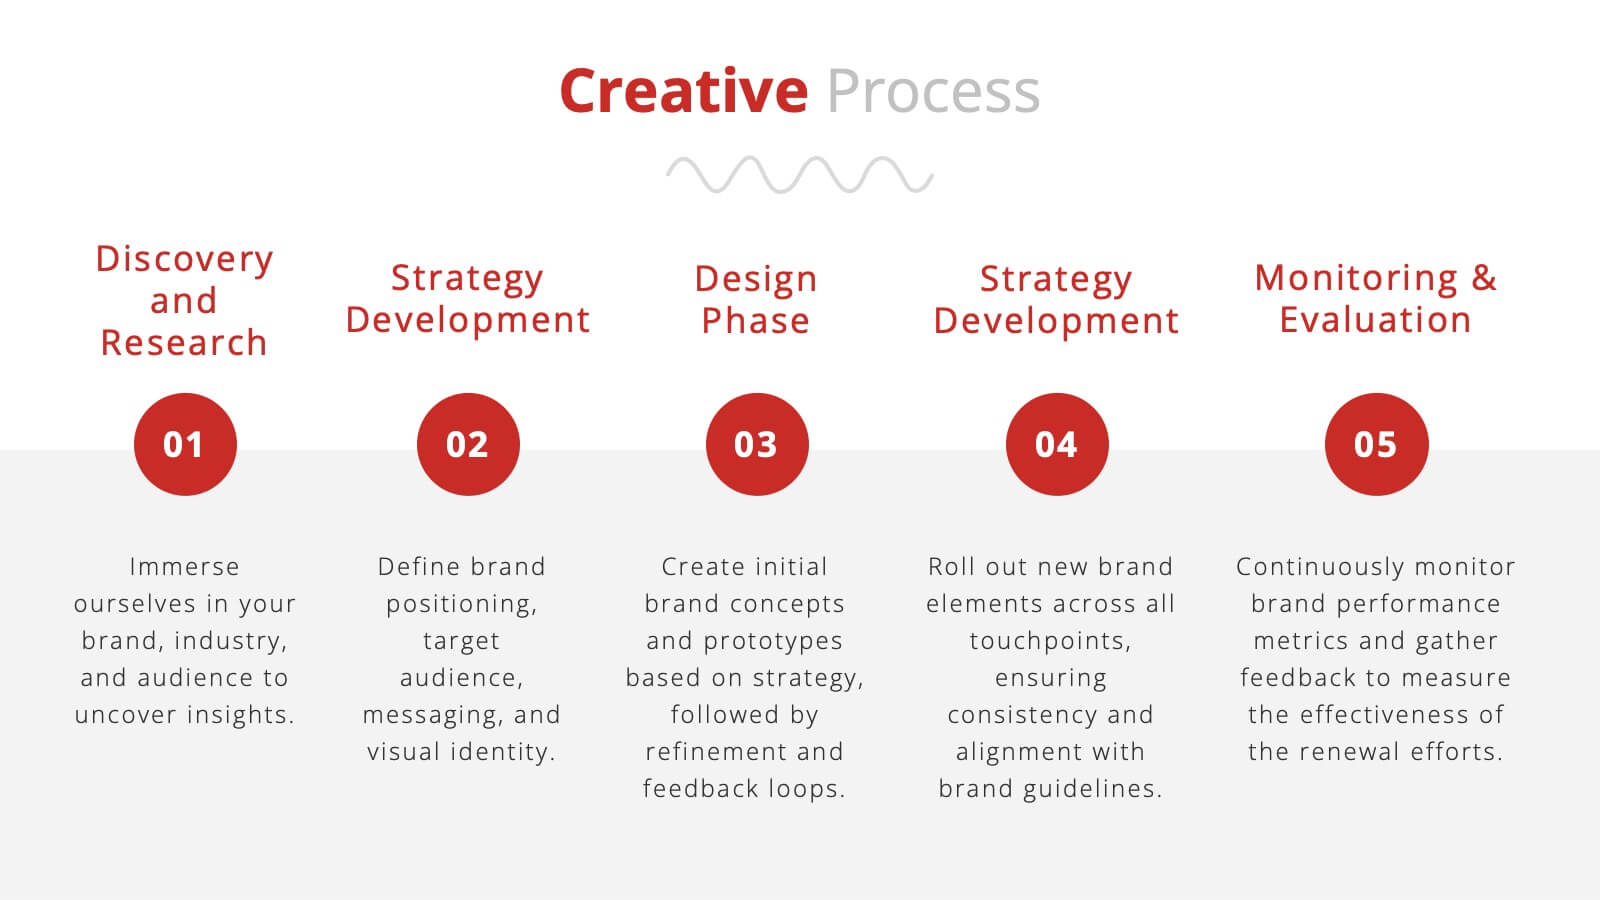
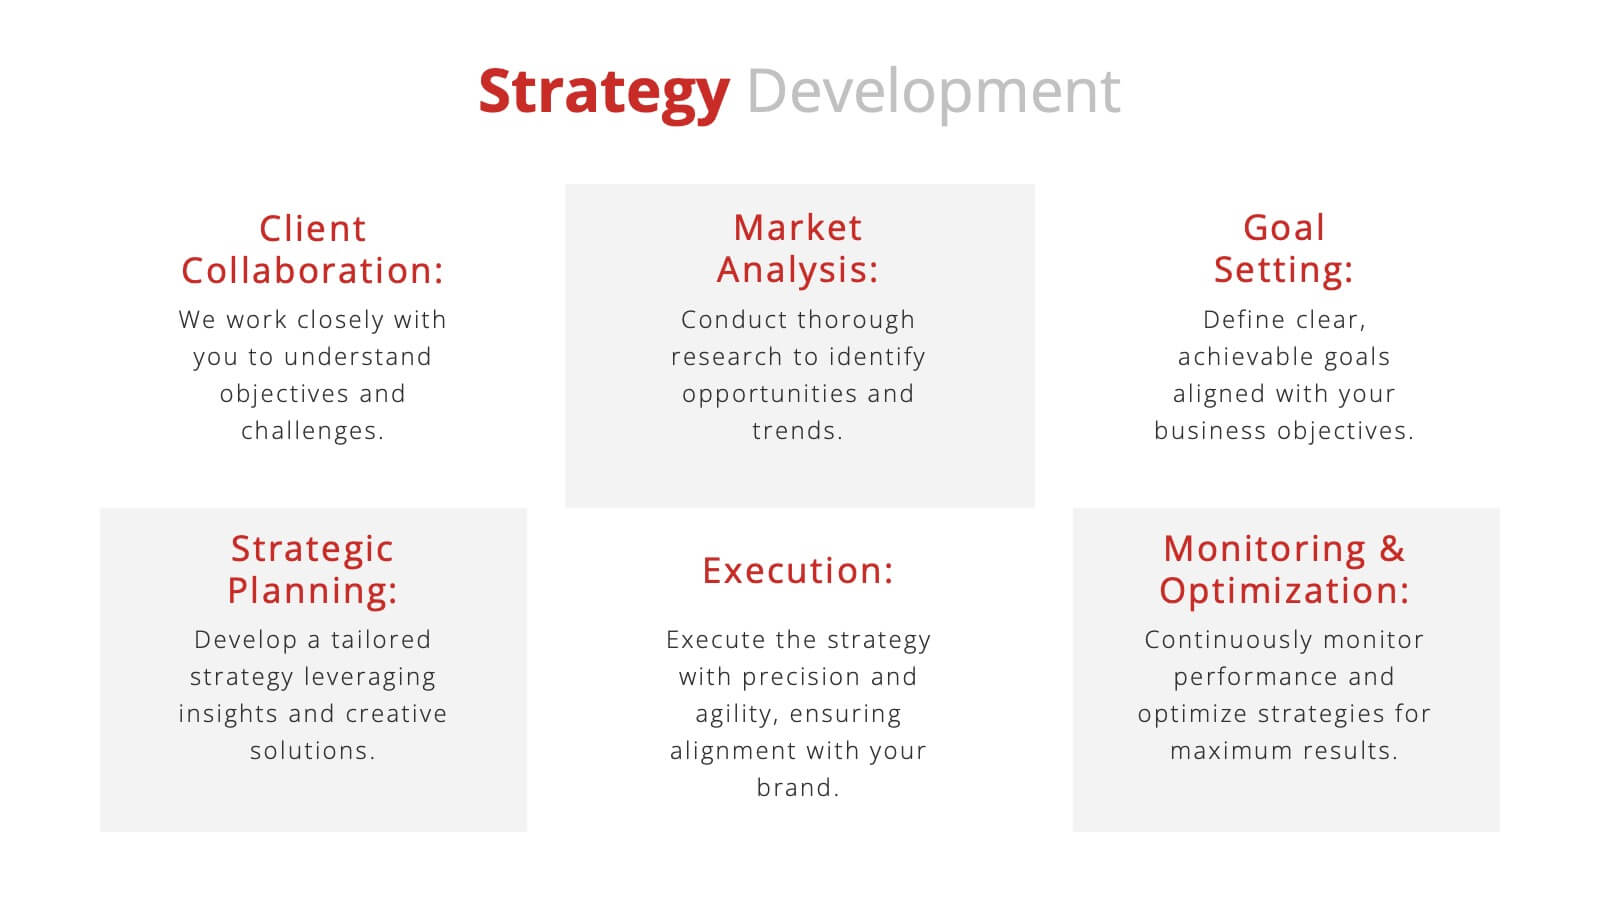
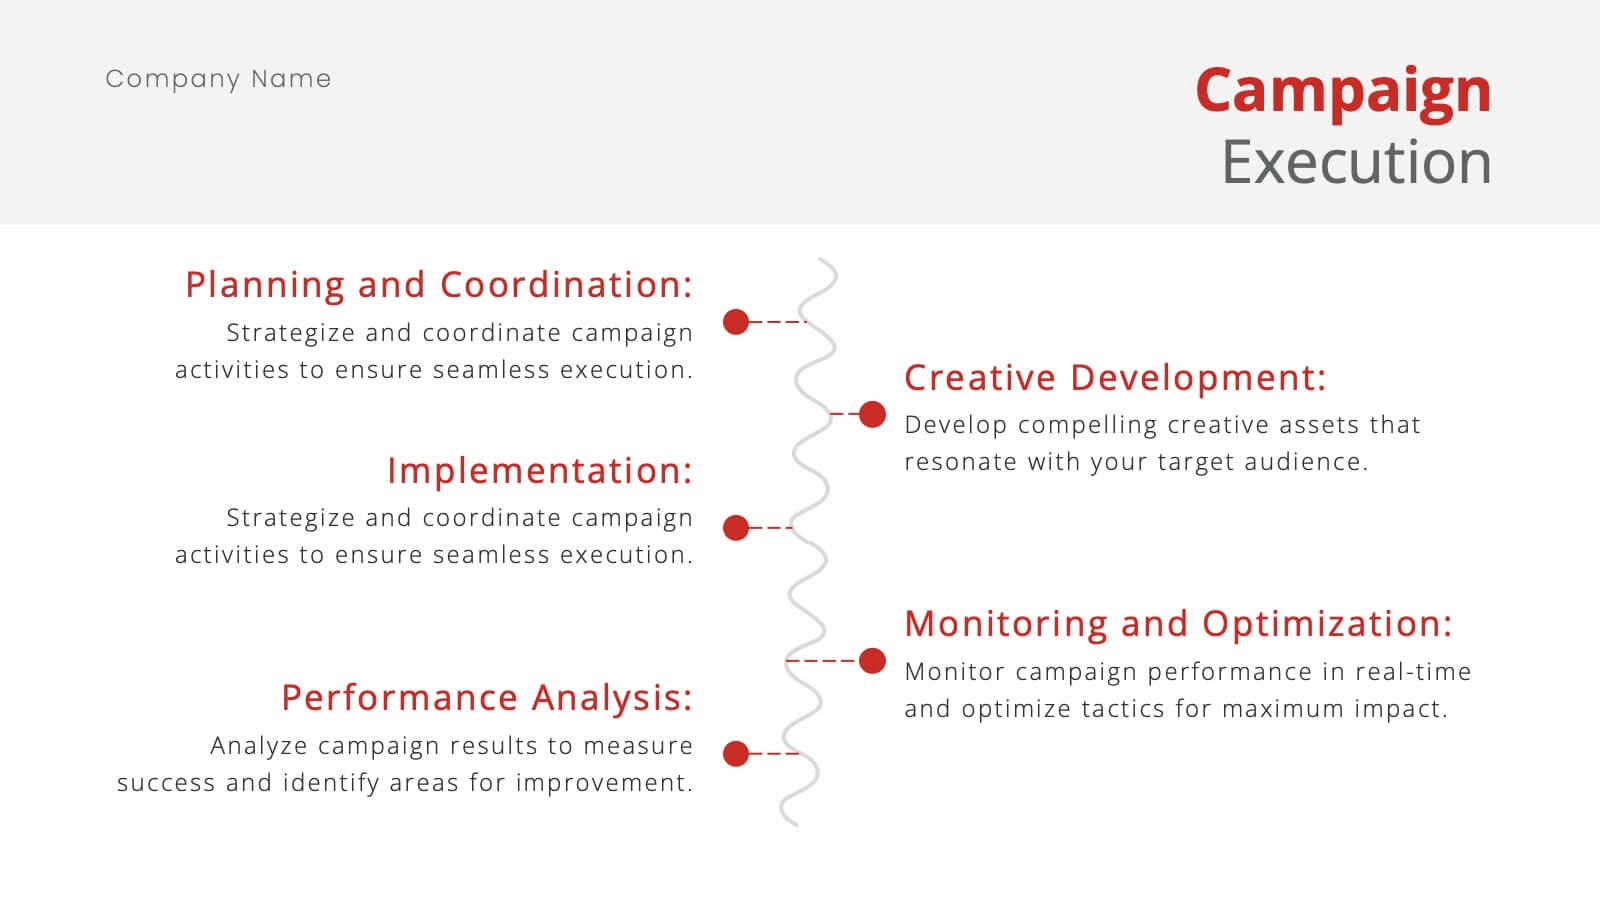
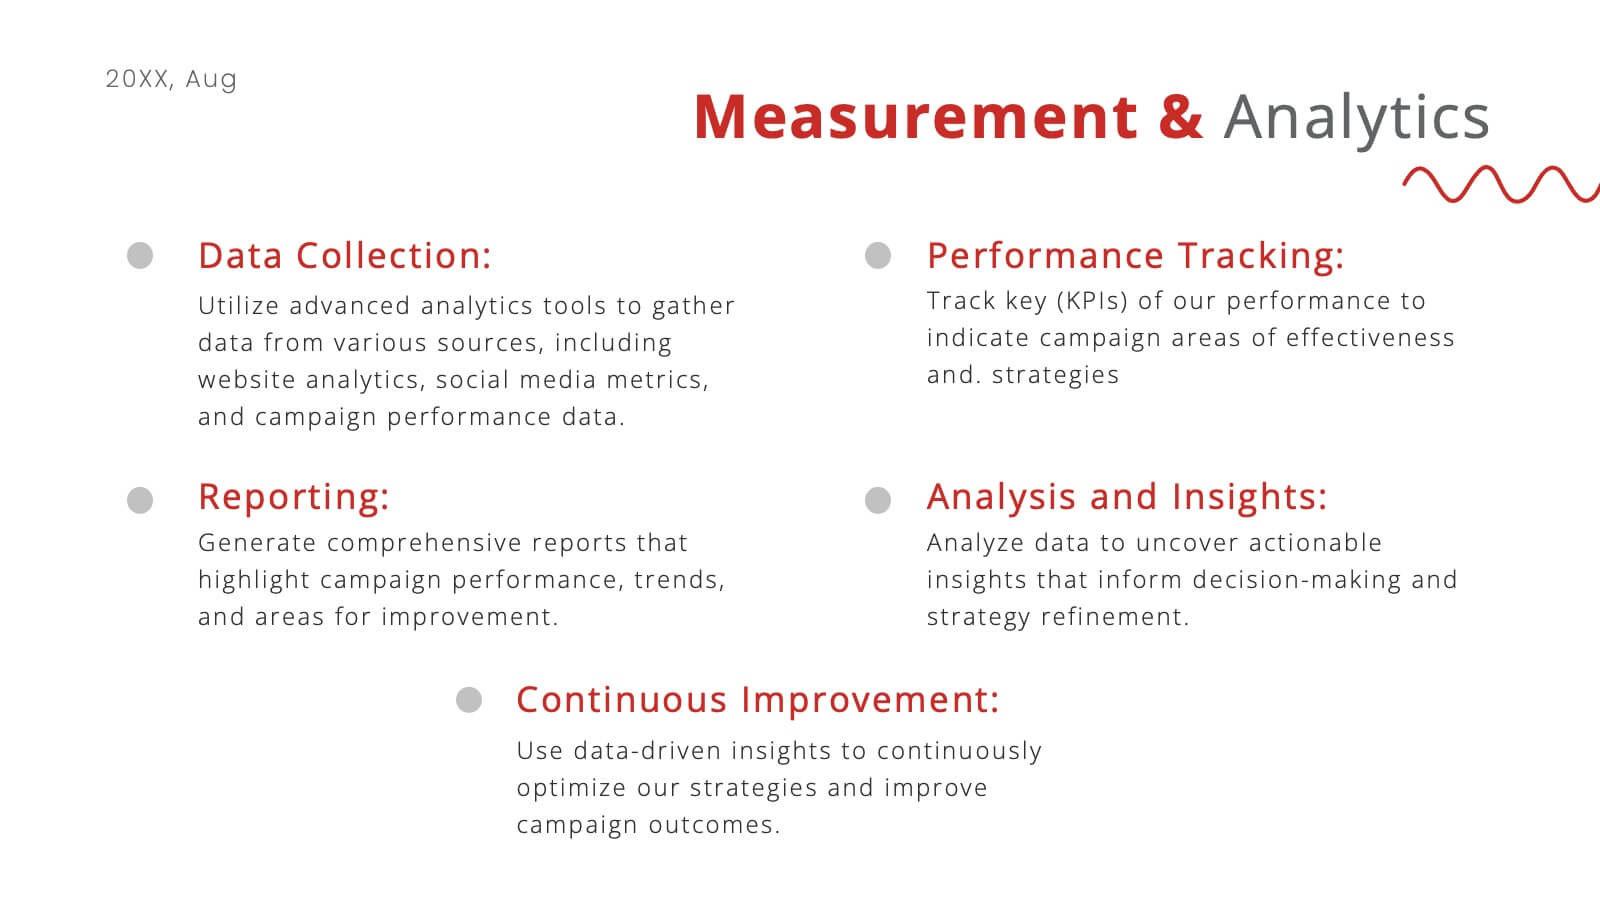
Nickel Advertising Agency Proposal Presentation
Take your advertising agency to the next level with this sleek and modern presentation template! Highlighting your services, team, success stories, and marketing strategies, it’s the perfect tool to showcase your agency’s strengths and capabilities. Fully customizable and compatible with PowerPoint, Keynote, and Google Slides, this template is ideal for impressing potential clients and partners.


6 diapositivas
Domestic Statistics Infographic
Domestic statistics typically refers to numerical data and information related to a specific country's internal affairs, activities, and demographics. This infographics can be an effective way to present important data and trends related to a specific country or region. This template is designed with a balance between design aesthetics and data accuracy. By presenting the information in a visually engaging manner, you can effectively communicate key insights to your target audience. Compatible with Powerpoint, Keynote, and Google Slides. This ensures that your infographic is accessible by providing alternative text for images and using high-contrast colors.


2 diapositivas
Professional Thank You Slide Presentation
End your presentation with a clean, modern slide that leaves a polished final impression. This layout gives you space to share closing notes, contact details, or key reminders in a clear and visually balanced style. Fully editable and compatible with PowerPoint, Keynote, and Google Slides.


6 diapositivas
Overcoming Market Challenges Strategy Presentation
Tackle industry obstacles with clarity using this dynamic teamwork-themed visual. Featuring illustrated characters passing puzzle pieces along a circular process, this design is perfect for illustrating phased strategies, collaborative efforts, or key milestones. Great for strategic planning or team alignment presentations. Fully editable in PowerPoint, Keynote, and Google Slides.


4 diapositivas
3-Tier Hierarchical Pyramid Breakdown
Simplify your strategy presentation with the 3-Tier Hierarchical Pyramid Breakdown Presentation. This clear and modern slide features a three-level pyramid with horizontal progress bars and percentage indicators—perfect for visualizing goals, KPIs, or organizational layers. Each tier includes editable text boxes for quick customization. Works seamlessly in PowerPoint, Keynote, and Google Slides.


8 diapositivas
Competitive Market Strategy Presentation
Stay Ahead in the Market with this Competitive Market Strategy Presentation template. This slide helps you analyze industry competition, market positioning, and strategic advantages with a clean, engaging circular layout. Ideal for business planning, marketing strategy meetings, and competitive analysis, this template allows you to highlight key differentiators and action steps clearly. Fully customizable and available for PowerPoint, Keynote, and Google Slides.


7 diapositivas
Break-Even Model for Revenue Planning Presentation
Simplify financial planning with this break-even model presentation. Designed to visualize the transition from loss to profit, it highlights cost reduction, sales increase, and profit margins. Ideal for strategy sessions, budgeting, or forecasts. Fully editable in PowerPoint, Keynote, and Google Slides for seamless customization across business presentations.


20 diapositivas
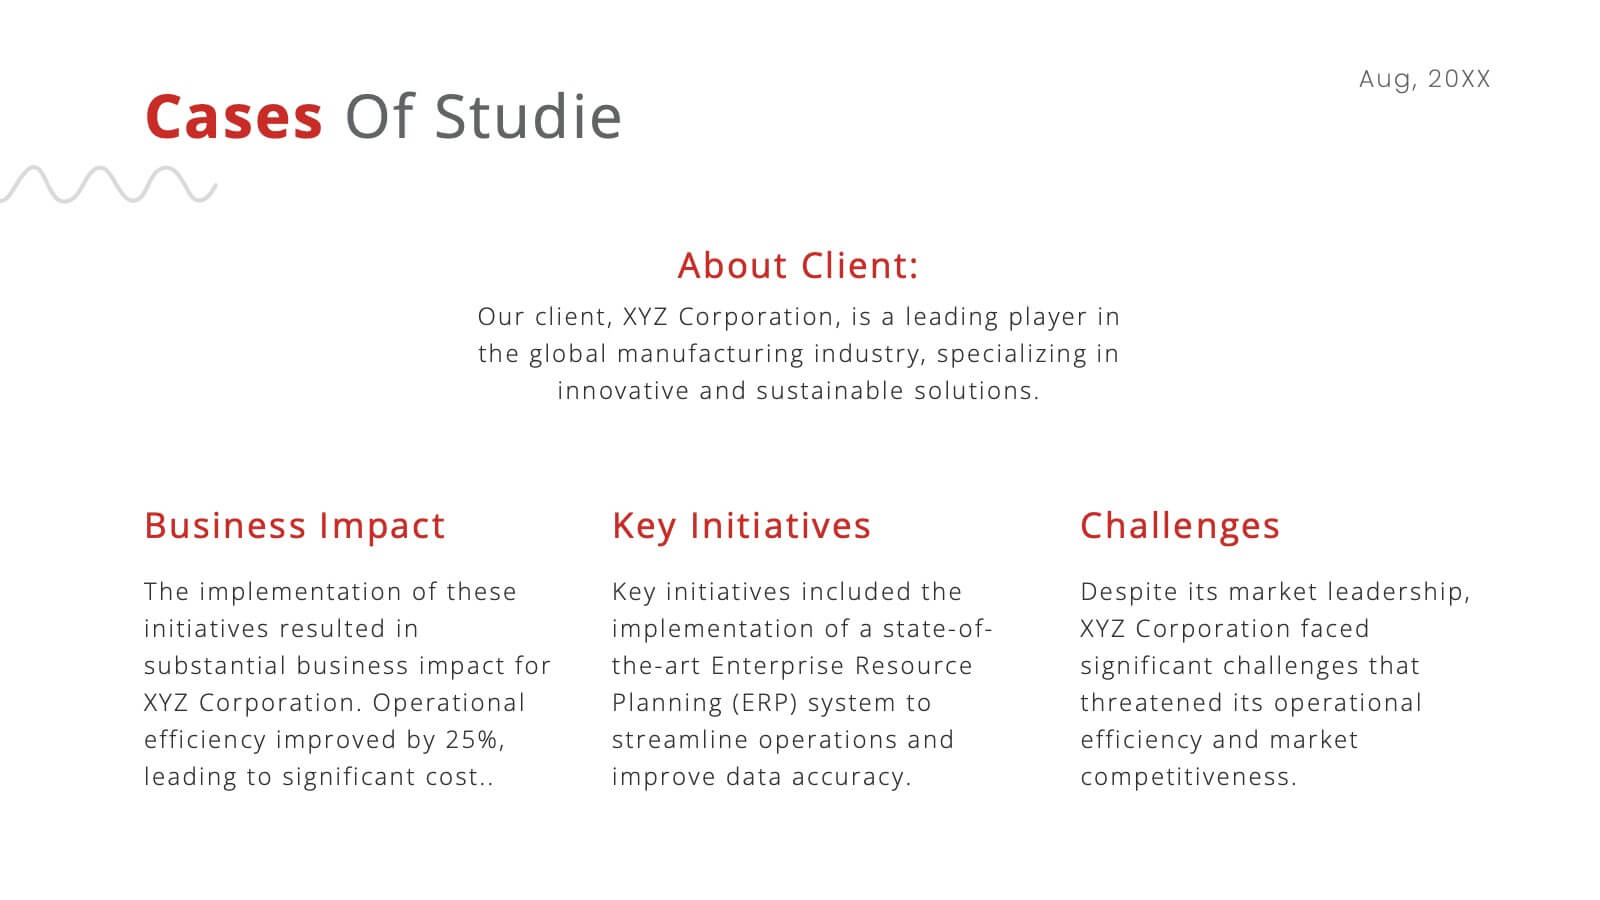
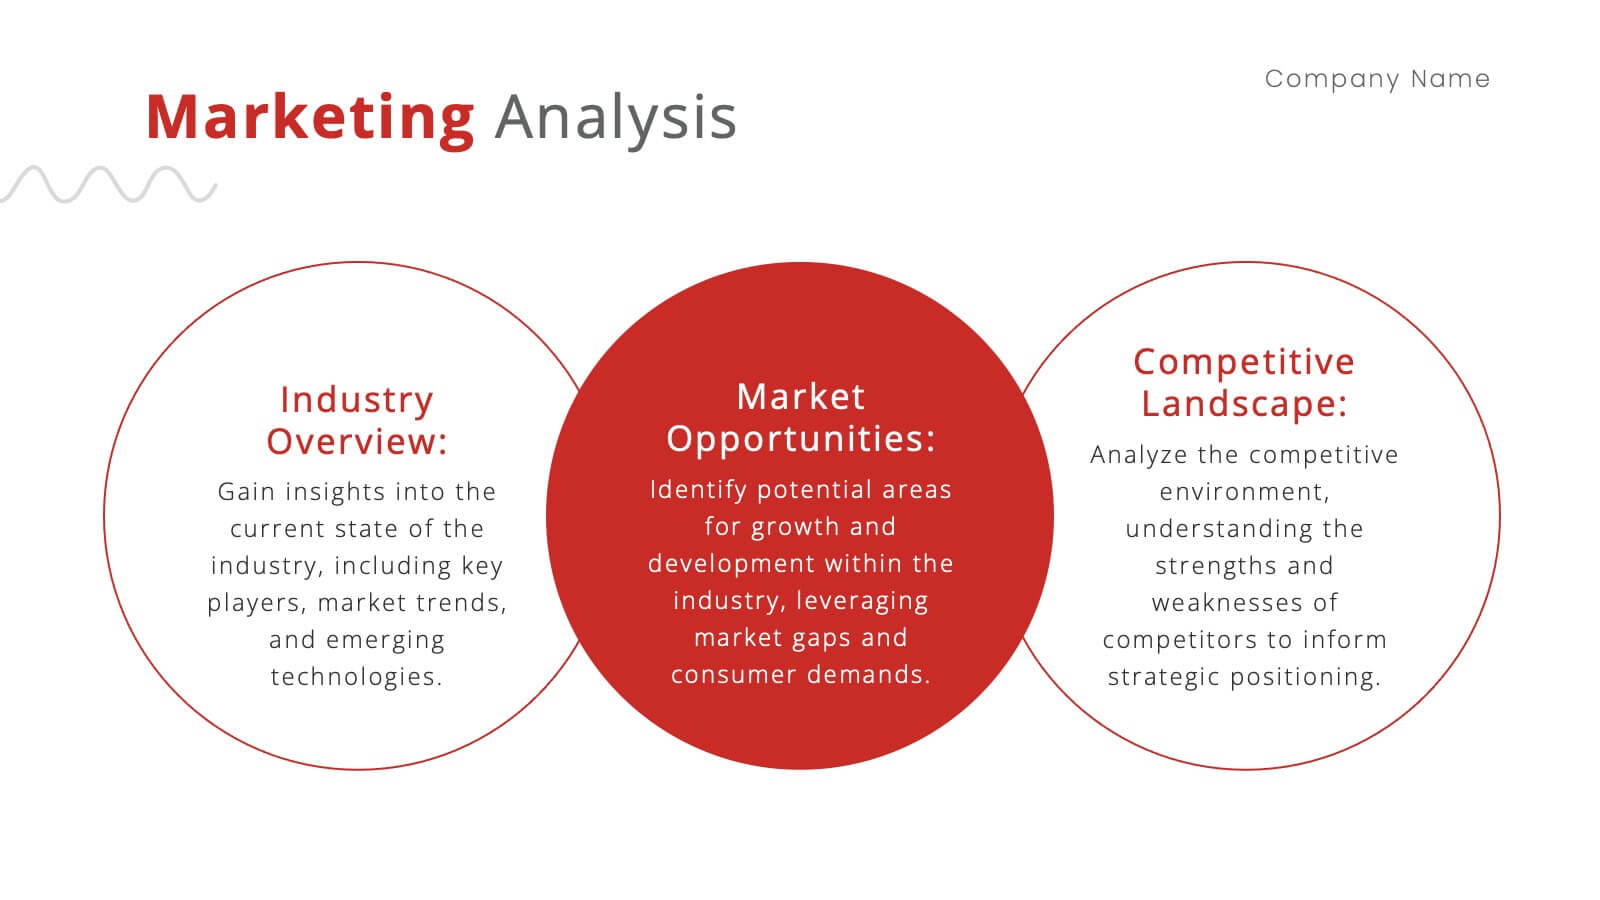
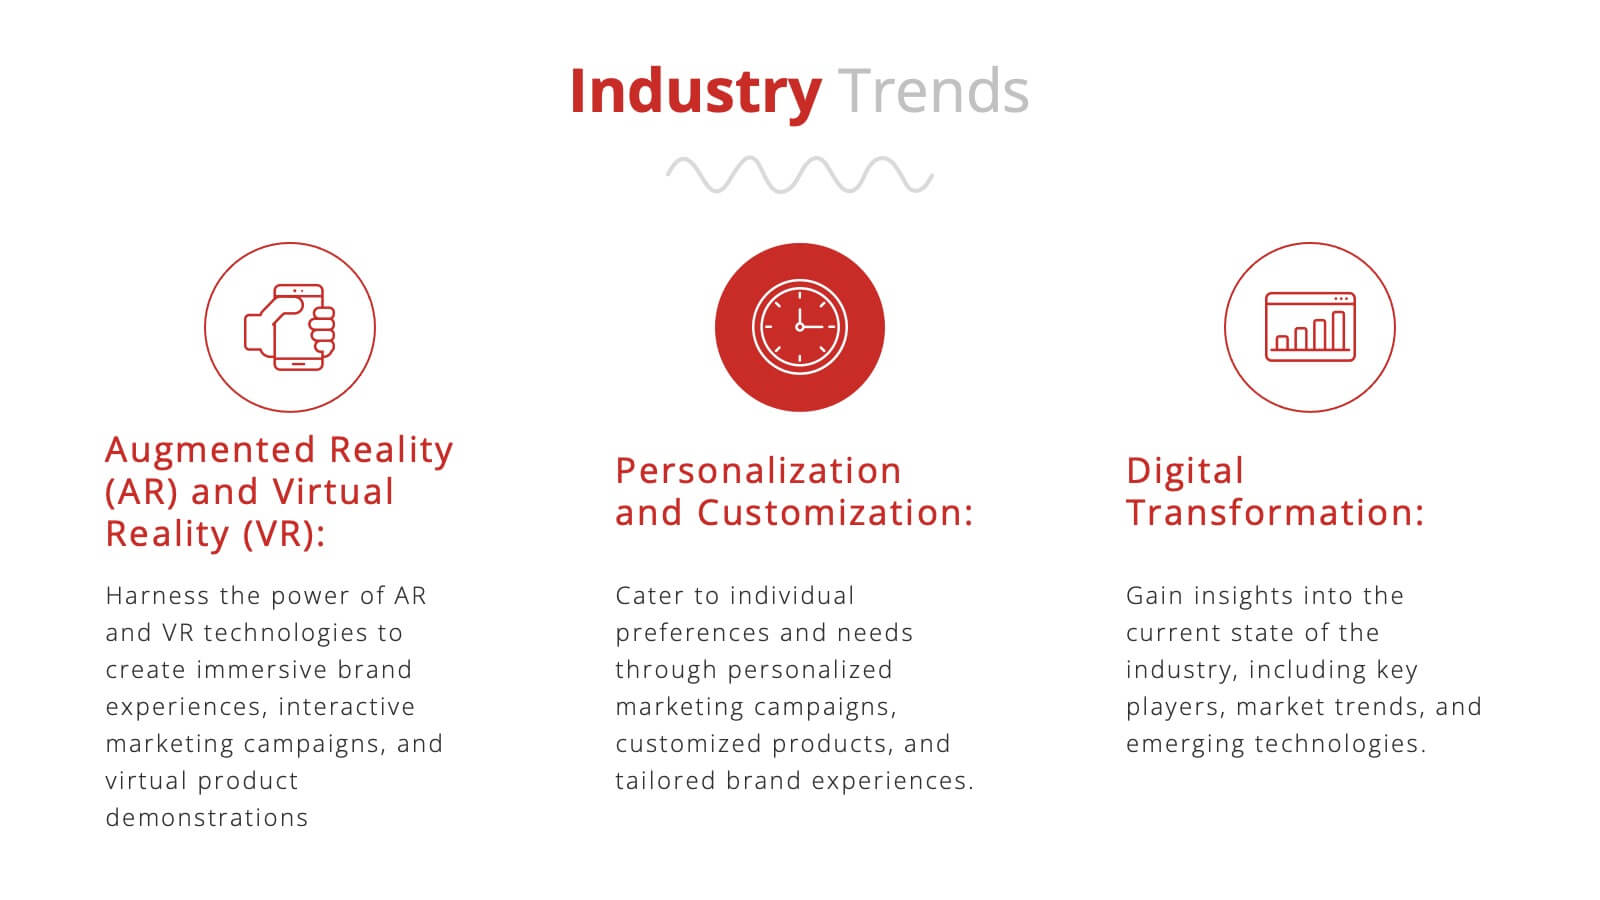
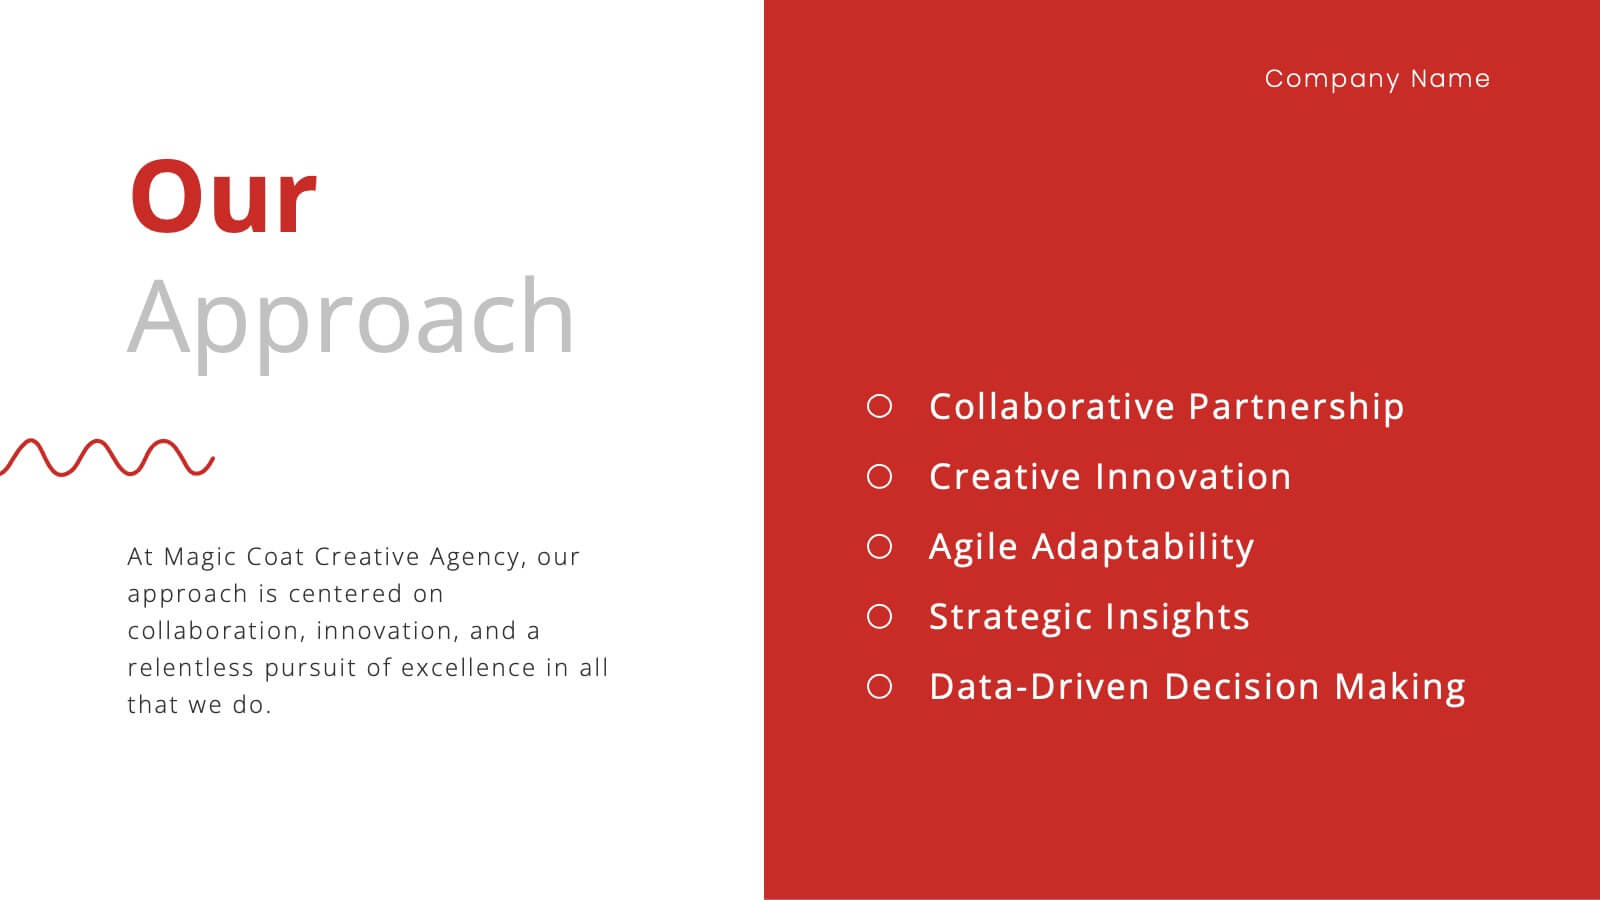
Aether Marketing Research Report Presentation
The Marketing Research Report Presentation Template offers a sleek design with 20 fully customizable slides, ideal for presenting in-depth marketing insights. This template features sections for industry analysis, consumer behavior, emerging technologies, and marketing trends like SEO, social media, and influencer strategies. It also highlights e-commerce trends, personalization, sustainability, and storytelling techniques. The modern black-and-gold gradient aesthetic adds sophistication, making it perfect for professional reports. Compatible with PowerPoint, Keynote, and Google Slides, this template ensures a polished and engaging presentation experience.


6 diapositivas
Business Flow Chart Design Presentation
Bring clarity and momentum to your process with a clean, visual layout that turns complex steps into an easy-to-follow flow. This presentation helps teams map stages, responsibilities, and progress with confidence, making it perfect for planning, strategy, and operations. Fully compatible with PowerPoint, Keynote, and Google Slides.


6 diapositivas
Business Decision Flow Model Presentation
Make smarter choices with this Business Decision Flow Model presentation. Clearly map out key decisions, steps, and potential outcomes using a structured, color-coded flow. Perfect for strategy reviews, team meetings, and executive briefings. Fully editable in Canva, PowerPoint, and Google Slides for seamless customization.


7 diapositivas
Concentric Circle Diagrams Infographic Presentation Template
Concentric Circle Diagrams can display interrelated and independent units of a concept in overlapping circular designs. The diagram is really helpful for organizing information, displaying relationships among concepts, showing whole-part relationships and more. It uses overlapping circular designs to display ideas and separate them with their own size, color and position on a chart. This template contains a variety of circular diagram that display in overlapping different-shaded circles. This template can be used to demonstrate the relationship of all elements to the central idea.


5 diapositivas
Effective Decision-Making with RAPID
Streamline training and clarify roles with this directional RAPID decision-making template. Designed around the Recommend, Agree, Perform, Input, and Decide framework, this visual uses signpost-style arrows to guide teams through each responsibility in a clear, intuitive layout. Ideal for workshops, onboarding, or leadership development sessions. Fully editable in PowerPoint, Keynote, and Google Slides.