


Características


¿Tienes alguna pregunta?
Recomendar


5 diapositivas
Teaching Strategy for Classrooms Presentation
Make classroom planning more engaging with the Teaching Strategy for Classrooms Presentation. This stacked book-style layout is ideal for outlining instructional steps, lesson phases, or teaching priorities. Perfect for teachers, education trainers, or curriculum planners. Fully editable in PowerPoint, Keynote, Canva, and Google Slides.


5 diapositivas
Editable Concentric Circle Layout Presentation
Give your message a bold, modern spin with a sleek layered design that draws the eye straight to your core idea. This presentation is perfect for breaking down processes, stages, or insights using clean, concentric structure that feels intuitive and polished. Fully compatible with PowerPoint, Keynote, and Google Slides.


5 diapositivas
Construction Project Plan Presentation
Build your next presentation with structure and impact using this modern and organized design. Perfect for outlining construction timelines, milestones, or project phases, it helps visualize every step from planning to completion. Fully editable and compatible with PowerPoint, Keynote, and Google Slides for effortless customization and professional results.


10 diapositivas
AIDA Model Explained with Graphics Presentation
Bring your message to life with a dynamic visual flow that guides viewers through each stage of your communication strategy in a clear, compelling way. This presentation breaks complex concepts into simple steps, helping audiences follow your narrative effortlessly. Fully customizable and compatible with PowerPoint, Keynote, and Google Slides.


20 diapositivas
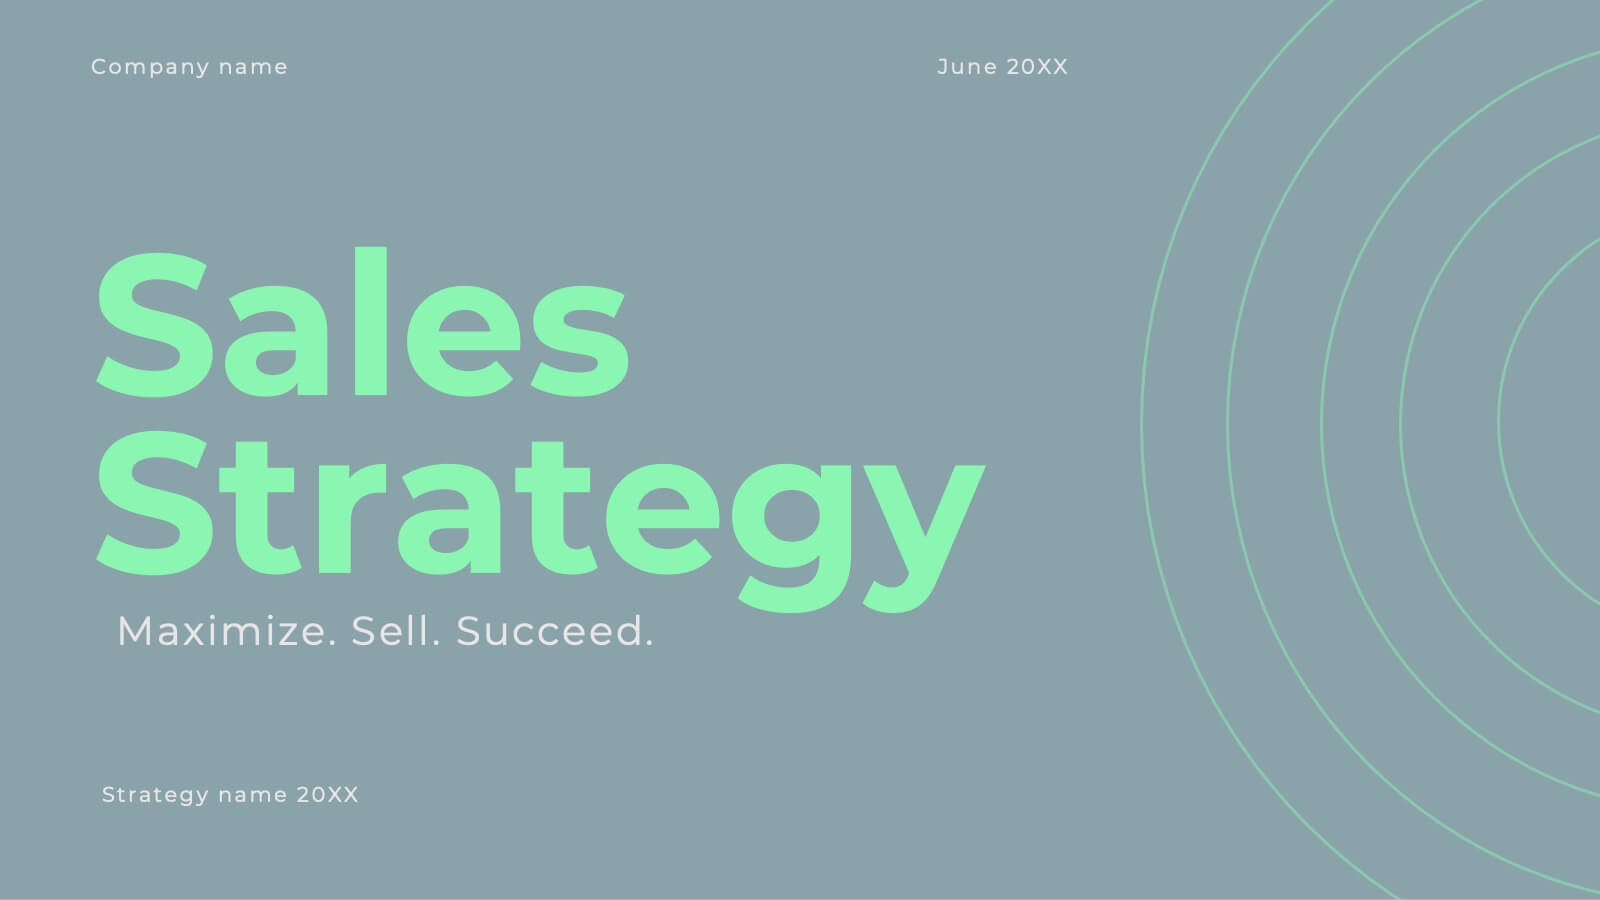
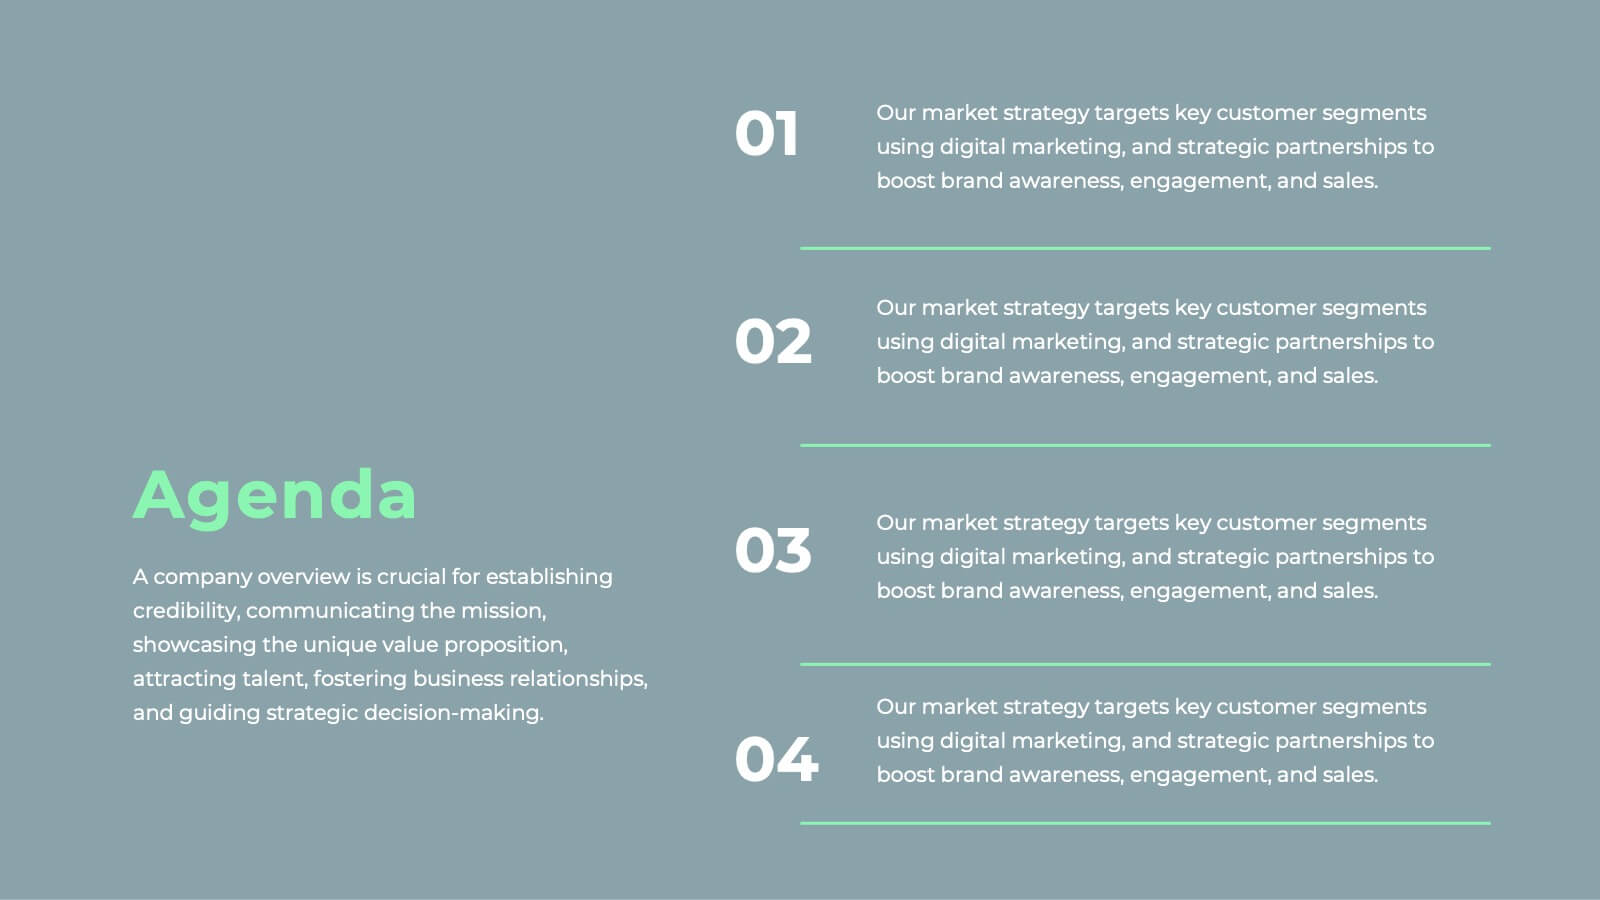
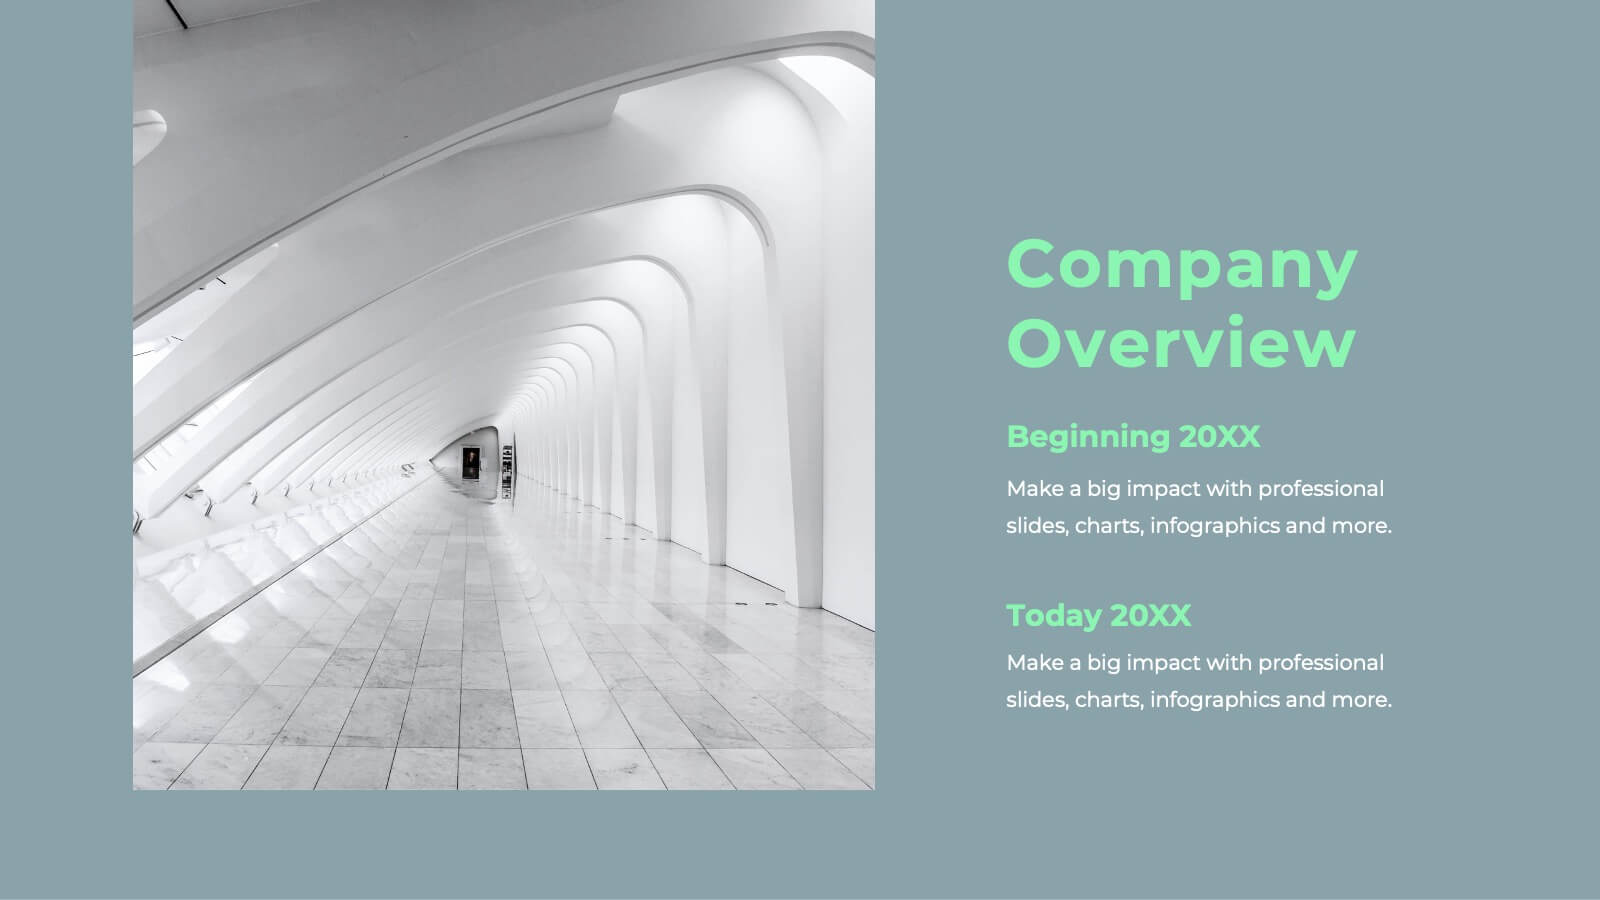
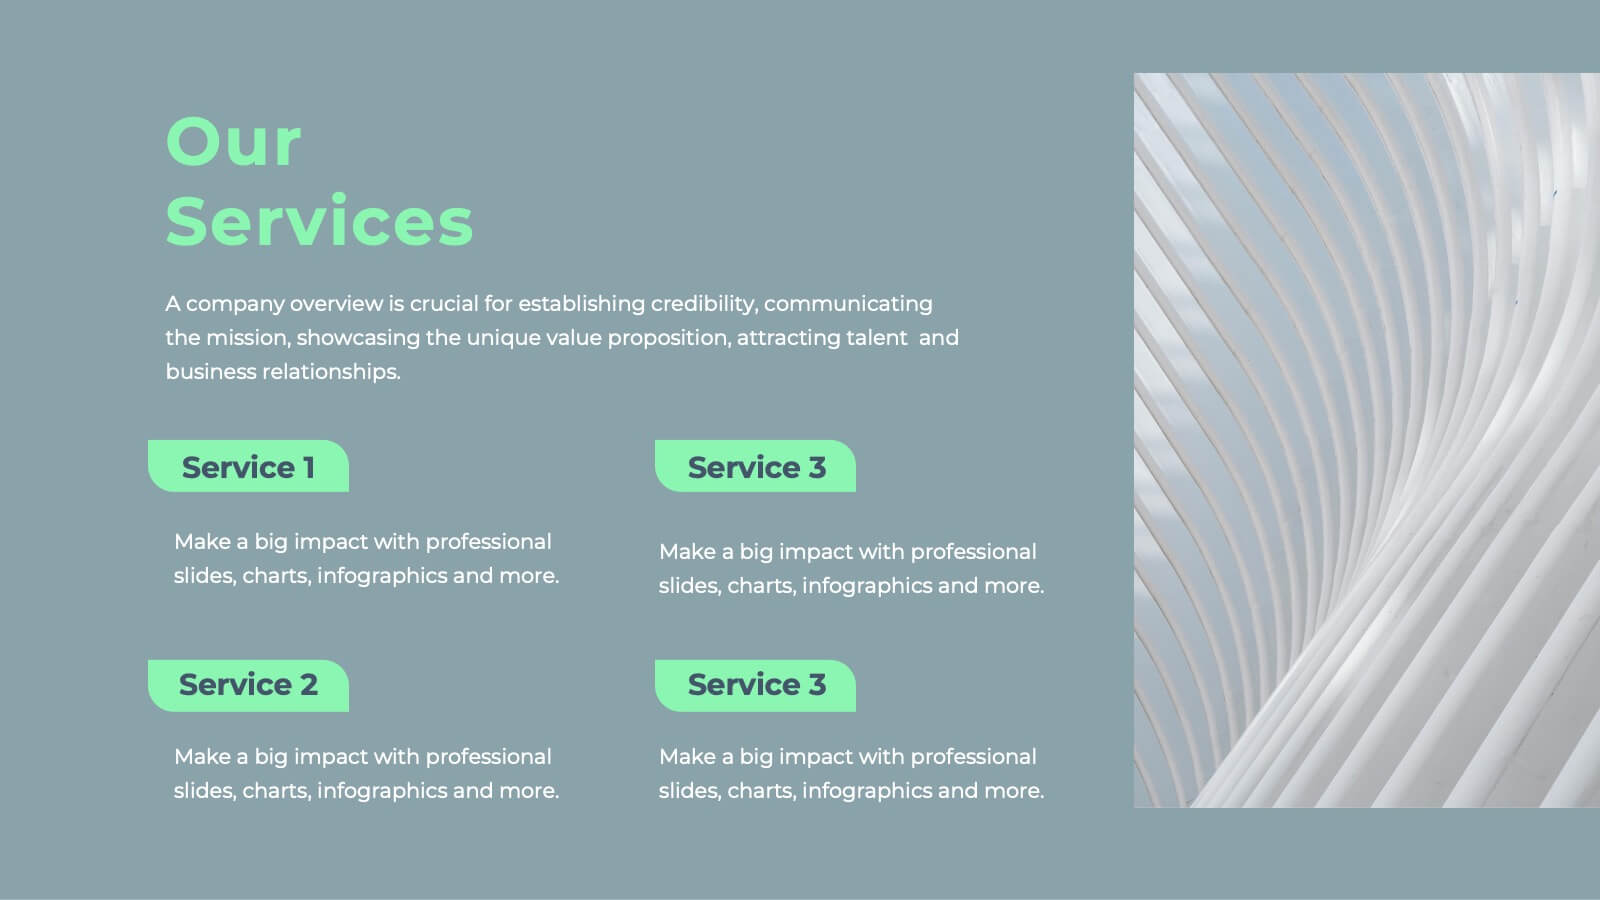
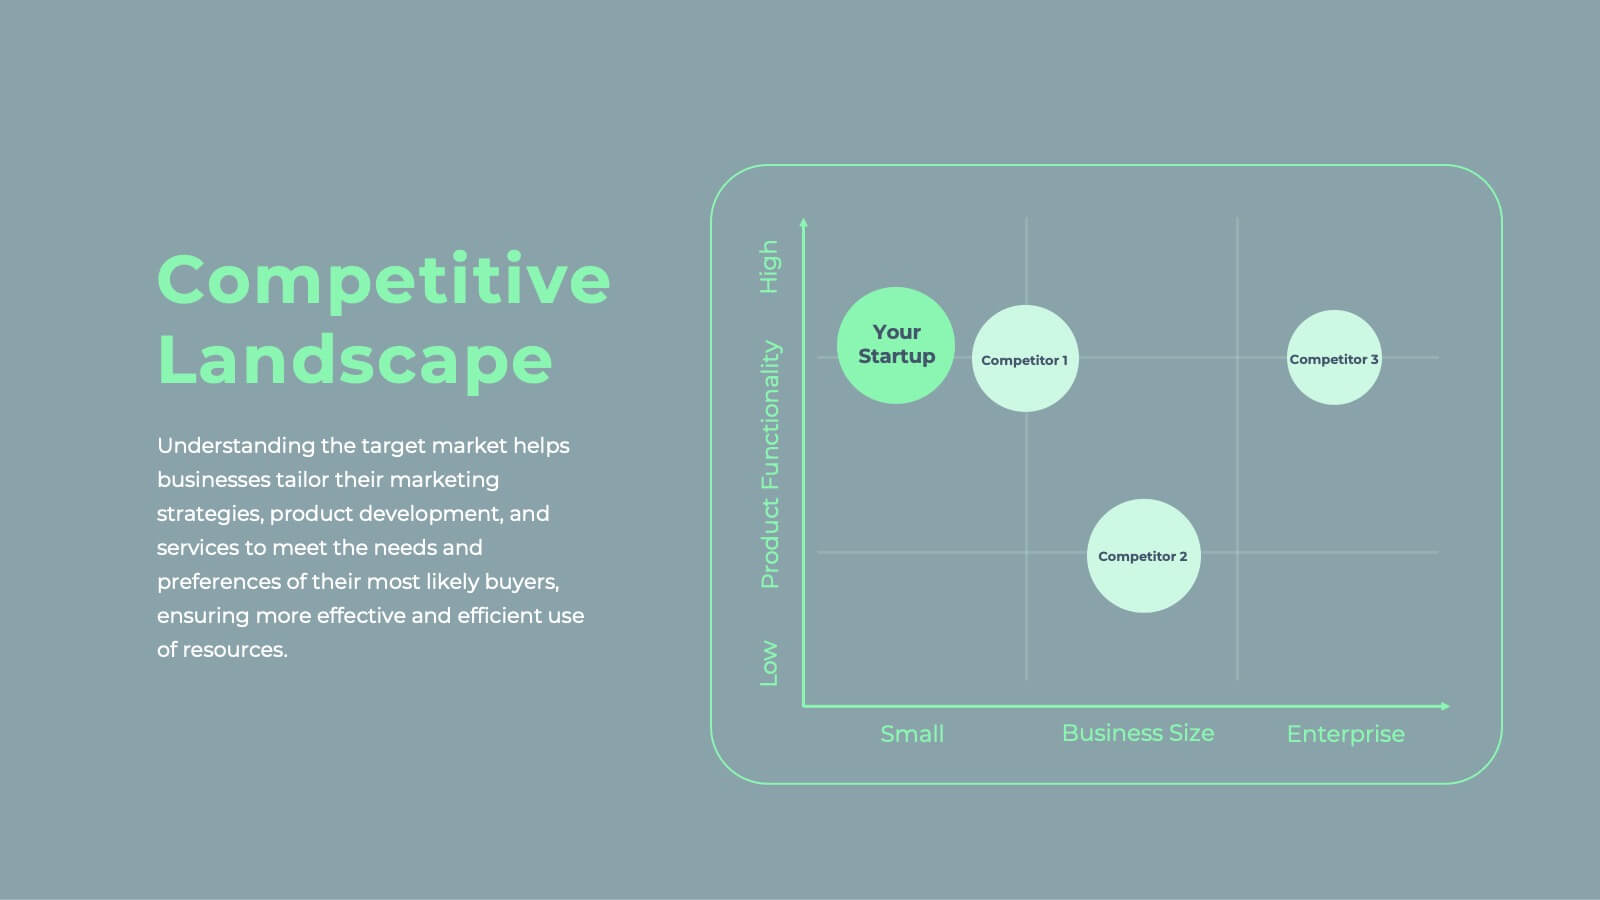
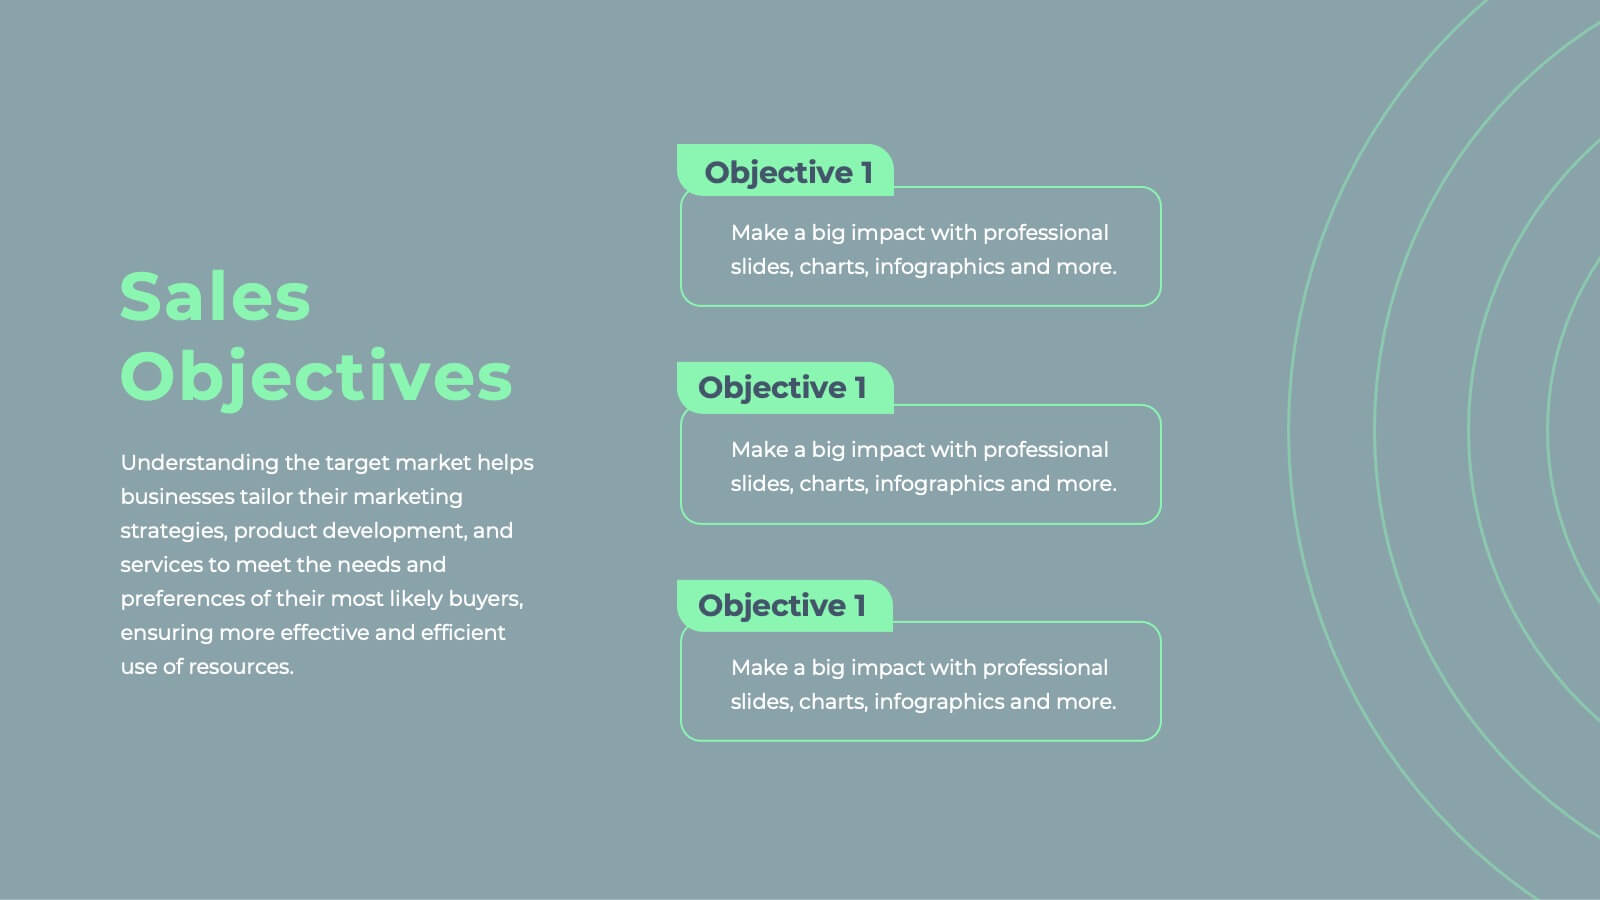
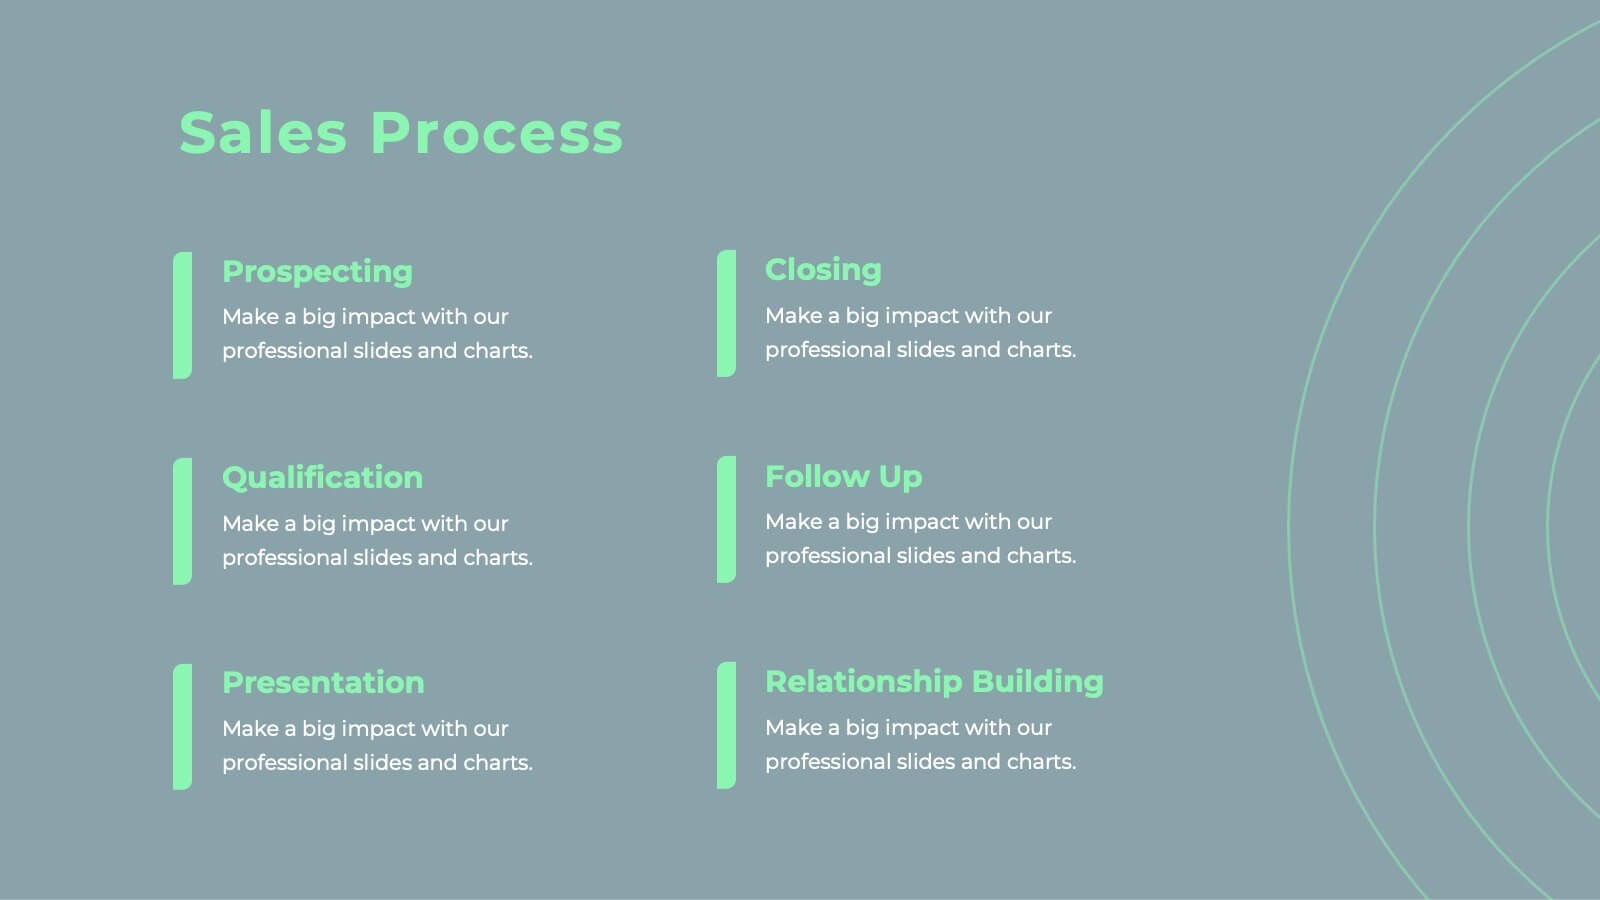
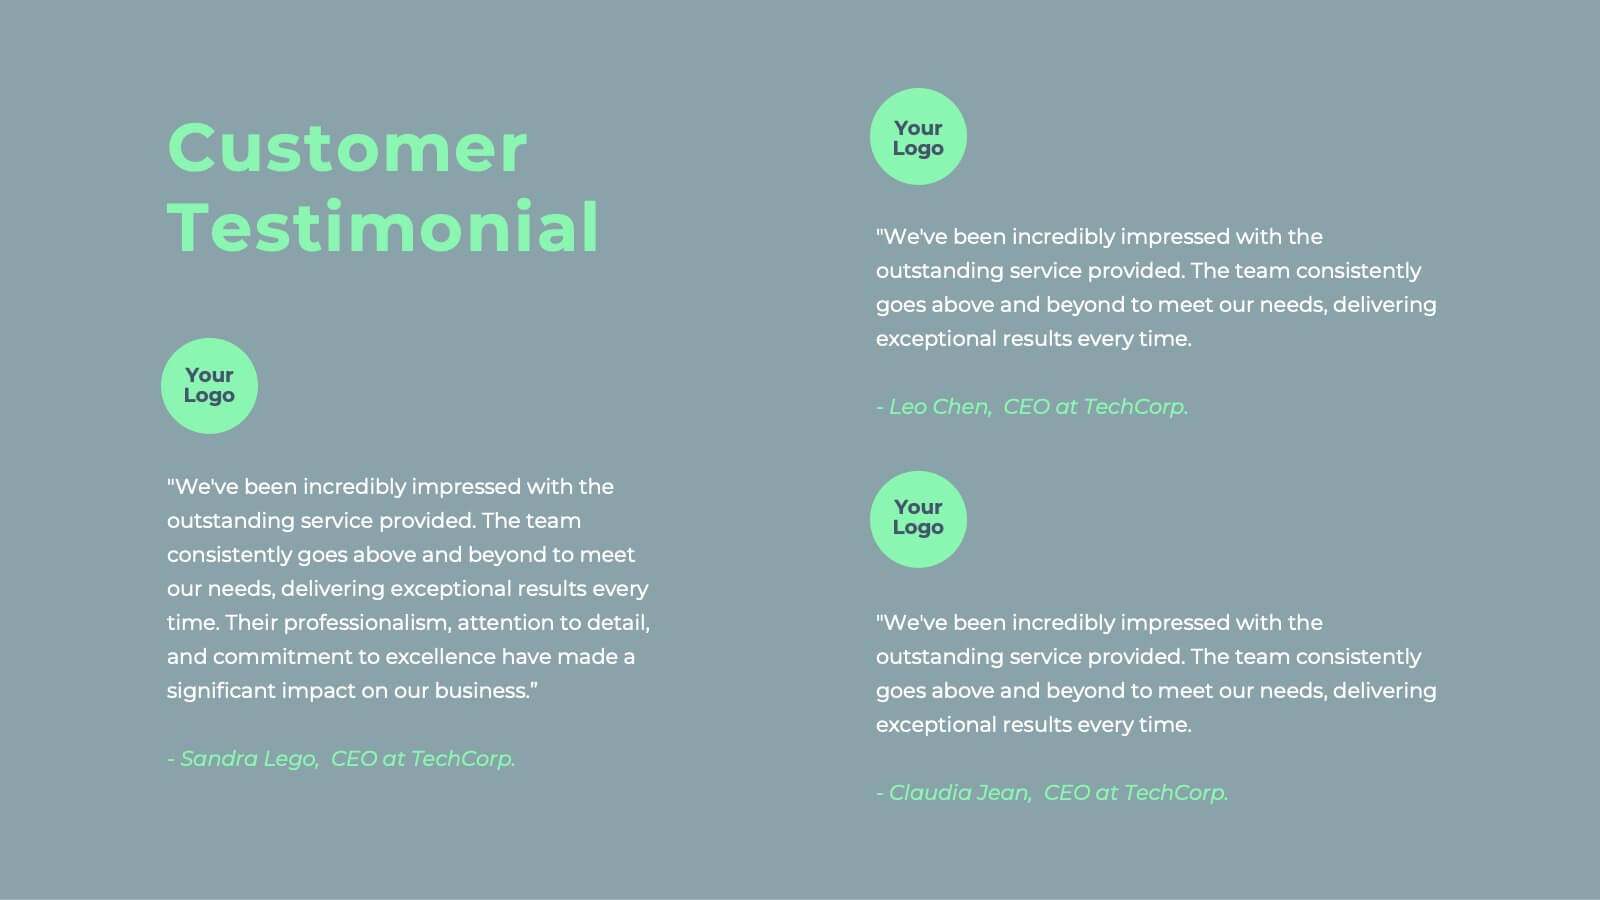
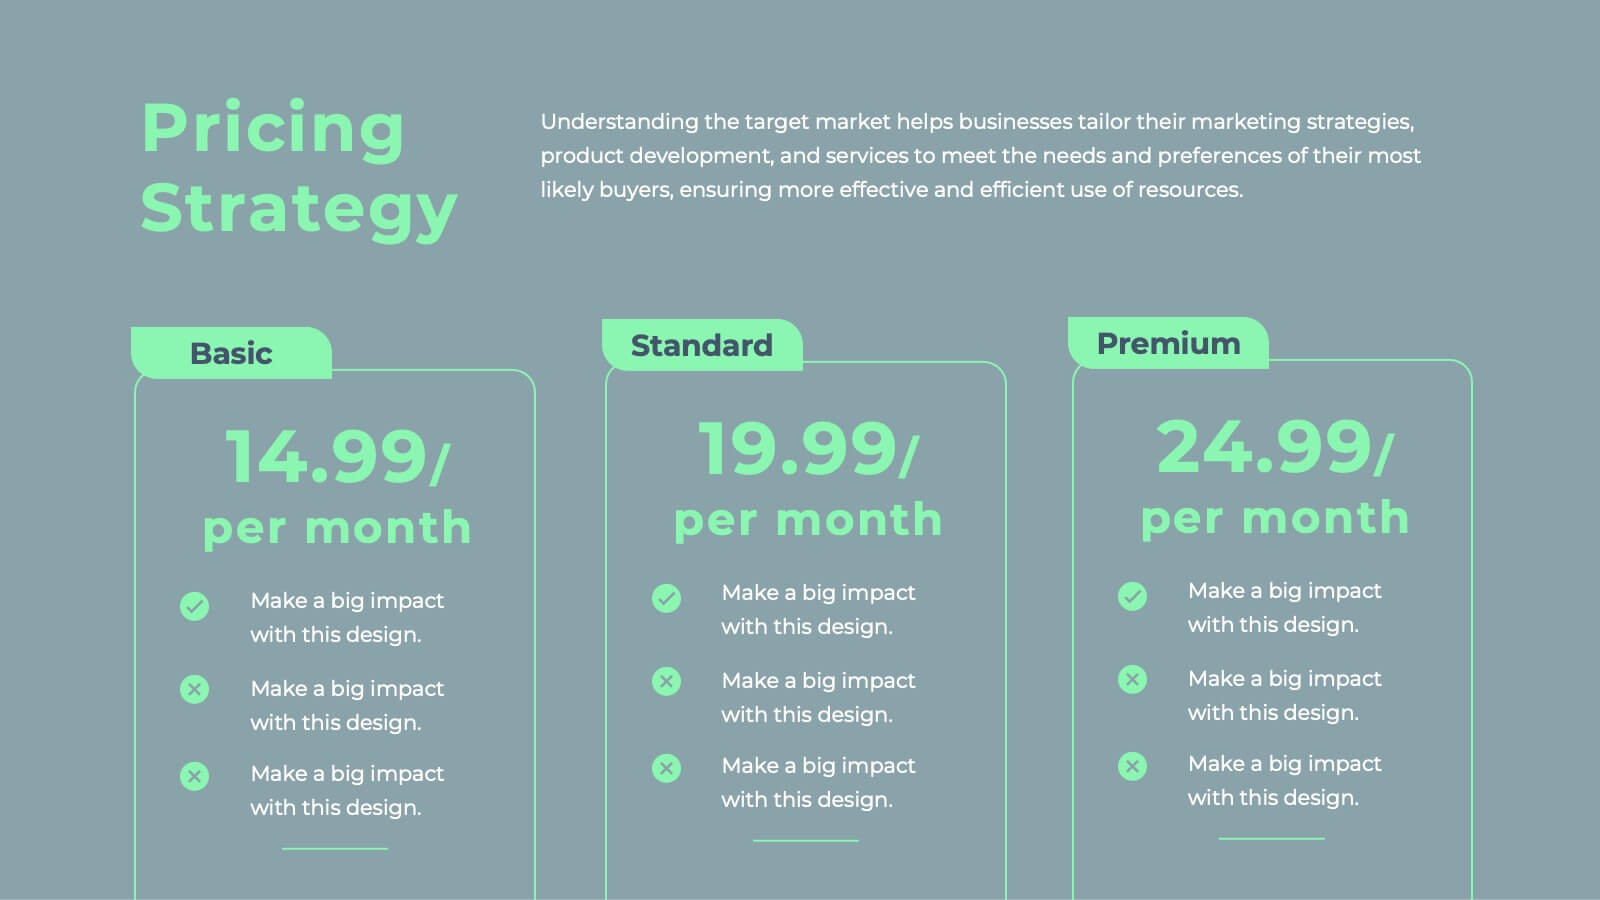
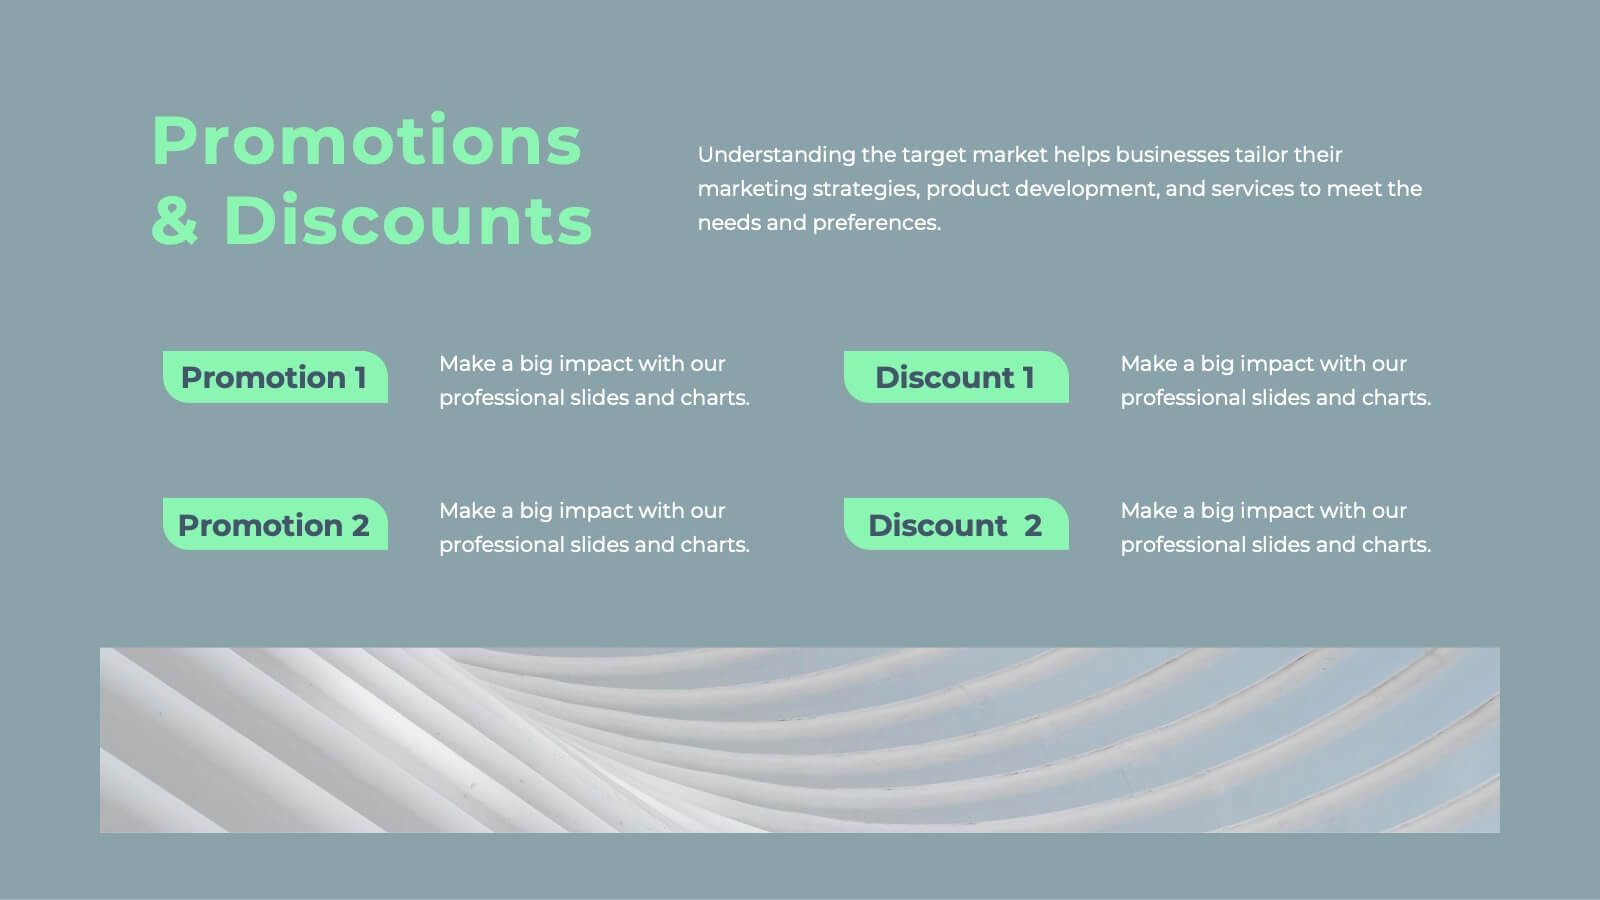
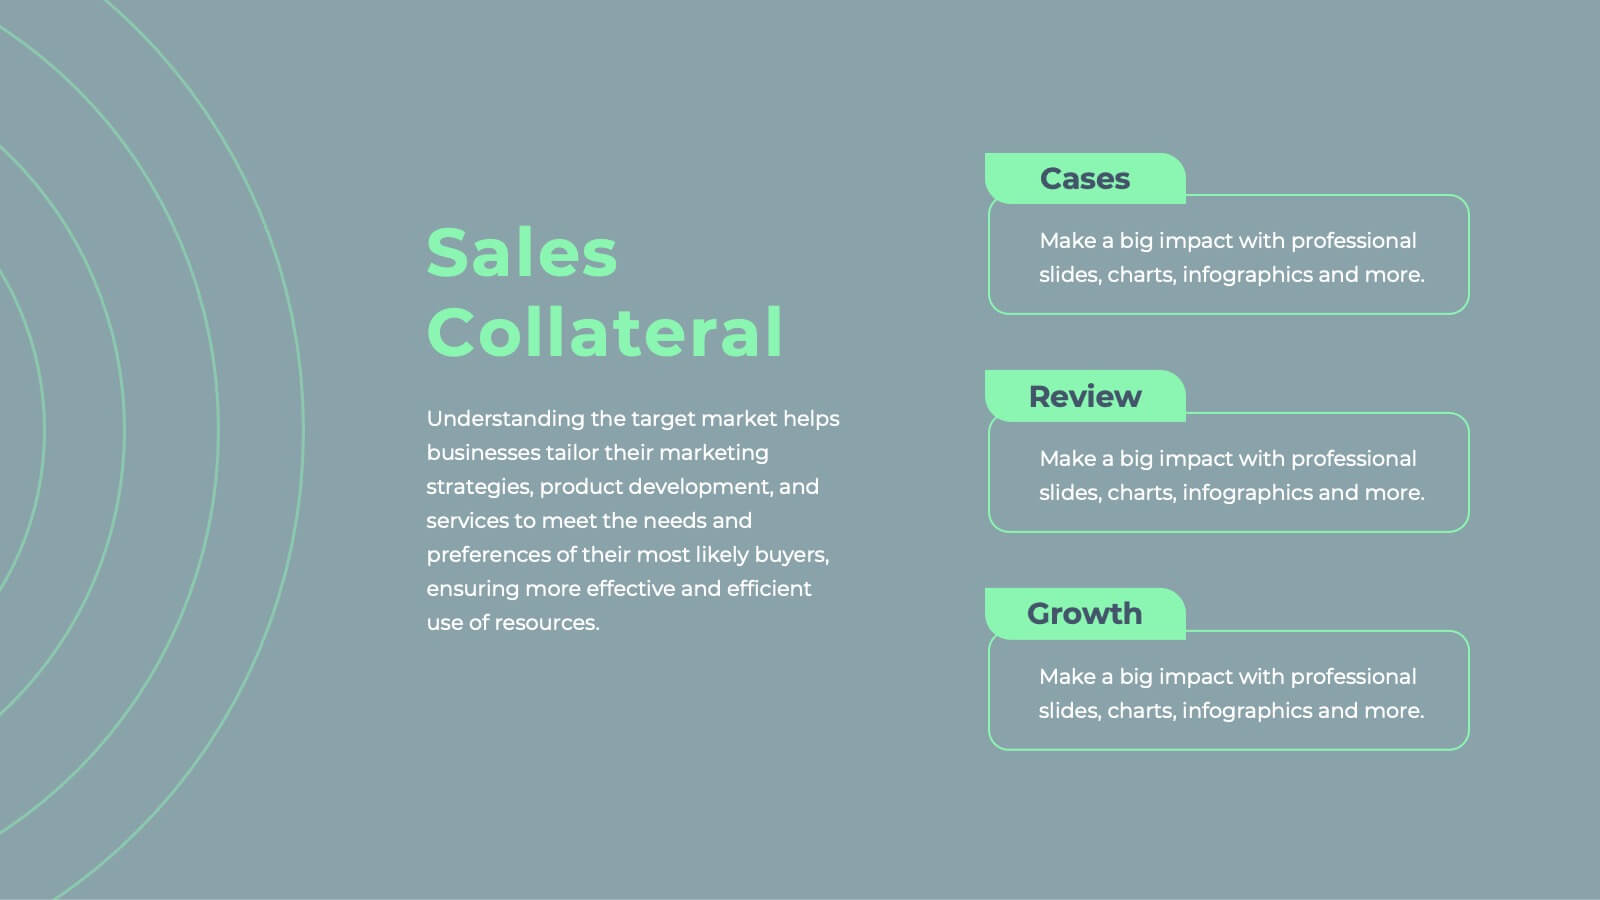
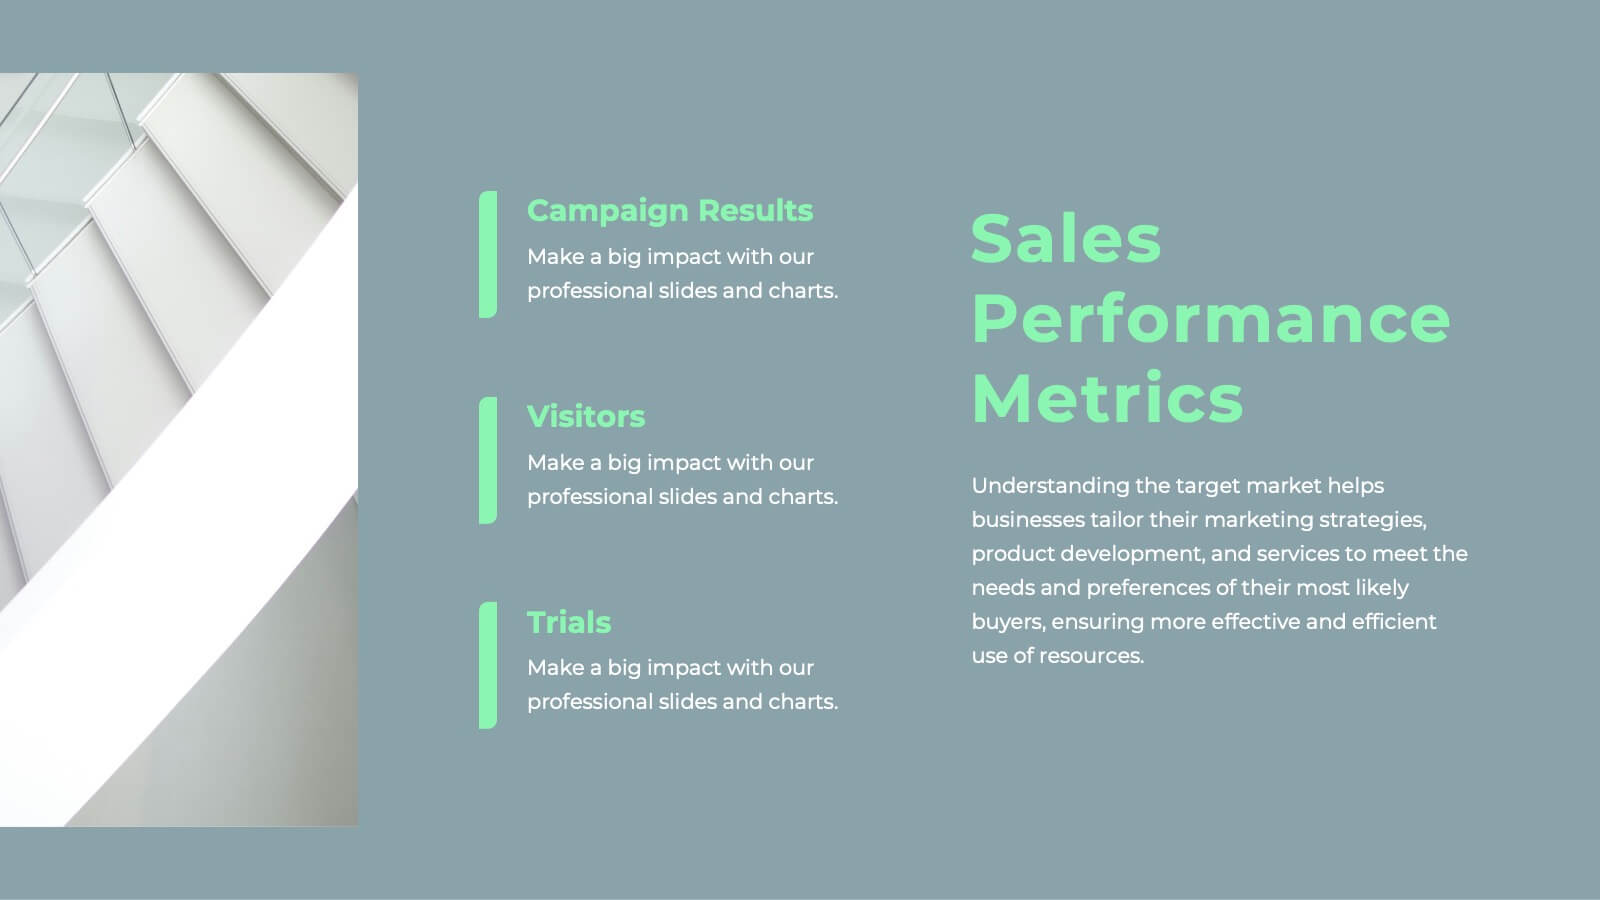
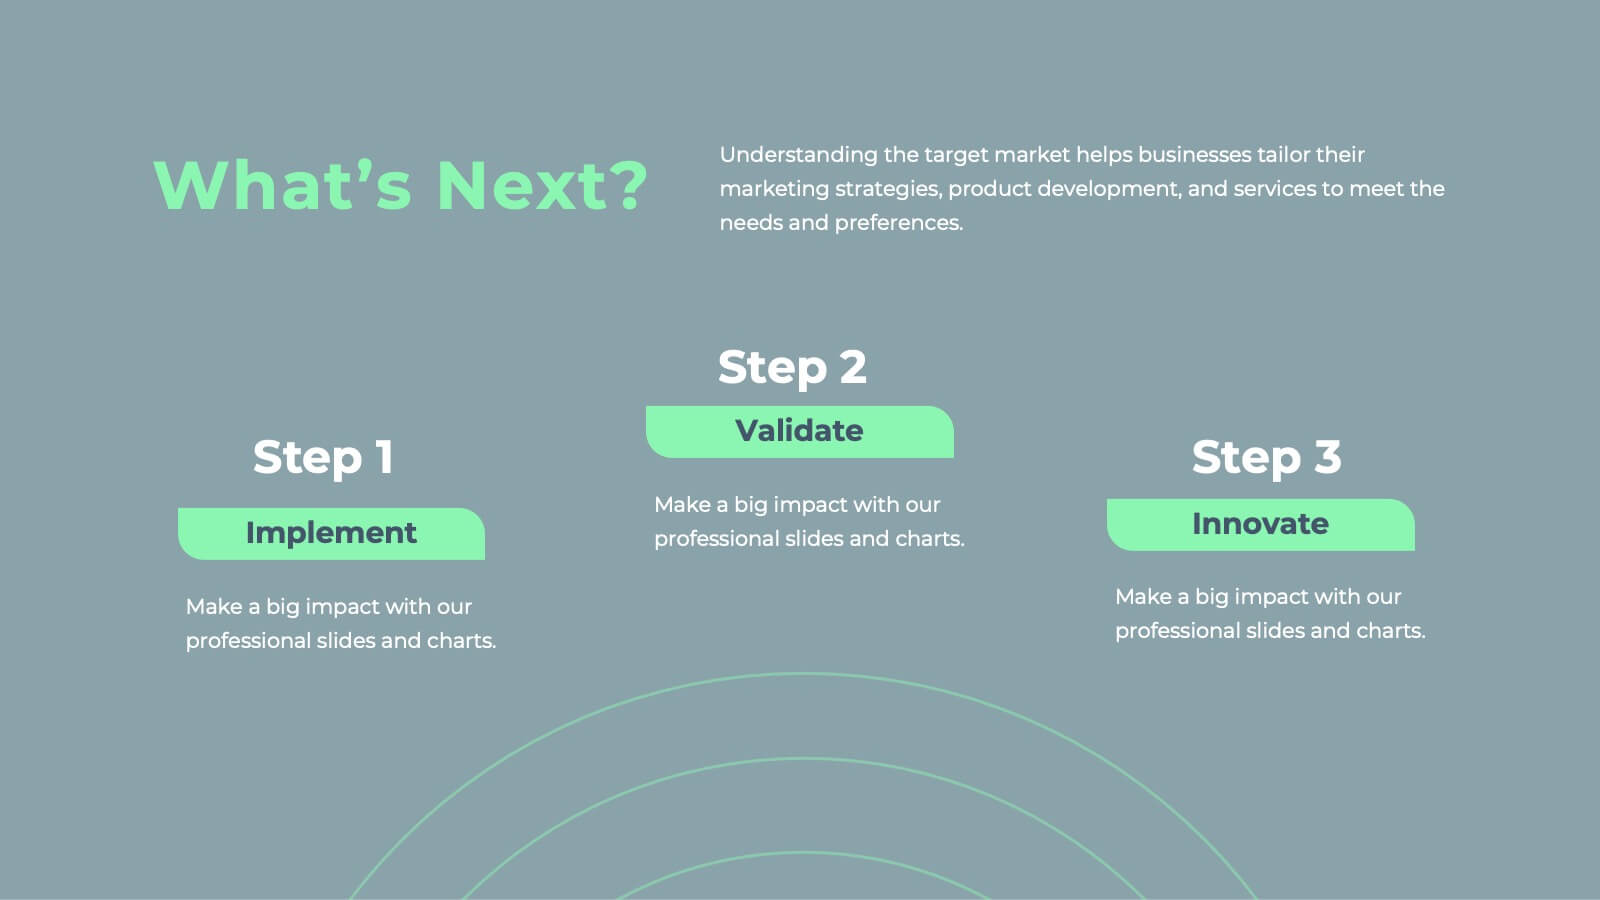
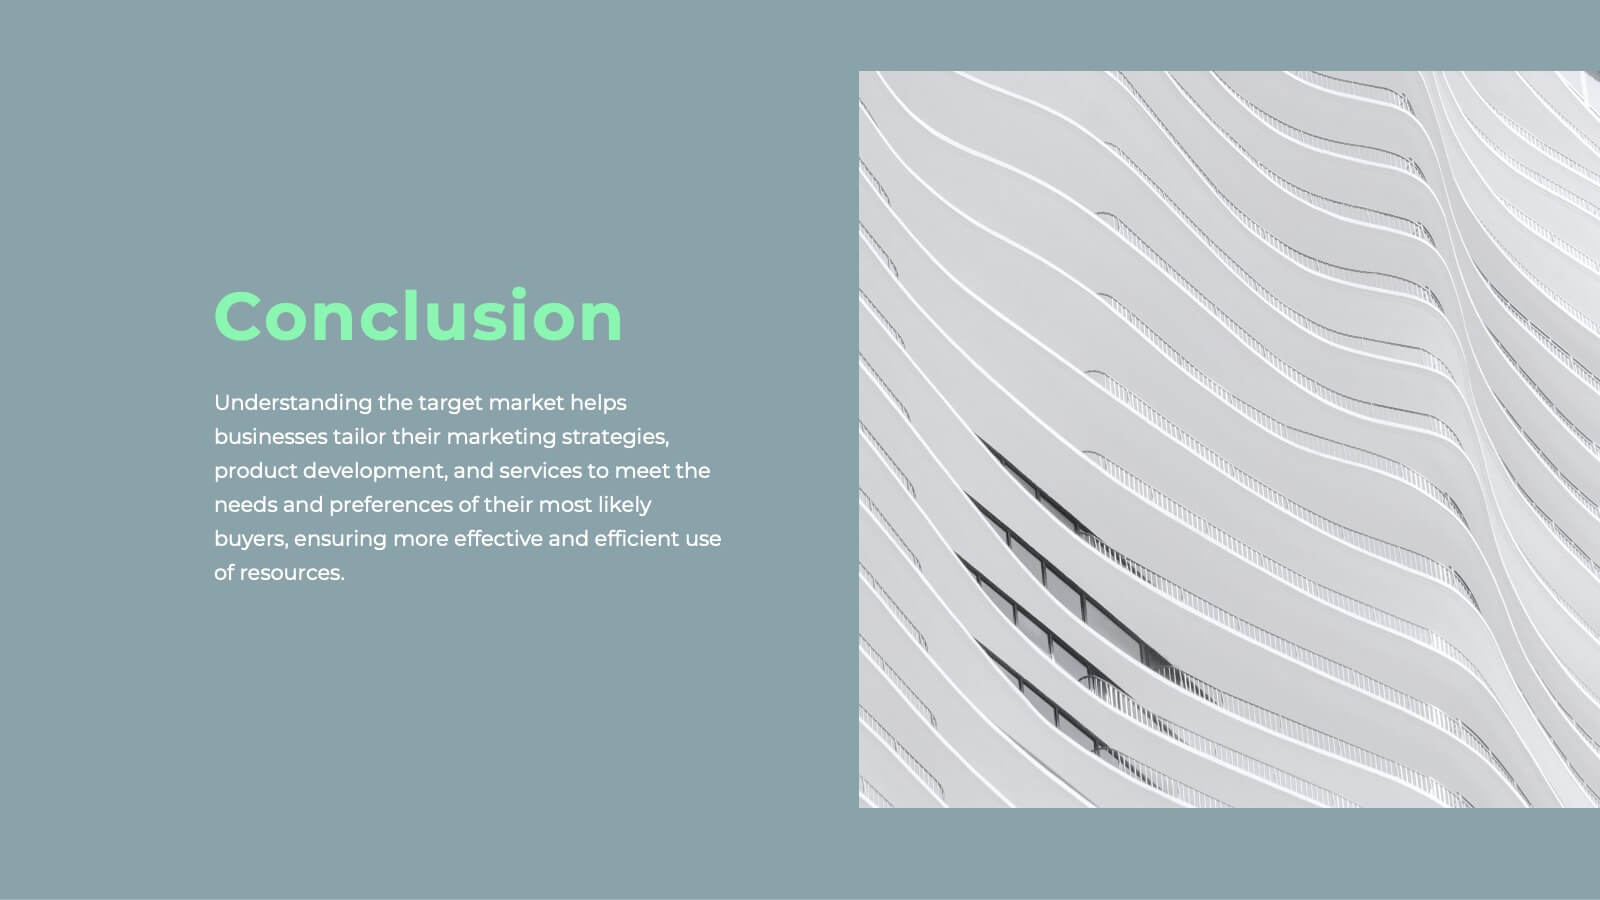
Javelin Sales Strategy Presentation
Boost your sales strategy with this sleek template! Perfect for outlining objectives, processes, performance metrics, and future opportunities. Tailored for impactful presentations to clients and teams. Fully customizable and compatible with PowerPoint, Keynote, and Google Slides.


6 diapositivas
Social Media Advertising Infographic
Boost your online presence with our Social Media Advertising Infographic, compatible with PowerPoint, Google Slides, and Keynote. This dynamic template is crafted for marketers and businesses to showcase their social media strategies and ad campaigns. It includes diverse slide layouts to detail different aspects such as audience targeting, platform choice, content planning, and budget allocation. Each slide provides a clear structure to display comparative analyses, timelines, and the impact of your social media efforts. It's an ideal tool for presenting to teams, clients, or during workshops to explain the intricacies of social media marketing effectively.


6 diapositivas
AI-Driven Innovation in Business Presentation
Bring your ideas to life with a burst of tech brilliance—this bold, modern layout captures the synergy between artificial intelligence and business innovation. Use it to explore automation, data-driven insights, and future-focused strategies. Fully editable and compatible with PowerPoint, Keynote, and Google Slides for seamless presentation design.


21 diapositivas
Dreameon Agency Portfolio Presentation
Showcase your agency's expertise with this sleek and modern portfolio presentation template. Designed to highlight your achievements, creative processes, and client success stories, this template offers a comprehensive layout that communicates professionalism and innovation. From introducing your team and services to detailing case studies and market analysis, each slide is meticulously crafted to leave a lasting impression. Display your strategy development, social media impact, and measurement analytics effectively, ensuring a cohesive narrative that resonates with your audience. Easily customizable and compatible with PowerPoint, Google Slides, and Keynote, this template is perfect for agencies looking to pitch their capabilities, attract new clients, or present project achievements with confidence.


20 diapositivas
Silverleaf Graphic Design Project Plan Presentation
This Graphic Design Project Plan Presentation Template offers a vibrant and modern design to showcase your creative process, key elements, and strategic goals. It includes sections for design brief, target audience, moodboard, prototypes, and implementation. Ideal for agencies and designers, fully customizable in PowerPoint, Keynote, and Google Slides.


6 diapositivas
Project Planning and Task Allocation Presentation
Streamline your project timelines with the Project Planning and Task Allocation Presentation. This template uses a clear horizontal flow to map out six key tasks or stages, making it ideal for visualizing schedules, assigning responsibilities, or showcasing milestones. Fully editable in PowerPoint, Google Slides, Keynote, and Canva.


26 diapositivas
Dax Presentation Template
Dax is a professional and clean template that was created to make your presentations stand out. It has a vibrant color scheme and engaging graphics that are easy to edit. The clean look has plenty of room for you to display your content, and this high-quality design will make an impression in your meeting or presentation for your targeted audience. It also allows you to present your content in a way that is professional and engaging. Its vibrant style also makes it stand out from other presentations. This template is suitable for all types of businesses. Don't think twice this one if for you!
22 diapositivas
Beacon Product Development Plan Presentation
Develop your product strategy with this dynamic template! Perfect for highlighting company overview, product features, and market analysis. Showcase your target market, unique selling proposition, and competitive analysis with ease. Ideal for product demonstrations and sales strategy discussions. Compatible with PowerPoint, Keynote, and Google Slides. Impress your audience and elevate your product development presentations!


5 diapositivas
Wedding Ceremony Program Infographics
Wedding Ceremony infographics are visual representations that provide essential information and details about a wedding ceremony. These vertical infographics feature eye catching designs that will help you present a unique and memorable wedding ceremony program. This template is perfect for couples, wedding planners, or event organizers looking to present the order of events and important details in a visually engaging way. These infographics are designed using elegant and romantic elements, such as delicate illustrations, floral motifs, and soft color palettes, creating a charming and visually cohesive look.


4 diapositivas
Project Responsibility Assignment Matrix Presentation
Visualize team roles and task accountability at a glance with this Project Responsibility Assignment Matrix. This structured layout categorizes assignments using the RACI model—Responsible, Accountable, Consulted, and Informed—organized by team and position. Ideal for project managers, team leads, and operations planners, it helps ensure clarity, reduce overlap, and promote accountability across departments. Easily editable in PowerPoint, Keynote, and Google Slides for seamless customization and cross-platform use.


5 diapositivas
Food Industry Trends Presentation
Stay ahead of the curve with this visual presentation designed to spotlight key developments in the food industry. Featuring a creative pie chart integrated with food icons and utensils, this layout is perfect for data storytelling, market insights, or trend analysis. Fully editable in PowerPoint, Keynote, and Google Slides.


7 diapositivas
Africa Population Infographic Presentation
An Africa Map infographic is a visual representation of the African continent, highlight its geography, population, culture, history, and other relevant information. This template provides a quick and easy way to understand complex information about the continent and make data more accessible and engaging to your audience. Use this template to include information about Africa's major cities, landmarks, natural resources, and cultural traditions. This template can be easily customized and modified to suit your specific needs, edit and highlight specific countries, regions, or data points.


7 diapositivas
Oceania Population Infographic Presentation
An Oceania map infographic is a visual representation of the Oceania region, which includes Australia, New Zealand, and the many small islands and archipelagos in the Pacific Ocean. This informative template highlights the geography, population, culture, history, and other relevant information about the region. This Oceania map infographic can be designed in a variety of styles and formats, including a political map, topographic map, population density map, and climate map. This template is compatible with Powerpoint, Keynote and Google Slides making it very easy to edit and include your data.