


Características


¿Tienes alguna pregunta?
Recomendar


21 diapositivas
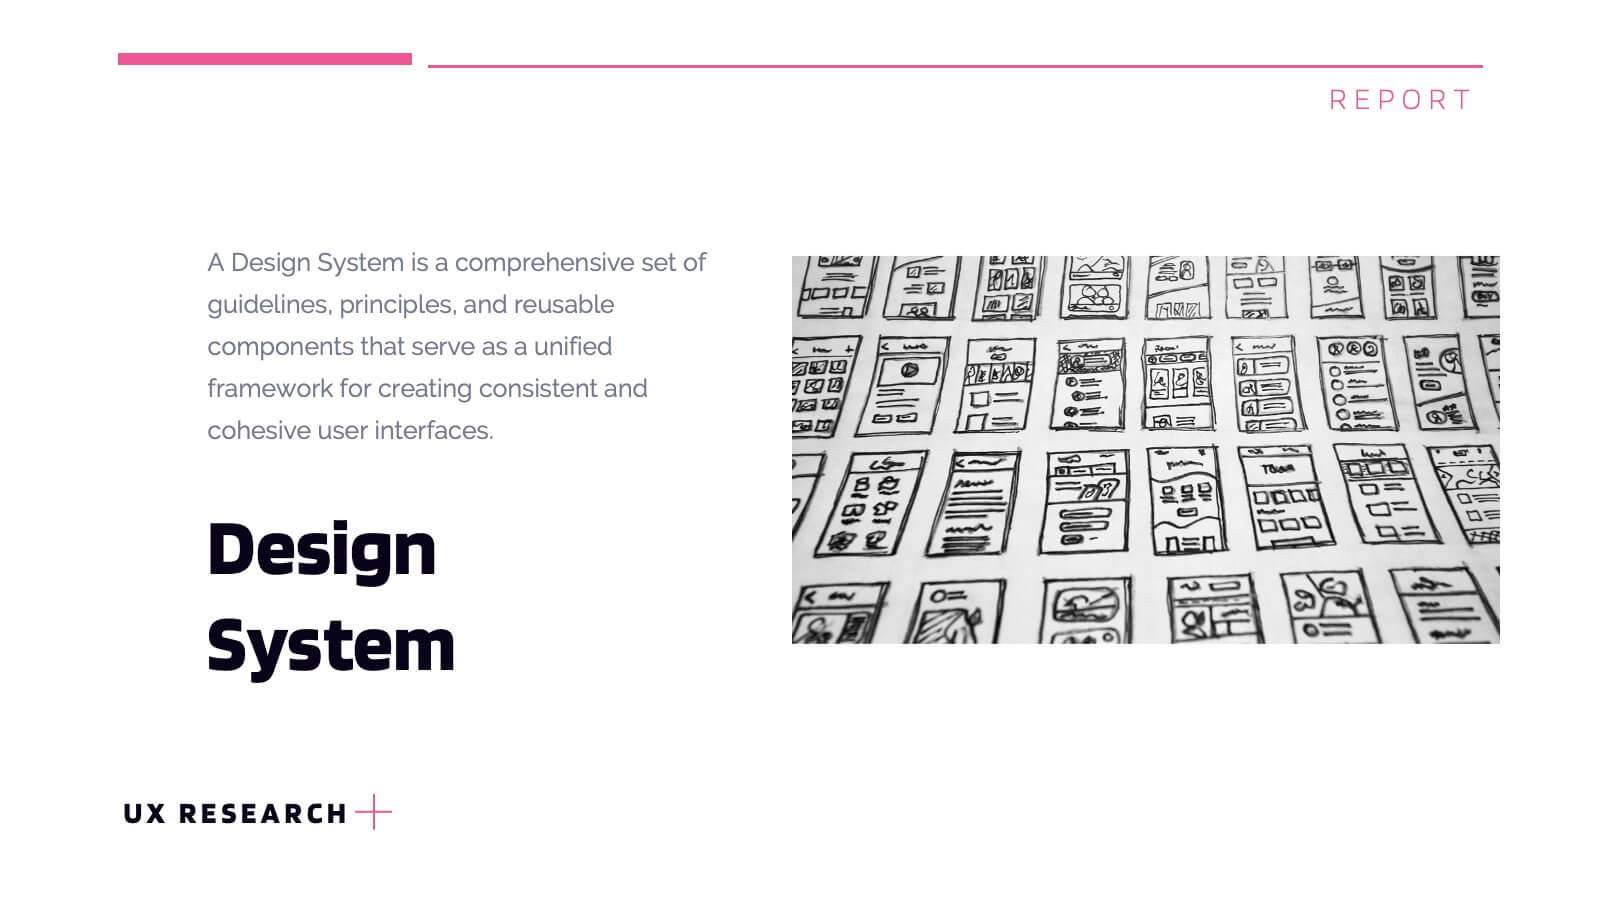
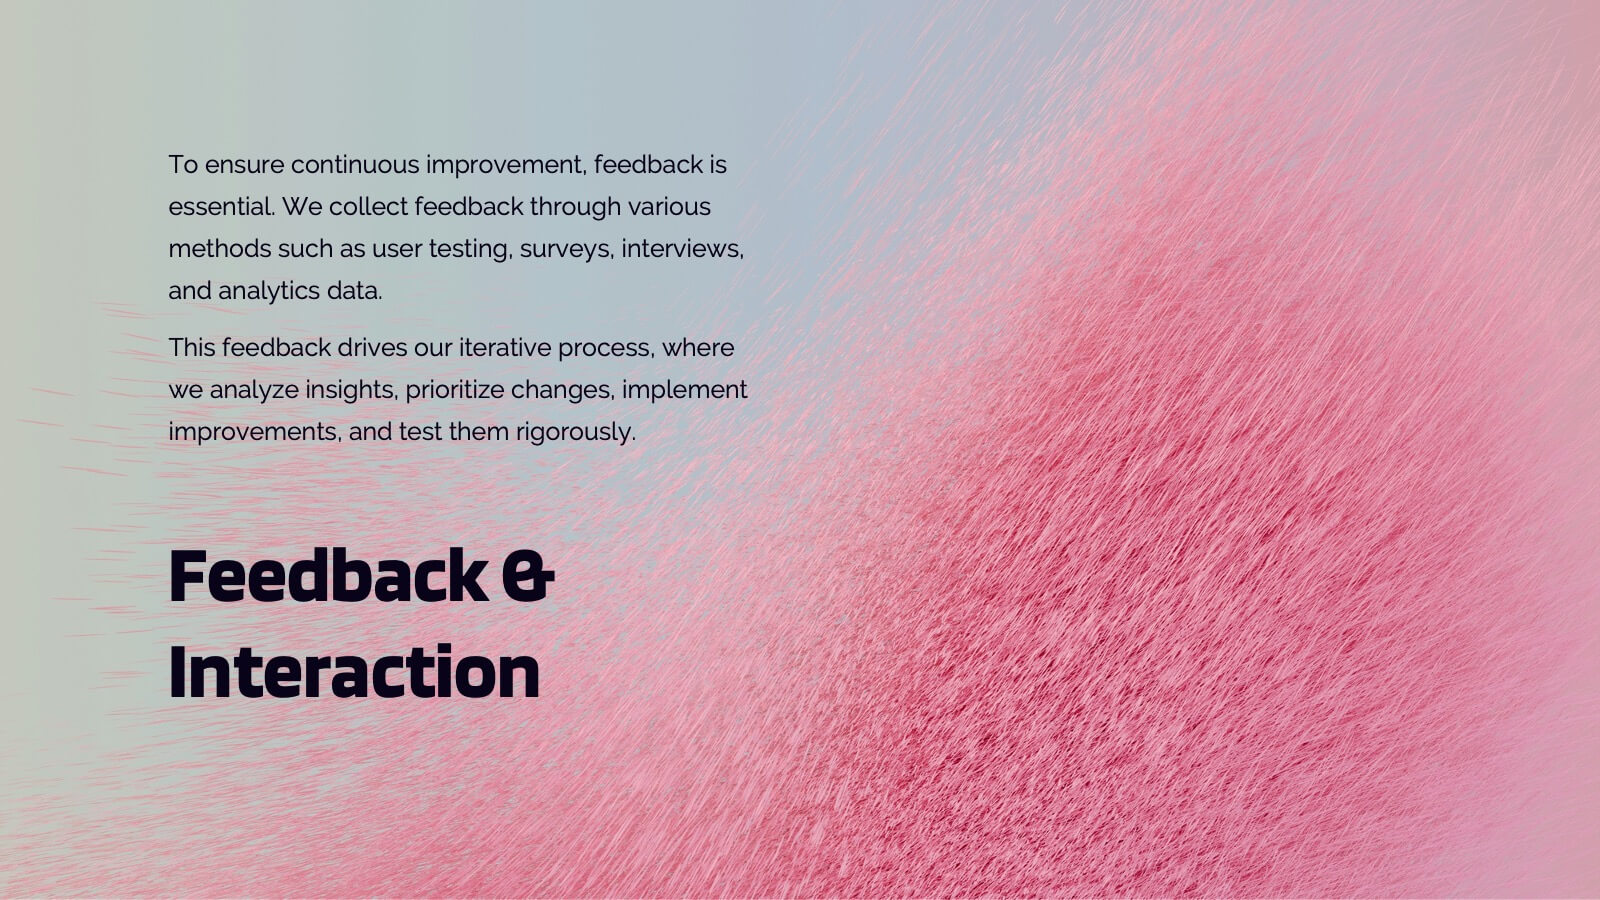
Lumascend UX Research Report Presentation
Present your UX research findings with clarity using this engaging and organized template! Covering key areas like user personas, wireframes, testing, and interaction design, it ensures all aspects of your design process are communicated effectively. Perfect for UX teams, stakeholders, or client presentations, this template works seamlessly with PowerPoint, Keynote, and Google Slides.


5 diapositivas
Topic Organization with Bubble Mapping Presentation
Easily structure complex information with the Topic Organization with Bubble Mapping Presentation. This visually engaging layout uses a central idea with grouped supporting elements, making it perfect for brainstorming, mind mapping, or topic clustering. Fully editable in PowerPoint, Keynote, or Google Slides—ideal for educators, strategists, and project teams.


24 diapositivas
Spireflow Corporate Strategy Report Presentation
Showcase your business insights with this modern, dynamic presentation template designed to communicate strategic goals and objectives effectively. From SWOT analysis to sales strategy and financial performance, each slide is tailored to enhance clarity and engagement. Perfect for business strategists and teams, this template is compatible with PowerPoint, Keynote, and Google Slides.


5 diapositivas
Corporate Framework and Structure
Visualize governance, compliance, and assurance in a streamlined framework. This structured slide is ideal for outlining business functions, responsibilities, and reporting lines across departments. Fully editable in PowerPoint, Keynote, and Google Slides for seamless customization.


8 diapositivas
Environmental and Social Sustainability
Showcase your sustainability efforts with this layered pyramid slide, perfect for visualizing tiered environmental or social responsibility strategies. Ideal for ESG reporting, sustainability workshops, or stakeholder presentations. Fully customizable in PowerPoint, Keynote, and Google Slides to match your brand and message.


4 diapositivas
Productivity and Task Prioritization Presentation
Streamline efficiency with structured task prioritization using this Productivity and Task Prioritization template. Designed with rating indicators, pie charts, and color-coded sections, this slide helps visualize task importance, workload distribution, and performance evaluations. Ideal for team leaders, project managers, and business strategists, this template is fully customizable and compatible with PowerPoint, Keynote, and Google Slides.


6 diapositivas
Business Value Chain Strategy
Turn your strategy into a winning move with this interactive spin on business value chains. This engaging diagram template helps break down key activities and visualize how each stage adds value—perfect for process optimization or stakeholder presentations. Fully compatible with PowerPoint, Keynote, and Google Slides.


5 diapositivas
Professional Relationship Network Presentation
Map out key business connections using this Professional Relationship Network template. Ideal for showcasing client relationships, internal team dynamics, or communication hierarchies. This clean, modern design helps clarify roles and links across stakeholders. Fully editable and compatible with PowerPoint, Keynote, and Google Slides for flexible use in any setting.


5 diapositivas
Corporate Strategic Planning Presentation
Create a winning strategy with this corporate strategic planning template. Designed for business leaders, it helps structure goals, initiatives, and key performance areas in a clear, visual format. Ideal for strategic decision-making and long-term planning. Fully customizable and compatible with PowerPoint, Keynote, and Google Slides for seamless editing and presentation.


7 diapositivas
Thank You Infographic
Express your gratitude in style with this beautifully designed template, perfect for adding a touch of elegance and personalization to your messages of appreciation. Featuring a range of versatile layouts—from minimalist designs to vibrant color schemes and eye-catching typography—each slide offers a unique way to say thank you, whether it’s to clients, team members, or partners. Customize the visuals to align with your brand or personal style by integrating your own photos, logos, and text, making each expression of gratitude uniquely yours. Ideal for corporate settings, personal use, or charitable events, this template helps you create memorable, heartfelt thanks that resonate deeply with recipients, and is perfect for use in presentations, emails, or as special tokens of appreciation to leave a lasting impression.


14 diapositivas
Pitch Deck Presentation
Craft a compelling narrative for your startup or business proposal with our professionally designed Pitch Deck presentation template. Perfect for entrepreneurs and innovators, this template simplifies conveying your vision to investors and stakeholders. The sleek slides cover all critical aspects of a pitch: from the problem statement, solution, market opportunity, to the business model, and financial projections. Each slide is crafted to facilitate clear and persuasive communication of your ideas. The intuitive layout ensures that your market strategies, competitive analysis, and go-to-market plans are presented with clarity and impact. The templates are seamlessly compatible with PowerPoint, Keynote, and Google Slides, providing flexibility and ease of use across platforms. With our Pitch Deck template, you’re equipped to make a lasting impression that could propel your business to success. Make your data-driven points with confidence, backed by our engaging design that's primed for your next big pitch.


21 diapositivas
Frost Design Proposal Presentation
Present your design proposal with sophistication and clarity using this elegant template! Perfect for outlining your project summary, objectives, and proposed solutions, this template covers everything from scope of work and budget breakdowns to deliverables and team expertise. Fully compatible with PowerPoint, Keynote, and Google Slides, it's designed for seamless, professional presentations.


6 diapositivas
Business Revenue Break-Even Strategy
Visualize profitability with clarity using this dynamic break-even strategy template. Ideal for business analysts, finance teams, and consultants, this diagram highlights the balance between cost, loss, and profit at the break-even point. With intuitive icons and space for key metrics, it's fully editable in PowerPoint, Keynote, and Google Slides.


5 diapositivas
Marketing Customer Journey Presentation
Visualize your customer’s path with the Marketing Customer Journey Presentation. This slide layout is perfect for outlining the stages of your buyer’s decision-making process—from awareness to action. Highlight critical touchpoints and engagement strategies with a clean, easy-to-follow design. Fully customizable and compatible with PowerPoint, Keynote, and Google Slides.


26 diapositivas
Navigating the Creative Industry Presentation
Unlock the secrets to success in the creative industry with this dynamic and visually engaging presentation. Covering essential topics like career pathways, industry trends, collaboration strategies, and personal branding, this template helps you present insights with clarity and impact. Fully customizable and compatible with PowerPoint, Keynote, and Google Slides for a seamless experience.


26 diapositivas
Efficient Time Management Presentation
Optimize your time management skills with a presentation designed to streamline your productivity. The template offers a professional and calming color palette, encouraging focus and clarity. It's structured to address the key principles of time management, from prioritizing tasks to strategic planning. Within the slides, you’ll find tools to introduce time management concepts, team profiles to assign roles efficiently, and charts to monitor progress. Engaging graphics and infographics are used to outline processes and time allocation, making it easier to visualize effective time management strategies. This template is a perfect match for workshops, personal organization sessions, or corporate training programs, compatible with popular platforms like PowerPoint, Keynote, and Google Slides. It’s designed to aid professionals and teams in harnessing their time effectively, ensuring every second counts towards achieving their goals.


6 diapositivas
Credit Card Comparison and Features Presentation
Make your decision-making effortless with this bright and visual template that helps you break down features, perks, and details of different cards in one glance. Perfect for financial presentations or product comparisons, it clearly illustrates credit card benefits side by side. Fully compatible with PowerPoint, Keynote, and Google Slides.