


Características


¿Tienes alguna pregunta?
Recomendar


6 diapositivas
Porter's Five Forces Management Infographic
Porter's Five Forces is a framework, that helps businesses understand the attractiveness and profitability of an industry by examining five key forces that shape its competitive landscape. These infographic templates provide a visually appealing and concise overview of Porter's Five Forces framework. They are designed to help businesses and professionals analyze the competitive dynamics of an industry and make informed strategic decisions. By using this to help your audience understand the forces that shape industry competitiveness, they can identify potential threats and opportunities to make informed decisions, and gain a competitive edge.


7 diapositivas
Cryptocurrency Prices Infographic
Cryptocurrency prices refer to the current or historical values of various cryptocurrencies in terms of a specific fiat currency or other cryptocurrencies. This infographic template is a visual journey into the ever-fluctuating world of digital currencies. This template serves as your gateway to understanding the trends and values of cryptocurrencies, empowering you to make informed decisions in this exciting financial realm. Compatible with Powerpoint, Keynote, and Google Slides. Use this infographic to easily present major cryptocurrencies as celestial bodies, emphasizing the vastness and potential of the crypto universe.


20 diapositivas
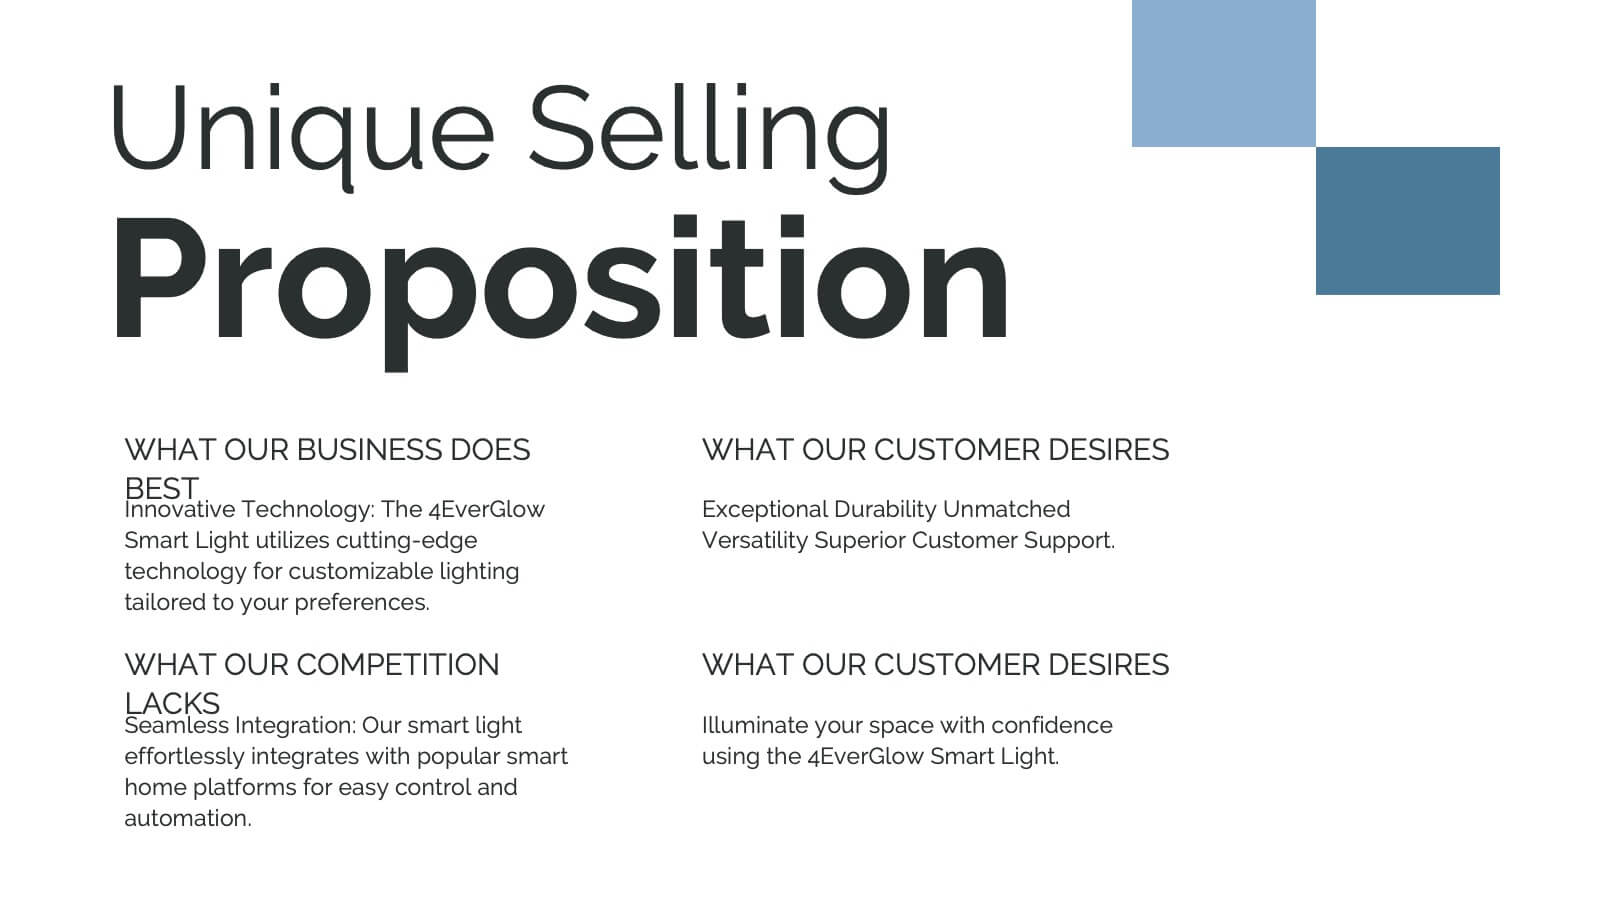
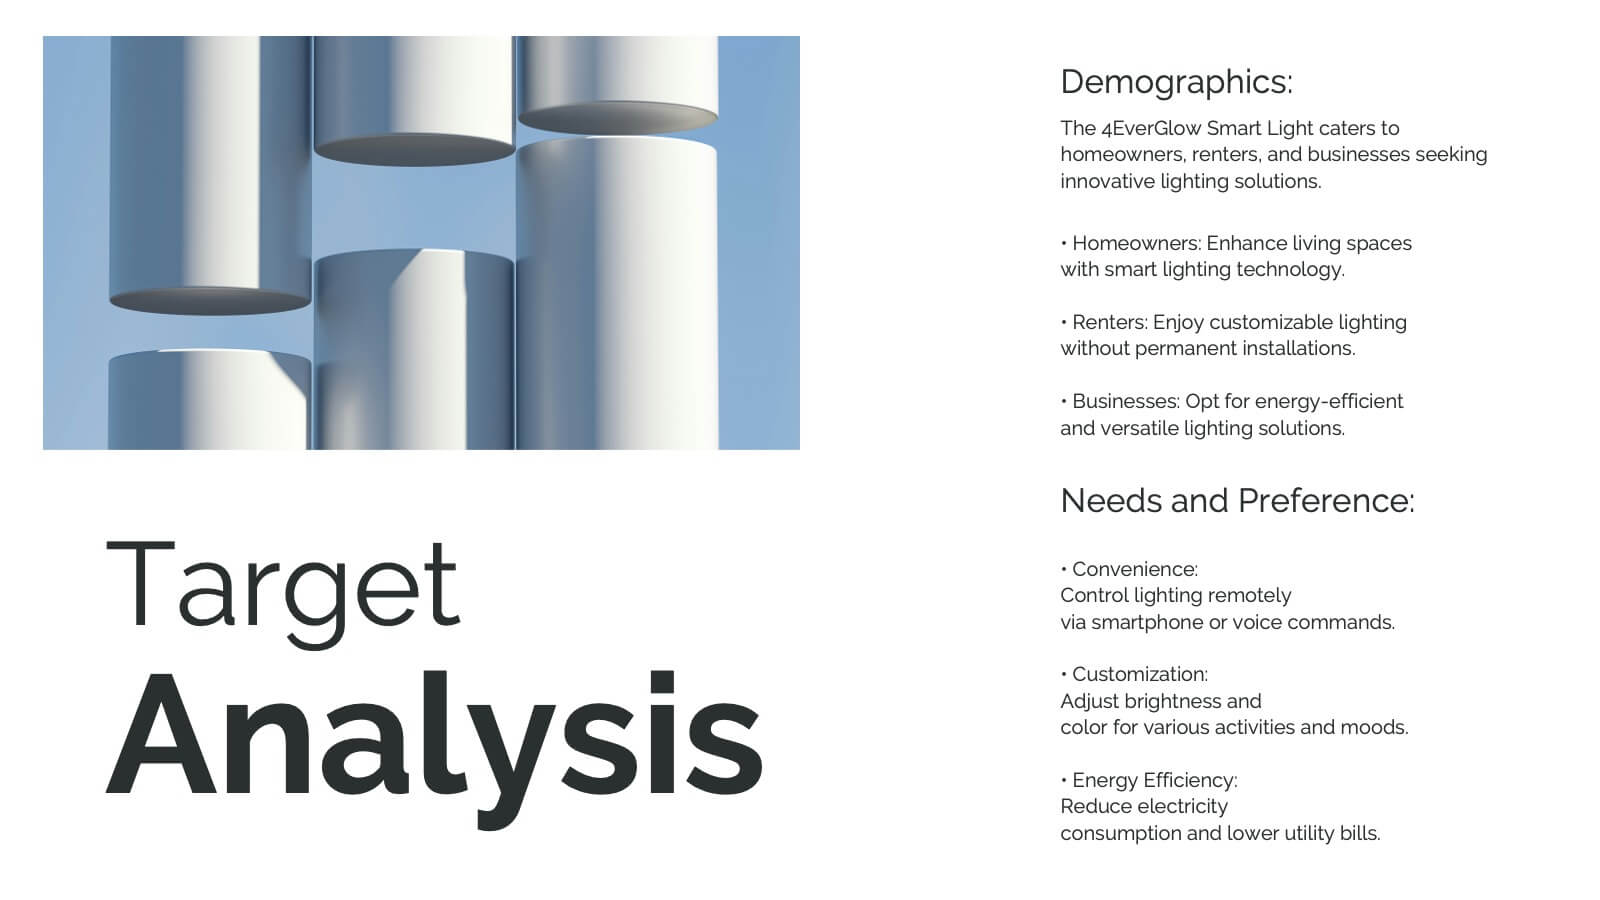
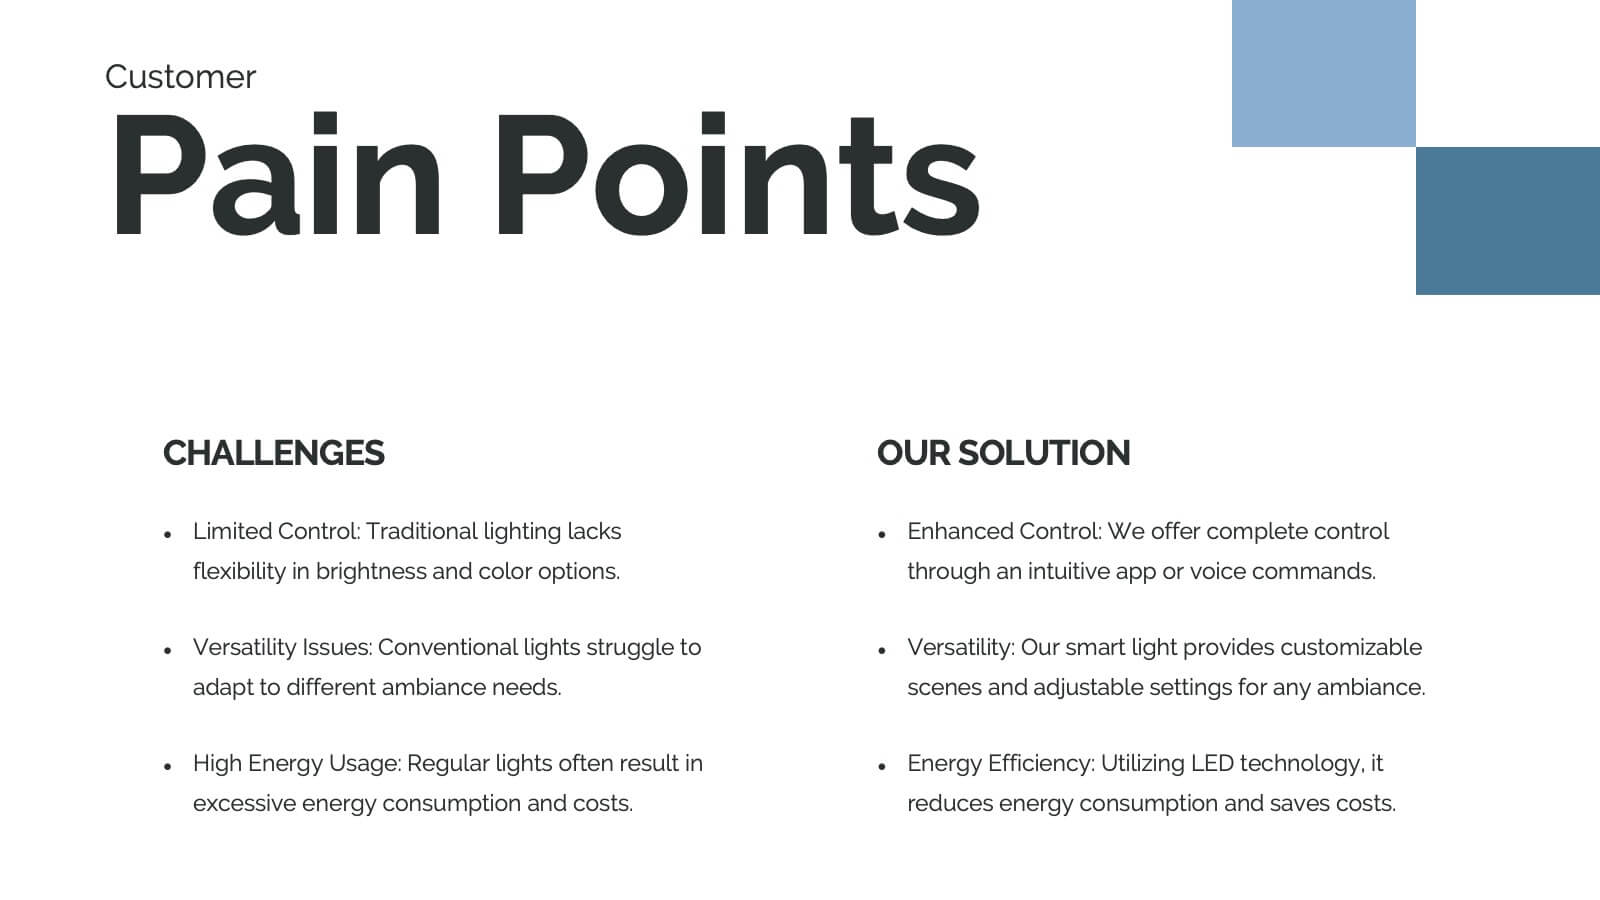
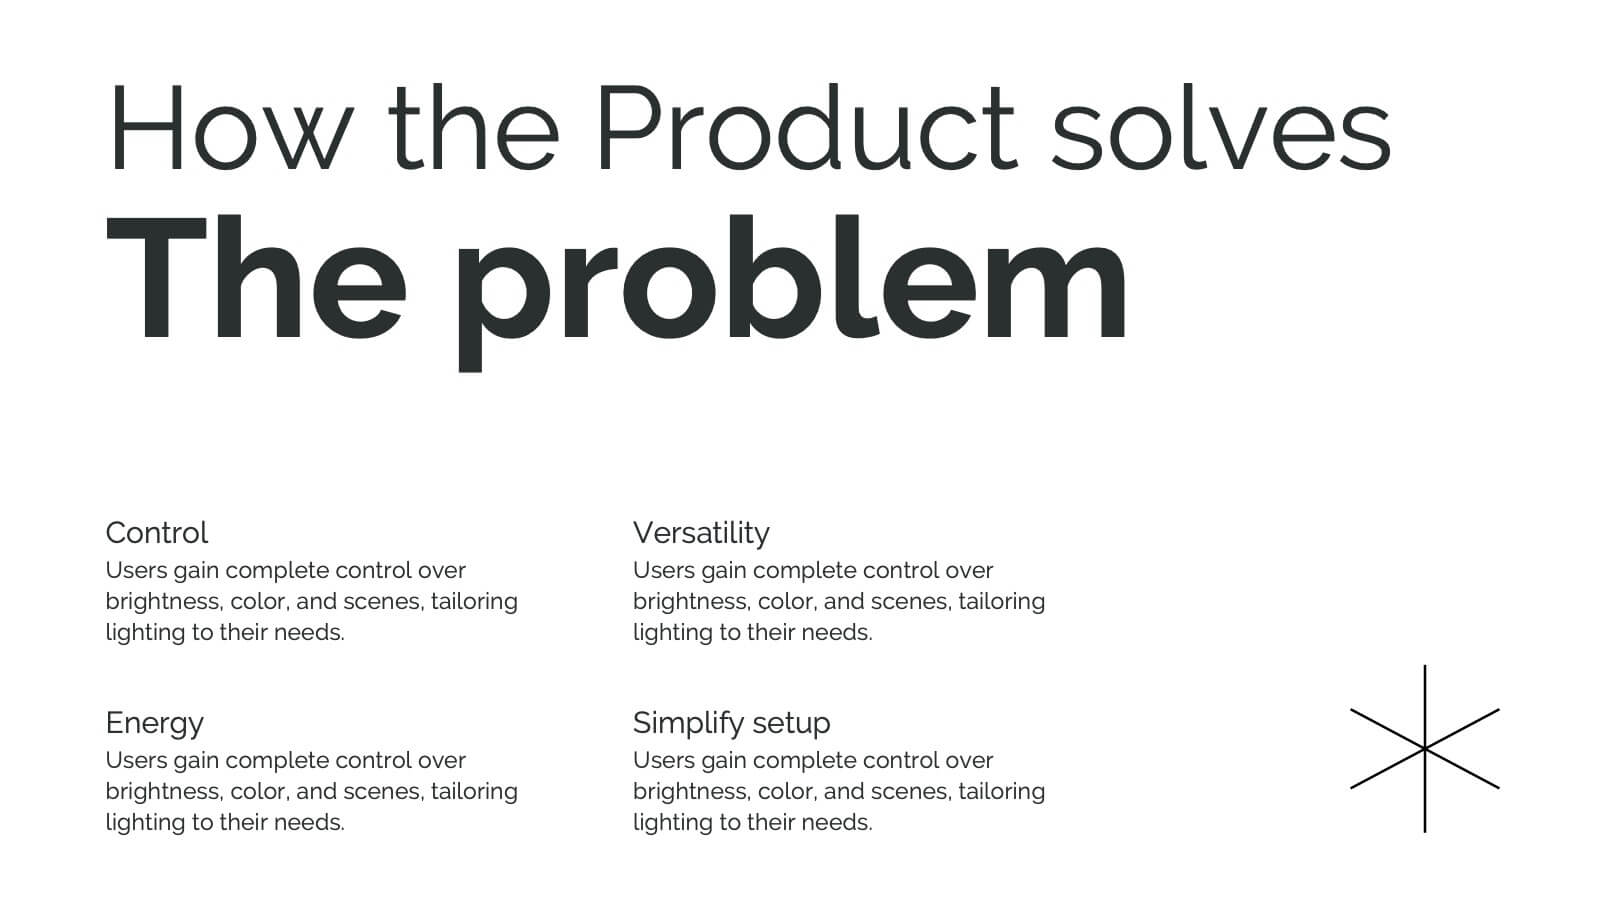
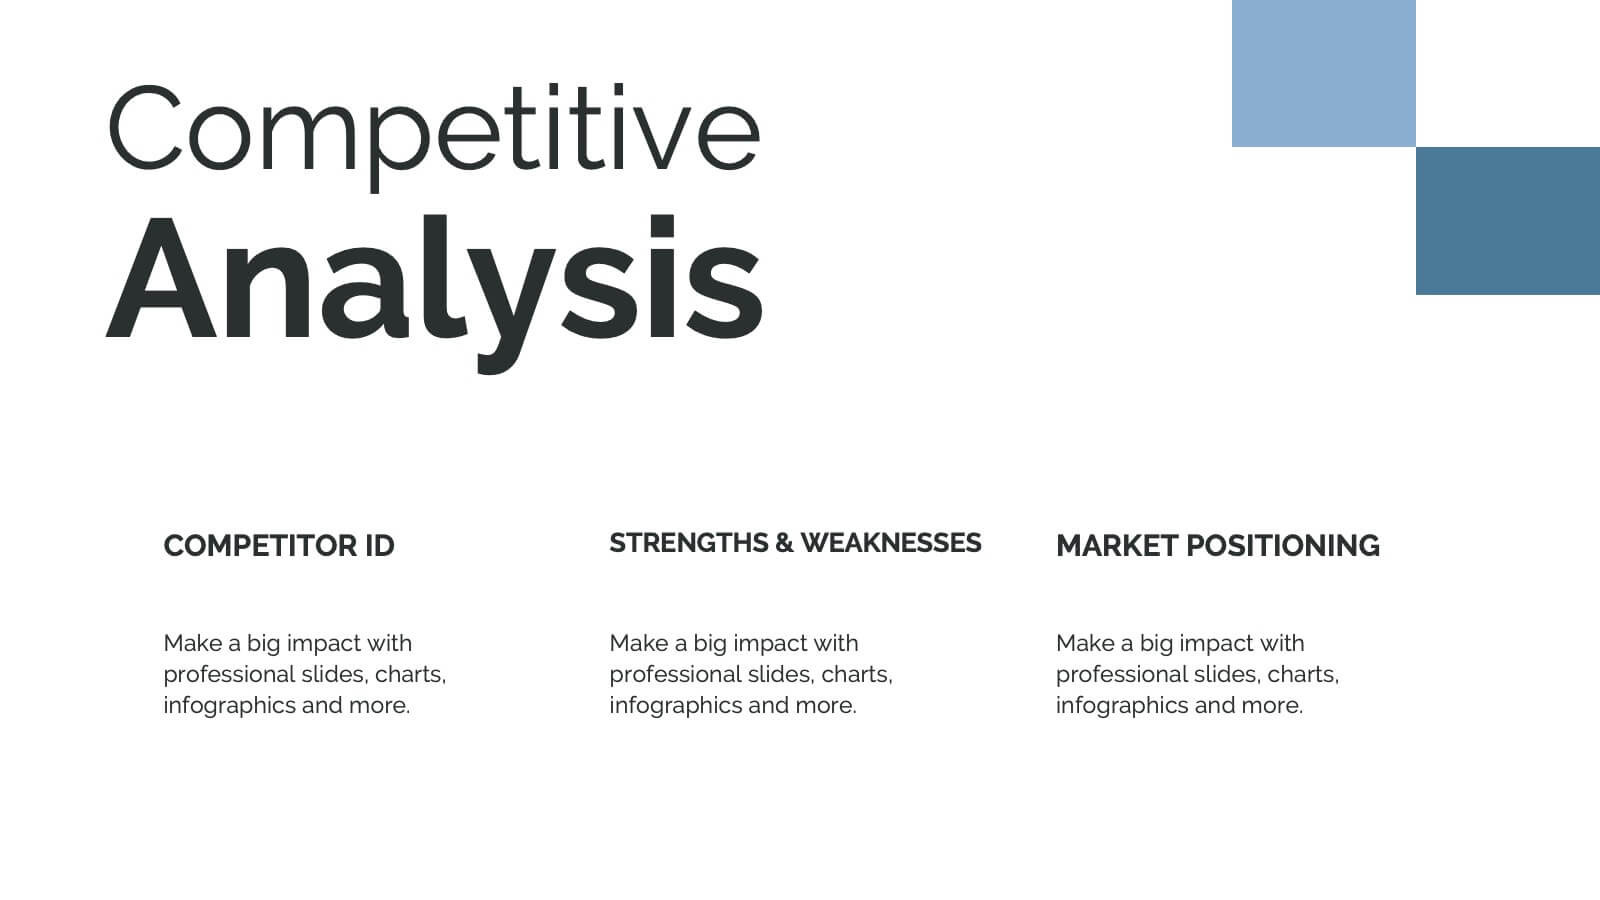
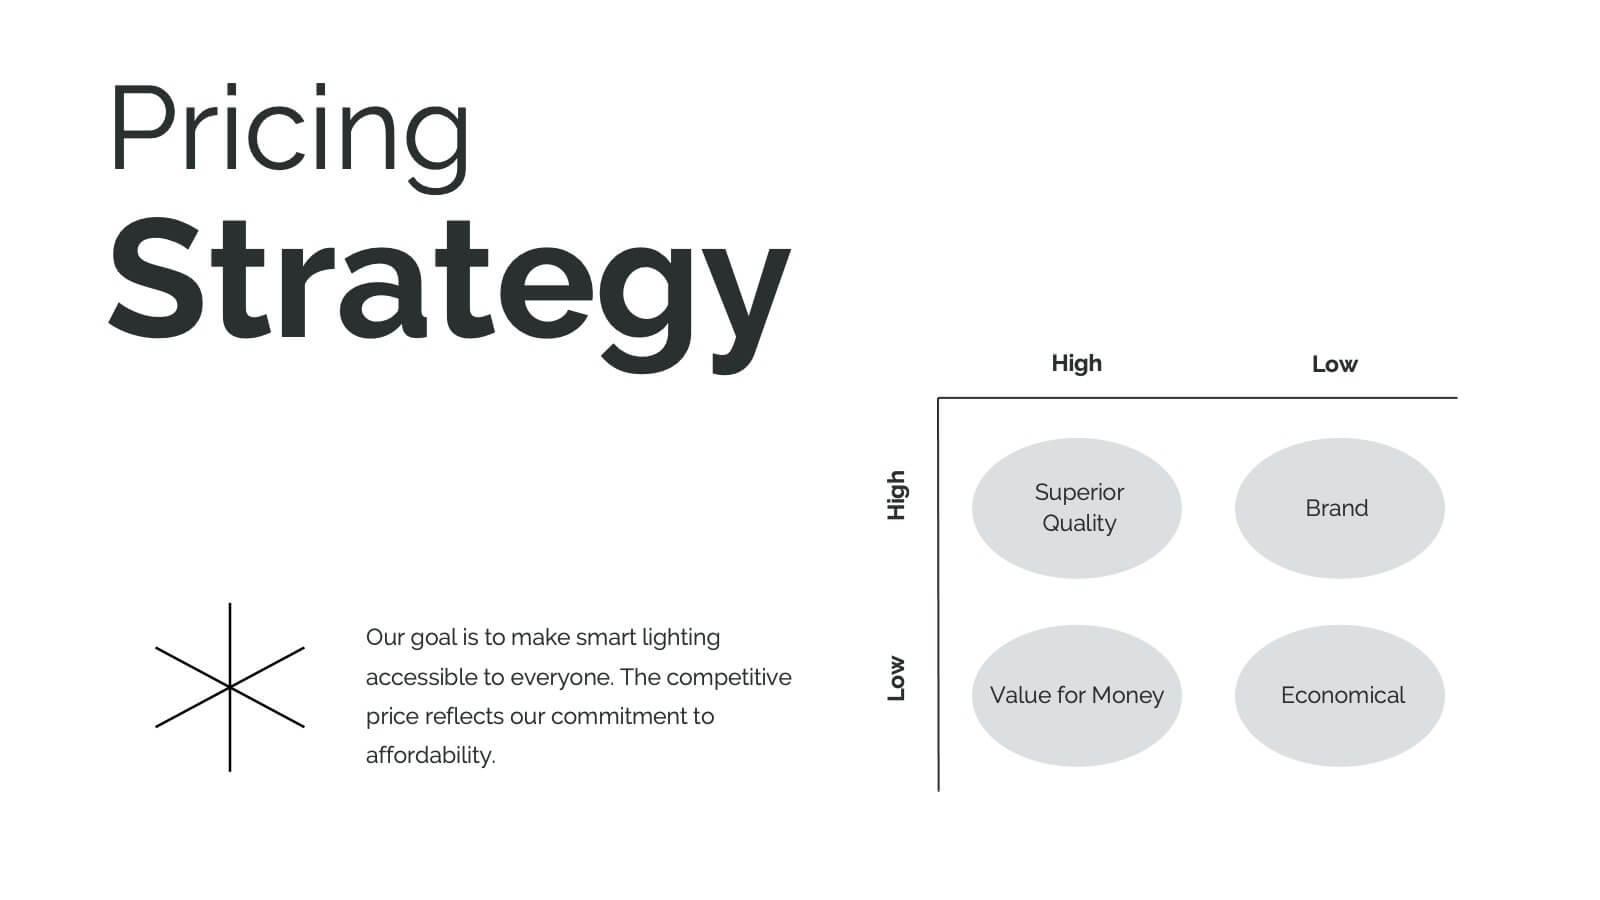
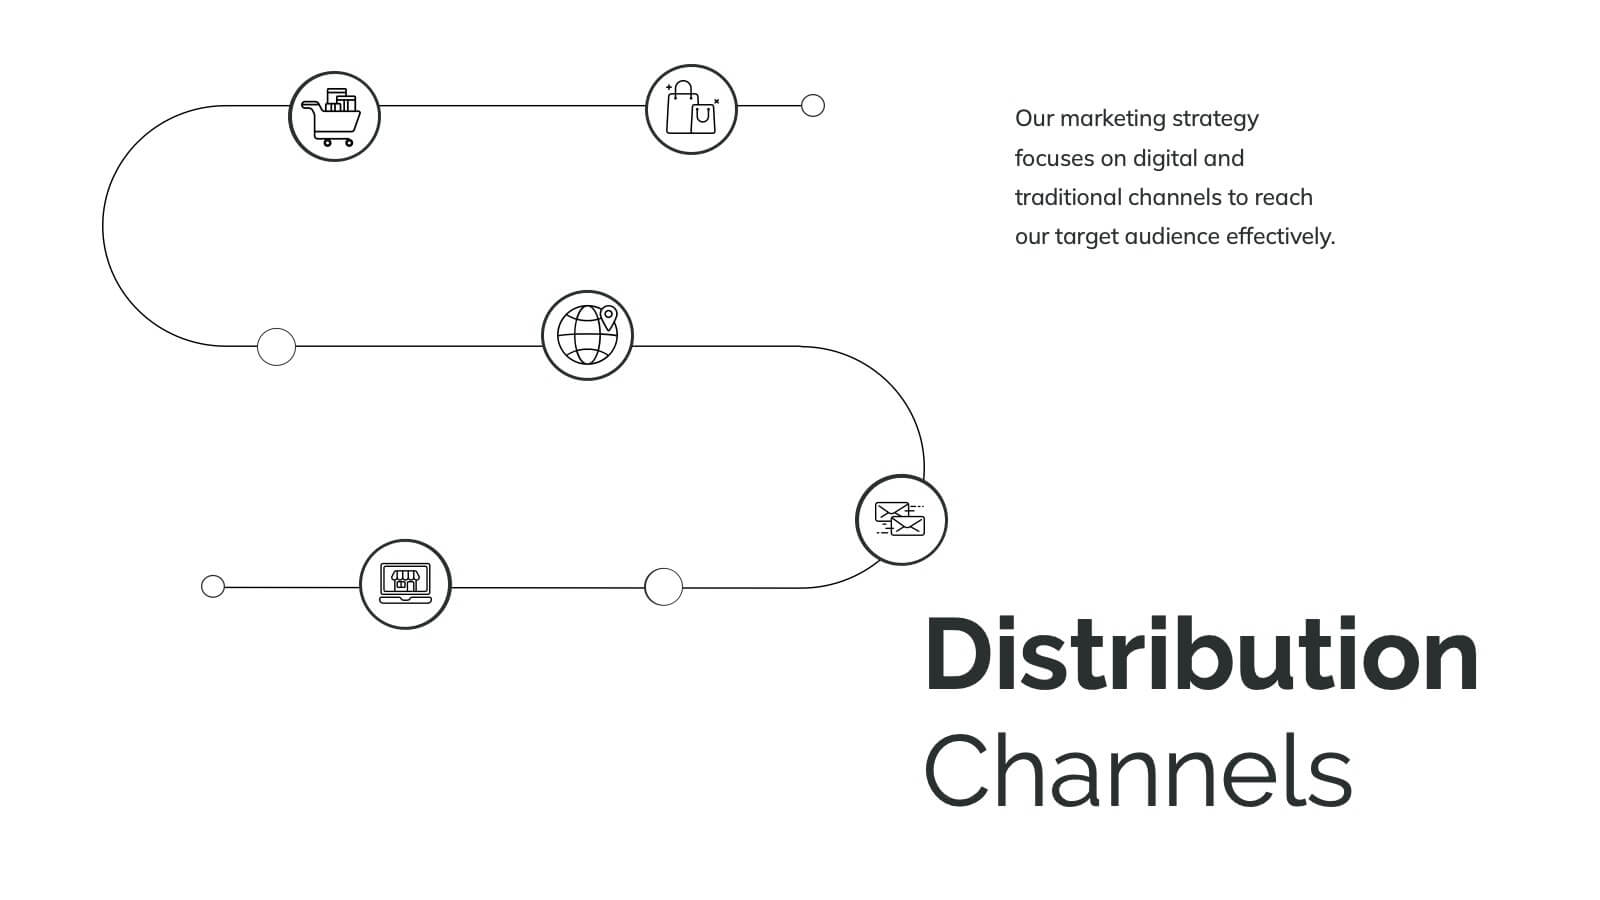
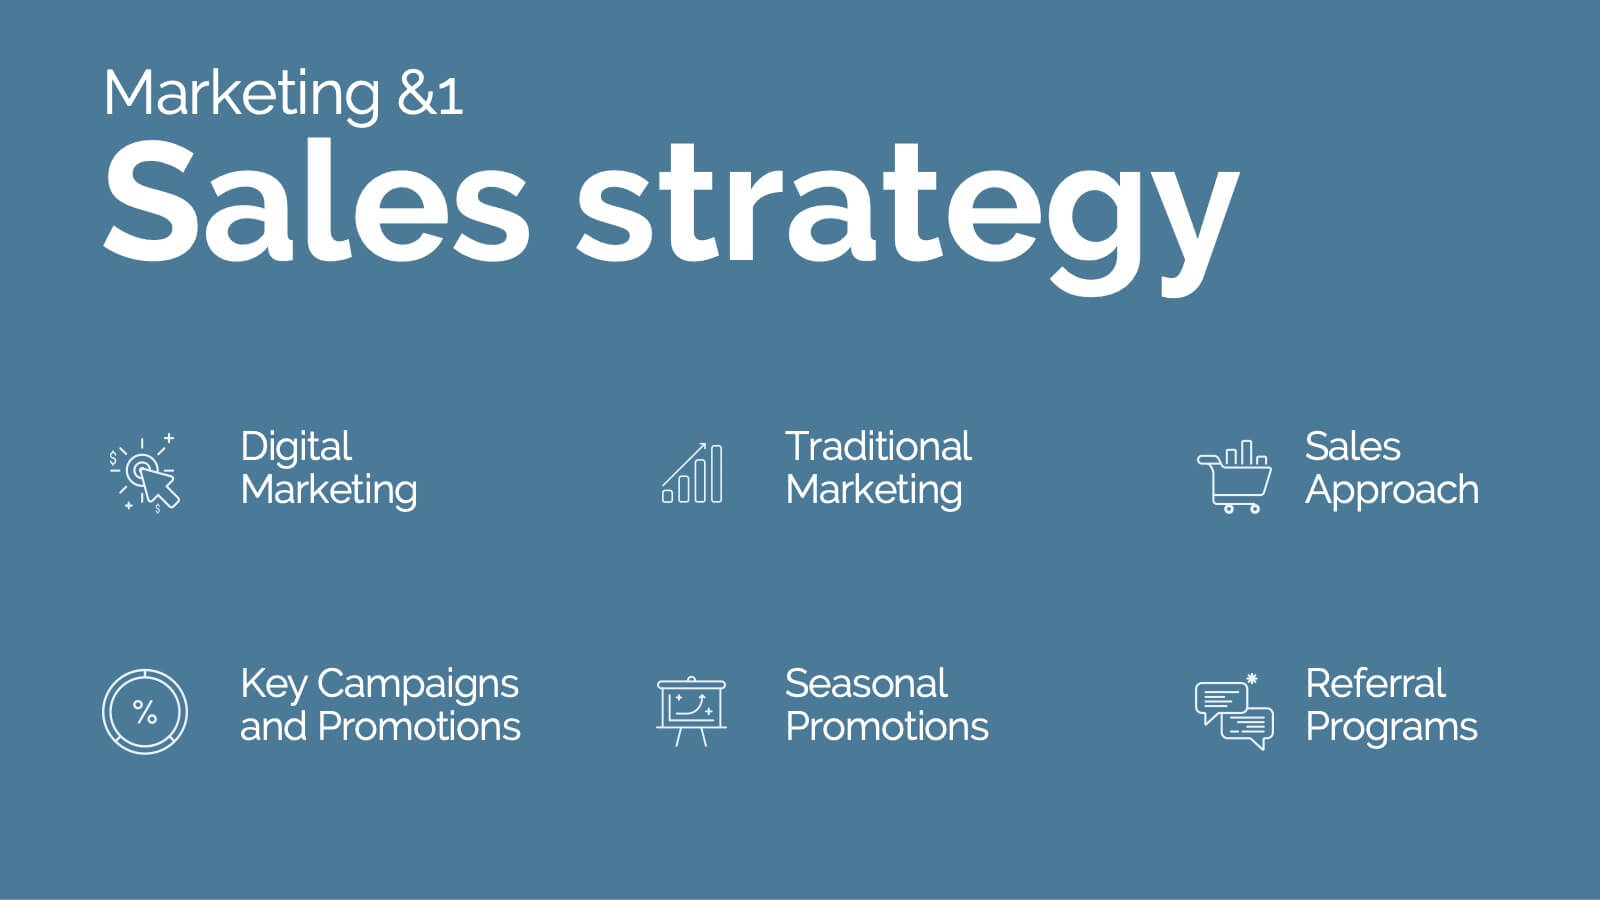
Hydra Product Launch Presentation
Unveiling your latest product has never been easier or more captivating! This comprehensive presentation template covers every aspect of your product's journey—from launch to competitive analysis. Engage your audience with detailed slides on features, target analysis, and pricing strategy. Seamlessly compatible with PowerPoint, Keynote, and Google Slides for maximum flexibility and impact.


6 diapositivas
Budget Planning Spreadsheet Slide Presentation
Visualize your spending strategy with a clean, circular layout that turns complex financial data into simple, engaging visuals. This modern design helps you outline expenses, track categories, and showcase progress effectively in meetings or reports. Fully editable and compatible with PowerPoint, Keynote, and Google Slides for effortless customization.


43 diapositivas
UX UI Structure Presentation
Dive into UX with this comprehensive, elegant presentation template tailored for detailed case studies and user research. Perfect for mapping user journeys, creating personas, and showcasing design principles, this template ensures your UX insights are clearly communicated. Its sleek design enhances readability and engagement. Compatible with PowerPoint, Keynote, and Google Slides, it's ideal for any platform.


23 diapositivas
Glimmer Sales Pitch Deck Presentation
Get ready to wow investors with this dynamic pitch deck! Perfect for startups and entrepreneurs, it covers company overview, market opportunity, revenue models, and more. Designed to highlight your business potential and secure funding. Compatible with PowerPoint, Keynote, and Google Slides, it’s your ultimate tool for impactful presentations.


7 diapositivas
Business People Infographic Presentation Template
This Business People infographic template is perfect for a business handbook, corporate presentation and briefing. This template is designed with subtle colors and textures, the clean layout makes it easy to highlight important data and the many components that can be used for different purposes. This is a great, clean and simple way for you to display all the information about your business. This infographic can effectively communicate complex information in a simple and easy-to-understand format, making it an ideal medium for exploring the topic of business people and the business world.


5 diapositivas
Hydrology and Water Cycle Presentation
Showcase the complete water cycle with this vibrant Hydrology and Water Cycle infographic. Highlight key stages like precipitation, collection, evaporation, and condensation using clear visuals and numbered sections. Fully customizable for science, sustainability, or educational presentations. Compatible with PowerPoint, Keynote, and Google Slides for easy editing.


20 diapositivas
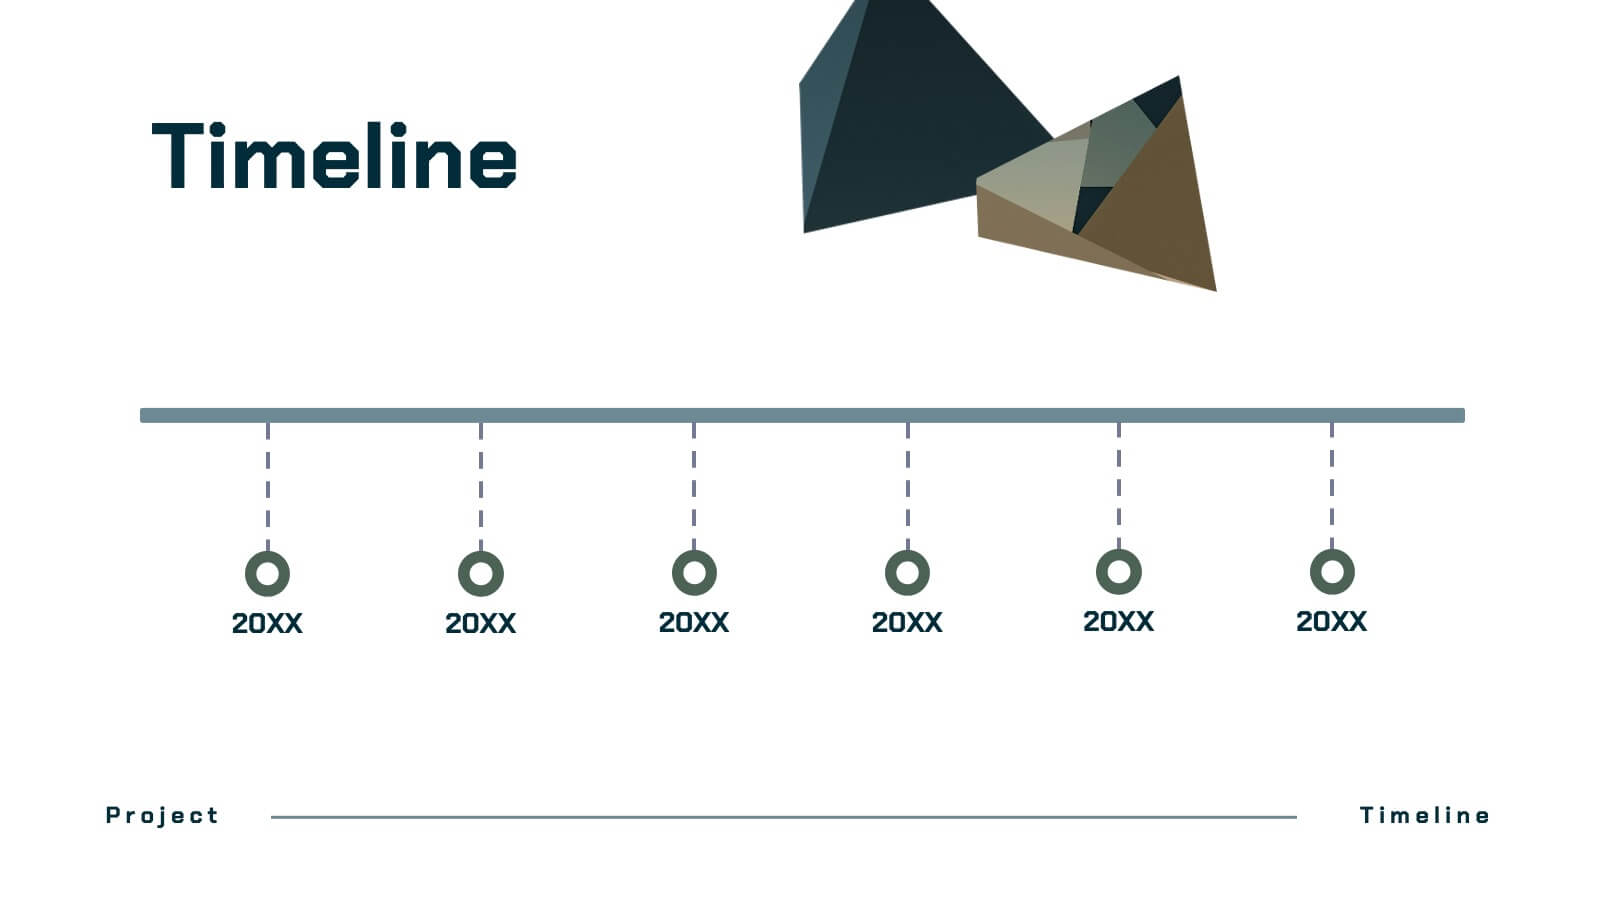
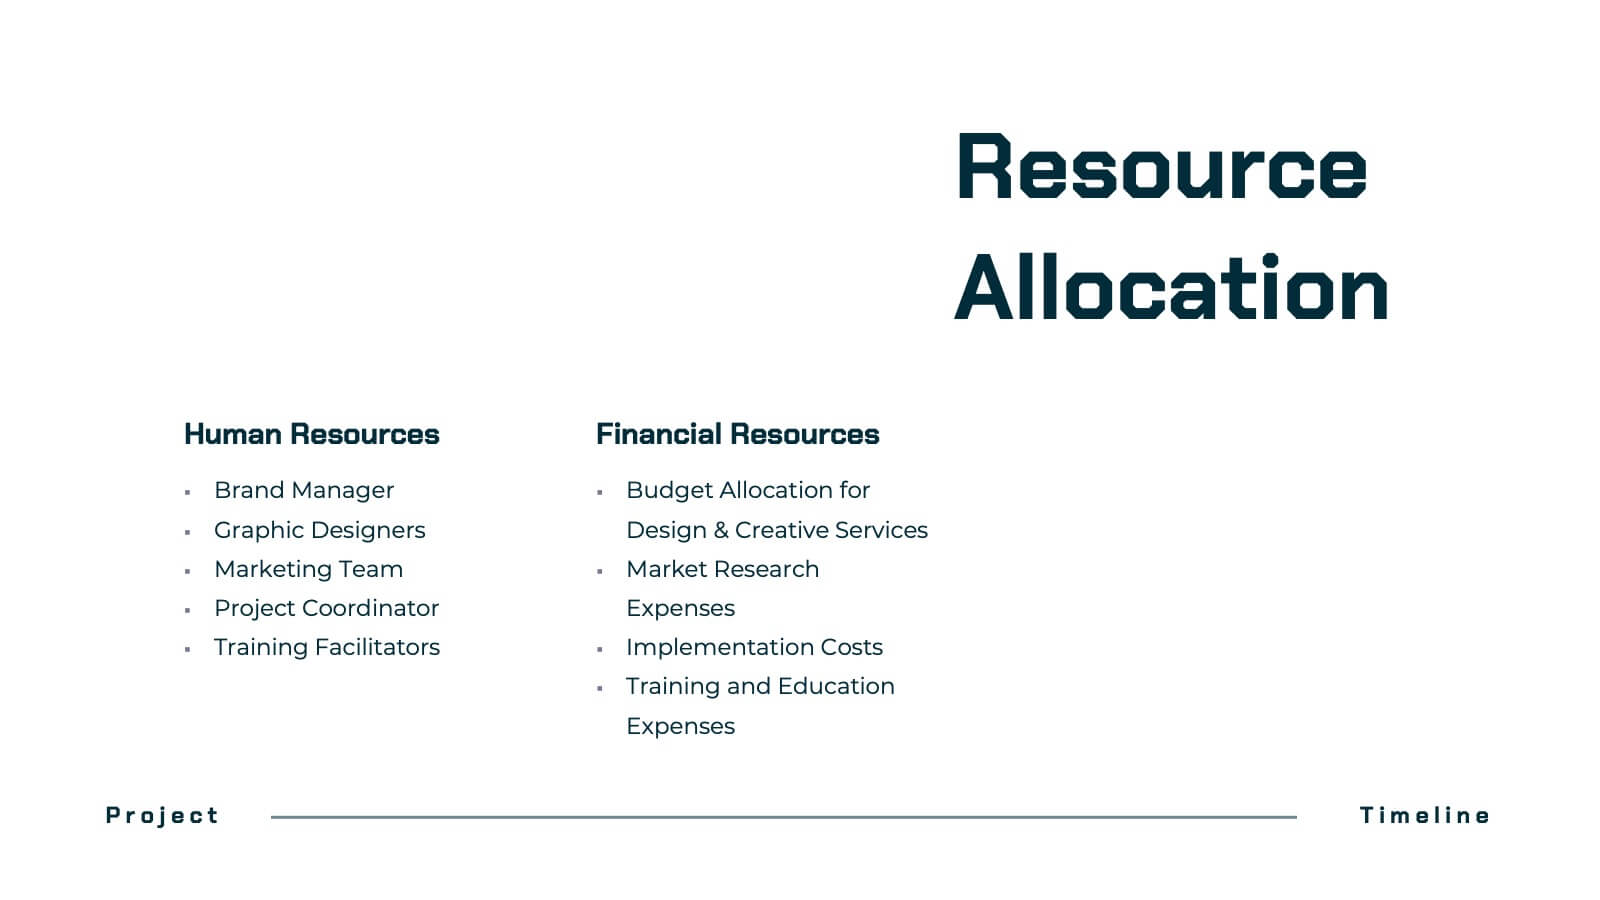
Dynastream Project Timeline Presentation
Stay on track with this detailed and well-organized project plan presentation designed for success! Covering essential areas like scope, objectives, timeline, budget breakdown, and risk management, it ensures every aspect of your project is clear and actionable. Perfect for team meetings or stakeholder updates, this template is fully compatible with PowerPoint, Keynote, and Google Slides.


7 diapositivas
Work From Home Online Infographic
Work from home online refers to a work arrangement where individuals can perform their job responsibilities remotely, usually from their homes, using internet-connected devices like computers, laptops, tablets, or smartphones. Unveil the modern realm of remote work with our work from home online infographic. This visually engaging and informative template takes you on a journey through the digital landscape of remote work, showcasing its advantages, best practices, and the tools that enable seamless virtual collaboration. This infographic isn't just a visual guide it's a roadmap to thrive in the evolving world of work.


5 diapositivas
Strategic Planning with OKRs Presentation
Optimize goal-setting with the Strategic Planning with OKRs presentation. This visually engaging template uses a trophy-inspired design to highlight key objectives and results, making it perfect for business strategy sessions, team alignment, and performance tracking. Fully customizable and compatible with PowerPoint, Keynote, and Google Slides for seamless use.


7 diapositivas
Construction Jobs Infographic
Construction jobs refer to various roles and professions within the construction industry involved in planning, designing, building, and maintaining structures such as buildings, roads, bridges, dams, and other infrastructures. This infographic template sheds light on various career opportunities within the construction industry, offering a roadmap for aspiring professionals. Compatible with Powerpoint, Keynote, and Google Slides. With this infographic you're not just exploring careers; you're navigating a landscape of opportunities, ready to build a successful career in the dynamic world of construction.


7 diapositivas
Framework Documentation Infographic
A framework infographic presents a framework for organizing and understanding complex information, to provide an overview of the key elements and relationships between them. This template is designed to break down your large amounts of information into smaller, more manageable parts. This infographic can be used in fields such as business, marketing, and strategy, as well as in education and research. Use it to explain complex concepts, theories, and models, and to provide a visual representation of how elements fit together. This can take a variety of forms, including flowcharts and diagrams.


5 diapositivas
Iceberg Model Infographics
Introducing our Iceberg Model Infographic, this is a visual representation of the Iceberg Model which is a metaphor for understanding a problem or issue. It is based on the idea that just like an iceberg, only a small portion of the problem or issue is visible on the surface, while the majority of it lies beneath. In this vertical infographic use the top visible part of the iceberg to represent the things that are easily observed, and the larger hidden part of the iceberg can be the underlying causes or factors that are not easily visible. This is designed to help people understand the complexity of a problem and encourage them to look beyond the surface level.


6 diapositivas
Amortization Schedule Infographic
An amortization schedule is a detailed table that outlines the repayment of a loan over time. This infographic can be a helpful way to visually explain the repayment schedule of a loan or mortgage. Divide it into sections, including an introduction, explanation of terms, example calculations, and key takeaways. Compatible with Powerpoint, Keynote, and Google Slides. Use icons or visuals to represent loan-related concepts, such as a house for mortgages, a money bag for payments, or a graph for interest rates. The line graphs included can show the decreasing principal balance over time, with interest and principal portions highlighted.


6 diapositivas
ABC Alphabet Infographic
An "Alphabet Infographic" is a visually engaging way to present the letters of the alphabet along with corresponding words or images that start with each letter. This type of infographic is often used in educational settings to teach young children the alphabet and basic vocabulary. Display the letters of the alphabet in a clear and appealing layout. You can arrange them in rows or columns, using a bold and easily readable font. Use colorful and child-friendly illustrations for the images associated with each letter. This will make the infographic more captivating and engaging for young learners.


4 diapositivas
Modern 3D Business Diagram Presentation
Bring your metrics to life with this sleek 3D chart that adds instant dimension to any business presentation. Designed to visualize comparisons or progress across three data sets, this diagram helps you communicate clearly without overloading the slide. Fully compatible with PowerPoint, Keynote, and Google Slides for a seamless workflow.