


Características


¿Tienes alguna pregunta?
Recomendar


5 diapositivas
Understanding Customer Needs with Empathy Map Presentation
Gain deeper customer insights with the Understanding Customer Needs with Empathy Map Presentation. This template simplifies user research by visually organizing customer thoughts, behaviors, and emotions into a clear layout. Perfect for UX teams, product designers, and marketers aiming to craft user-centric strategies. Fully editable in PowerPoint, Keynote, Canva, and Google Slides.


5 diapositivas
RACI Matrix Responsibility Breakdown Presentation
Visualize roles and responsibilities with this RACI Matrix slide. Clearly assign who is Responsible, Accountable, Consulted, or Informed across key tasks. Ideal for project planning and team alignment, this editable layout helps avoid confusion and ensures accountability. Perfect for PowerPoint, Keynote, or Google Slides in any business context.


24 diapositivas
Fictara UX Research Report Presentation
Present your UX research findings effectively with this modern and professional template. Covering essential topics such as user personas, wireframes, usability guidelines, and feedback iteration, it’s designed to showcase insights clearly. Fully editable and compatible with PowerPoint, Keynote, and Google Slides.


7 diapositivas
Success Iceberg Infographic
Iceberg Infographic are visual guides to understanding the world of business. Ideal for anyone who wants to understand the basics of business, from what it is and how it works to why it matters. This template is easy to read, and can be used for everything from data visualization to teaching people how to use a new product. Give your audience a look at the most important parts of your business. The template is easy to use, and allows you to highlight your data. Fully customizable and compatible with Powerpoint, Keynote, and Google Slides. There are multiple color themes, fonts, and shapes to choose from, and endless combinations to make it truly yours.


3 diapositivas
Service and Product Benefits Overview Presentation
Clearly contrast key features with the Service and Product Benefits Overview Presentation. This modern split-layout design helps you showcase differences between service offerings and tangible products in a clean, side-by-side format. Use it to highlight value propositions, customer benefits, or decision-making factors. Fully editable and compatible with PowerPoint, Keynote, and Google Slides.


22 diapositivas
Glidebeam Content Marketing Pitch Deck Presentation
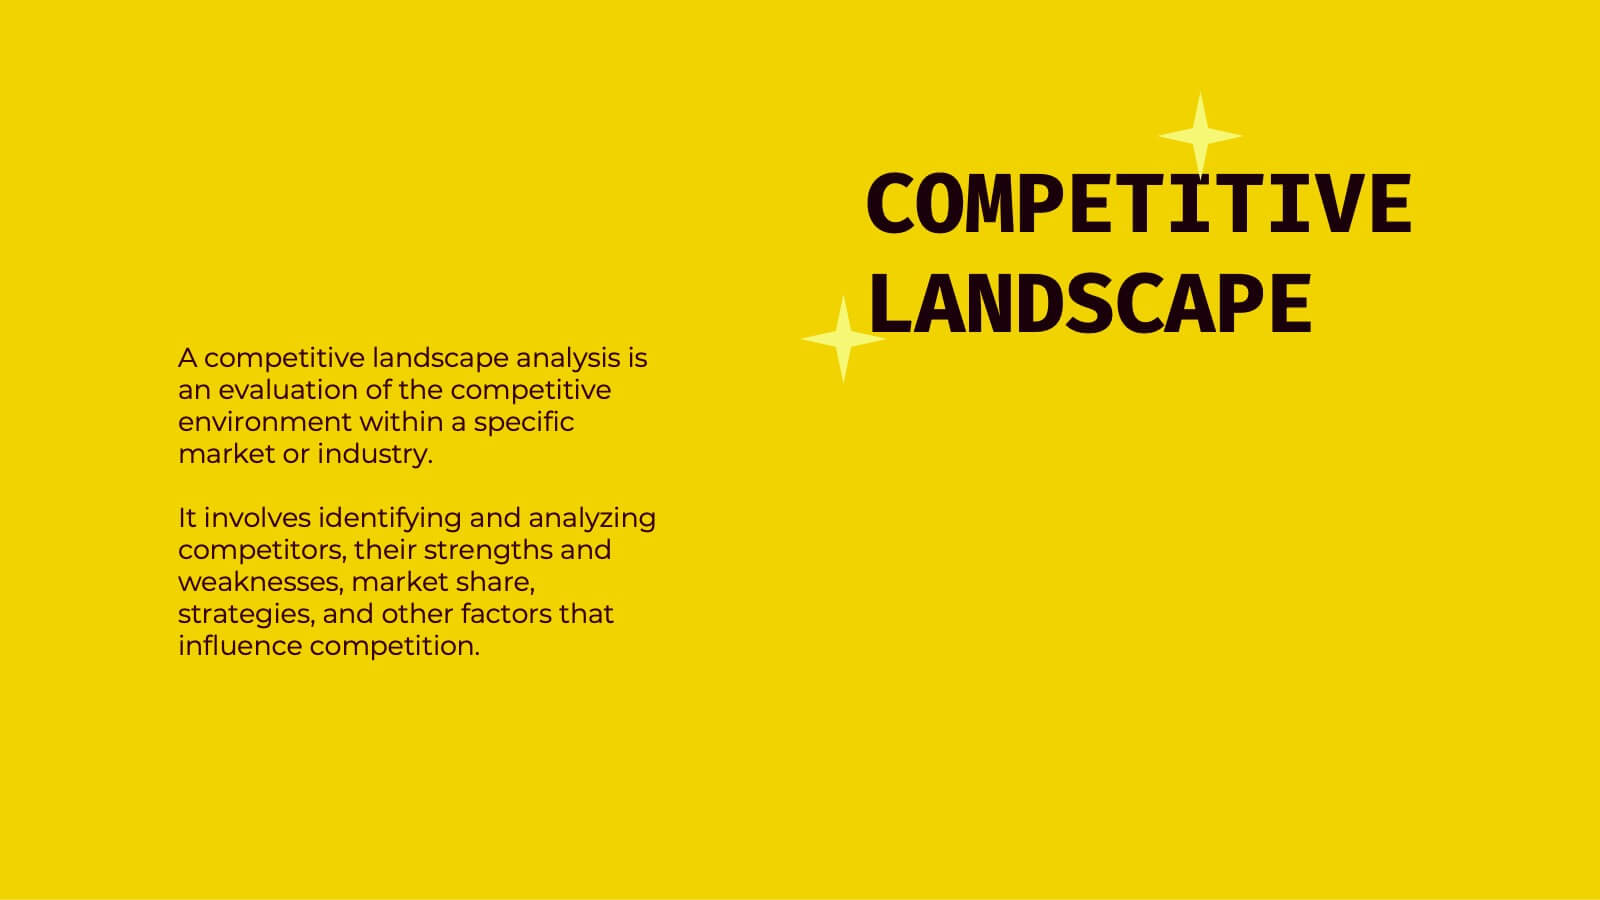
Capture your audience’s attention and showcase your marketing strategy with confidence using this polished and thoughtfully designed marketing pitch deck. It covers key elements like company history, target audience, competitive landscape, financial highlights, and growth strategies. Ideal for pitches or meetings, it’s compatible with PowerPoint, Keynote, and Google Slides.


5 diapositivas
Nutrition Facts Infographics
Nutrition facts provide important information about the nutritional content of food and beverages. This helps individuals make informed decisions about their dietary choices and understand the impact of food on their health. These infographic templates are designed to present essential information about nutrition and healthy eating habits. These infographics are suitable for nutritionists, dietitians, health educators, or anyone looking to communicate key facts and guidelines about nutrition in a clear and engaging manner. Compatible with Powerpoint, Keynote, and Google Slides, these are fully customizable.


7 diapositivas
Idea Clustering Mind Map Presentation
Great ideas become clearer when you can see how everything connects, and this presentation makes that process effortless. It helps you organize thoughts, group related concepts, and visually map creative themes for planning or strategy discussions. Clean, modern, and easy to customize. Fully compatible with PowerPoint, Keynote, and Google Slides.


3 diapositivas
Organized Bullet Point Summary Presentation
Present key facts clearly with the Organized Bullet Point Summary Presentation. Designed for structured communication, this layout visually breaks down your main points with icons, color blocks, and percentage highlights. Perfect for reporting metrics, comparing ideas, or prioritizing tasks. Fully editable in PowerPoint, Keynote, and Google Slides.


19 diapositivas
Dynamo Product Roadmap Presentation
Introduce your product roadmap with this professional template! Showcase customer pain points, demonstrate how your product solves problems, and provide a detailed product overview. Highlight your competitive analysis, marketing and sales strategy, and distribution channels. Perfect for presenting support information and engaging in Q&A sessions. Compatible with PowerPoint, Keynote, and Google Slides for versatile presentations.


5 diapositivas
Scrum Sprint Planning Presentation
Streamline your workflow presentations with this vibrant and intuitive Scrum Sprint Planning slide. Featuring a circular sprint cycle and directional flow, it clearly outlines the iterative process from planning to delivery. Perfect for agile teams presenting timelines, team roles, or workflow overviews. Easily customizable and compatible with PowerPoint, Keynote, and Google Slides.


6 diapositivas
Comparative Analysis with Butterfly Chart Presentation
The "Comparative Analysis with Butterfly Chart" presentation template offers a visually striking way to compare and contrast data between two entities, such as Supplier A and Supplier B, across multiple variables. This format is particularly useful for presentations aiming to showcase cost comparisons, performance evaluations, or any side-by-side metric analysis in a concise and impactful way. Each variable is represented by a row of circles, where the color intensity and the number of circles filled can denote different levels of achievement or value, making it clear at a glance where strengths and disparities lie.


34 diapositivas
Founder Startup
A Founder Startup, is a newly established business venture that is typically founded by one or more individuals or groups with an innovative idea, concept, or product. This template is designed to help you create a professional and compelling presentation that showcases your startup and its founders in a impactful way. Compatible with PowerPoint, Keynote, and Google Slides. Included in this template are a variety of pre-designed slides that will help cover different aspects of your startup, such as team introduction, overview, vision and mission, product or service description, market analysis, financials, and more.


24 diapositivas
Kepler Investor Pitch Presentation
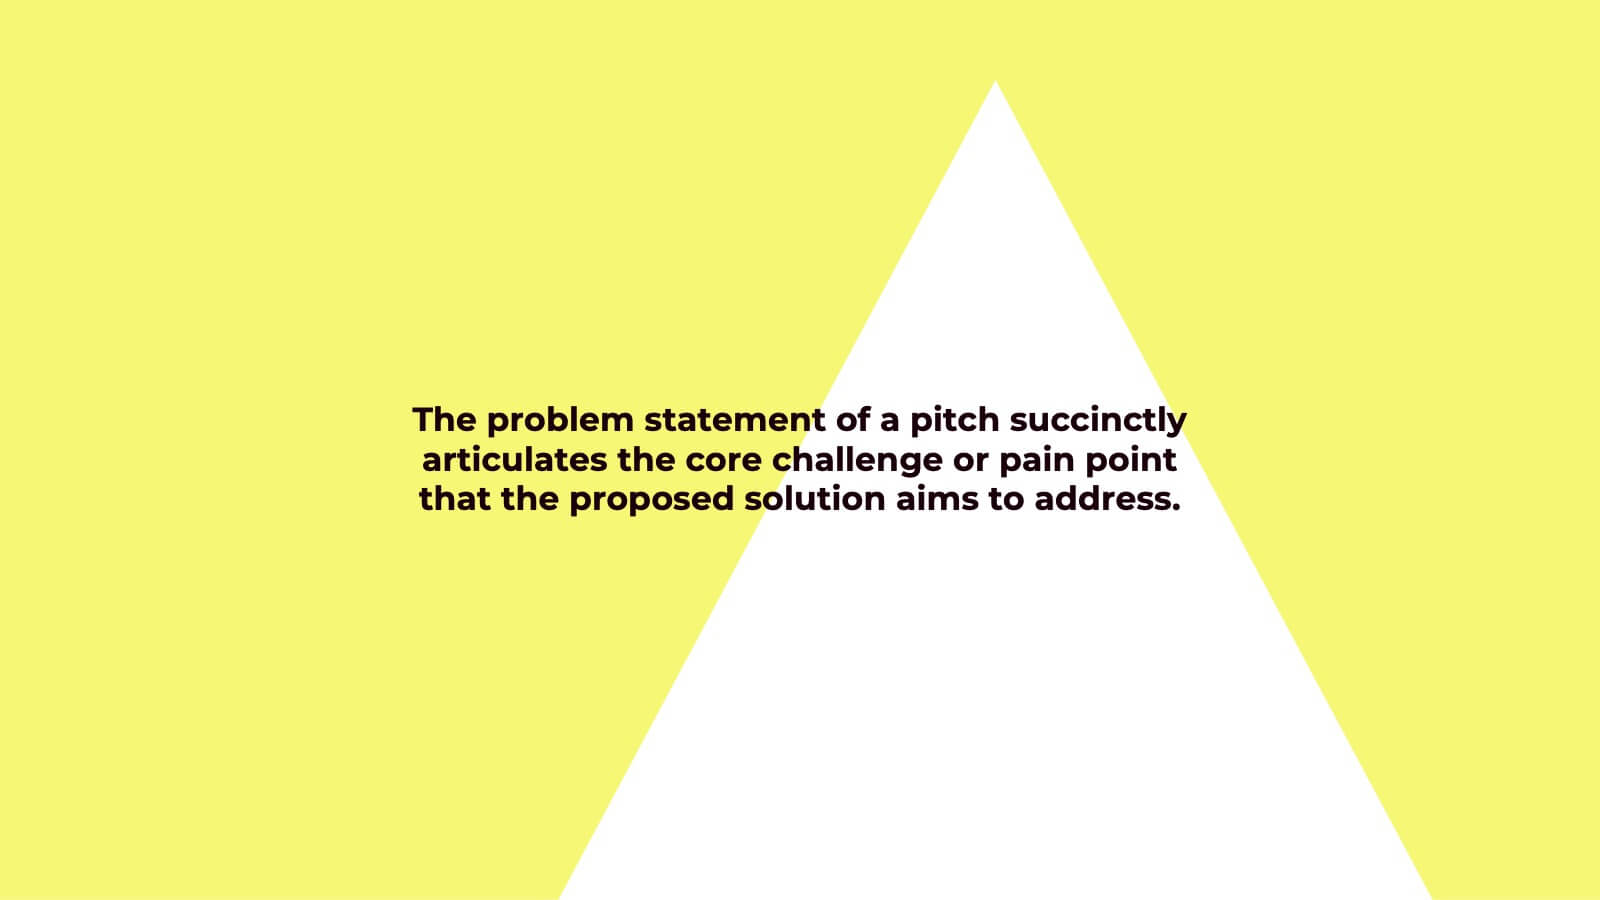
Impress potential investors with this thoughtfully crafted investor pitch presentation template. Its sleek design is tailored to captivate attention while delivering a clear and concise narrative about your business. Highlight key sections, including your company overview, problem statement, and innovative solutions, all designed to set you apart from the competition. Dive deep into your market opportunities, target audience, and revenue model, using visually engaging layouts and infographics. Showcase growth projections, financial overviews, and funding requirements with clarity and professionalism. Additionally, present your unique selling proposition, milestones, and risk analysis effectively. With dedicated slides for team introductions and a compelling close, this template is perfect for startups and established businesses alike. Fully customizable and compatible with PowerPoint, Google Slides, and Keynote, it ensures seamless branding and adaptability for any presentation. Engage your audience and secure the investment you need!


5 diapositivas
Startup Business Plan Presentation
Launch your ideas with clarity using this Startup Business Plan slide template. The rocket-inspired visual guides your audience through five strategic stages, each labeled with editable icons and titles—perfect for pitching goals, financials, timelines, or key operations. Ideal for entrepreneurs and early-stage companies, this slide is easy to customize in PowerPoint, Keynote, or Google Slides.


6 diapositivas
Personal Budget Infographic
Budget forecasting is the process of estimating future income and expenses to create a financial plan for an individual, business, or organization. This infographic template is a visual representation of an individual's budget, showcasing their income, expenses, and savings in a clear and easy-to-understand format. This infographic is designed to help individuals manage their finances effectively, make informed financial decisions, and achieve their financial goals. This infographic presents complex financial information in a simplified and accessible manner to help individuals build a solid financial foundation for their future.


8 diapositivas
Market Research Survey Analysis Presentation
Present your Market Research Survey Analysis with this visually engaging template, designed for clear data visualization and insights presentation. Featuring an intuitive infographic layout, this template allows you to highlight key survey findings, customer insights, and strategic takeaways. Fully customizable in PowerPoint, Keynote, and Google Slides, you can adjust colors, edit text, and modify icons to align with your business needs.