


Características


¿Tienes alguna pregunta?
Recomendar


6 diapositivas
Root Cause Breakdown with Impact Lines Presentation
Visualize the path from causes to consequences with the Root Cause Breakdown with Impact Lines Presentation. Designed with a clear horizontal arrow flow and dual-level layout, this slide helps you dissect key issues and their cascading effects. Ideal for risk analysis, incident reviews, and operational strategy meetings. Fully customizable in PowerPoint, Keynote, and Google Slides.


21 diapositivas
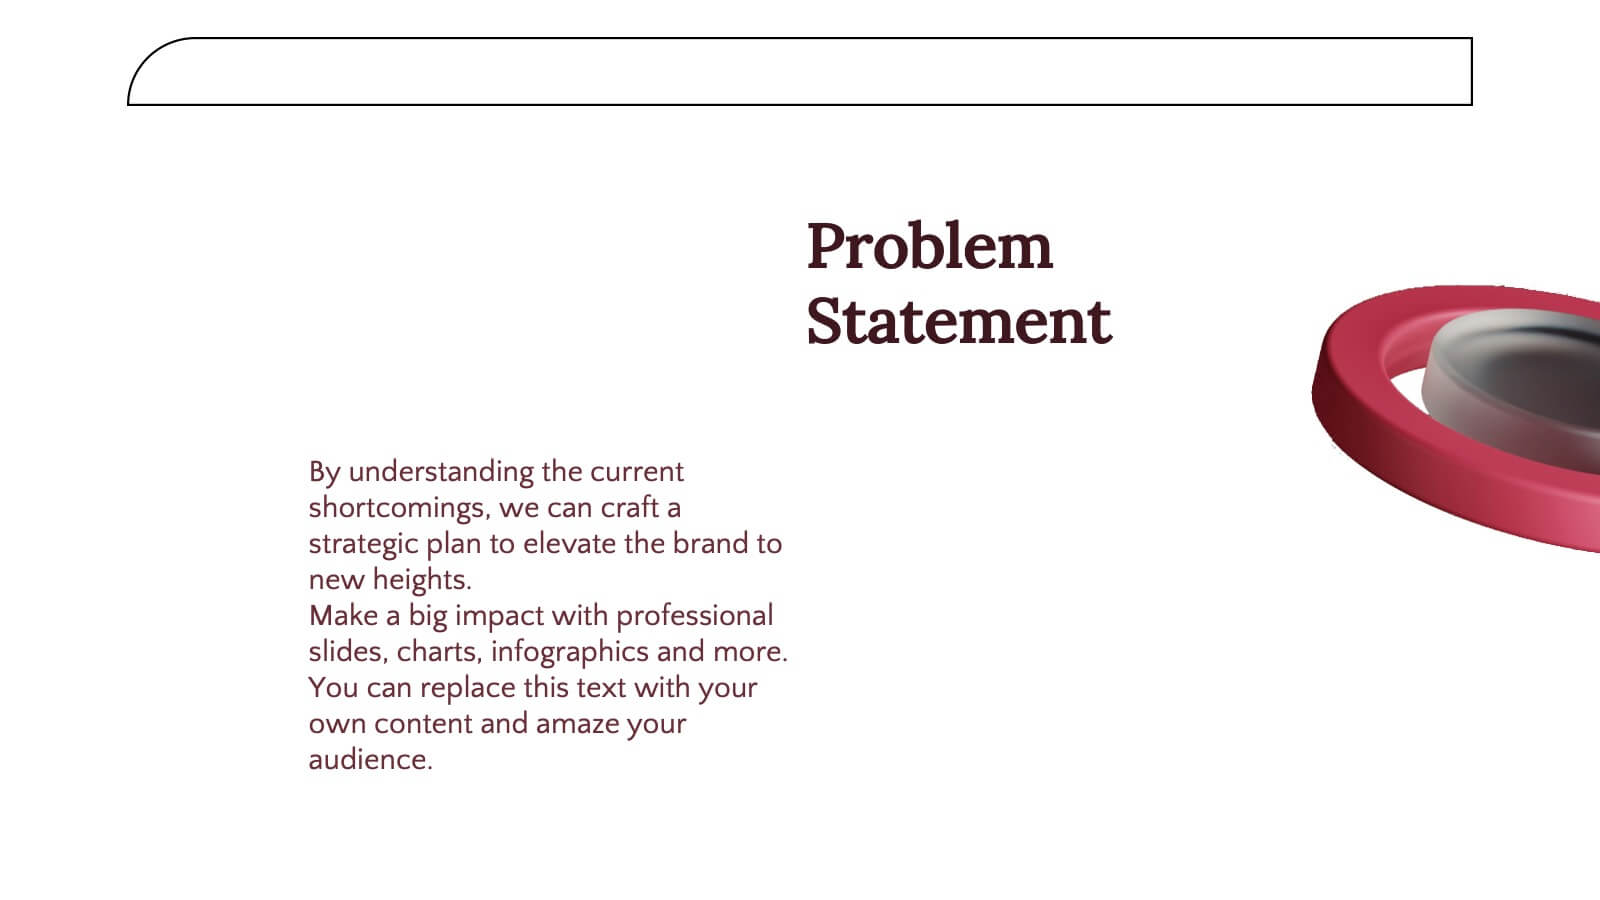
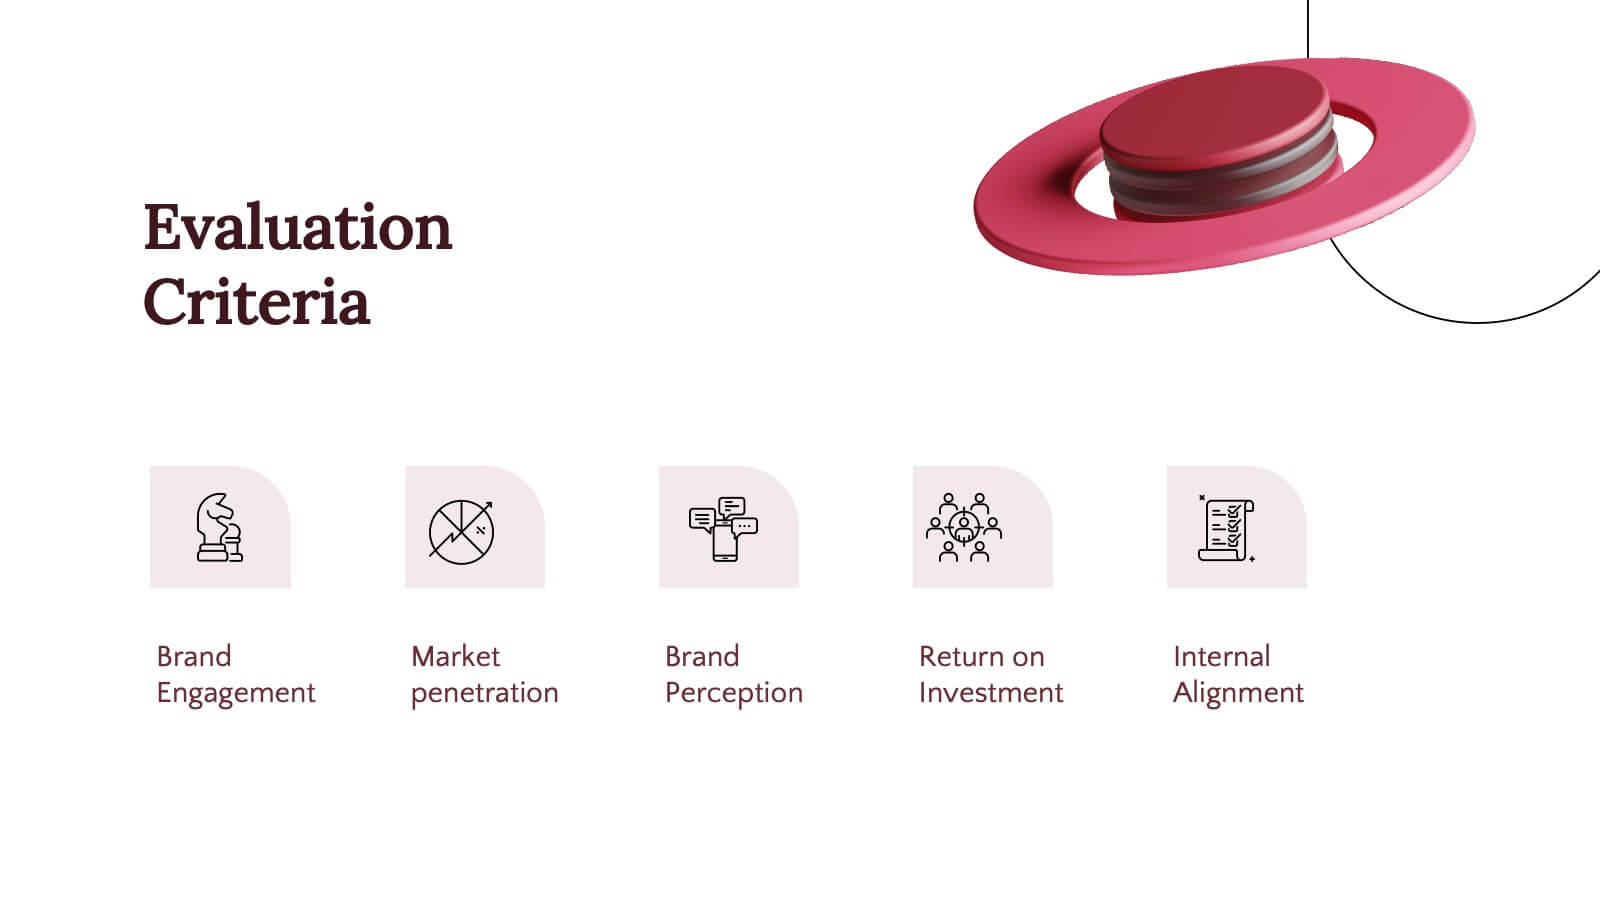
Kelpie Project Timeline Presentation
This sleek project plan template is perfect for outlining deliverables, timeline, budget breakdown, and risk management. Its modern design ensures clarity and professionalism, making it ideal for team or business presentations. Compatible with PowerPoint, Keynote, and Google Slides, it offers flexibility and ease for showcasing your project's key elements.


20 diapositivas
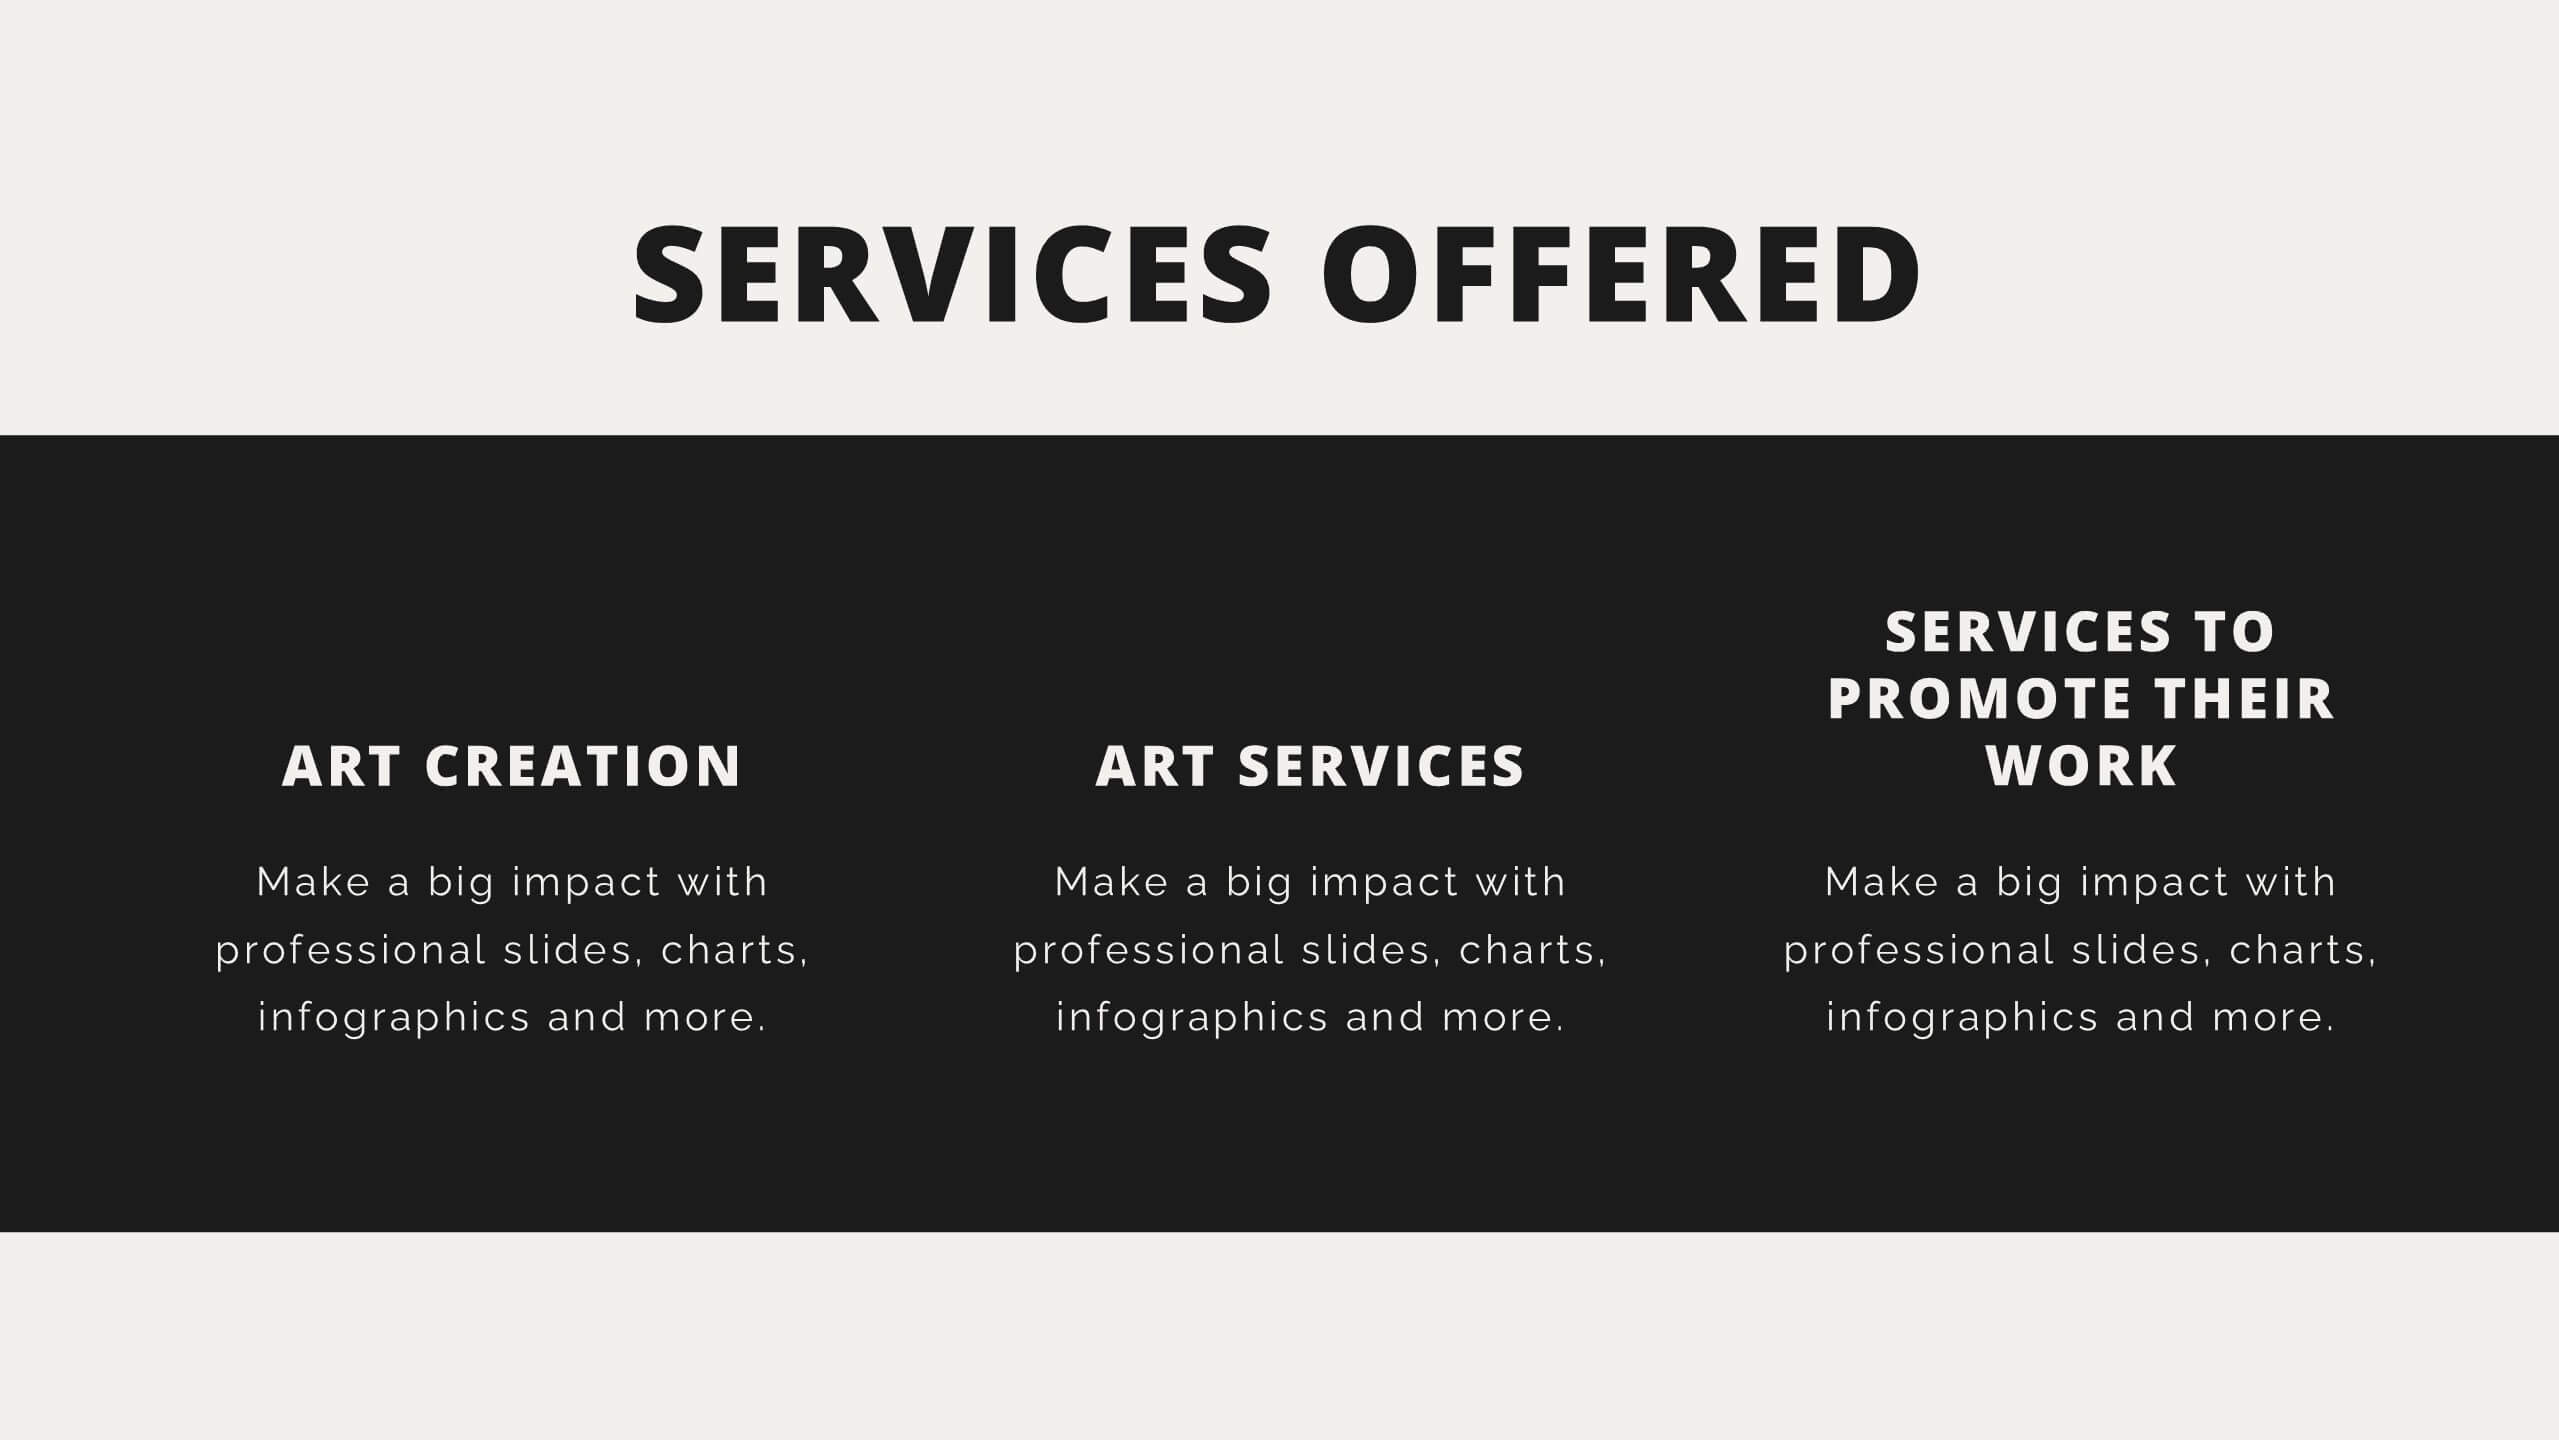
Vesta Photography Portfolio Presentation
Showcase your photography skills with this elegant portfolio template, designed to highlight featured projects, creative process, client testimonials, and services offered. With sections for awards, pricing, and social media links, this template captures your unique style and professionalism. Compatible with PowerPoint, Keynote, and Google Slides for easy customization.


5 diapositivas
USA Trade Map Infographics
A USA Trade Map Infographic is a visual representation of the trade relationships that exist in the United States. This vertical infographic includes a vector or image of the United States map in a vertical orientation, with space for text or data to be included. This design features the maps in a bold, eye-catching color scheme allowing the data and text to stand out. The template also includes additional visual elements such as icons and illustrations to help present data and statistics related to different areas within the United States. Use this to present demographic data, election results, economic indicators, or travel and tourism information.


26 diapositivas
Leyna Presentation Template
Leyna is an elegant and minimalist wedding planner presentation template. This wonderful presentation template will help couples know what all you’ll offer as a wedding planner. We have made it easy for you this this multipurpose template because you will be able to edit easily to make sure it fits what you need. We have built a clean, responsive and modern design for them to have a great experience on what they are looking for in the best way possible. This template provides a professional and clean design for your business or personal use. It's time to impress the potential clients!


6 diapositivas
SEO Strategy and Keyword Mapping Presentation
Streamline your digital strategy with this SEO mapping layout that blends structure and simplicity. Designed to help visualize keyword clusters, content priorities, and search intent stages, this infographic makes complex strategies feel approachable. It’s easy to edit and perfect for presentations in PowerPoint, Keynote, or Google Slides.


5 diapositivas
International Reach World Map Presentation
Bring your global story to life with a clean, modern layout that highlights key regions and data points in a visually engaging way. This presentation helps you showcase international impact, market presence, or worldwide performance with clarity and confidence. Fully compatible with PowerPoint, Keynote, and Google Slides.


7 diapositivas
Business Process in Step-by-Step Presentation
Streamline operations with the Business Process in Step-by-Step presentation. This structured template breaks down complex workflows into clear, actionable steps, enhancing clarity and decision-making. Perfect for project planning, strategy execution, and workflow optimization. Fully customizable in PowerPoint, Keynote, and Google Slides for seamless presentation delivery.


7 diapositivas
Health Program Infographic
Introducing the health program infographic, a visual guide that seamlessly blends informative content with simplicity, tailored to the needs of health professionals and organizations. This template is designed to elucidate the core elements and steps of any health program, ensuring viewers understand its intricacies and objectives with ease. Set against a pristine white canvas, the infographic employs various shades of calming blue. Intuitive icons punctuate each segment of the infographic, aiding in the comprehension of the health program's various components. Compatible with PowerPoint, Keynote, and Google Slides, ensures a clear and concise presentation.


8 diapositivas
Monthly and Weekly Planning Calendar Presentation
Stay ahead of your schedule with this all-in-one monthly and weekly planner template. Designed for professionals and teams who need to balance long-term goals with daily priorities, this presentation offers a 6-week overview, to-do list, notes section, and weekday breakdown. With sleek color-coded tabs and editable labels, it’s perfect for time-blocking, campaign tracking, or event coordination. Easily customizable in PowerPoint, Keynote, and Google Slides.


5 diapositivas
Social Media Management Infographics
Social Media Management refers to the process of creating, scheduling, analyzing, and engaging with content posted on social media platforms on behalf of a business or individual. With these infographic templates, you can effectively communicate social media management strategies, educate your team or clients, and enhance your social media presence to achieve your marketing objectives. These are designed to showcase key concepts, strategies, and best practices for effective social media management. It is a valuable resource for social media managers, digital marketers, and business owners looking to enhance their social media presence and engagement.


6 diapositivas
Business Value Proposition Presentation
Ignite your strategy with this captivating template that highlights your unique business value. This tool breaks down key value propositions, market differentiators, and customer benefits in an engaging format. Perfect for pitching ideas, it clarifies competitive advantages and growth opportunities. Compatible with PowerPoint, Keynote, and Google Slides for seamless presentations.


4 diapositivas
3-Level Tree Chart Presentation
Grow your ideas from concept to execution with this beautifully designed visual layout. Perfect for showcasing layered strategies, hierarchical processes, or business development stages, it balances clarity and creativity through a clean, tree-inspired design. Fully editable and compatible with PowerPoint, Keynote, and Google Slides for seamless professional use.


4 diapositivas
Project Planning in Four Steps Presentation
Streamline your workflow with the Project Planning in Four Steps presentation. This structured slide layout simplifies task organization, milestone tracking, and goal-setting into a clear, four-step process. Perfect for business strategies, project management, and team collaboration. Fully customizable and compatible with PowerPoint, Keynote, and Google Slides for effortless integration.


19 diapositivas
Prism Design Strategy Proposal Presentation
Bring your design strategy to life with this modern and stylish presentation template! Perfect for showcasing your design concepts, processes, and elements, this template ensures that your ideas are communicated effectively. With a sleek layout for design briefs, mood boards, prototypes, and project timelines, it's the ideal tool for creative professionals. Customize it easily in PowerPoint, Keynote, or Google Slides to make a lasting impression on your audience.


7 diapositivas
Business Law Infographic
Demystify the intricate world of business law with our Business Law Infographic. Set against a crisp white backdrop, accented with authoritative purple, trustworthy blue, and attention-grabbing yellow, our template encapsulates the gravity and nuance of legalities in the corporate sphere. Furnished with clear-cut infographics, symbolic icons, and pertinent image placeholders, it decodes legal jargon into an easily comprehensible visual format. Precisely crafted for Powerpoint, Keynote, or Google Slides. An indispensable guide for business owners, legal consultants, corporate trainers, or any entity navigating the maze of business legislation.


7 diapositivas
Customer Journey Infographic Presentation Template
A Customer Journey Infographic is an illustration of the different stages a customer goes through when interacting with a business or organization. It is a way to show the customer's experience with the business or organization, from the initial contact to the post-purchase follow-up. This template is perfect for showing how people interact with your business, the emotions and feedback of your customer at each stage. This template includes lots of photo layouts, charts, and timelines that you can customize to show the different stages a customer goes through on their journey with your business.