


Características


¿Tienes alguna pregunta?
Recomendar


5 diapositivas
Customer Loyalty Program Strategy
Design a winning rewards system with this engaging loyalty program infographic. Featuring a vertical layout with five customizable stages alongside a gift icon, this slide is perfect for outlining incentives, customer tiers, or retention plans. Fully editable in PowerPoint, Keynote, and Google Slides.


7 diapositivas
6 Steps Circle Diagram
Streamline complex processes with our "6 Steps Circle Diagram" template. This visually appealing infographic elegantly organizes interconnected stages in a circular layout, ideal for outlining workflows, development cycles, or project phases. Each segment is color-coded and provides ample space for detailed descriptions, enhancing the clarity and effectiveness of presentations. This format allows viewers to easily grasp relationships and dependencies, improving comprehension and retention. Perfect for educators, project managers, and business analysts, this template ensures that all stages are interconnected and clearly communicated. Compatible with PowerPoint, Keynote, and Google Slides, it's a versatile tool for professional and educational environments.


34 diapositivas
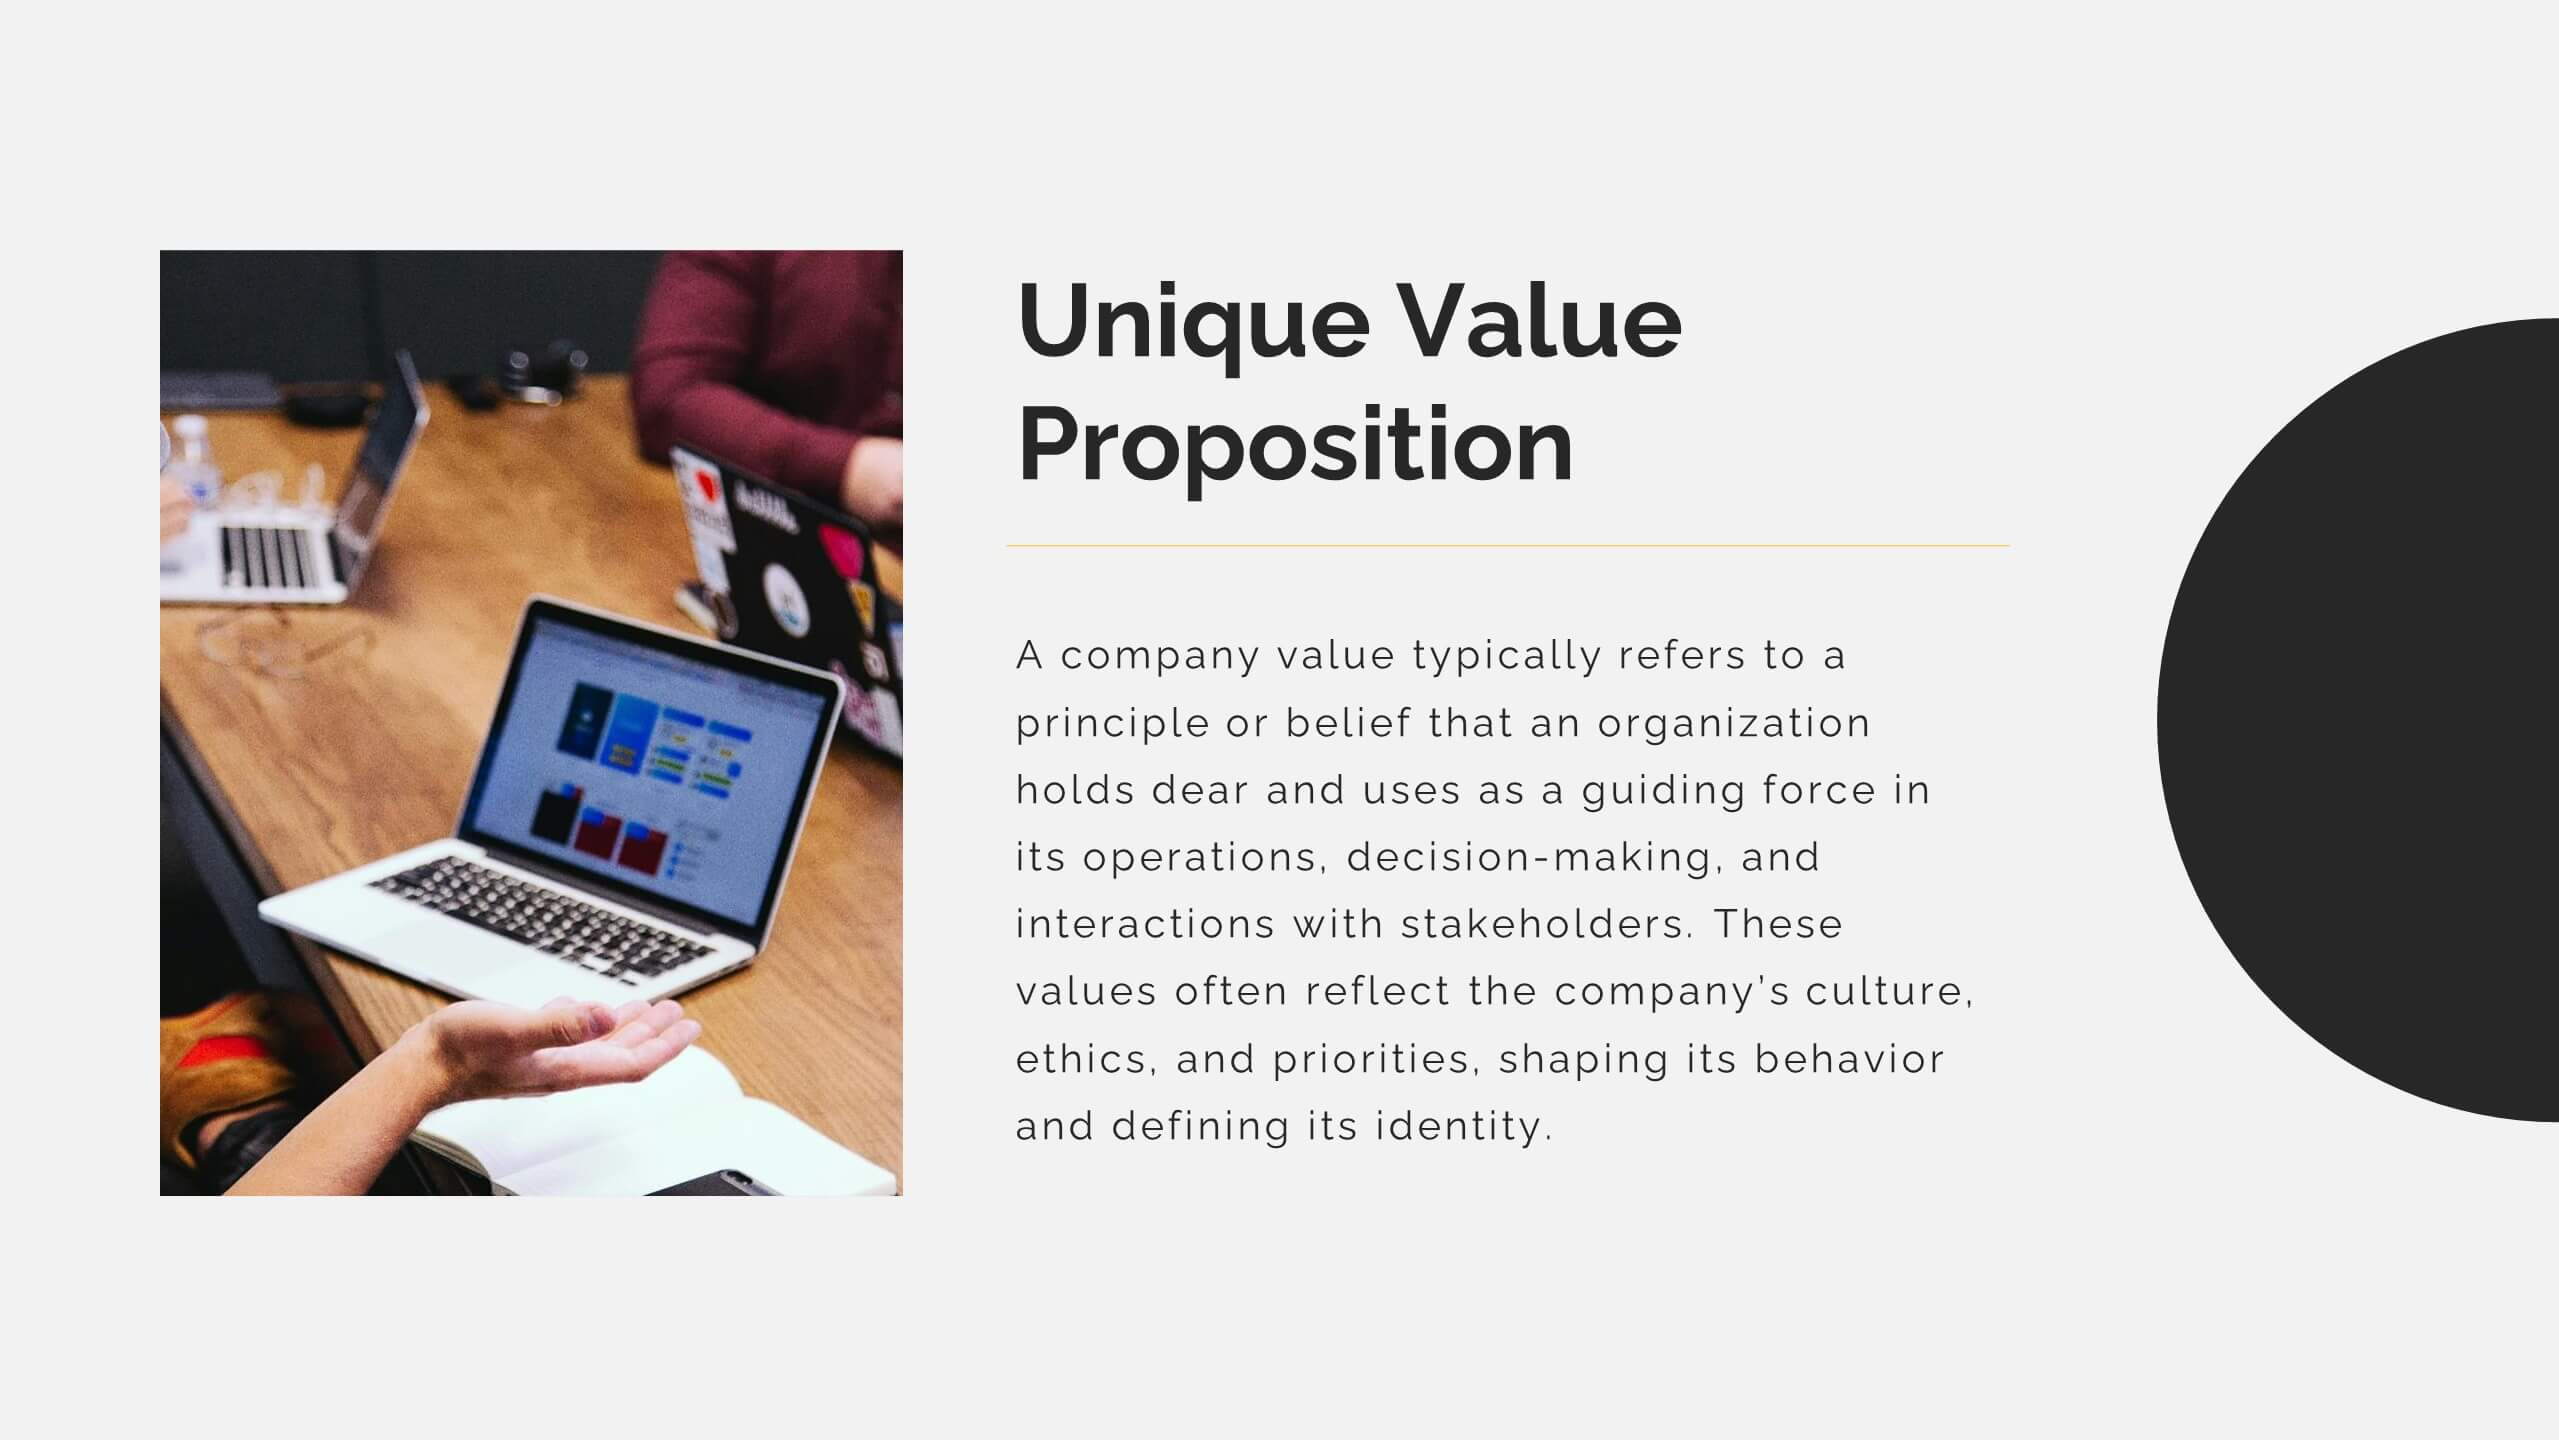
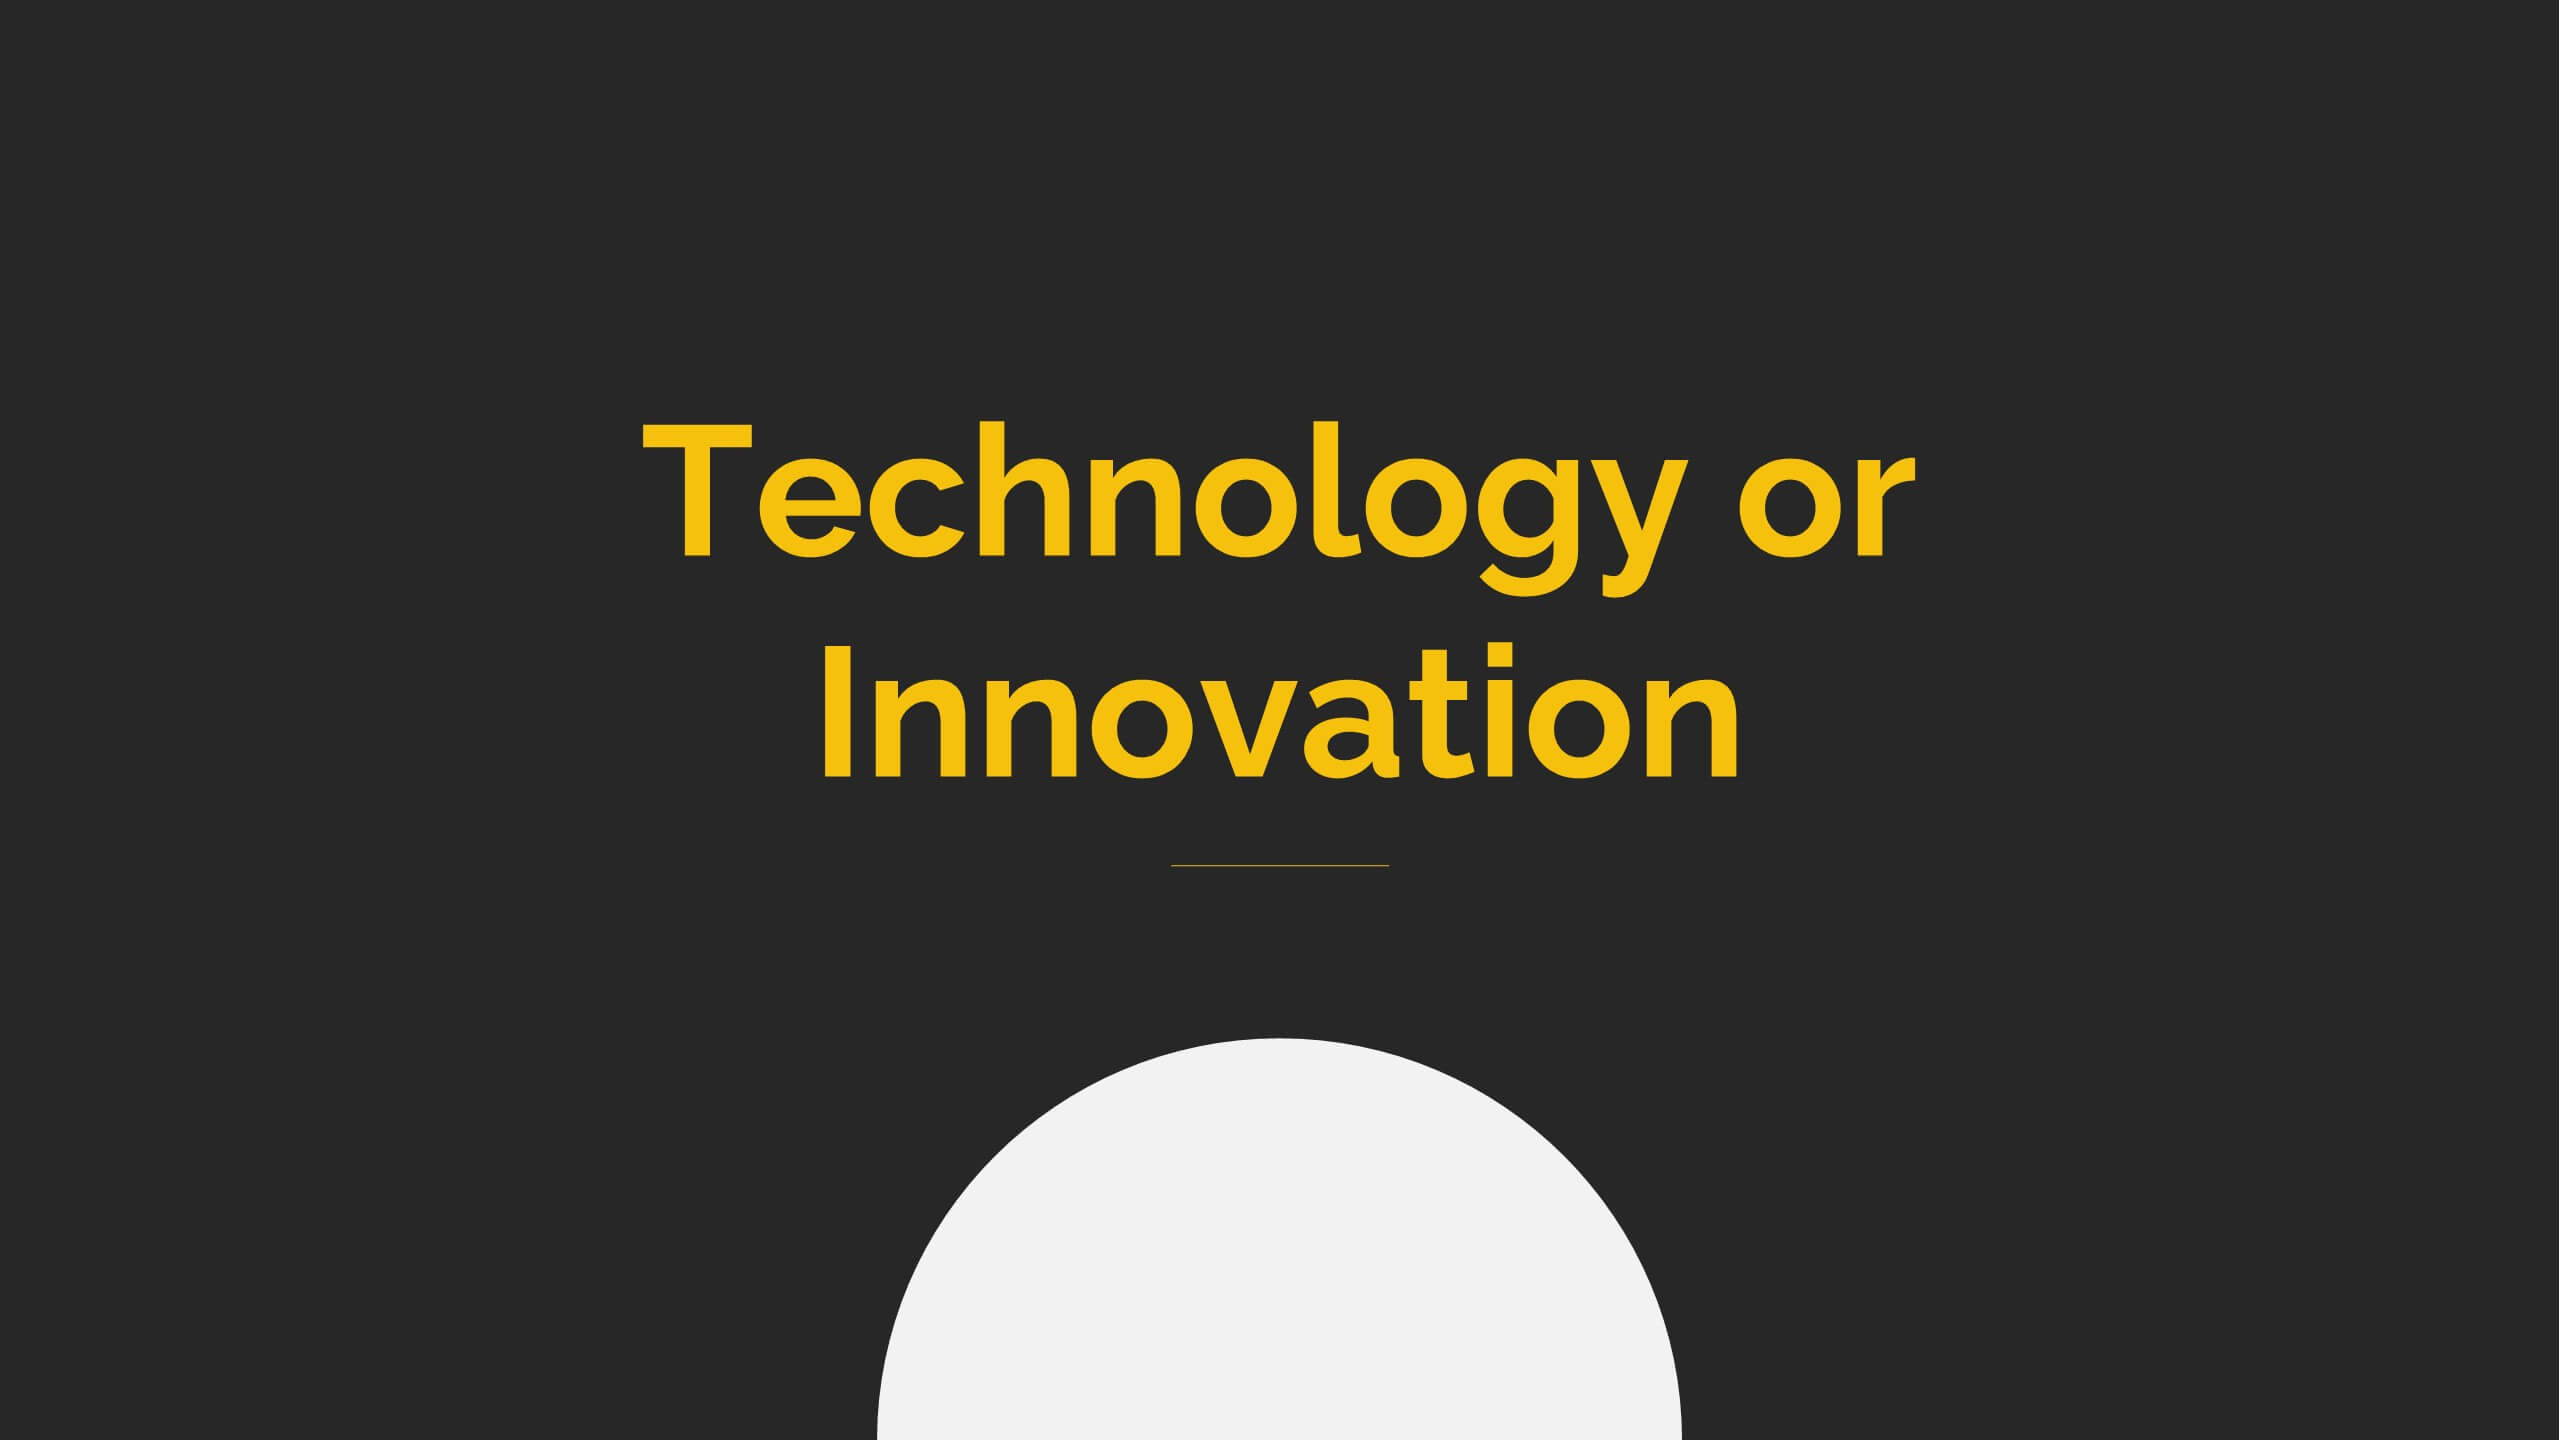
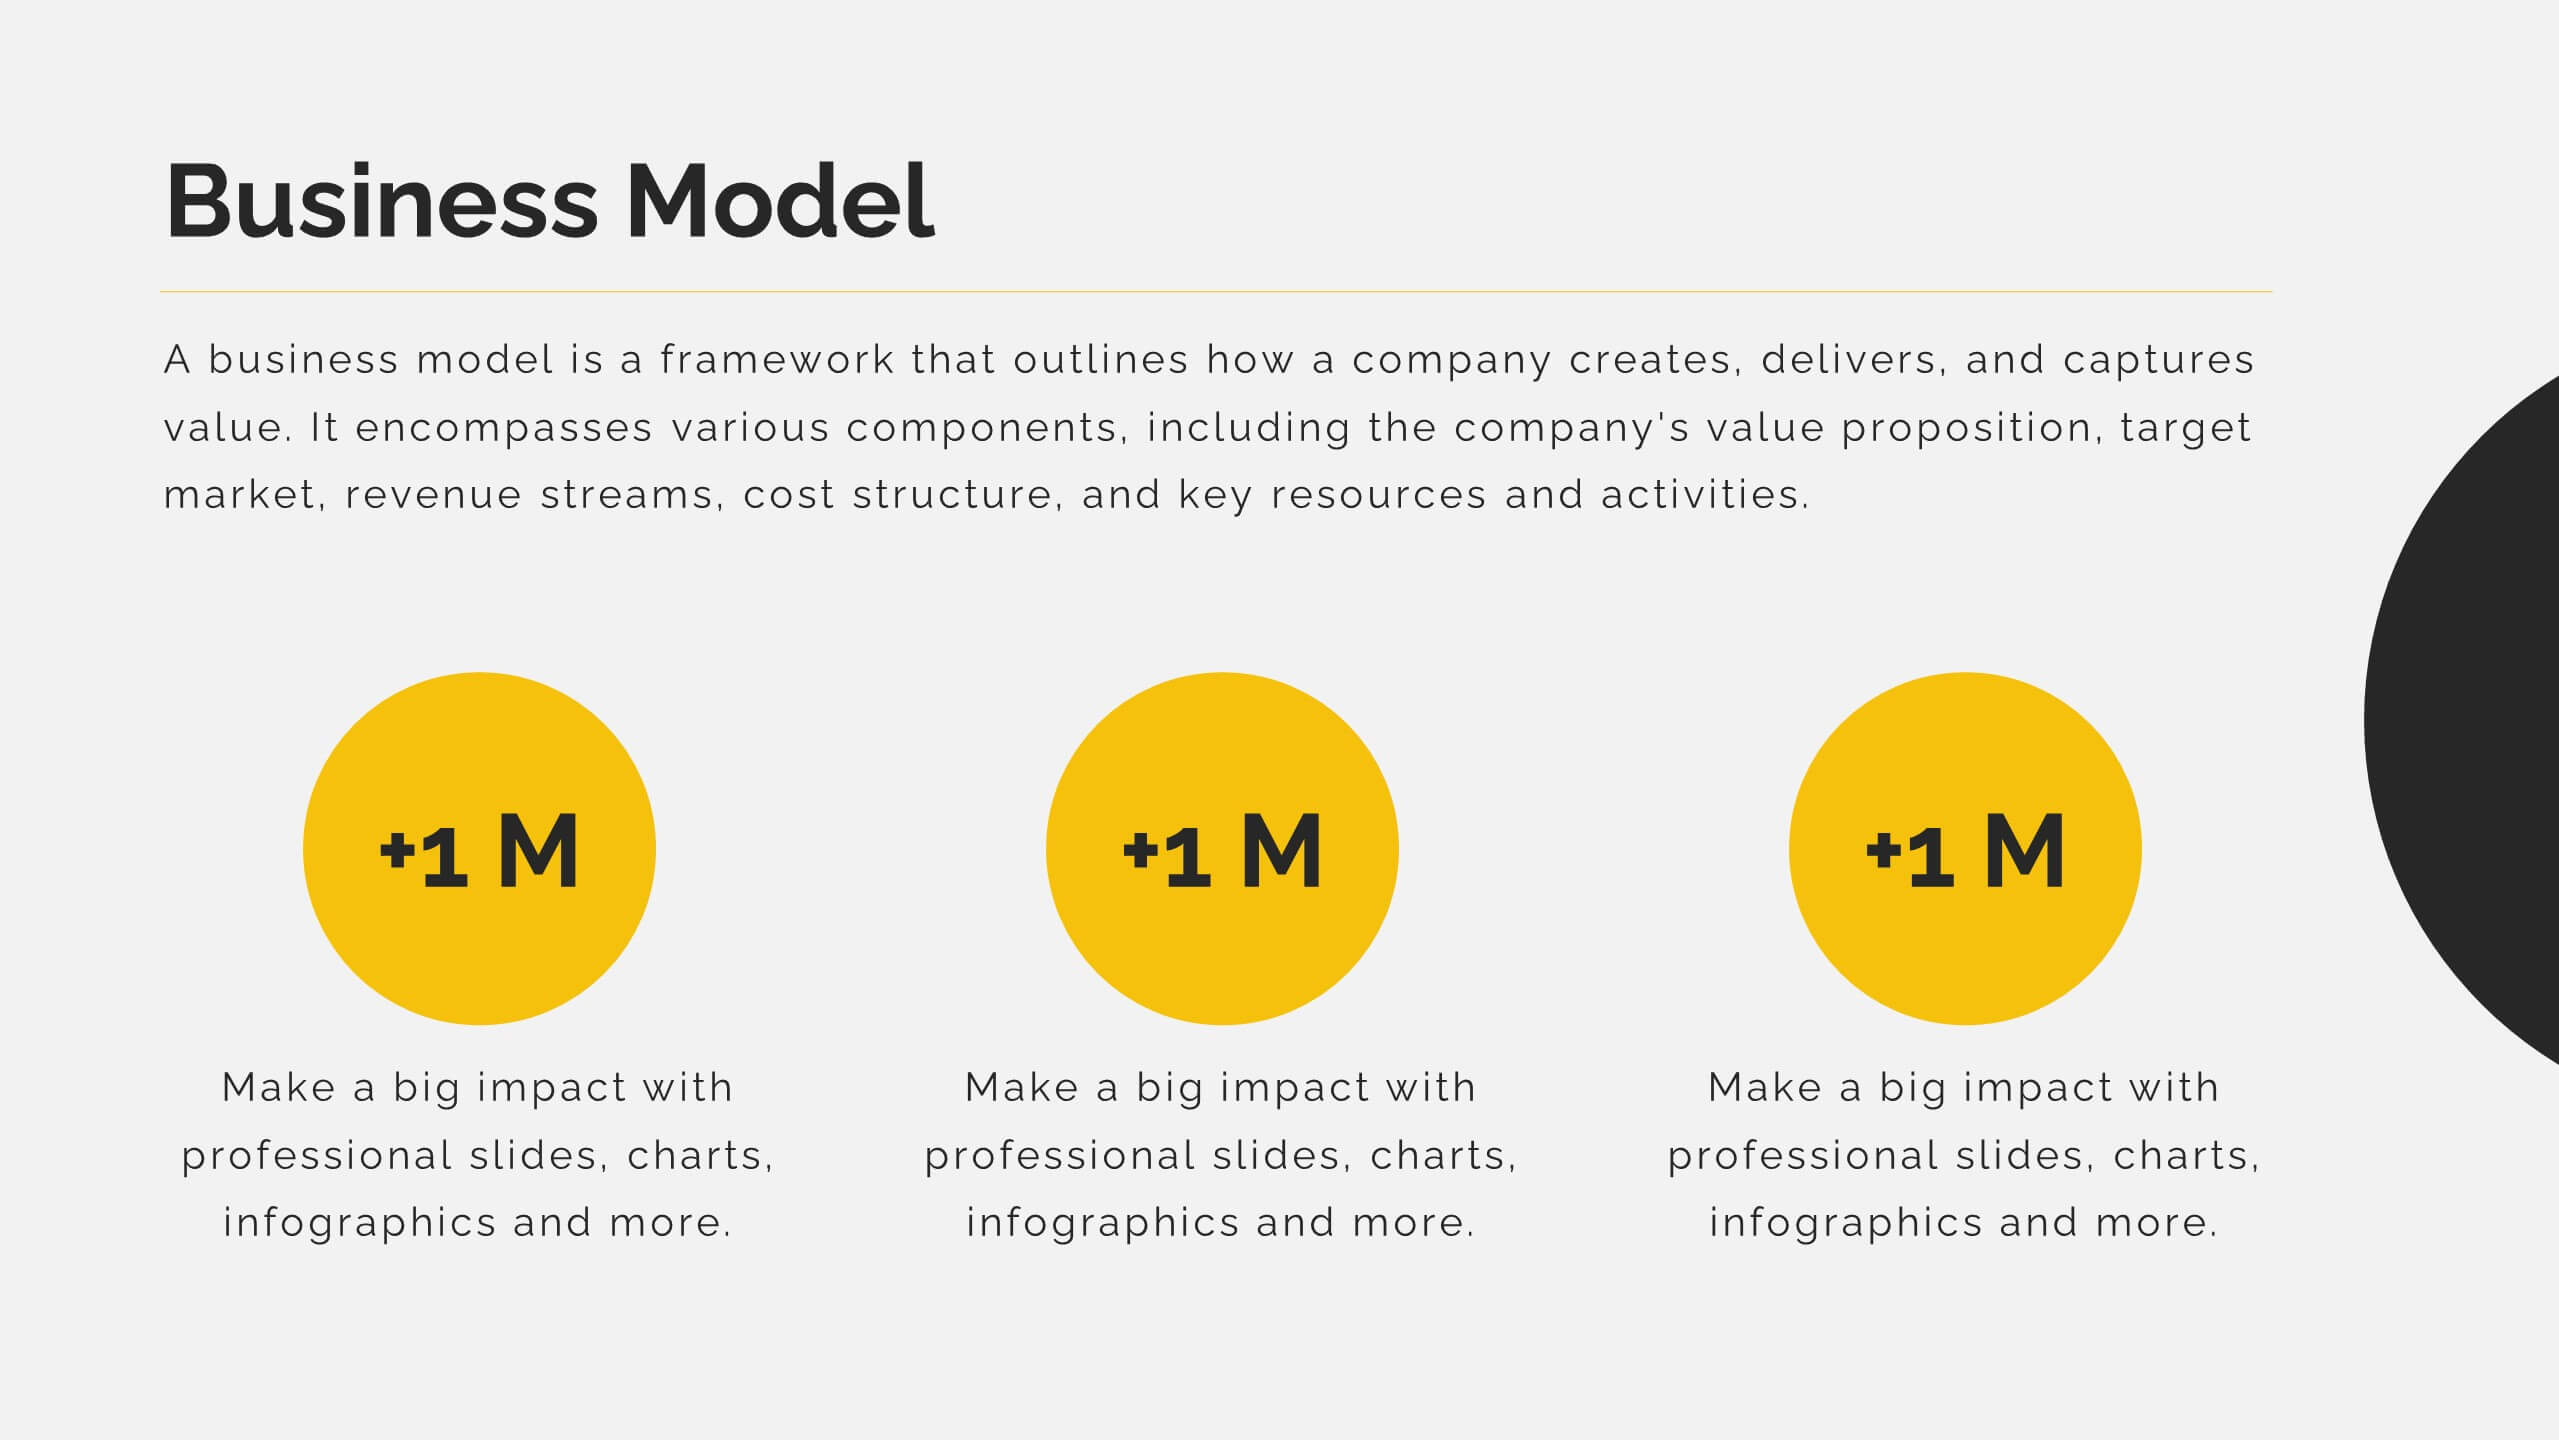
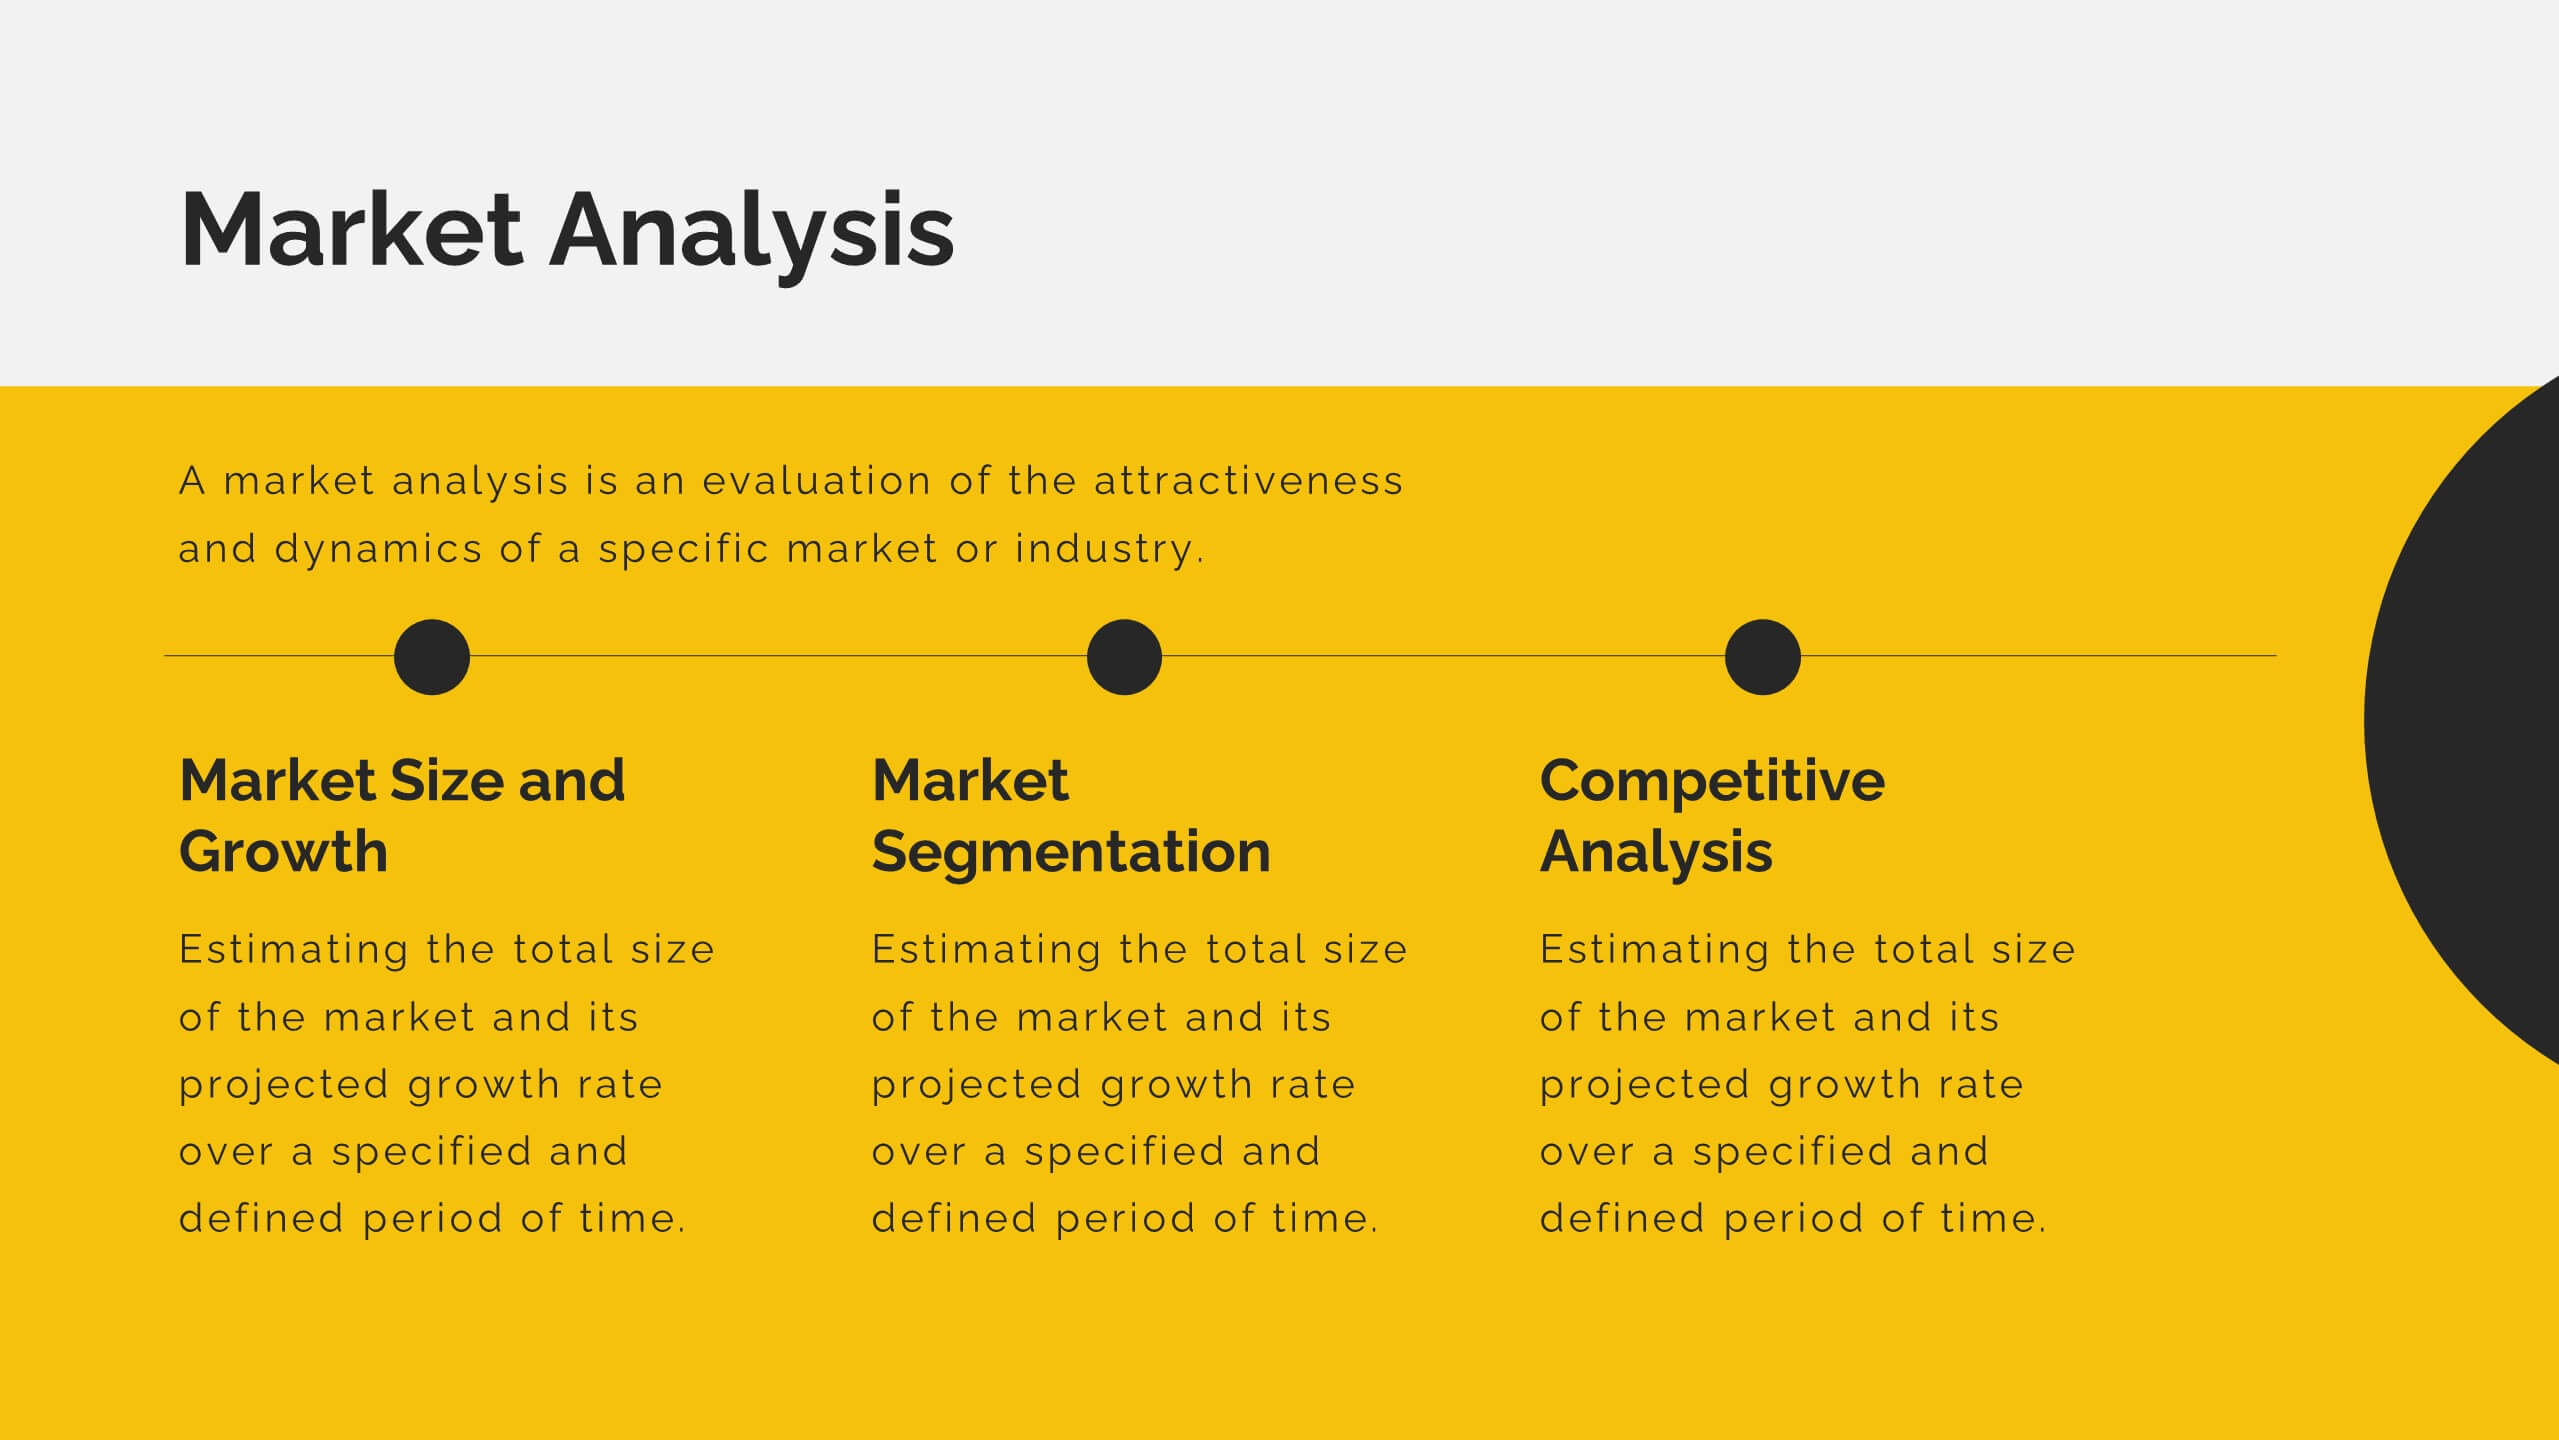
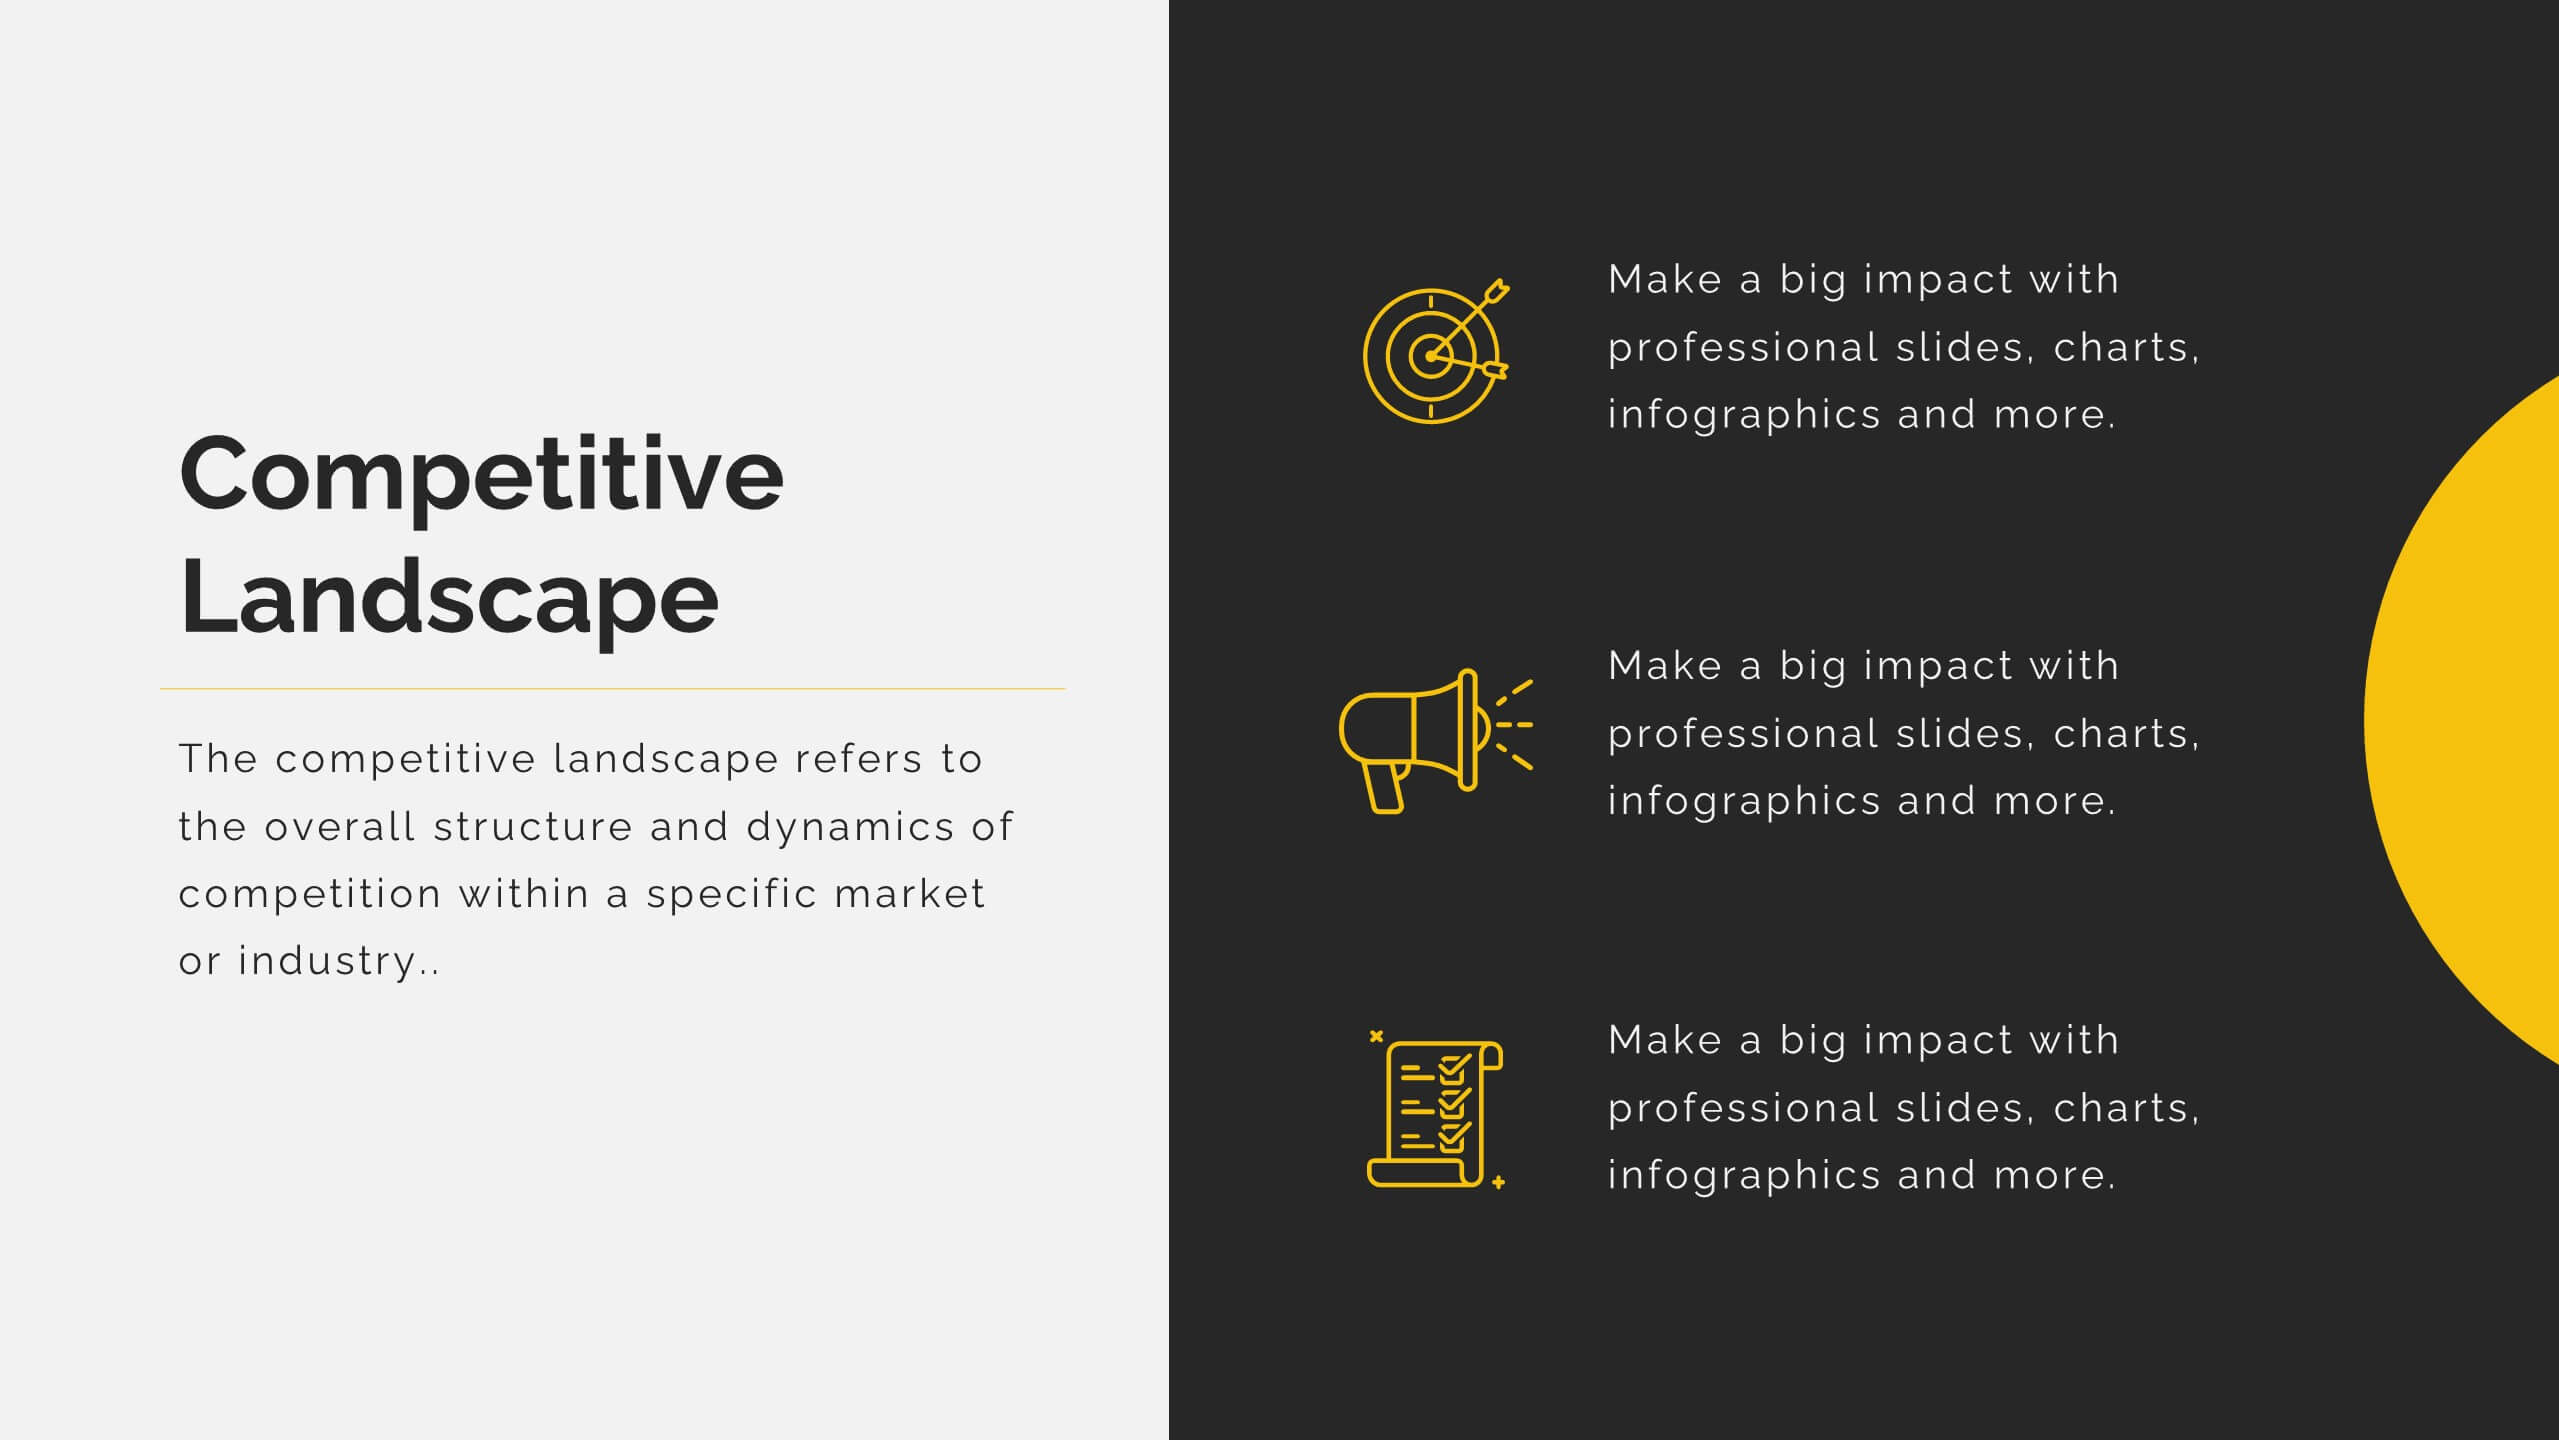
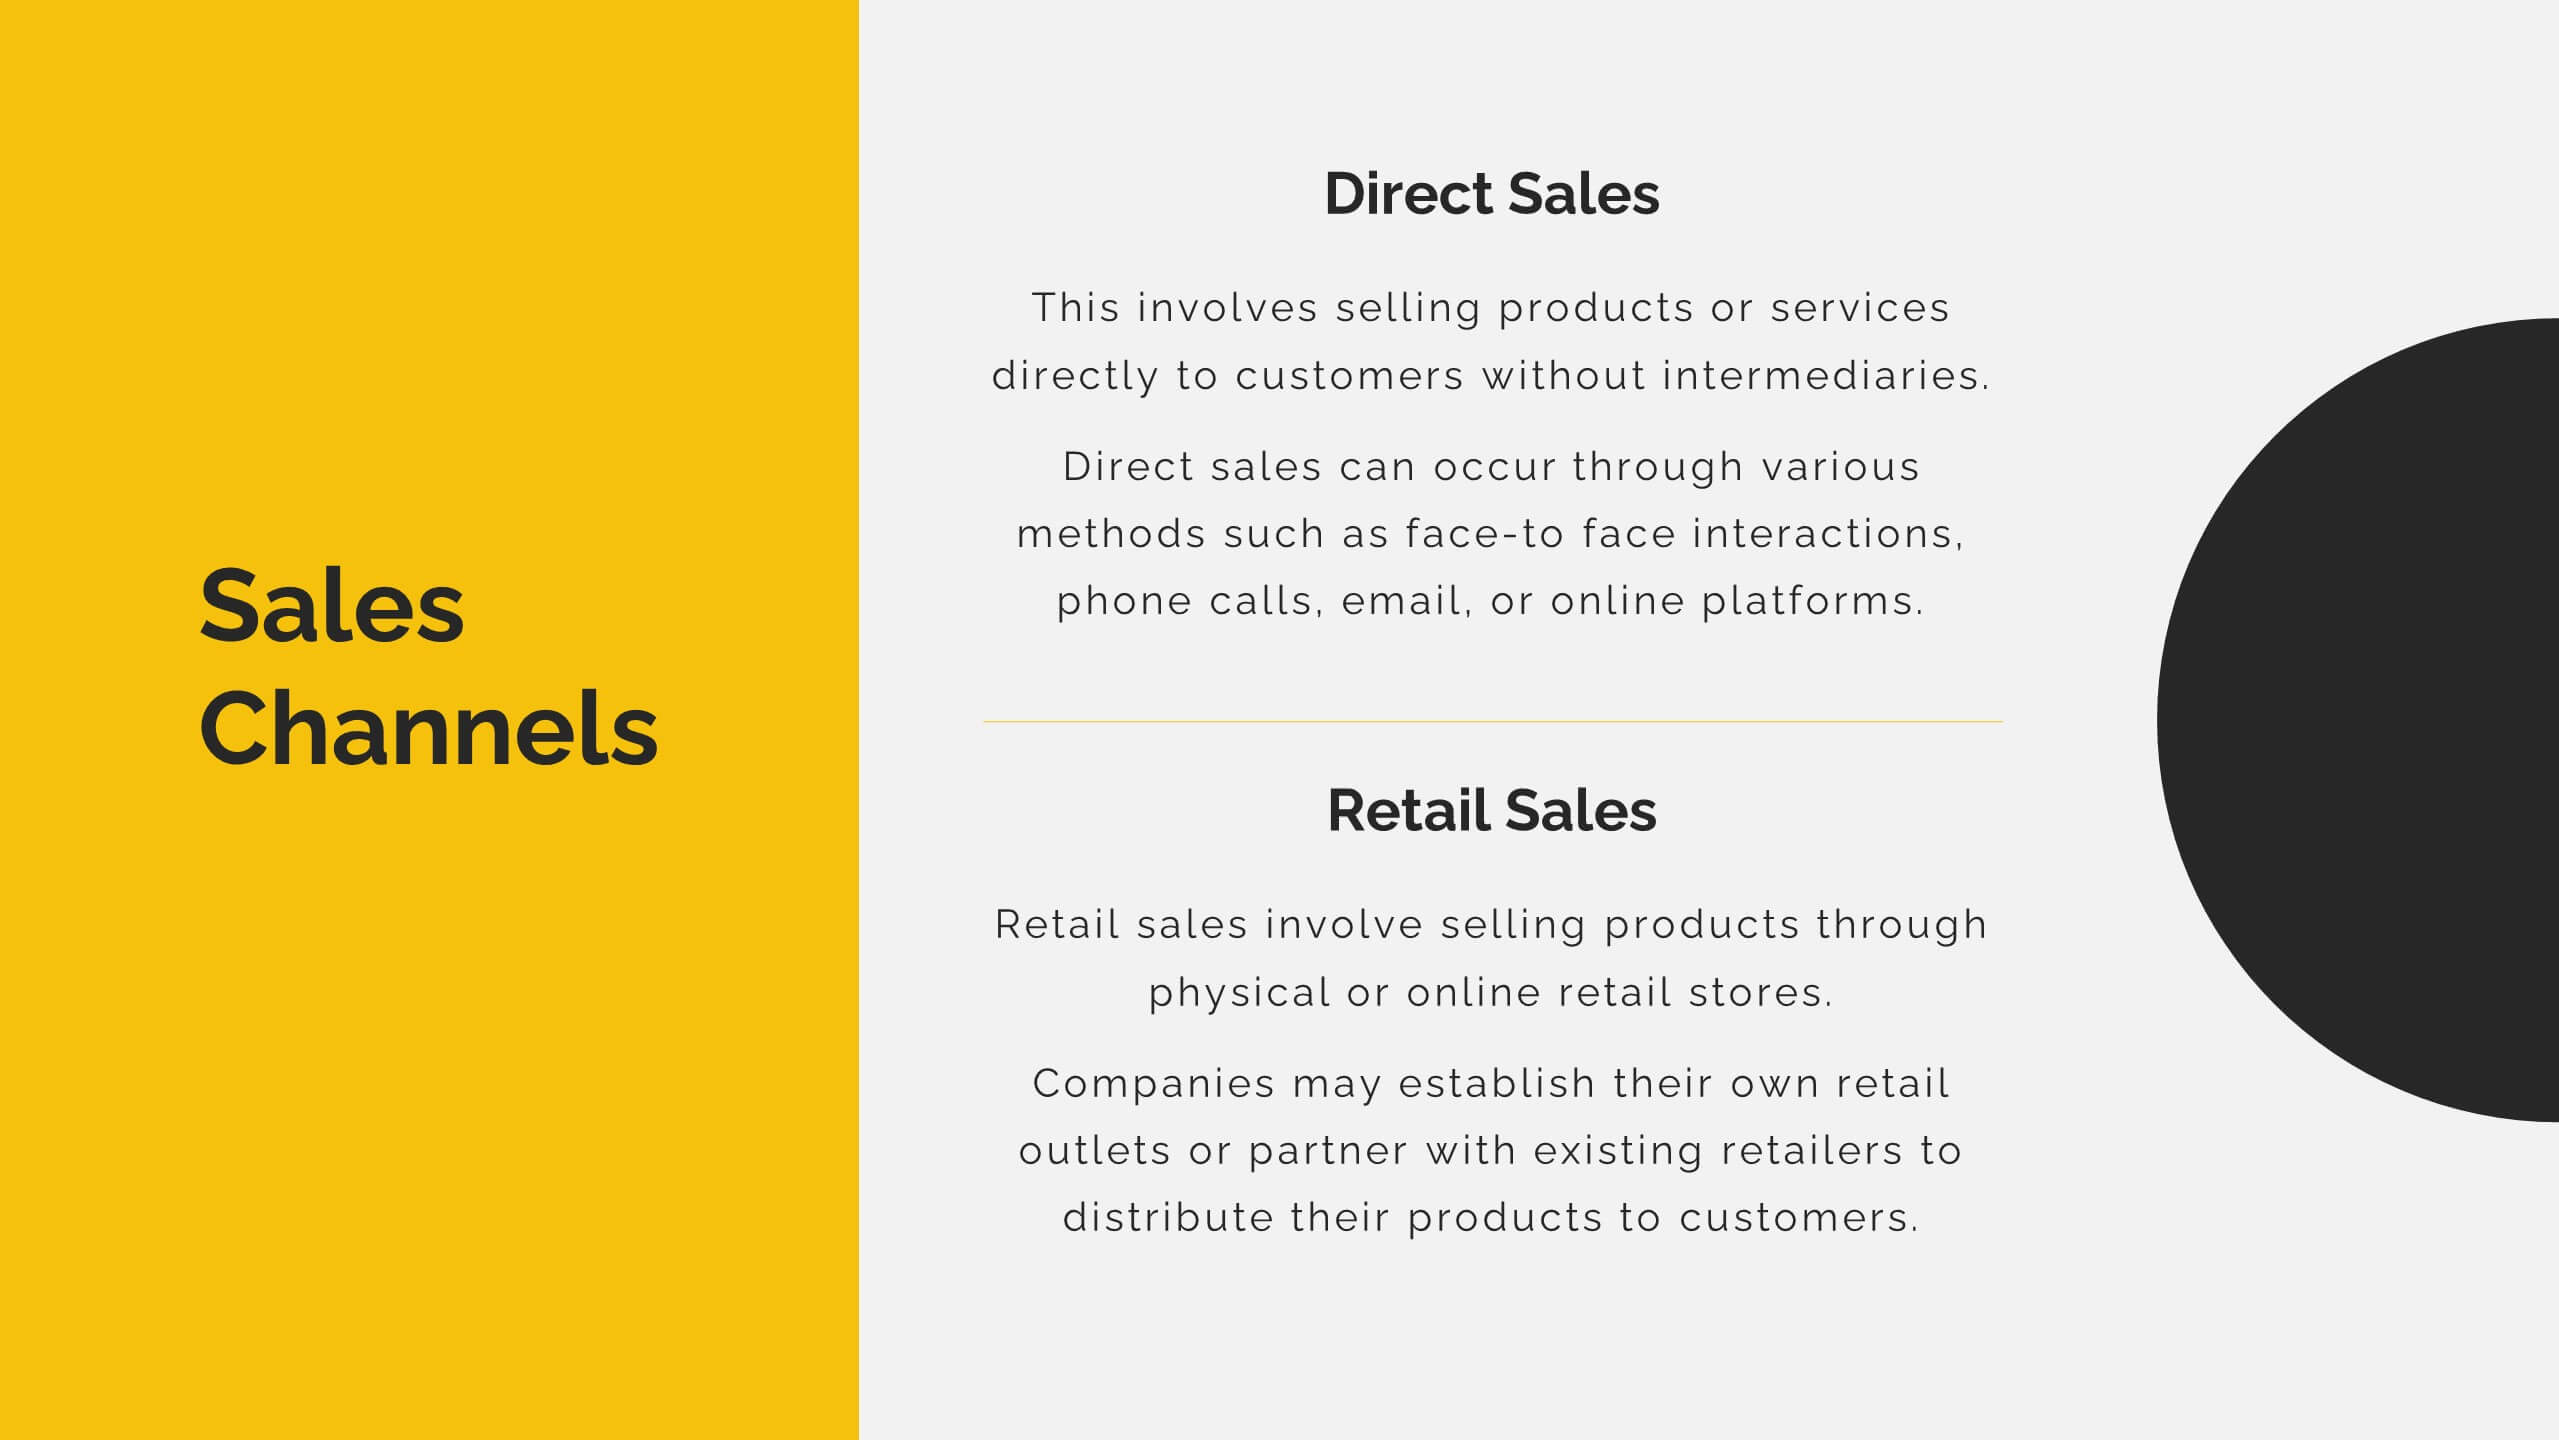
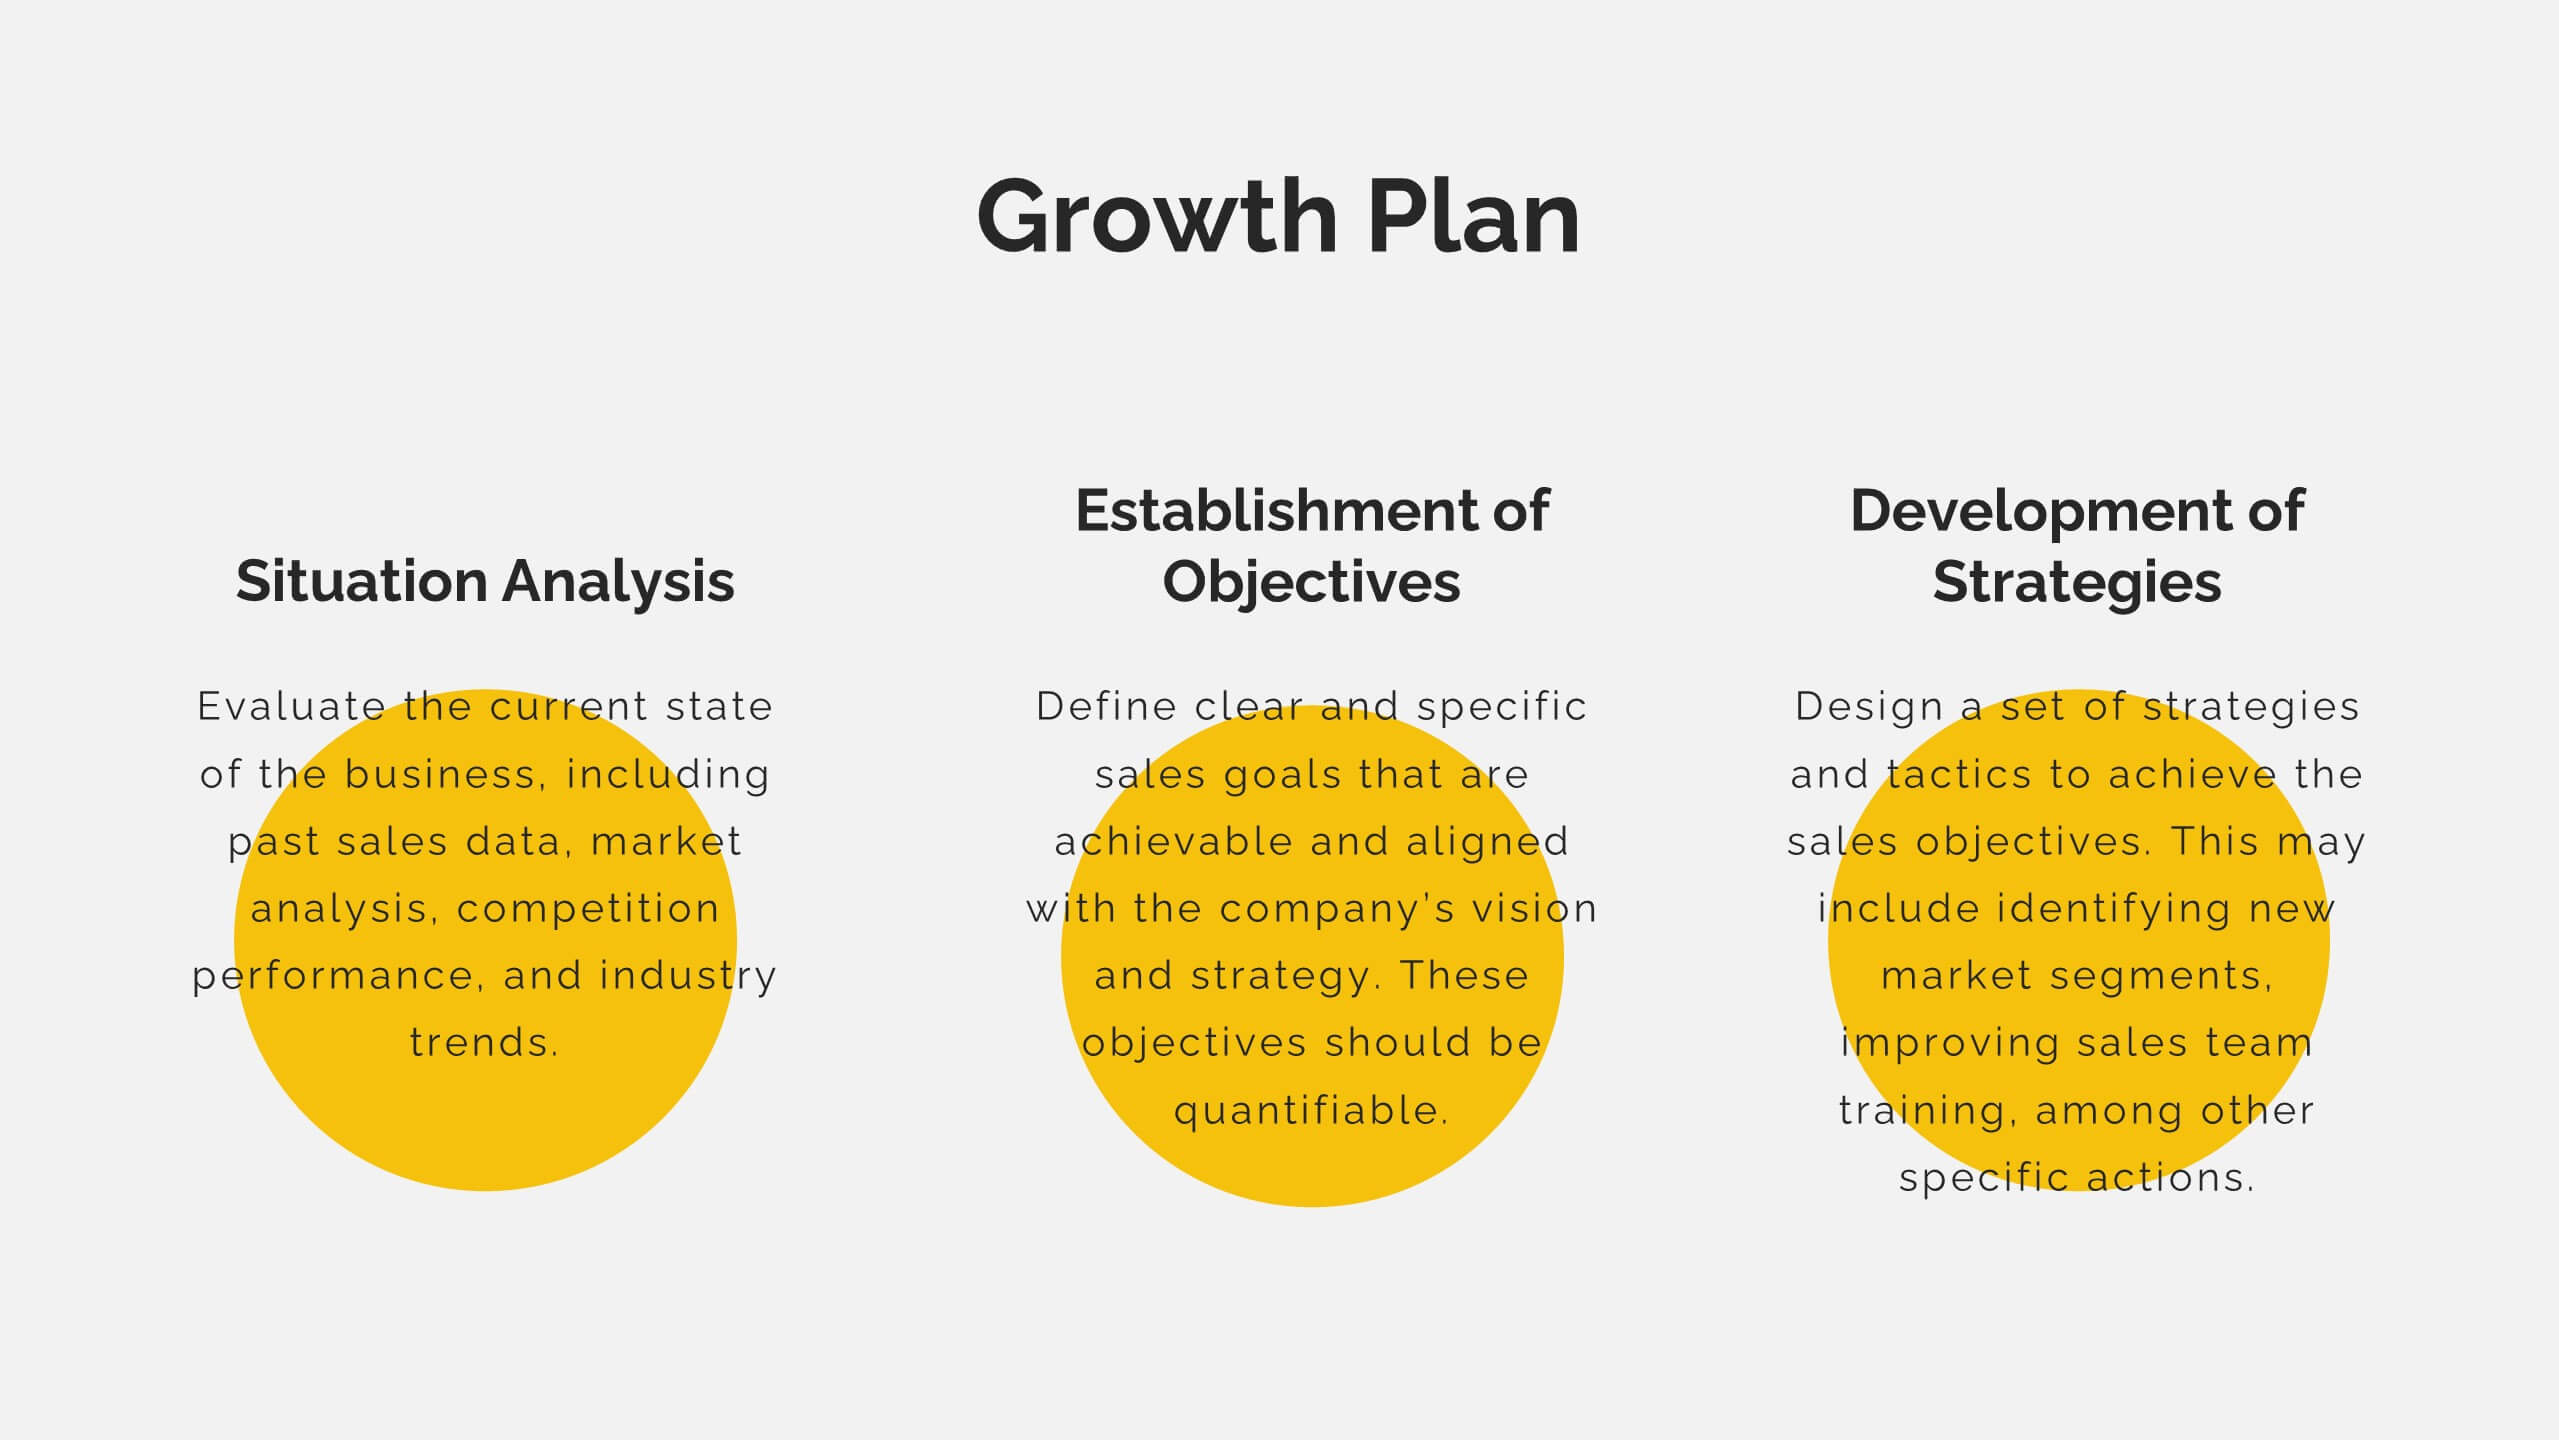
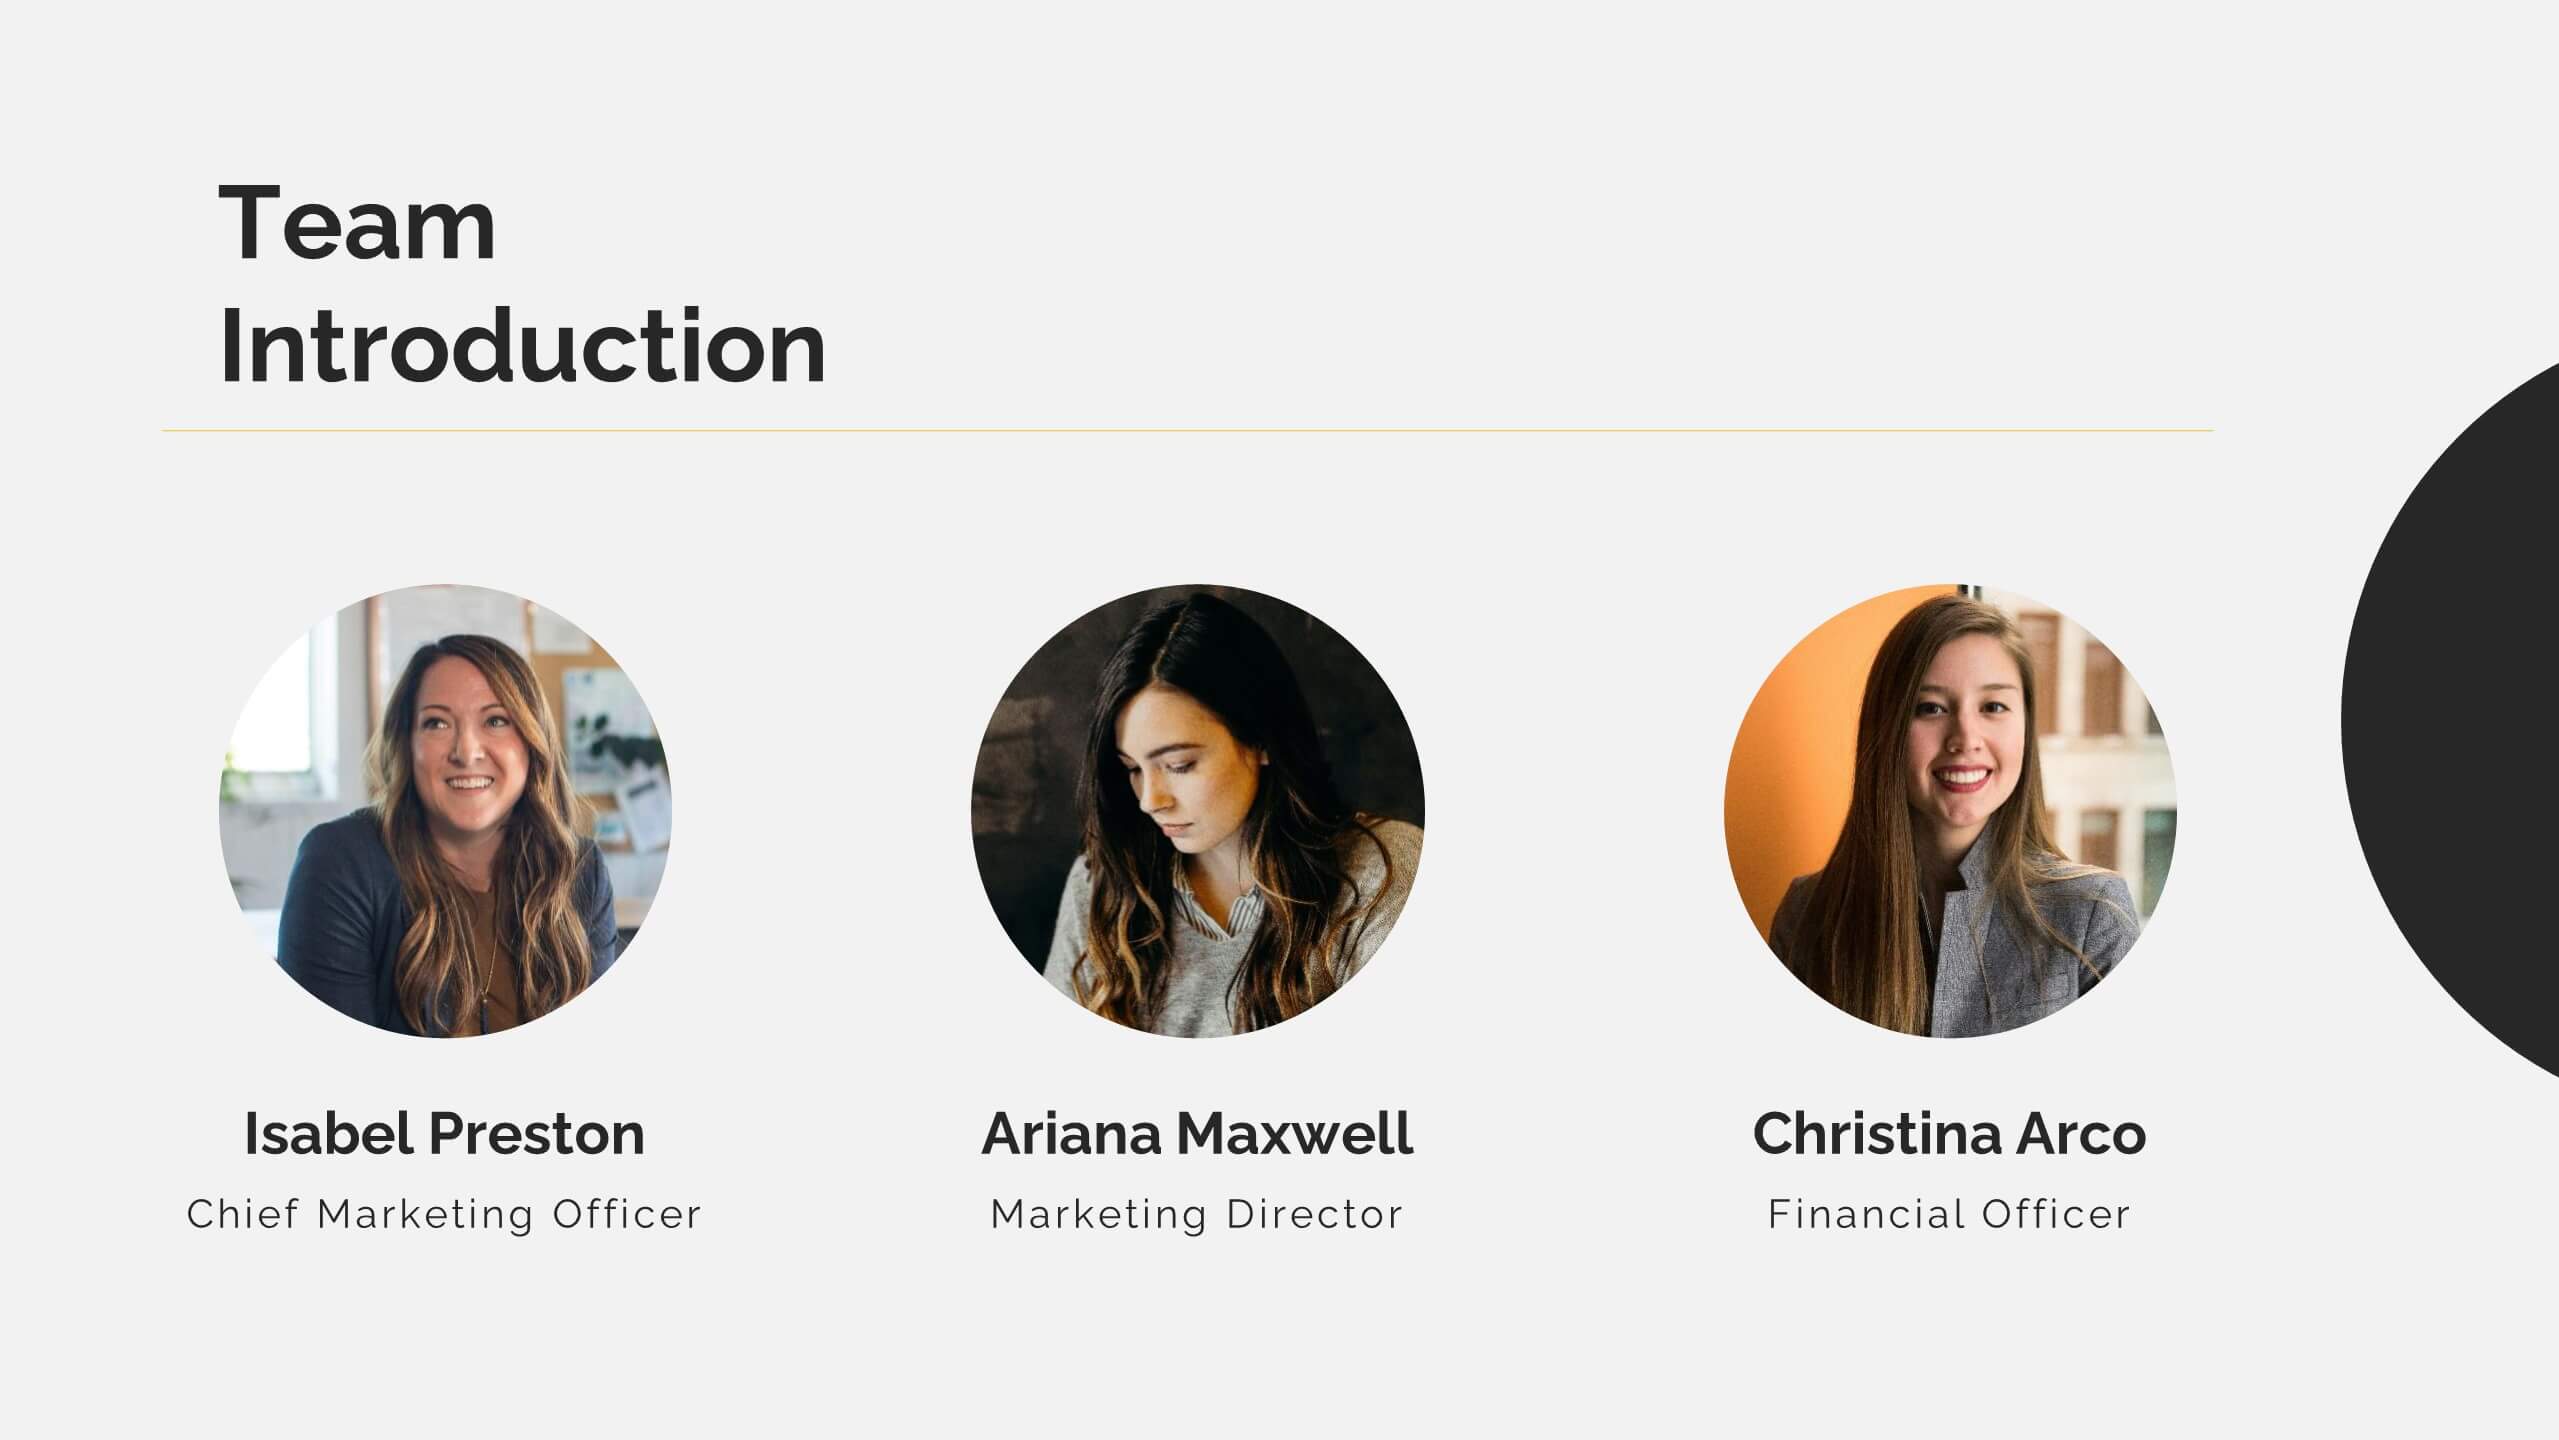
Founder Startup
A Founder Startup, is a newly established business venture that is typically founded by one or more individuals or groups with an innovative idea, concept, or product. This template is designed to help you create a professional and compelling presentation that showcases your startup and its founders in a impactful way. Compatible with PowerPoint, Keynote, and Google Slides. Included in this template are a variety of pre-designed slides that will help cover different aspects of your startup, such as team introduction, overview, vision and mission, product or service description, market analysis, financials, and more.


7 diapositivas
Communication Styles Infographic
Dive into the diverse world of communication with our communication styles infographic. Set against a palette of blue, yellow, and white, this template offers a visual exploration of different communication methods and their nuances. Whether it's assertive, passive, aggressive, or passive-aggressive, understanding these styles is vital in both personal and professional settings. Ideal for corporate trainers, educators, students, or anyone aiming to improve their interpersonal skills. Crafted for clarity and compatibility, this infographic is an excellent addition to PowerPoint, Keynote, and Google Slides, ensuring your presentations resonate with both substance and style.


3 diapositivas
Digital Course Planning and LMS Strategy Presentation
Design your online courses like a pro with this clean, easy-to-follow visual. Ideal for mapping course flow, LMS strategy, and learner journeys, this presentation template breaks down complex processes into digestible steps. Fully customizable and compatible with PowerPoint, Keynote, and Google Slides for flexible e-learning presentation creation.


6 diapositivas
5-Stage Workflow Presentation
Turn complex processes into clear, visual stories with this structured step-by-step layout. Ideal for showcasing project stages, workflows, or development phases, it guides your audience through each milestone with precision and flow. Fully editable and compatible with PowerPoint, Keynote, and Google Slides for easy customization and professional results.


4 diapositivas
Strategic Idea Pitch Presentation
Present your strategic ideas with clarity using this structured Strategic Idea Pitch template. Designed for business professionals and entrepreneurs, it simplifies complex ideas with a visual roadmap. Fully customizable and compatible with PowerPoint, Keynote, and Google Slides, it ensures a polished, persuasive presentation for pitching strategies and innovations effectively.

22 diapositivas
Mirage Startup Funding Proposal Presentation
Secure funding with this dynamic startup proposal template! Perfect for presenting your mission, vision, business model, and market analysis. Ideal for entrepreneurs aiming to impress investors and stakeholders. Compatible with PowerPoint, Keynote, and Google Slides, this template ensures your proposal is clear, professional, and compelling. Achieve your startup goals today!


26 diapositivas
Shadowyn Brand Guidelines Proposal Presentation
Present your branding vision with a polished and professional template designed to capture the essence of your identity. This comprehensive set includes sections for brand values, identity components, and voice and tone, ensuring your message is consistent and memorable. Showcase essential details like color palettes, typography, and imagery with visually engaging slides. Communicate your market position, unique selling proposition, and brand strategy clearly to stakeholders. Dive into consumer personas and brand touchpoints for a deeper connection with your audience. Tailor each slide to align with your branding requirements. Perfect for use in PowerPoint, Google Slides, and Keynote, this template is ideal for creative professionals, marketing agencies, and business leaders aiming to make a lasting impression.


30 diapositivas
Fusoria Brand Guidelines Proposal Presentation
Build a strong and cohesive brand identity with this sleek and professional brand guidelines proposal presentation. Covering essential topics like typography, color palettes, visual direction, and branding principles, this template helps you define and communicate your brand’s essence. Fully customizable and compatible with PowerPoint, Keynote, and Google Slides for a seamless presentation experience.


7 diapositivas
Agile Circle Methodology Infographic Presentation
Agile Methodology is a flexible and adaptive approach to project management that values customer satisfaction, teamwork, and continuous improvement. Our Agile Methodology template is perfect for academic or work presentation projects. This template is super easy to use and works with Powerpoint, Keynote, and Google Slides. It has a minimal design with, bright colors that will keep your audience engaged. With this template, you can learn all about Agile Methodology in a way that is visually appealing. Use this template to see how you and your team work more efficiently and effectively.


21 diapositivas
Shadowrise Product Roadmap Presentation
Plan and present your product journey effectively with this detailed roadmap presentation! It covers key areas like market analysis, product features, use cases, pricing strategies, and distribution channels, ensuring a clear path to success. Perfect for product teams, stakeholders, or investor meetings, this template is fully compatible with PowerPoint, Keynote, and Google Slides.


5 diapositivas
Circular Wheel for Process Flow
Visualize five interconnected stages or phases in a clean, circular layout. Ideal for presenting workflows, continuous cycles, or recurring business processes with clarity and structure. Easily customizable in PowerPoint, Keynote, and Google Slides to match your project needs.


7 diapositivas
Leadership Principles Infographic Presentation
A Leadership Infographic provides information about leadership principles, practices, and strategies. This template has been designed as a tool for presenting complex leadership concepts and ideas, using visual elements such as icons, charts, and diagrams. This infographics can be used to cover a wide range of topics related to leadership, including leadership styles, communication, decision-making, team building, and problem-solving. Use the text boxes and charts to provide information on the qualities and skills of effective leaders, such as empathy, vision, and strategic thinking.


14 diapositivas
Employee Happiness and Workplace Ratings Presentation
Measure and present employee satisfaction with clarity using this Employee Happiness and Workplace Ratings slide. Featuring a colorful semi-circular gauge and supporting percentage breakdowns, this layout is ideal for HR reports, internal surveys, or company culture reviews. Easily highlight key categories like benefits, leadership, or engagement levels. Fully editable in PowerPoint, Keynote, and Google Slides.


6 diapositivas
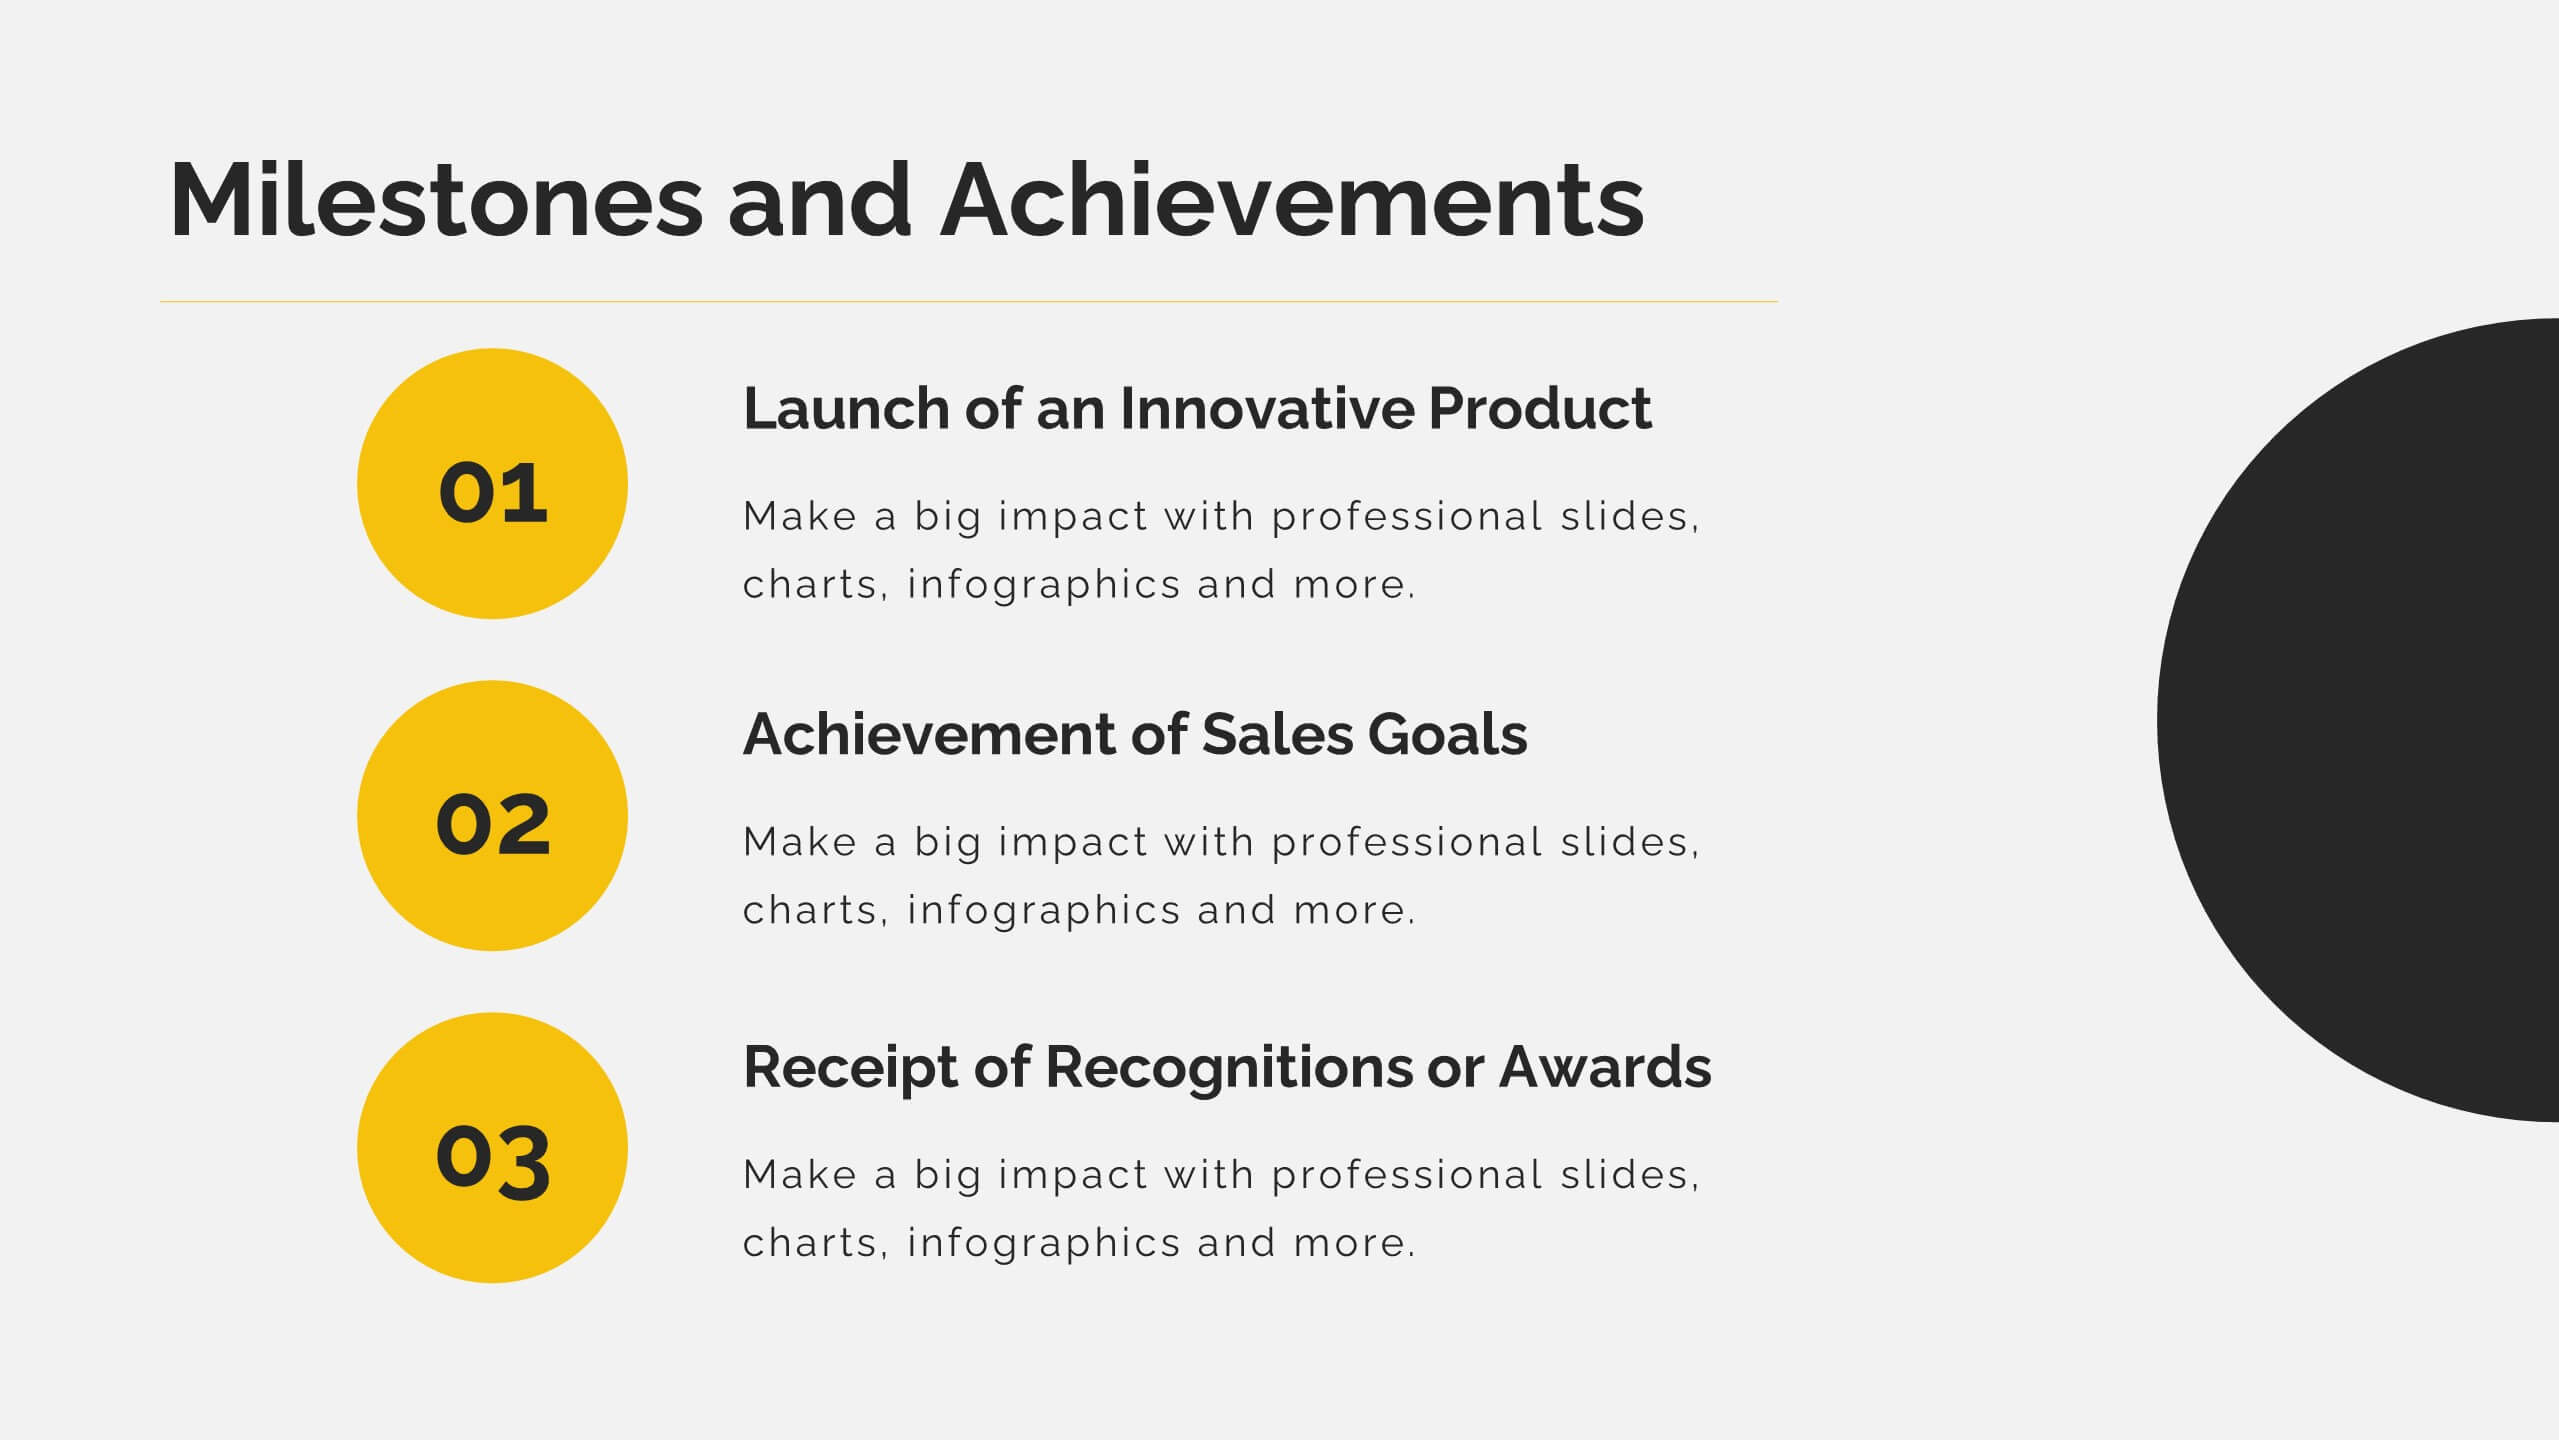
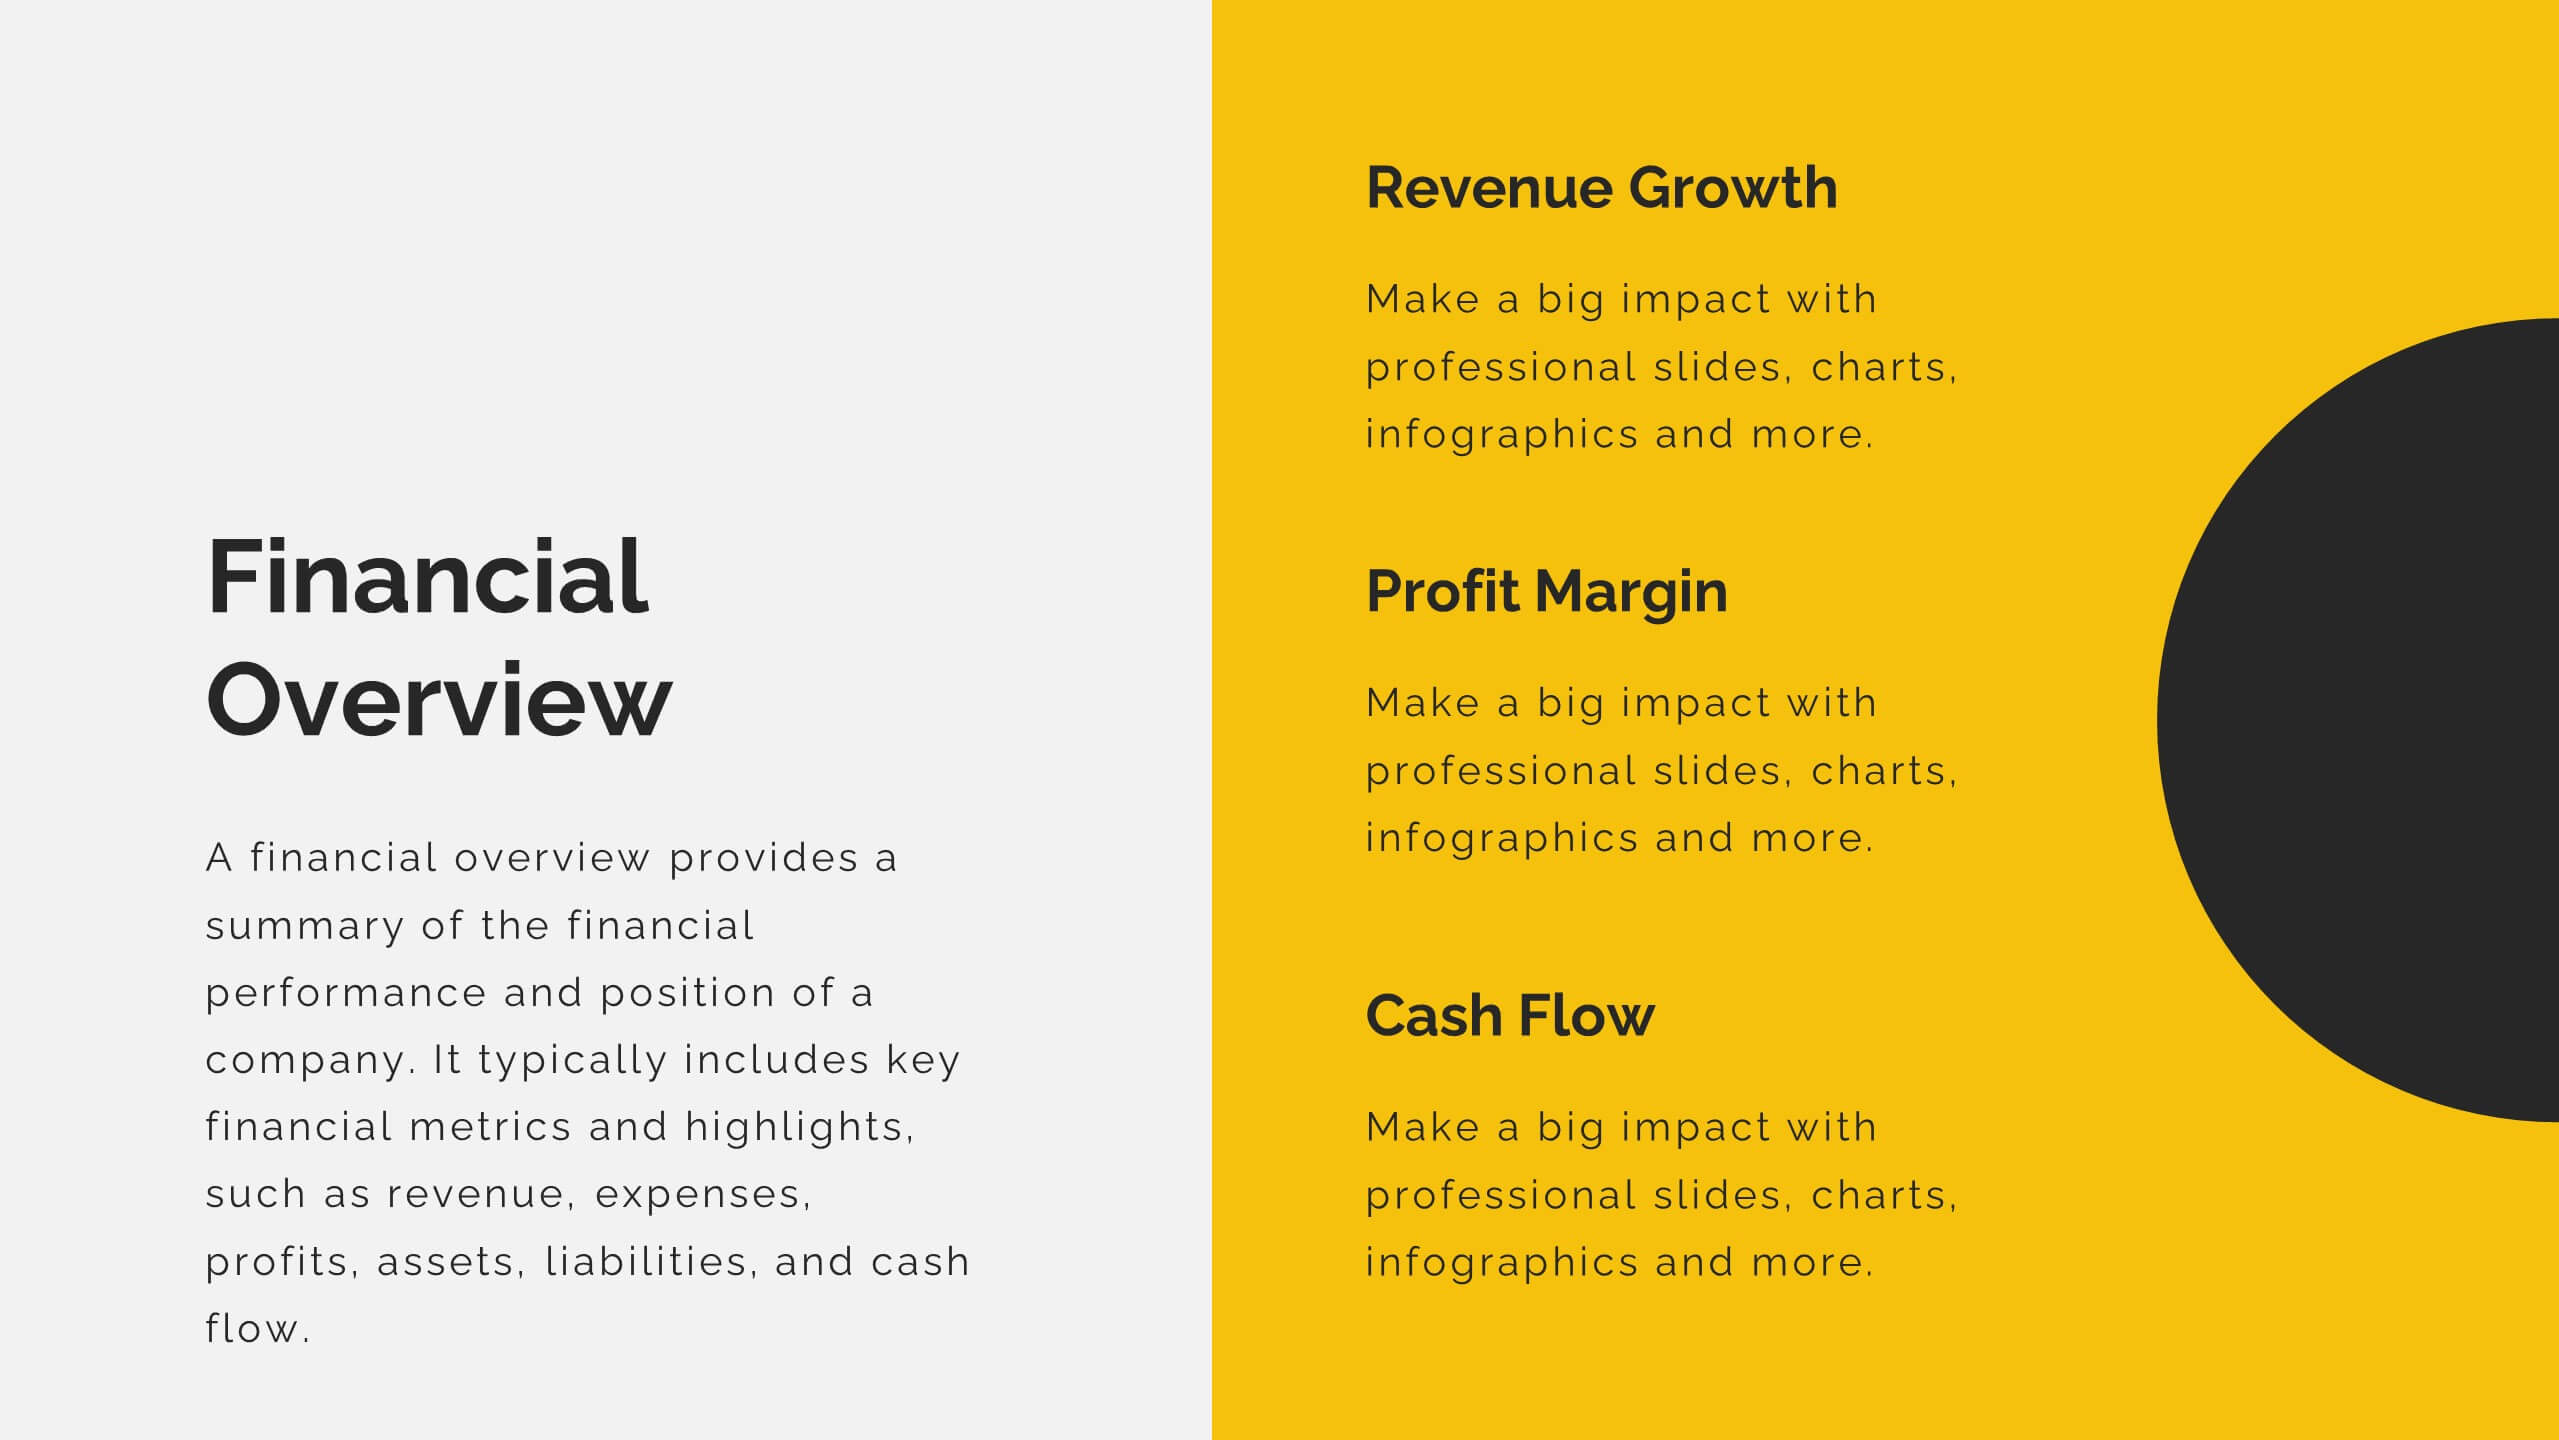
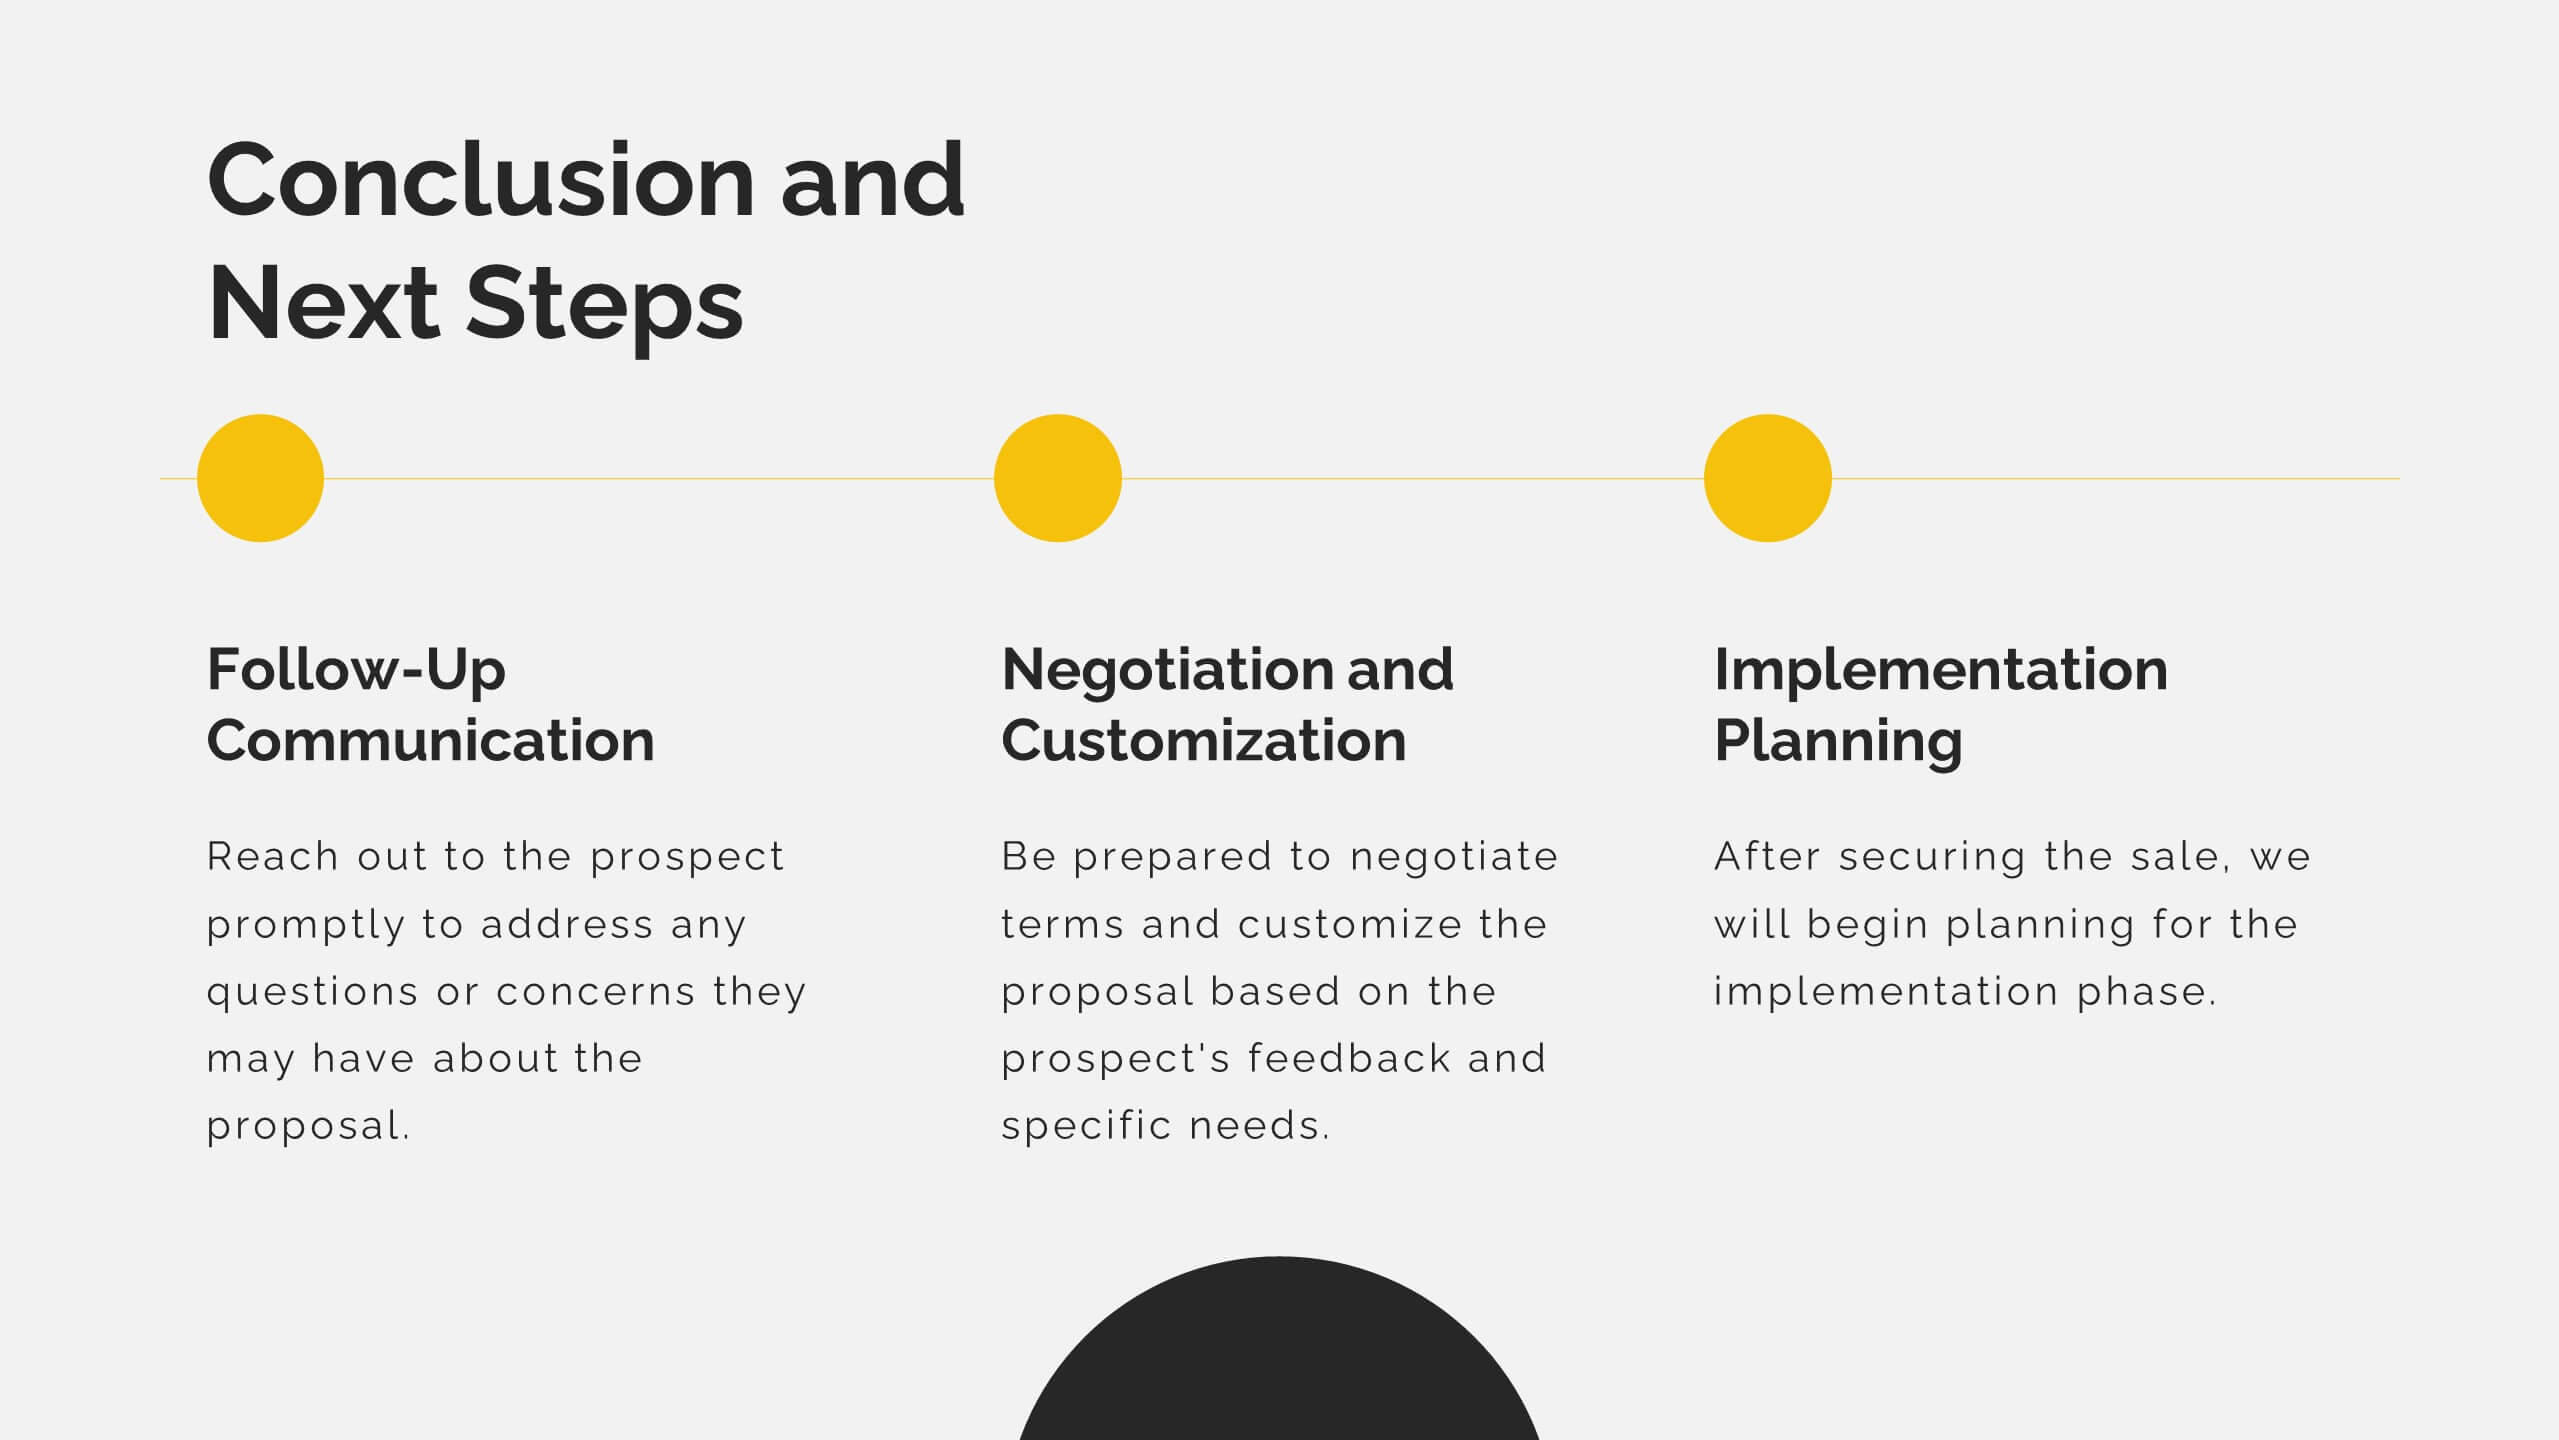
Professional Business Portfolio Presentation
Present your work with confidence using this sleek Professional Business Portfolio presentation. Designed to showcase your project highlights, performance data, and key insights, this layout features a clean two-column structure with space for visuals, icons, and statistics. Perfect for consultants, agencies, or entrepreneurs wanting to highlight business outcomes. Fully customizable and compatible with PowerPoint, Keynote, and Google Slides.


24 diapositivas
Crest User Experience Proposal Presentation
Present your user experience design proposal with a vibrant and engaging template! This design covers key UX aspects like user research, wireframes, prototyping, and usability guidelines. Ideal for showcasing your process from personas to interaction design, it's fully compatible with PowerPoint, Keynote, and Google Slides for seamless presentations.