


Características


¿Tienes alguna pregunta?
Recomendar


6 diapositivas
Business Idea Presentation for Investors Presentation
Present your business concept with clarity using the Business Idea Presentation for Investors. This unique hexagon-centric layout highlights six key pillars of your idea—perfect for showcasing problem-solving, market fit, innovation, competitive advantage, scalability, and profitability. Each point includes customizable icons and text, allowing you to adapt it to your pitch needs. Clean, visually balanced, and easy to edit in PowerPoint, Keynote, or Google Slides, this slide is ideal for entrepreneurs, founders, and startup teams seeking investment and buy-in.


4 diapositivas
Corporate Role Hierarchy Structure Presentation
Visualize your company’s reporting structure with this modern corporate role hierarchy diagram. Perfect for team overviews, leadership charts, or onboarding sessions. Each role node is clearly connected for easy understanding. Fully editable in Canva, PowerPoint, or Google Slides—ideal for HR teams, managers, or organizational planning presentations.


7 diapositivas
United States Market Map Infographic
Navigate the vastness of the United States with our meticulously designed map infographic. Rendered in a pristine white background, this template is adorned with the patriotic fervor of red, the tranquility of blue, and the charm of purple. Whether it's for market segmentation, regional data visualization, or a travel itinerary, the infographic seamlessly blends informative value with visual appeal. This US map, compatible with Powerpoint, Keynote, and Google Slides, offers custom-made icons and flexible image placeholders to suit varied purposes. Unfold stories from coast to coast, showcasing the diverse tapestry that is the United States.


7 diapositivas
Implementation Models and Frameworks Slide Presentation
Visualize your entire process clearly with the Implementation Models and Frameworks Slide Presentation. This sleek arrow-based timeline features six distinct stages, each with icons and text placeholders to highlight key milestones, actions, or phases. Ideal for showcasing workflows, strategic initiatives, or rollout plans, this slide ensures your audience follows the journey from start to finish. Fully editable in PowerPoint, Keynote, and Google Slides, it’s perfect for project managers, consultants, and team leads aiming for clarity and impact.


20 diapositivas
Vivid Product Development Plan Presentation
Develop your product with confidence using this detailed product development plan template! Perfect for outlining features, market analysis, and competitive advantages. Ideal for product managers and teams. Compatible with PowerPoint, Keynote, and Google Slides, this template ensures your plan is clear, professional, and comprehensive. Achieve product success today!


12 diapositivas
Personal Portfolio Presentation
Our Personal Portfolio Presentation template is designed for professionals looking to make a strong impression with a sleek and engaging portfolio. This comprehensive template provides an excellent framework to showcase your personal brand, professional journey, and achievements. The opening slide, with your name boldly presented, acts as your introduction. It's followed by a 'Get to know me' section that offers a glimpse into your personality and work ethic. The 'Skills' slide is a visually impactful way to present your competencies, while the 'Experience' slide chronologically outlines your professional milestones. Featuring sections for detailed case studies, showcased projects, and educational background, this template helps you tell your story in a cohesive and captivating manner. The 'Recognitions' slide allows you to highlight awards and honors, adding credibility to your profile. Ending with a compelling 'Let's work together!' call-to-action, this template is adaptable to PowerPoint, Keynote, and Google Slides, perfect for anyone looking to stand out in their field.


5 diapositivas
Numerical Highlights in Strategy Presentation
Present key strategic milestones using this visually engaging curved-number layout. Designed to emphasize four sequential points, it's perfect for showcasing steps, achievements, or data-driven highlights. The bold numbering and layered hills guide the viewer naturally. Fully editable in Canva—ideal for business plans, growth summaries, or performance strategy visuals.


5 diapositivas
Investment Portfolio & Stock Forecast Presentation
Present key investment insights with clarity using the Investment Portfolio & Stock Forecast presentation template. Featuring a central briefcase visual and surrounding data points, this layout is perfect for showcasing portfolio allocation, stock predictions, market movements, or financial planning elements. Designed for finance professionals, analysts, and advisors, it simplifies complex data into digestible visuals. Fully editable and compatible with PowerPoint, Keynote, and Google Slides.


5 diapositivas
Project Status Update Report Presentation
Keep your project tracking transparent and effective with the "Project Status Update Report" presentation templates. These templates help you visually communicate the progress of tasks, timelines, and milestones, ensuring stakeholders stay informed and engaged. Ideal for project managers needing a streamlined, professional format compatible with PowerPoint, Keynote, and Google Slides, they simplify reporting and enhance project visibility.


6 diapositivas
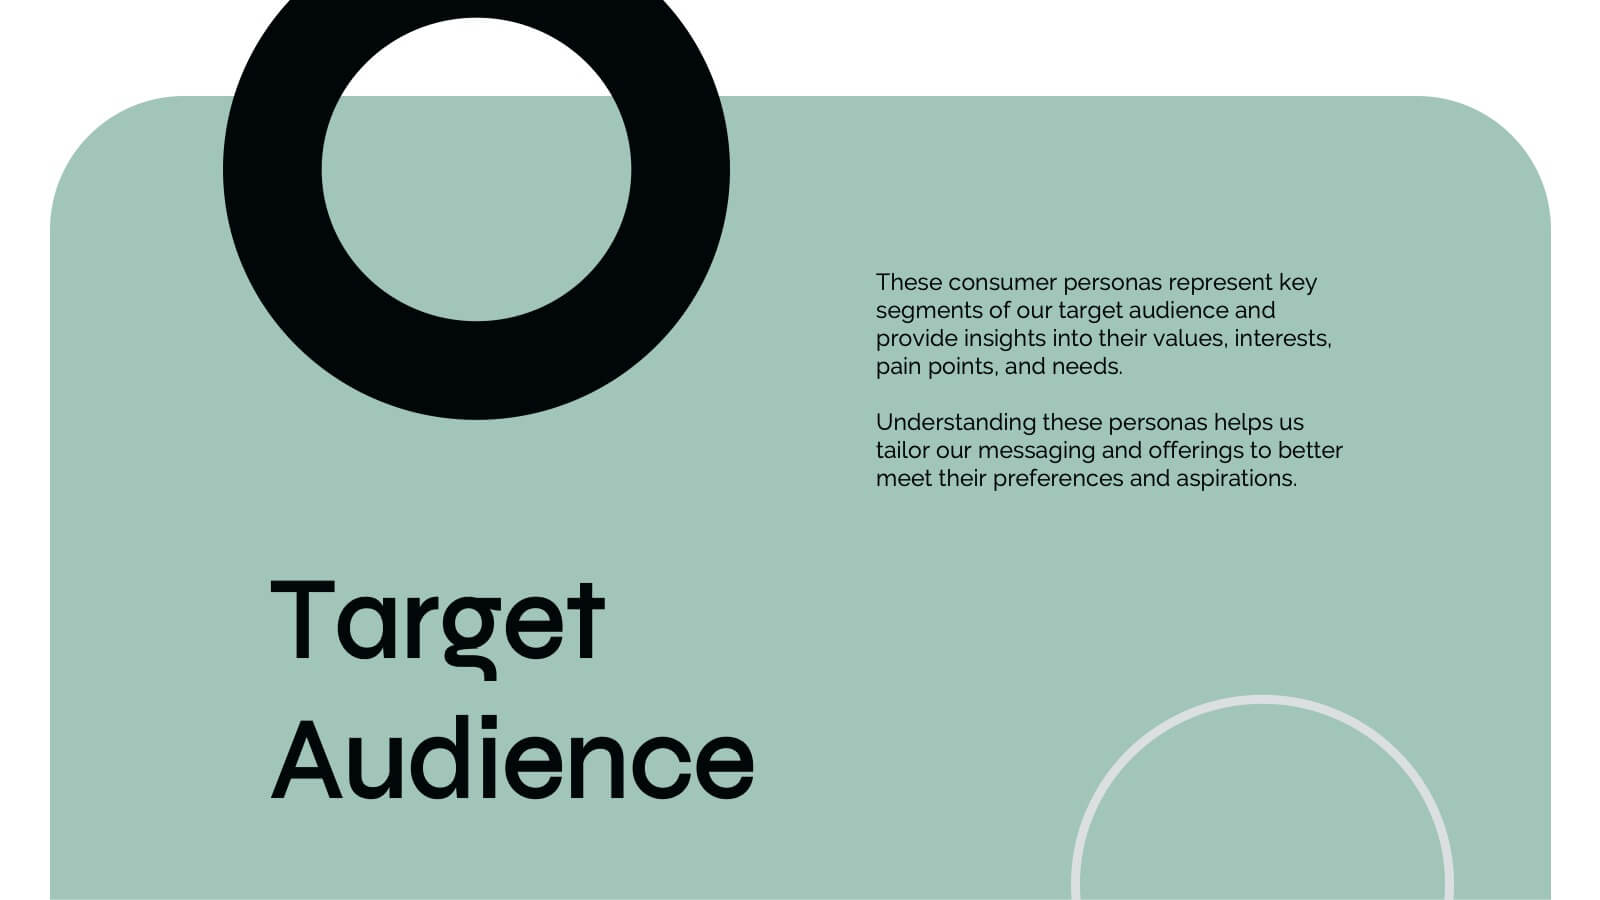
Demographic and Behavioral Customer Profile Presentation
Understand your audience better with the Demographic and Behavioral Customer Profile Presentation. This visually engaging template separates key demographic details from behavior-based insights to help you build more effective marketing strategies. Fully customizable in Canva, PowerPoint, or Google Slides—perfect for marketers, strategists, and sales teams targeting customer segmentation.


24 diapositivas
Crest User Experience Proposal Presentation
Present your user experience design proposal with a vibrant and engaging template! This design covers key UX aspects like user research, wireframes, prototyping, and usability guidelines. Ideal for showcasing your process from personas to interaction design, it's fully compatible with PowerPoint, Keynote, and Google Slides for seamless presentations.


5 diapositivas
Market Growth Strategies in North America Map Presentation
Unveil regional growth opportunities with the Market Growth Strategies in North America Map template, which provides a strategic layout for presenting business growth metrics across various regions.This template includes data-driven graphs to visualize performance and strategy deployment effectively. It's designed to aid professionals in making informed decisions and is compatible with PowerPoint, Keynote, and Google Slides.


5 diapositivas
Key Drivers Behind Success Strategy Presentation
Highlight the building blocks of your business strategy with the Key Drivers Behind Success Strategy Presentation. This sleek, horizontal infographic uses a timeline-style layout with four labeled checkpoints—perfect for showcasing essential success factors, strategic pillars, or operational milestones. Ideal for leadership updates or corporate planning decks. Fully editable in Canva, PowerPoint, Keynote, and Google Slides.


5 diapositivas
Territory Overview in Oceania Presentation
Highlight your regional data with the Territory Overview in Oceania Presentation. Featuring a clean map layout of Australia and surrounding territories, this slide is ideal for displaying key regional insights, office locations, or performance data. Color-coded markers and callouts help organize your content clearly. Fully editable in Canva, PowerPoint, or Google Slides.


24 diapositivas
Brand Overview Presentation
Enhance your brand storytelling with our Brand Presentation template. Perfect for showcasing brand vision, values, and strategies, this template includes diverse slides for audience targeting and brand touchpoints. Suitable for all professional settings, it's compatible with PowerPoint, Keynote, and Google Slides.


22 diapositivas
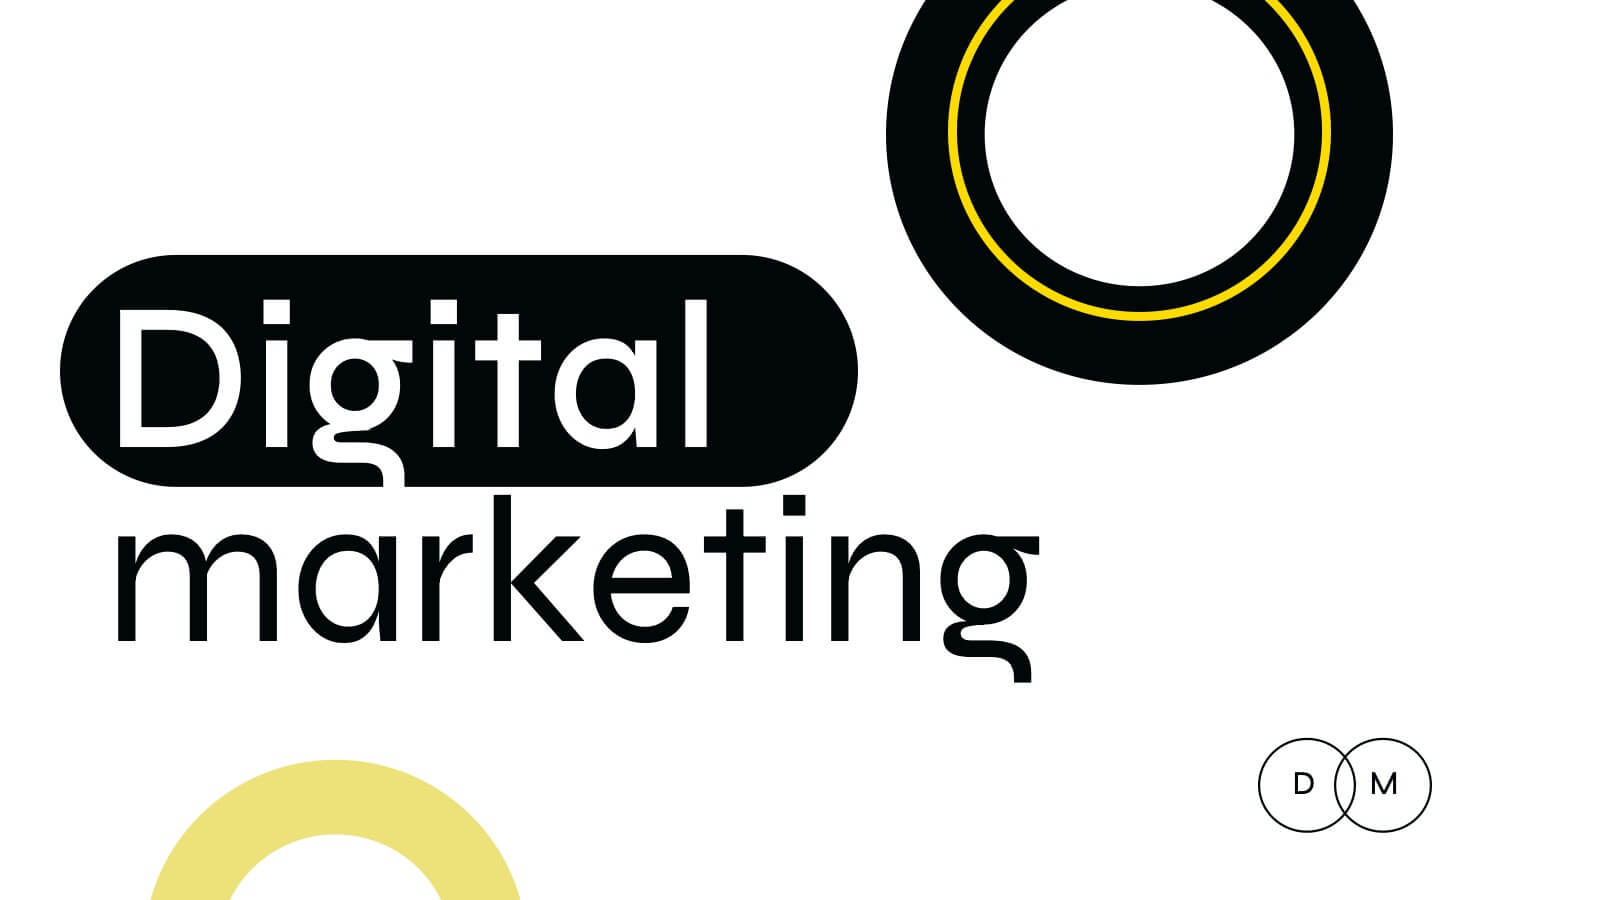
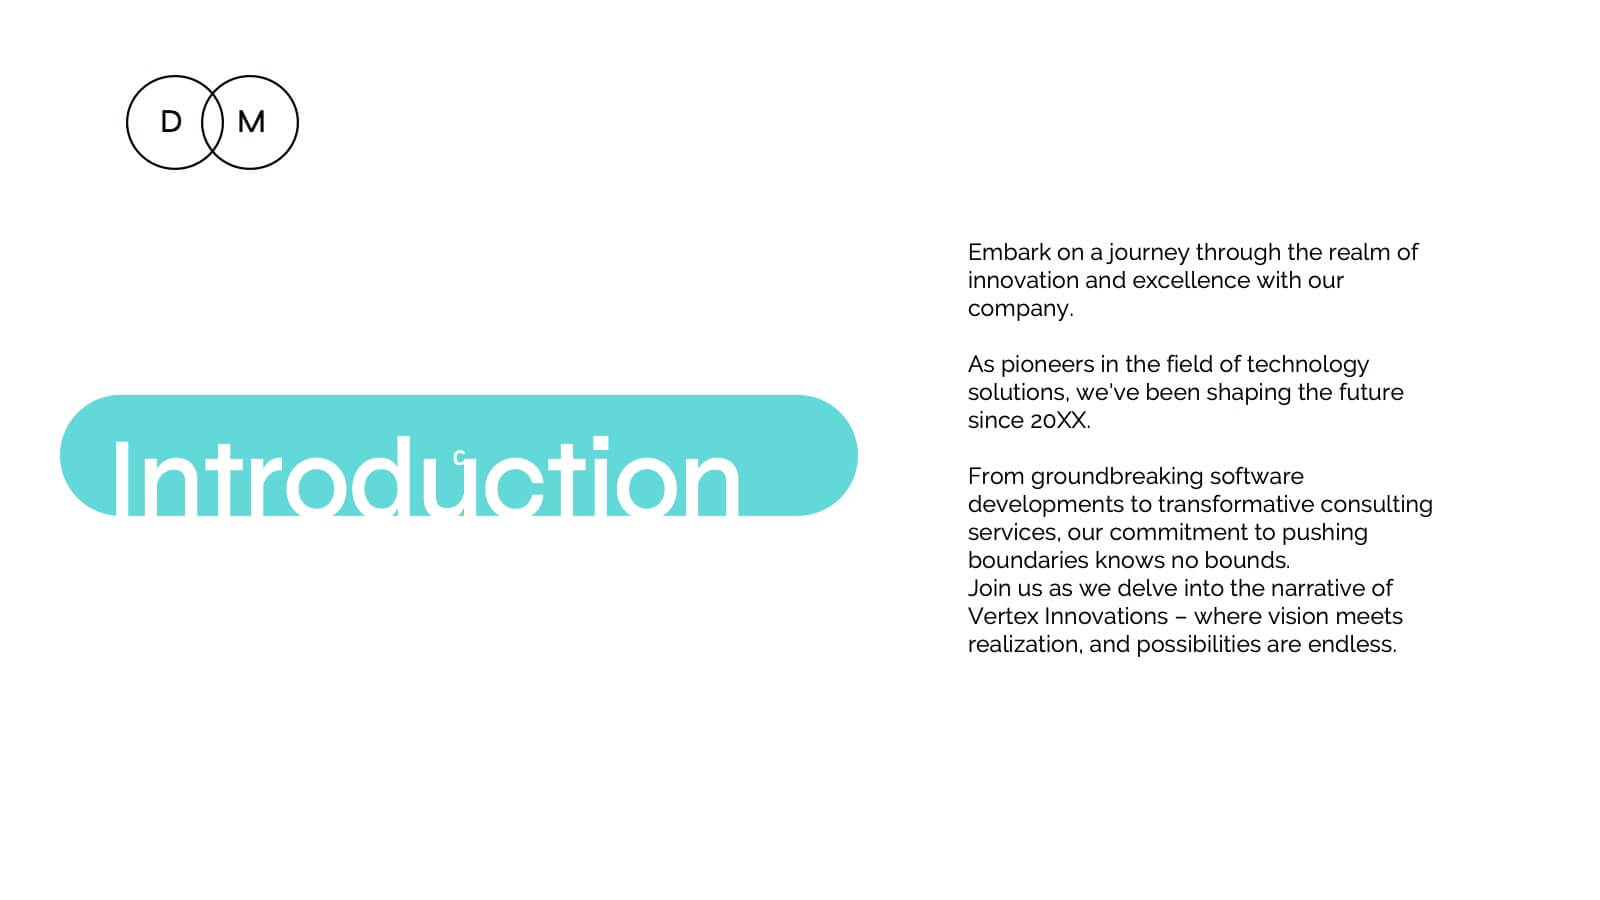
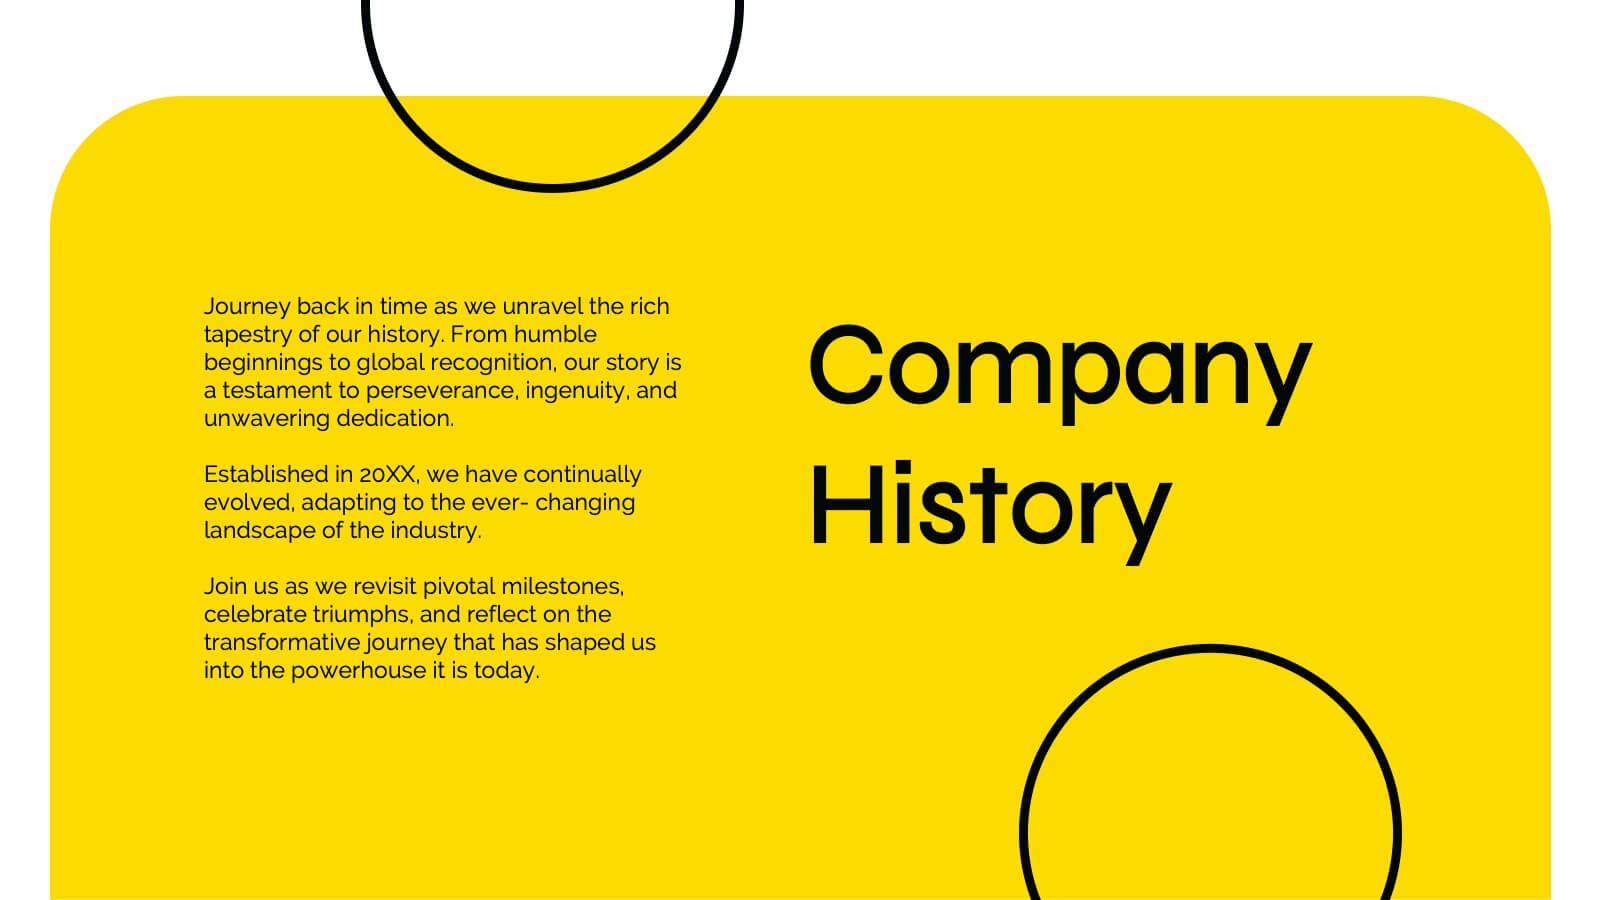
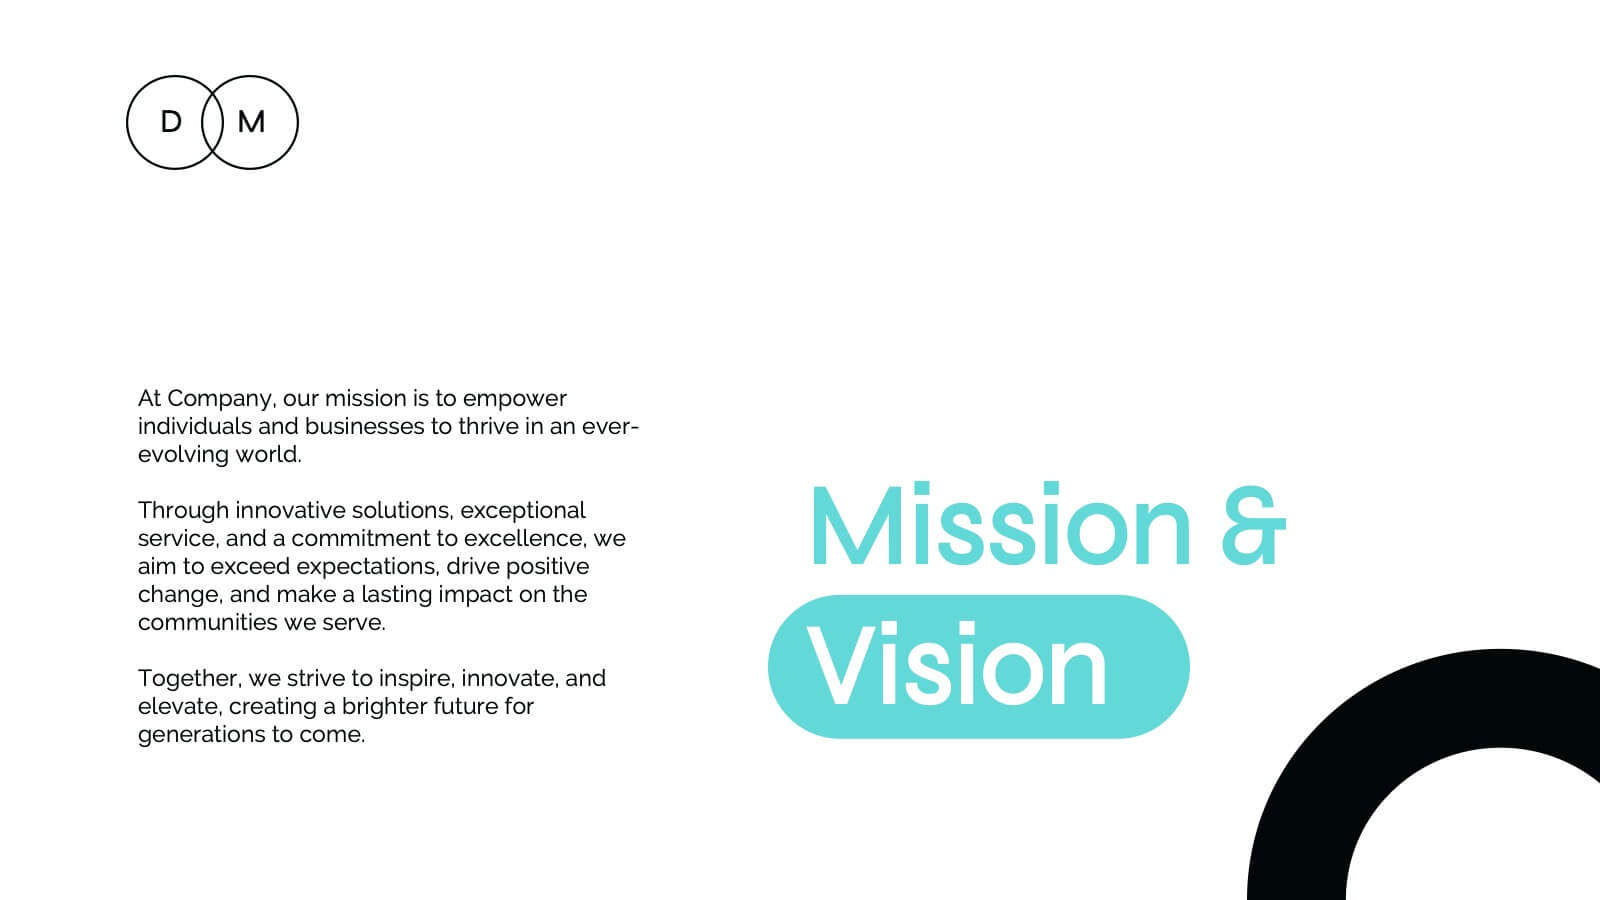
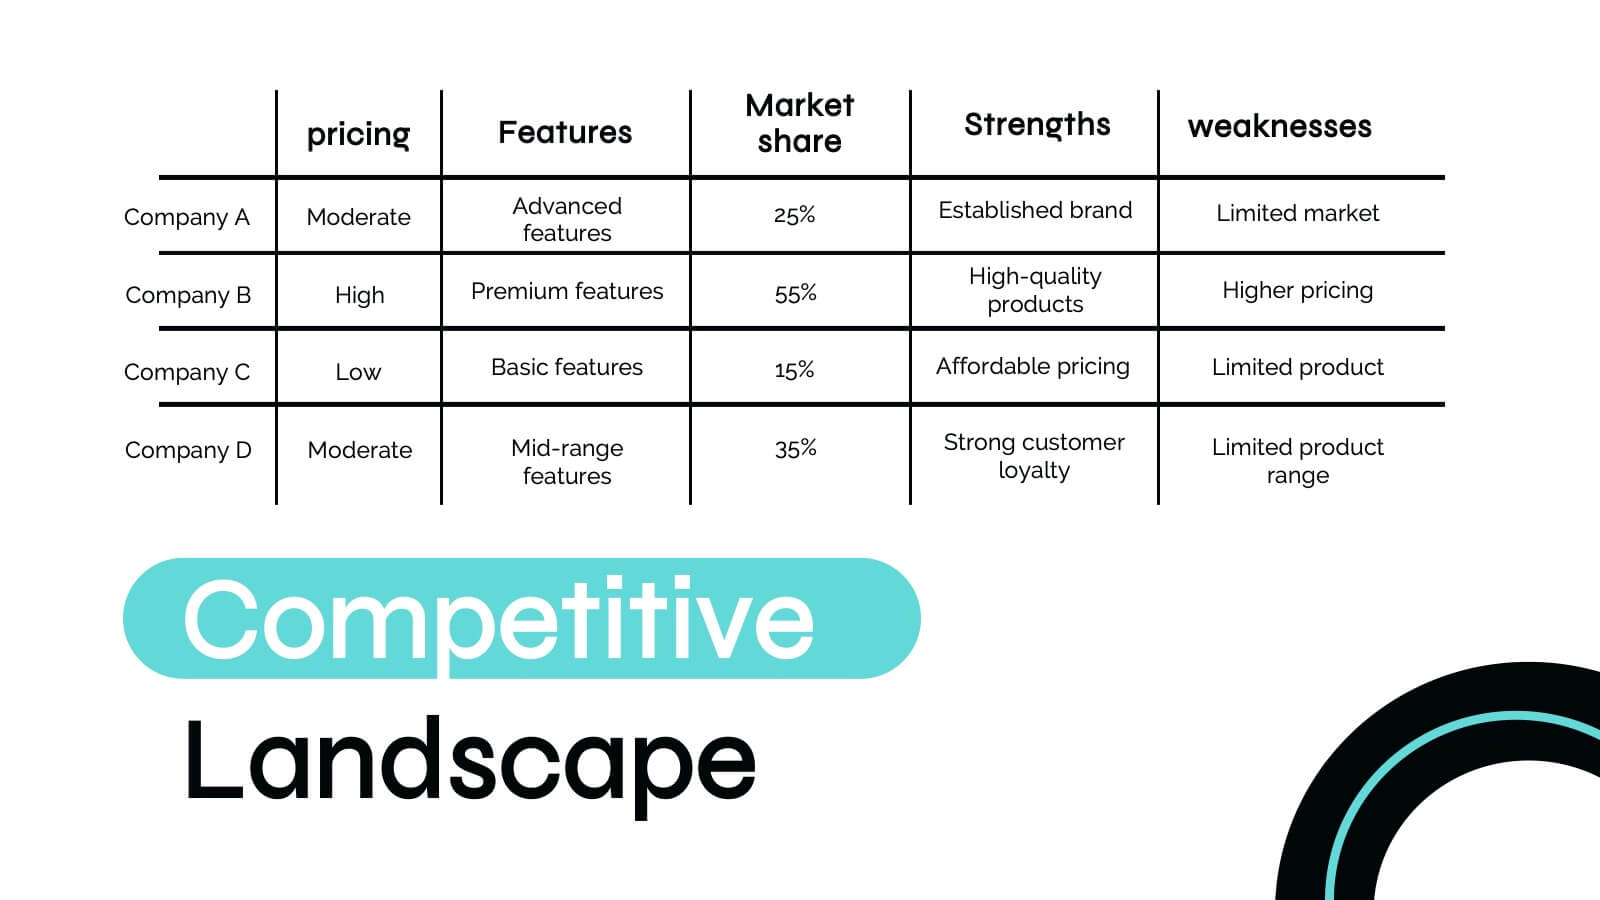
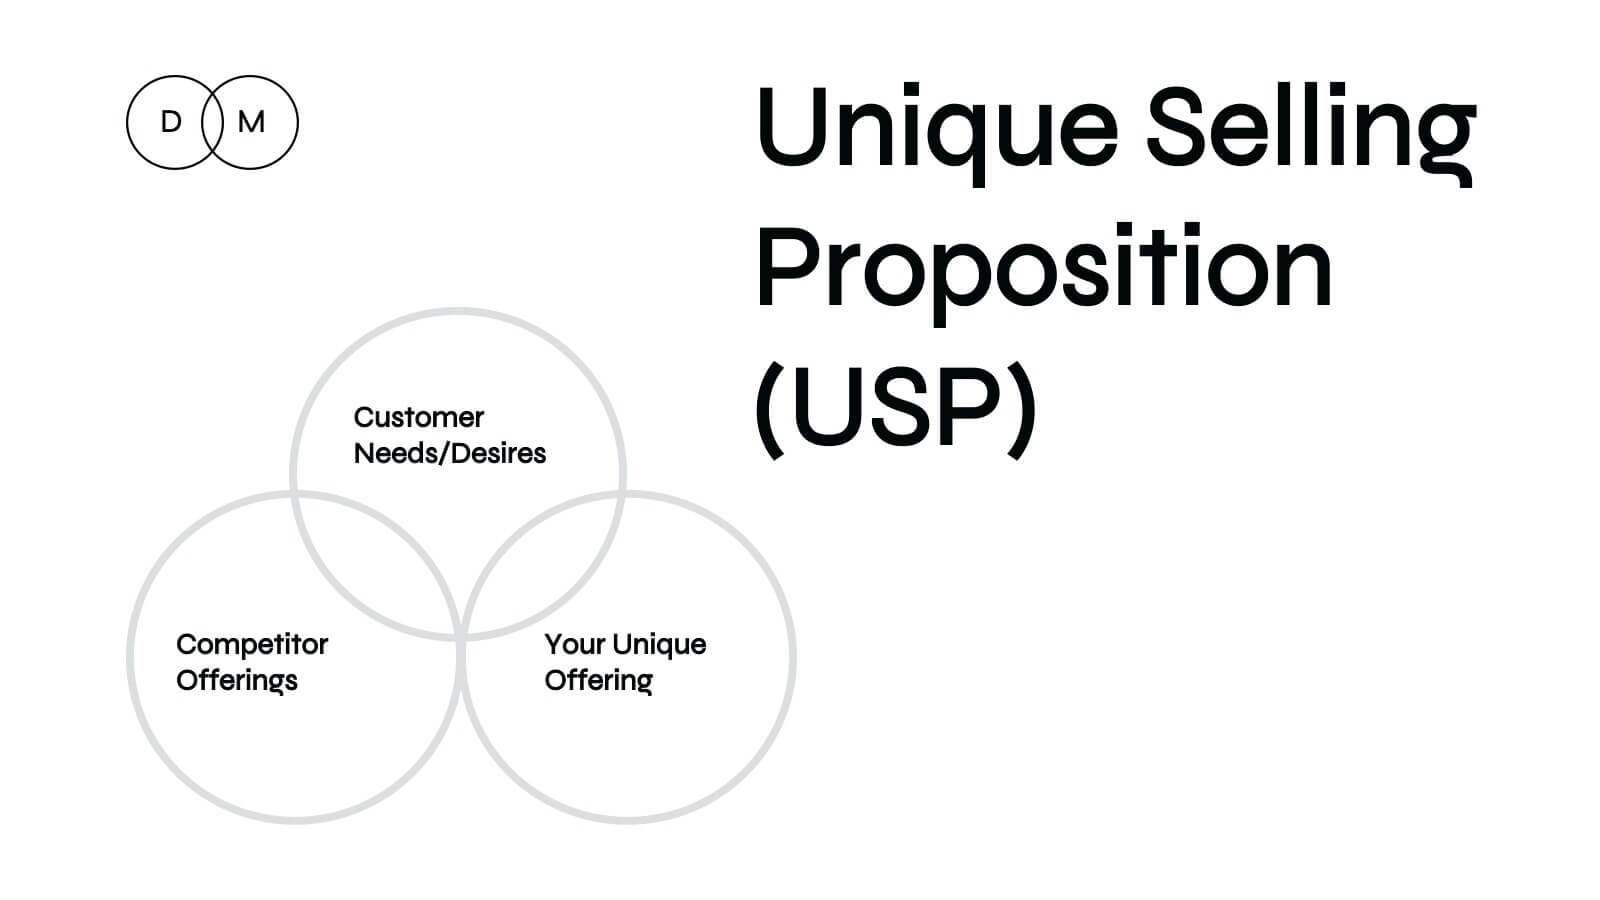
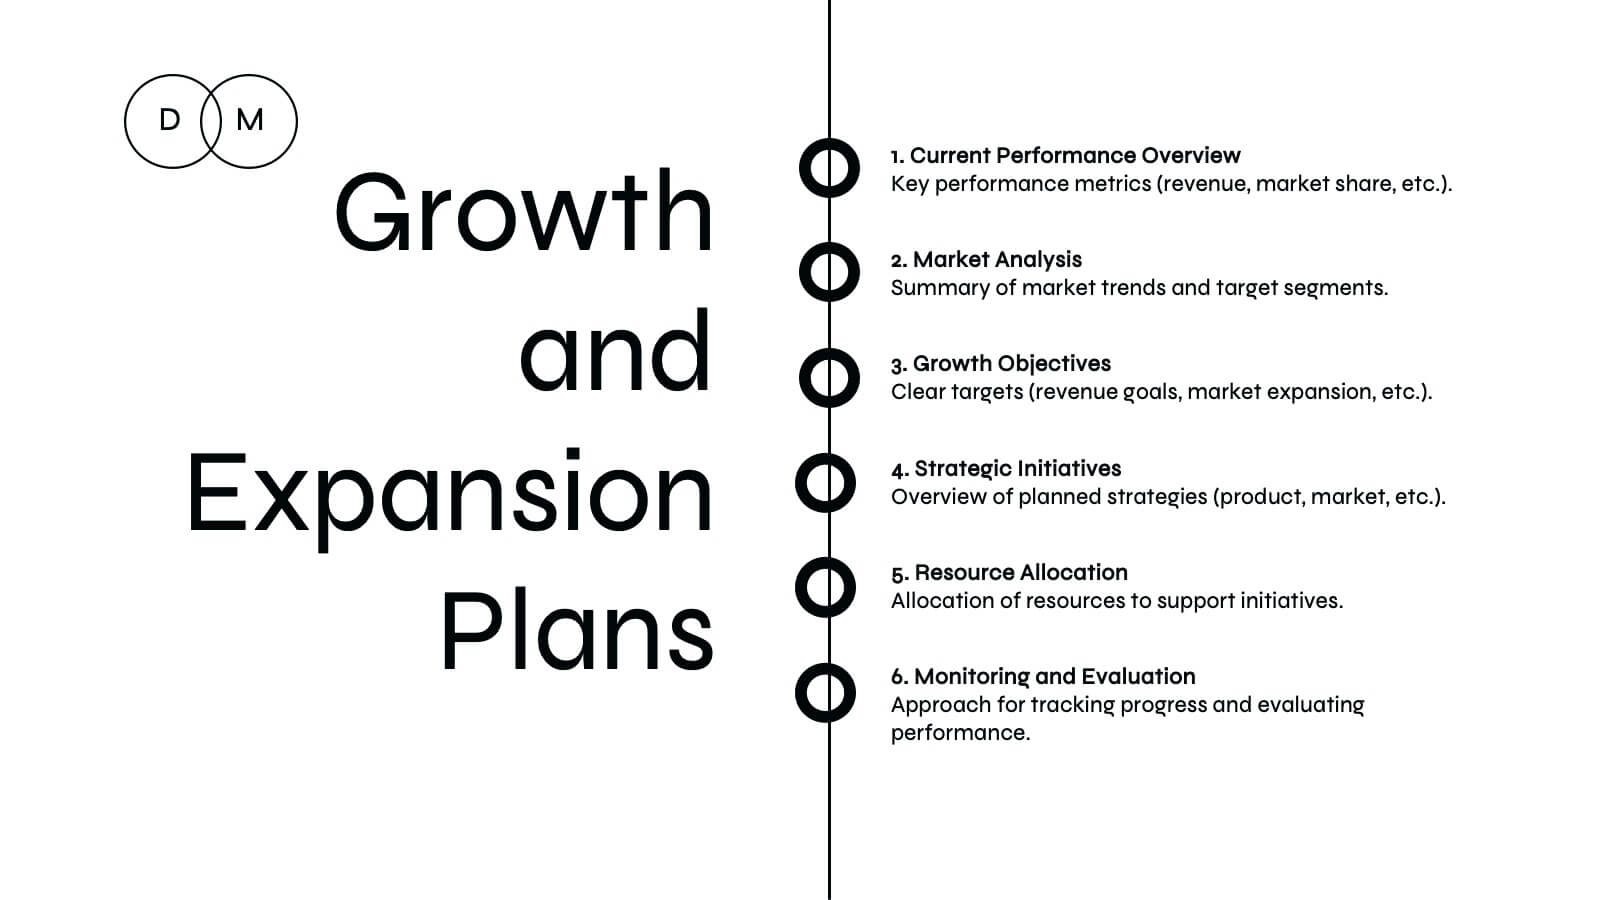
Hercules Digital Marketing Strategy Plan Presentation
Ignite your next marketing presentation with this bold, dynamic template that showcases every key element of your marketing strategy! From company history and target audience insights to competitive landscape analysis, this design makes presenting your marketing message a breeze. Perfect for professionals, it’s fully compatible with PowerPoint, Keynote, and Google Slides for seamless usage across platforms.


22 diapositivas
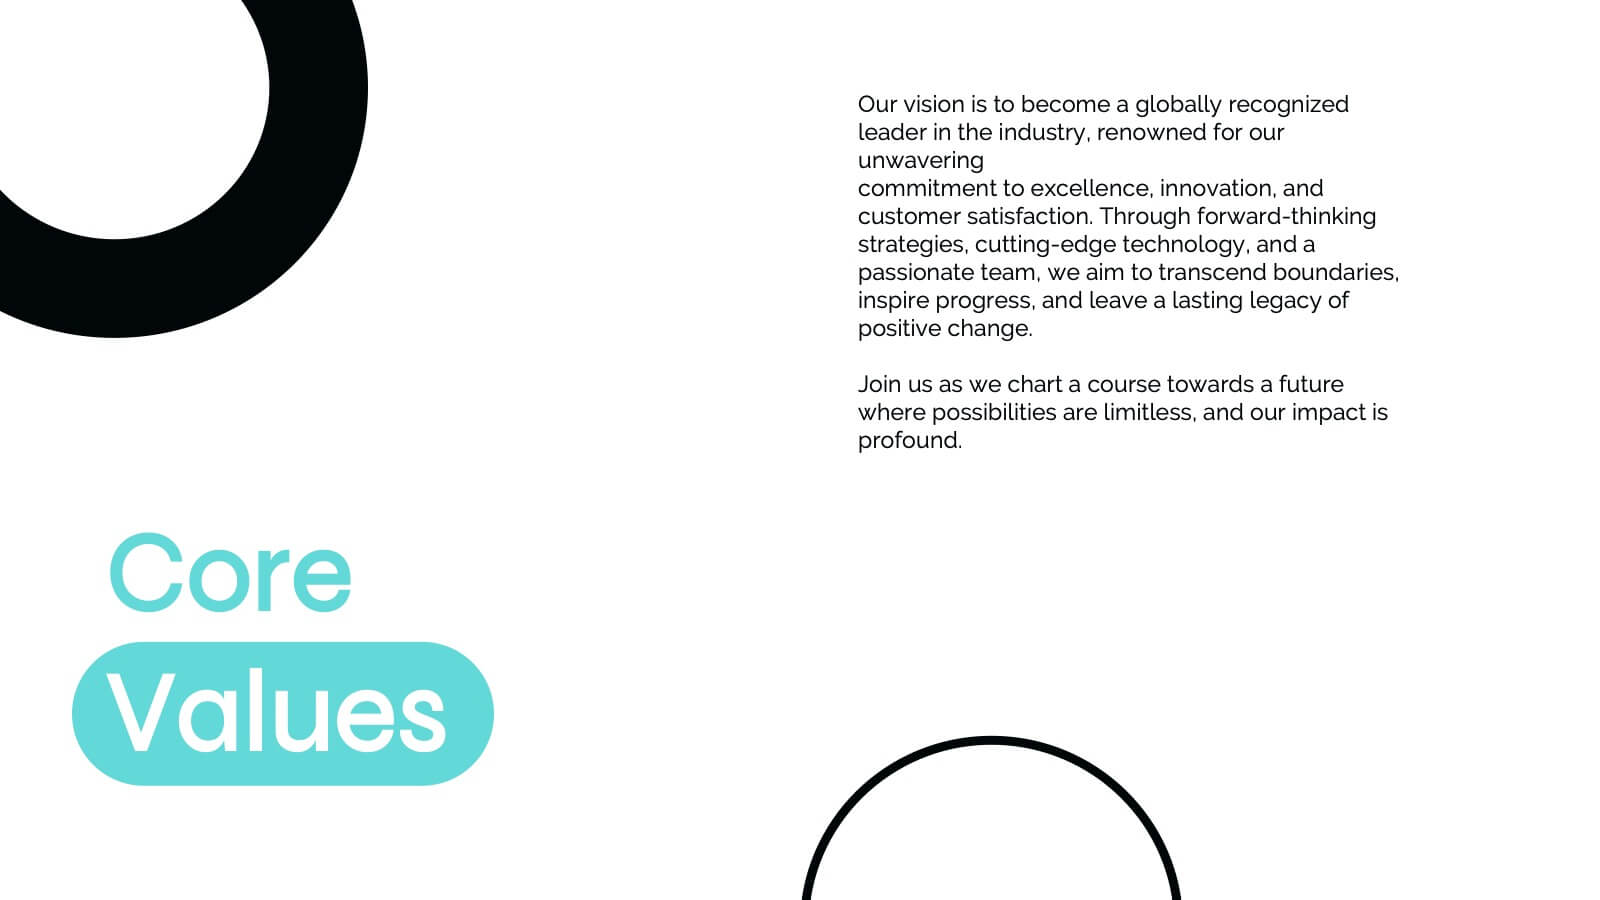
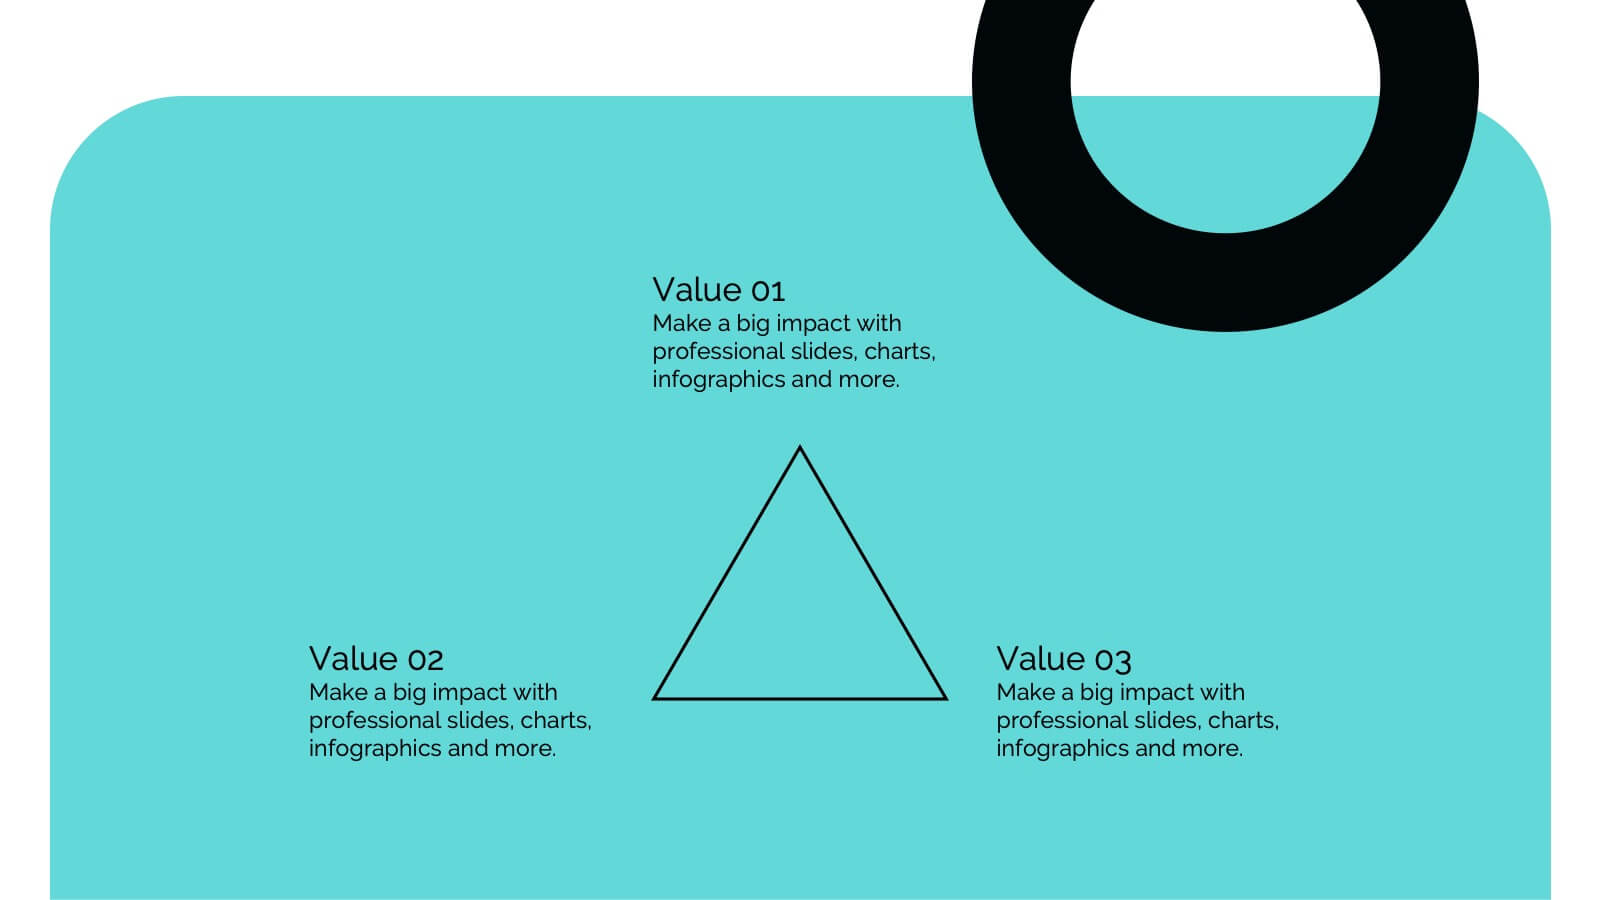
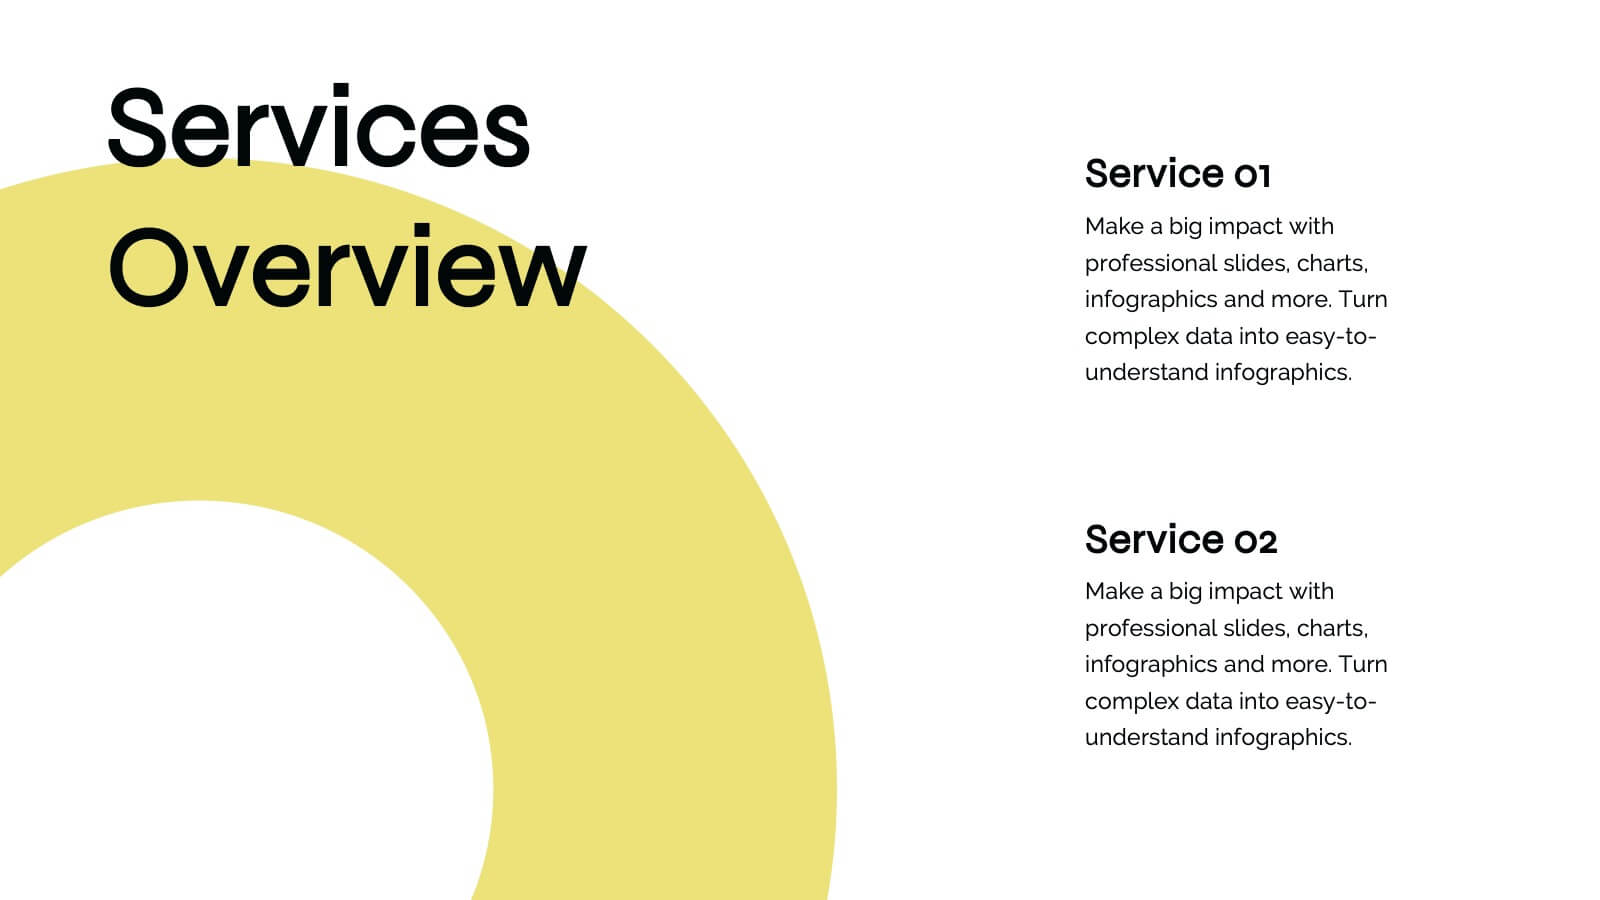
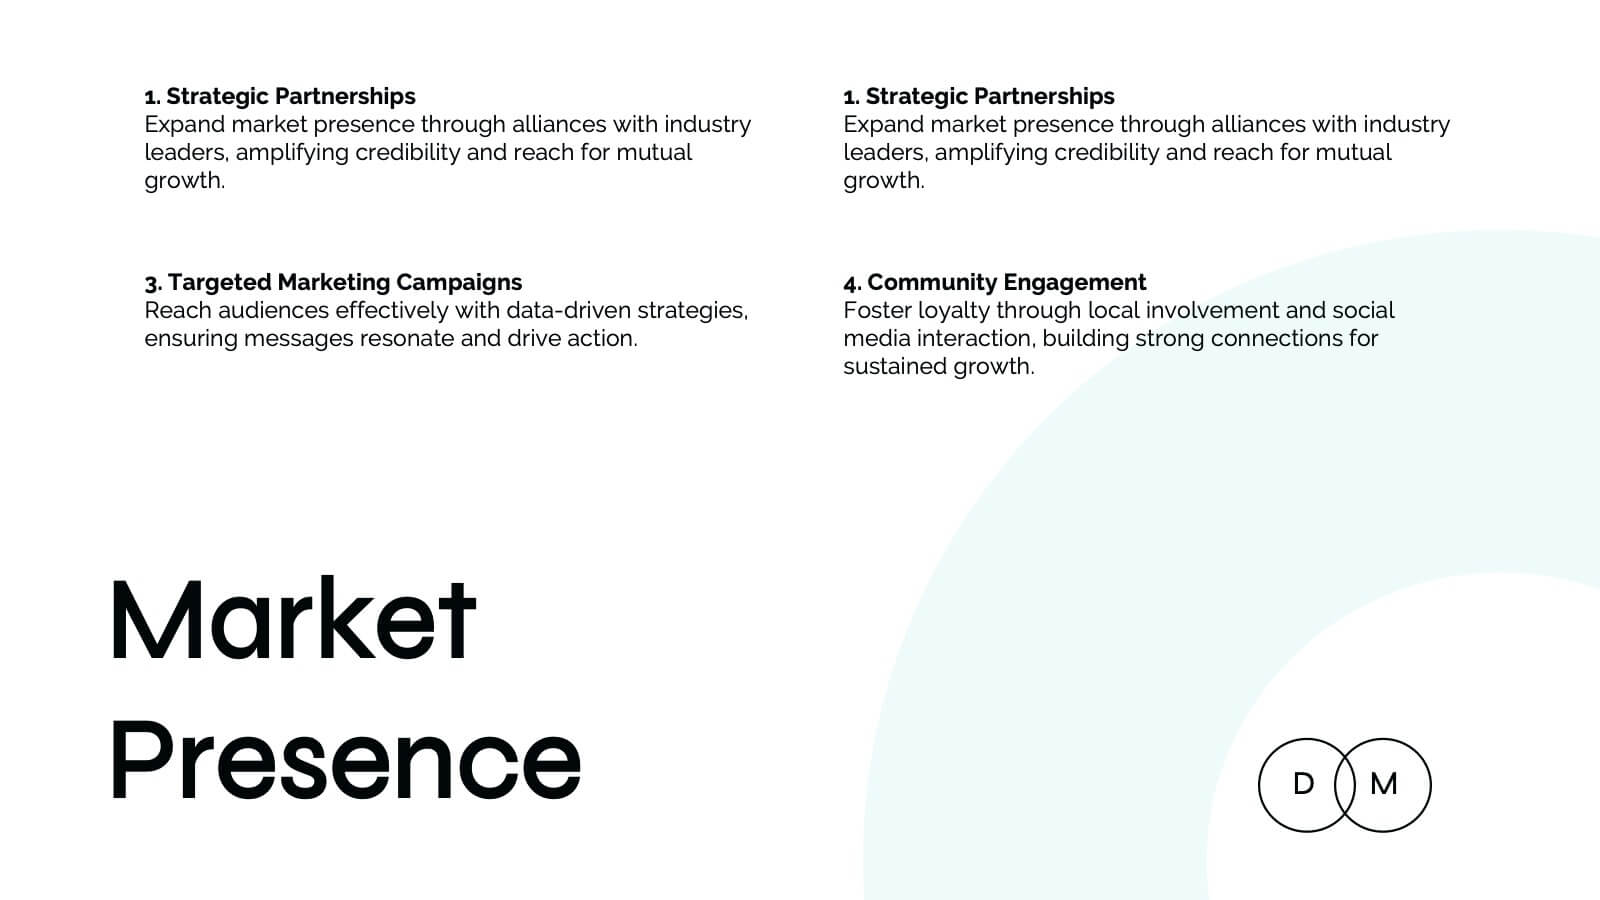
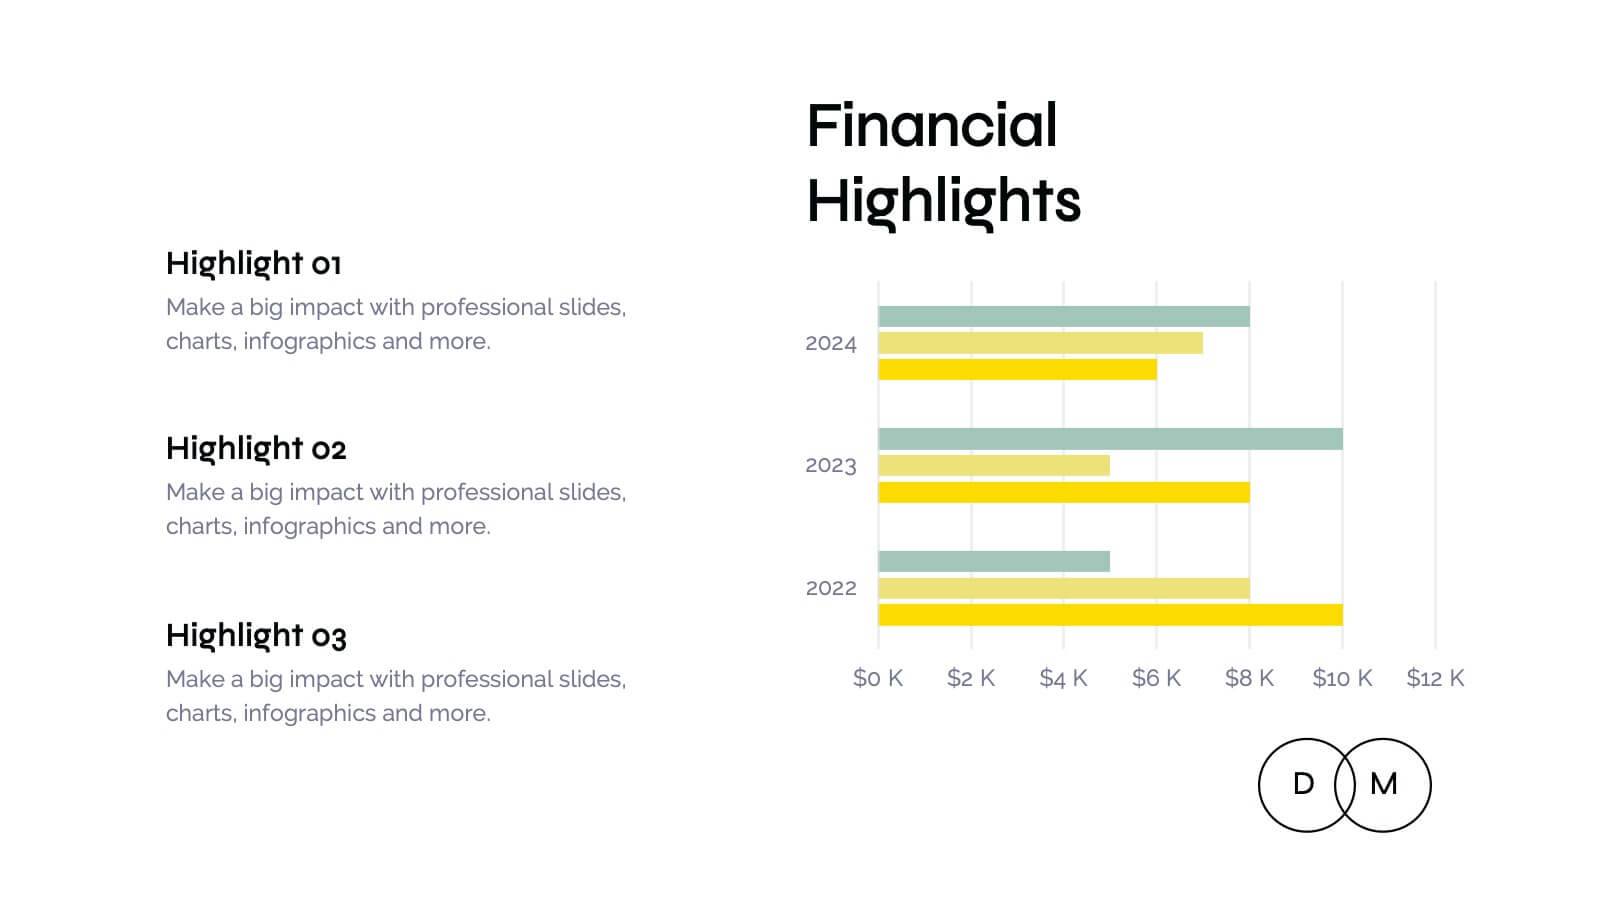
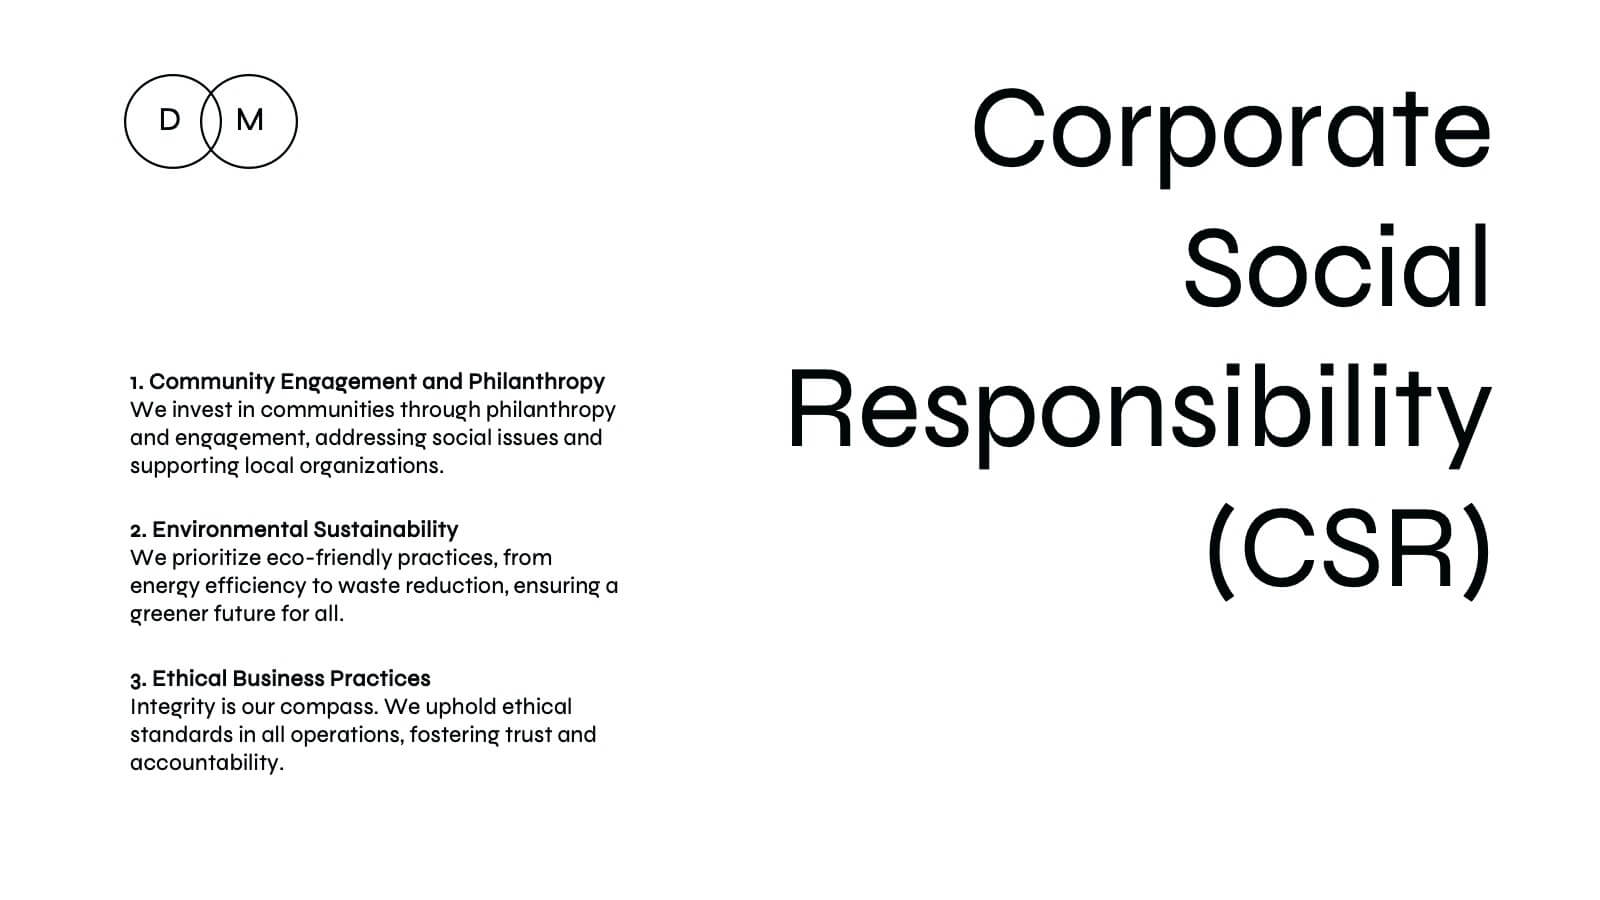
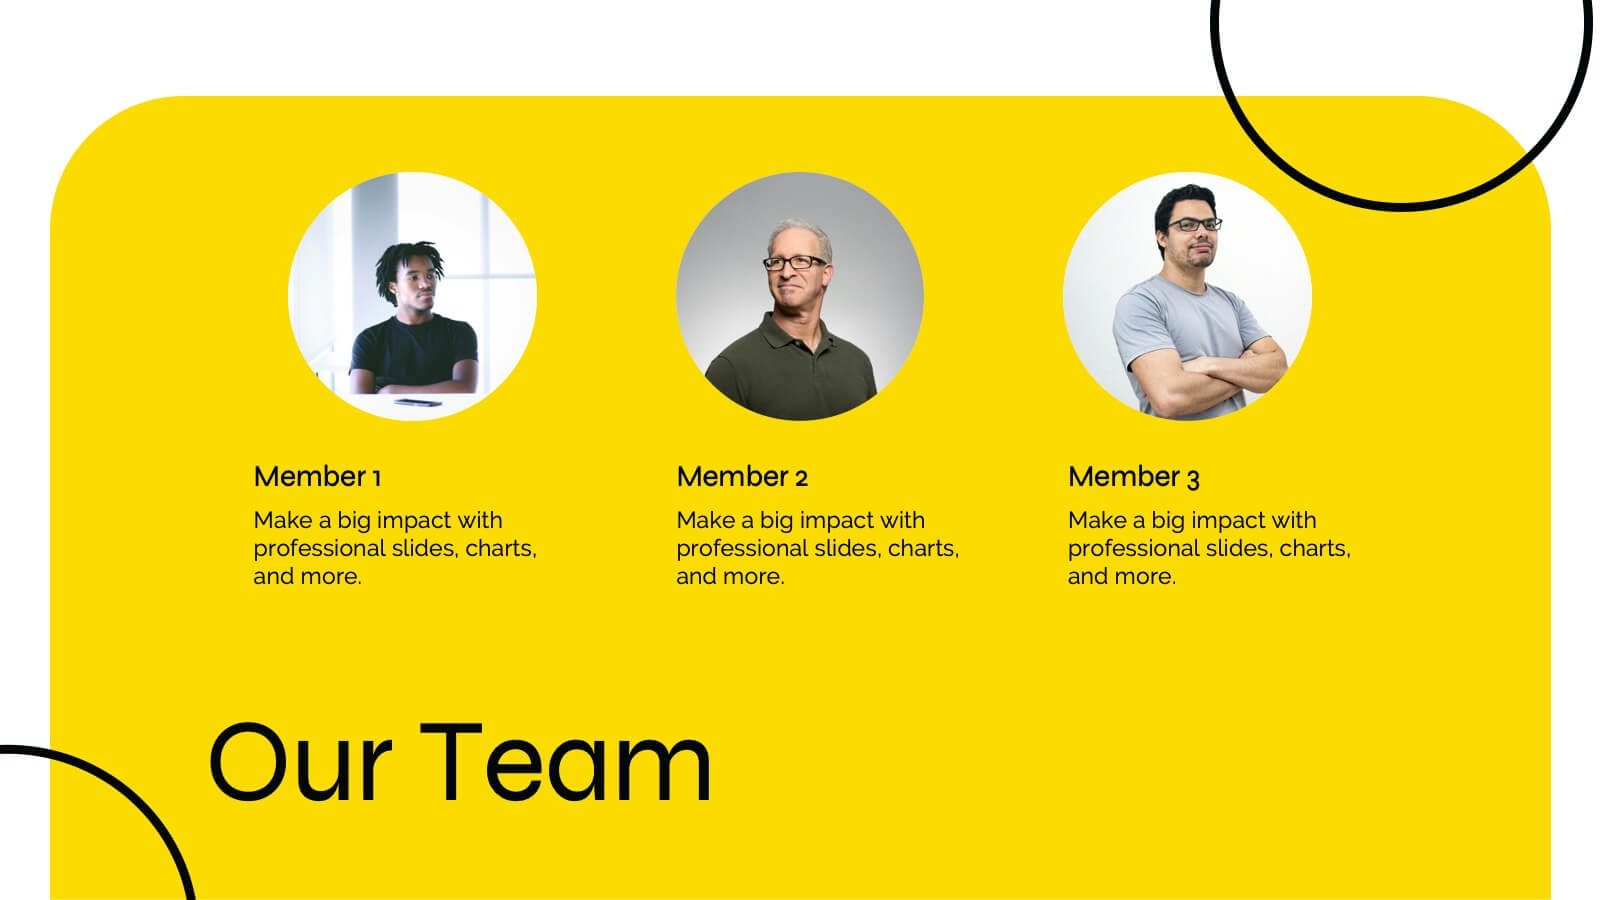
Sky Drop Full-Service Agency Project Plan Presentation
Step into the world of strategic creativity with the Sky Drop Agency Project Plan template! Designed for modern agencies looking to impress clients and stakeholders, this template offers a sleek and professional design that highlights your agency's strengths, processes, and successes. With dedicated sections for mission and vision, team introduction, services, and client testimonials, this template provides a comprehensive overview of your agency's capabilities. It's perfect for showcasing case studies, market analysis, and future outlooks, helping you to build trust and establish credibility. Whether you're presenting a new project plan or updating clients on progress, this template ensures your information is communicated clearly and effectively. Fully customizable and compatible with PowerPoint, Keynote, and Google Slides, the Sky Drop template is your go-to for creating presentations that leave a lasting impact. Impress your audience and elevate your agency's brand with this powerful presentation tool!