


Características


¿Tienes alguna pregunta?
Recomendar


6 diapositivas
Green Energy and Ecology Presentation
Ignite your audience’s curiosity with a clean, modern layout that brings eco-friendly ideas to life. This presentation helps you explain renewable energy concepts, sustainability benefits, and environmental impact in a clear, structured way that feels fresh and inspiring. Fully compatible with PowerPoint, Keynote, and Google Slides.


10 diapositivas
Project Responsibility Chart Presentation
Streamline your project management with our Project Responsibility Chart template. Designed to clarify roles and tasks across your team, this color-coded chart ensures transparency and efficiency. Ideal for project leads to assign duties clearly and effectively. The template supports PowerPoint, Keynote, and Google Slides, making it versatile for any team environment.


7 diapositivas
Agriculture Infographics Presentation Template
Our Agriculture Infographic template is a great way to present your information about the structure, process and procedures of agricultural. This template includes a set of slides with illustrations and charts that will help you make an eye-catching presentation in just minutes. This template has been designed for use in PowerPoint, and is well-suited for both personal and business use. This infographic template is a perfect choice for presenting the statistical data about agriculture, such as product and service, market share and revenue, production levels and other information.


7 diapositivas
Thank You Infographic
Express your gratitude in style with this beautifully designed template, perfect for adding a touch of elegance and personalization to your messages of appreciation. Featuring a range of versatile layouts—from minimalist designs to vibrant color schemes and eye-catching typography—each slide offers a unique way to say thank you, whether it’s to clients, team members, or partners. Customize the visuals to align with your brand or personal style by integrating your own photos, logos, and text, making each expression of gratitude uniquely yours. Ideal for corporate settings, personal use, or charitable events, this template helps you create memorable, heartfelt thanks that resonate deeply with recipients, and is perfect for use in presentations, emails, or as special tokens of appreciation to leave a lasting impression.


6 diapositivas
Governance Information Infographic
Governance refers to the system of rules, practices, and processes by which an organization or entity is directed, controlled, and regulated. This infographic template is designed to present key information about a governance structure, guidelines, or principles. The layout of this template is organized logically, maintaining a clear flow from one section to another. Summarize the benefits and importance of effective governance. This template will encourage you audience to learn more about the governance or its implementation. This template is fully customizable and compatible with Powerpoint, Keynote, and Google Slides.


6 diapositivas
Competitive Market Forces Analysis Presentation
Elevate your insights with a dynamic circular layout that turns complex market pressures into a clear, structured story. This presentation helps you compare key forces, highlight competitive advantages, and communicate strategic recommendations with confidence and simplicity. Fully editable and compatible with PowerPoint, Keynote, and Google Slides.


7 diapositivas
Solutions to Problems Infographic
These slides are designed to outline and explore solutions to identified problems in a clear and effective manner. Each slide uses a clean layout with a consistent color theme that enhances readability and focus. They effectively combine text and graphical elements to showcase problem-solving strategies, making the slides ideal for business presentations or strategic meetings. The inclusion of icons and diagrams aids in visualizing the problem-solving process, and the structured design ensures that the information is presented in a logical sequence. This approach not only aids in communicating the solutions effectively but also engages the audience by making complex information easier to understand. These templates can be adapted for various industries and scenarios, where clear communication of problem-solving steps is crucial. They are especially useful for team discussions, stakeholder presentations, and strategic planning sessions.
8 diapositivas
Key Project Milestone Tracker
Stay on top of progress with this streamlined Key Project Milestone Tracker. Designed to showcase up to eight critical milestones with corresponding years, this timeline helps visualize project phases and deadlines clearly. Fully editable in PowerPoint, Keynote, and Google Slides for easy customization.


5 diapositivas
Lean Startup Business Presentation
A fresh, energetic layout brings your ideas to life, making it easy to present streamlined processes and early-stage strategies with clarity. This presentation highlights key steps, insights, and goals in a clean, modern flow designed for fast-moving teams. Fully compatible with PowerPoint, Keynote, and Google Slides.


5 diapositivas
Steps Process Infographics
A steps process refers to a series of sequential actions or stages that need to be followed to accomplish a specific task or achieve a desired outcome. These informative vertical infographics are designed to showcase step-by-step processes, procedures, or workflows. Whether you need to explain a business process, a project timeline, or a complex procedure, this provides a clear and concise way to present information in a visually engaging manner. The infographic offers a variety of layouts specifically designed to display step-by-step processes. The template allows you to customize the infographics according to your specific needs.


7 diapositivas
Health Infographic Presentation Template
A health infographic is a visual representation of information and data related to health. This template can be used to convey complex information about a variety of health topics, such as disease symptoms, risk factors, and preventive measures, in a simple and easily understandable manner. This Health infographic displays graphics, images, and charts to help illustrate the information and make it more engaging and accessible to your audience. This template can be used for various purposes, such as educating the public, promoting healthy habits, and informing healthcare professionals.


6 diapositivas
Strategy to Overcome Challenges Presentation
Get ready to chart a winning path with this dynamic visual roadmap! These slides help simplify complex strategies into clear steps to tackle business challenges head-on. Perfect for team alignment, leadership planning, and problem-solving workflows. Fully compatible with PowerPoint, Keynote, and Google Slides for flexible, professional presentations.


5 diapositivas
Side-by-Side Product Comparison Table Presentation
Clearly showcase differences with the Side-by-Side Product Comparison Table Presentation. This modern, easy-to-scan layout is perfect for comparing two features, services, or product options. Use icons and color highlights to emphasize key advantages. Ideal for marketing, sales decks, or client proposals. Compatible with PowerPoint, Keynote, Canva, and Google Slides.


23 diapositivas
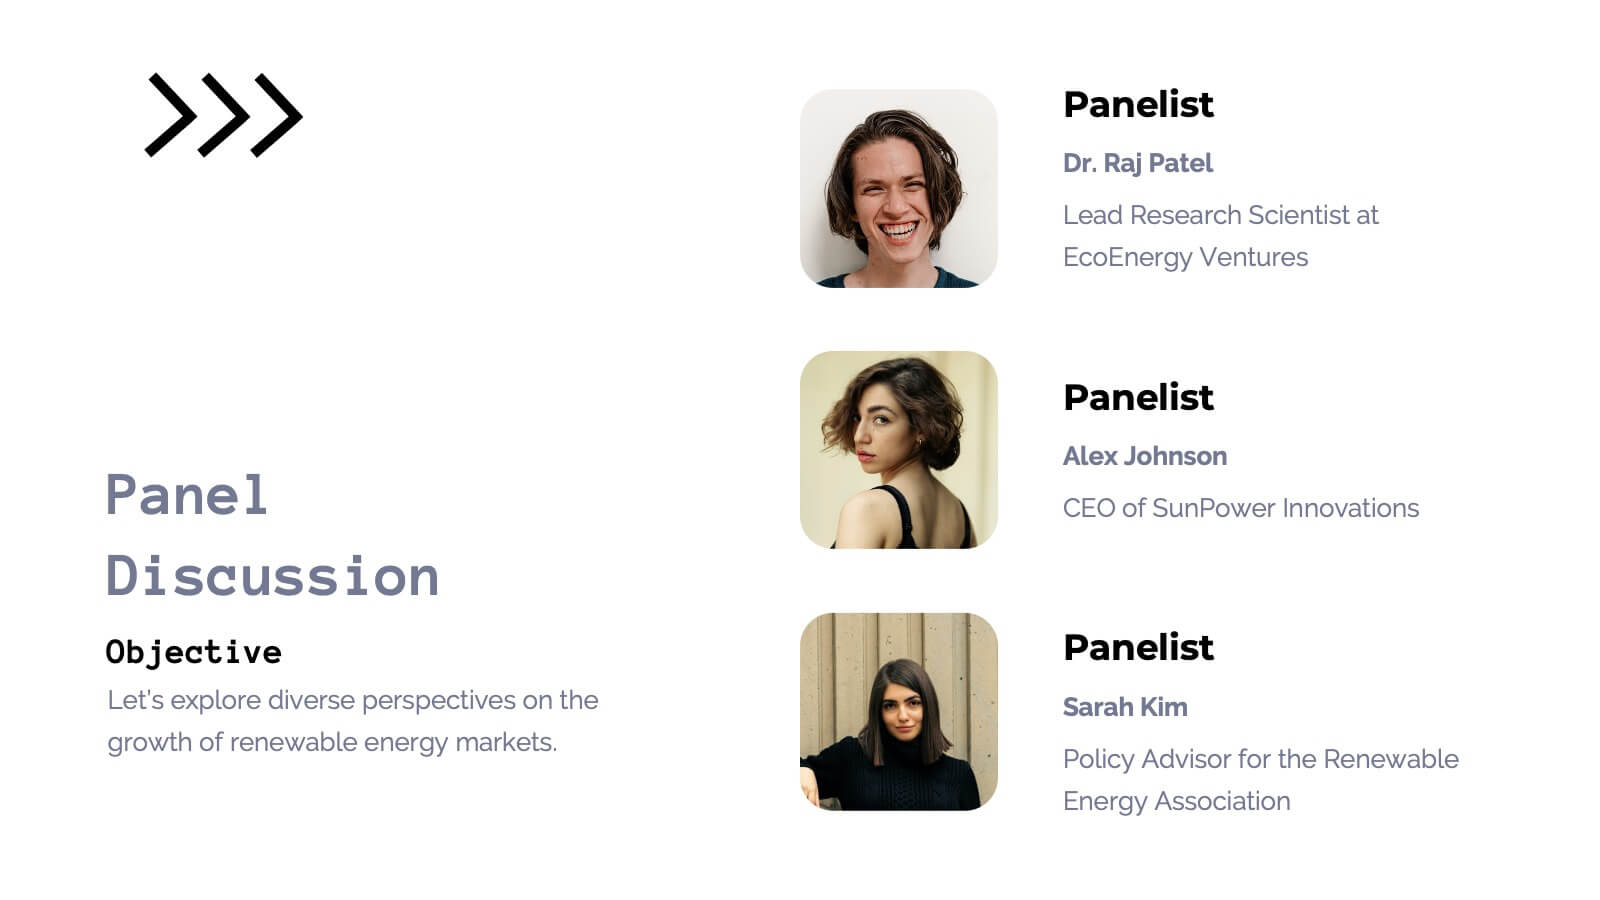
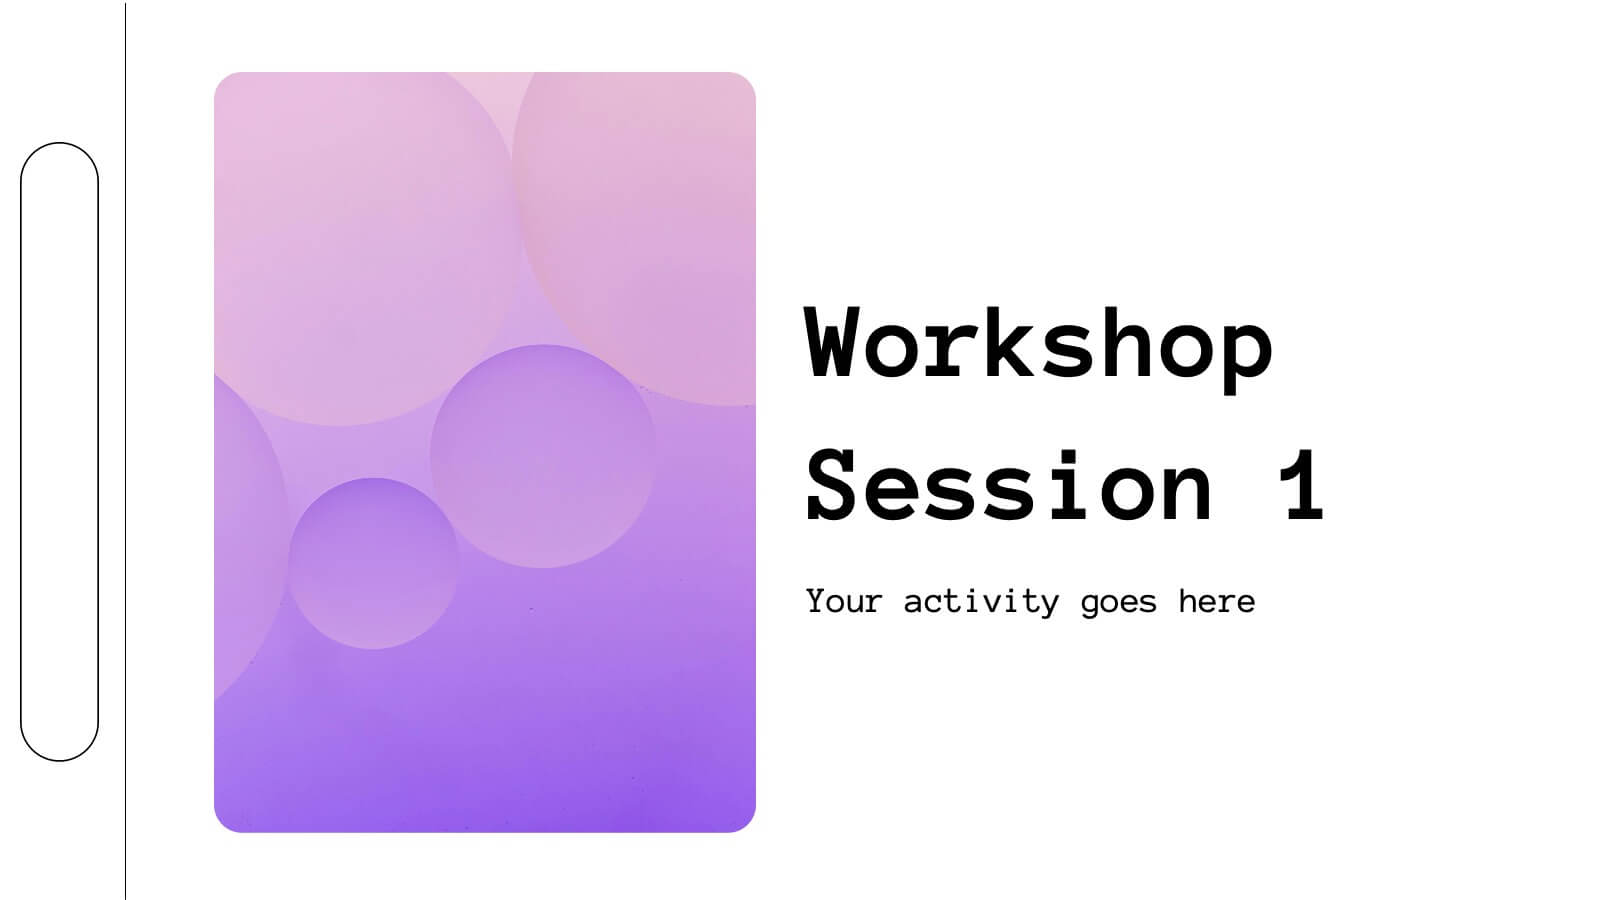
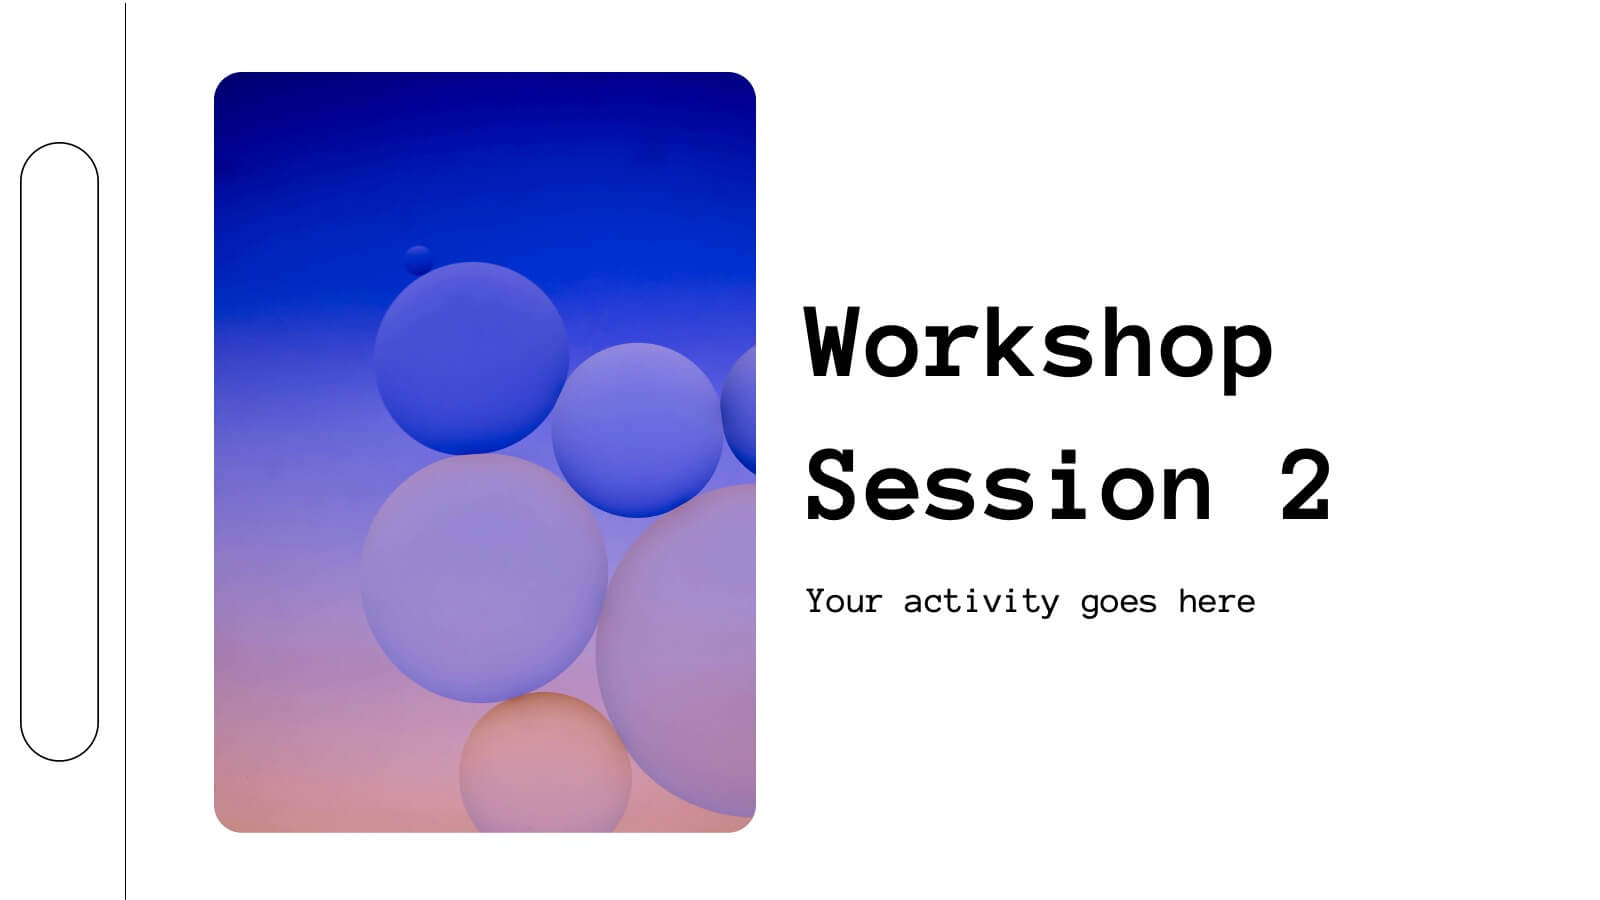
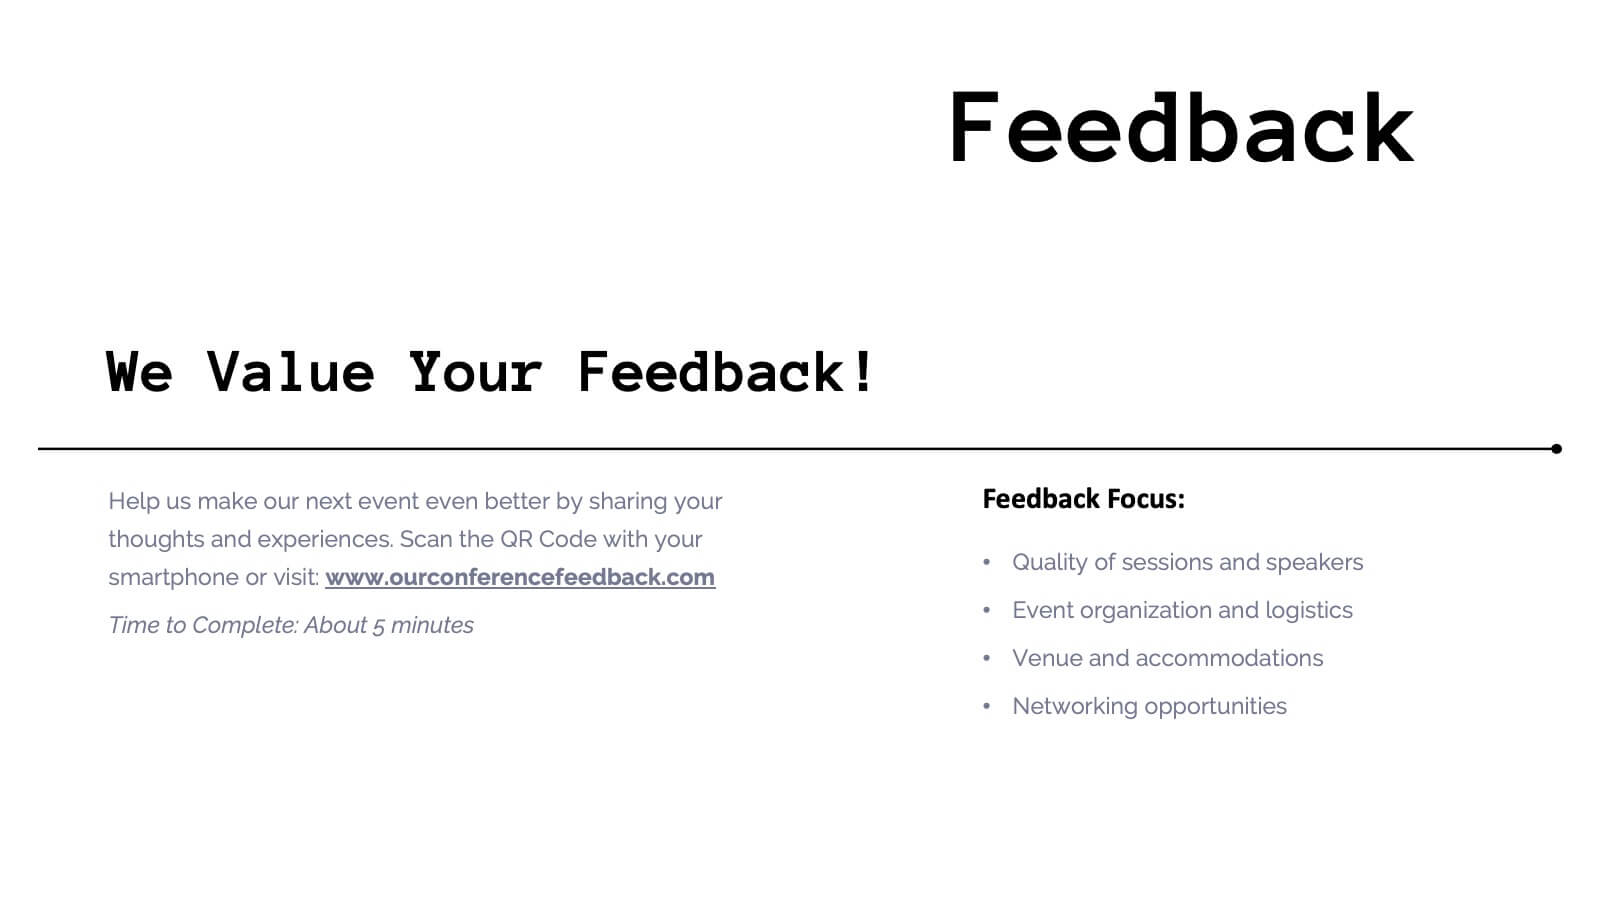
Pomona Business Plan Presentation
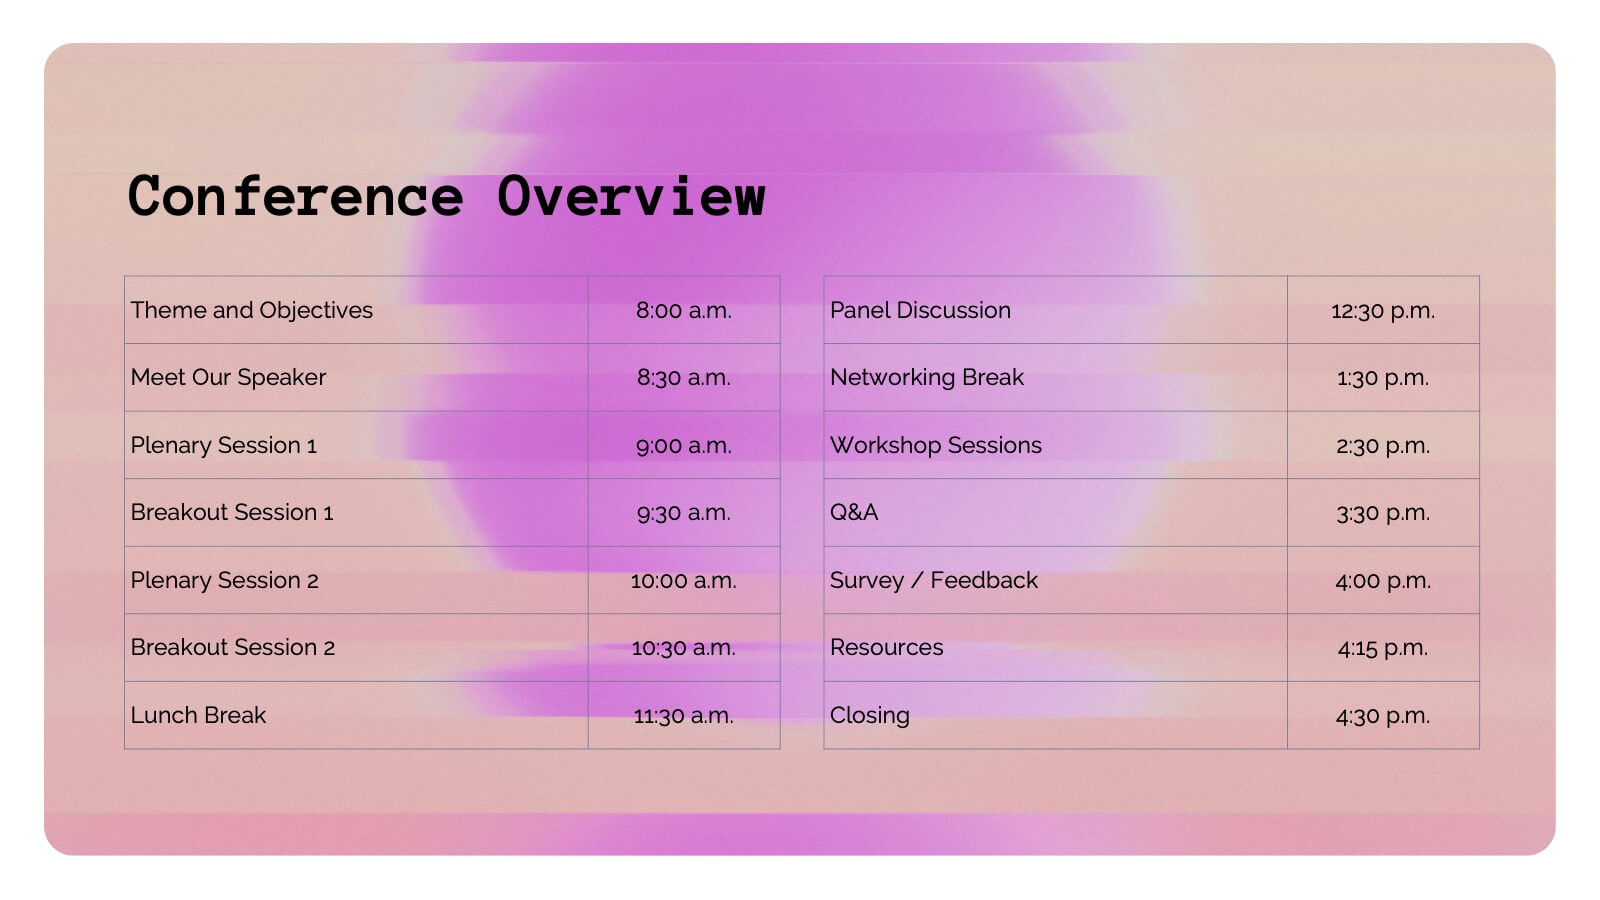
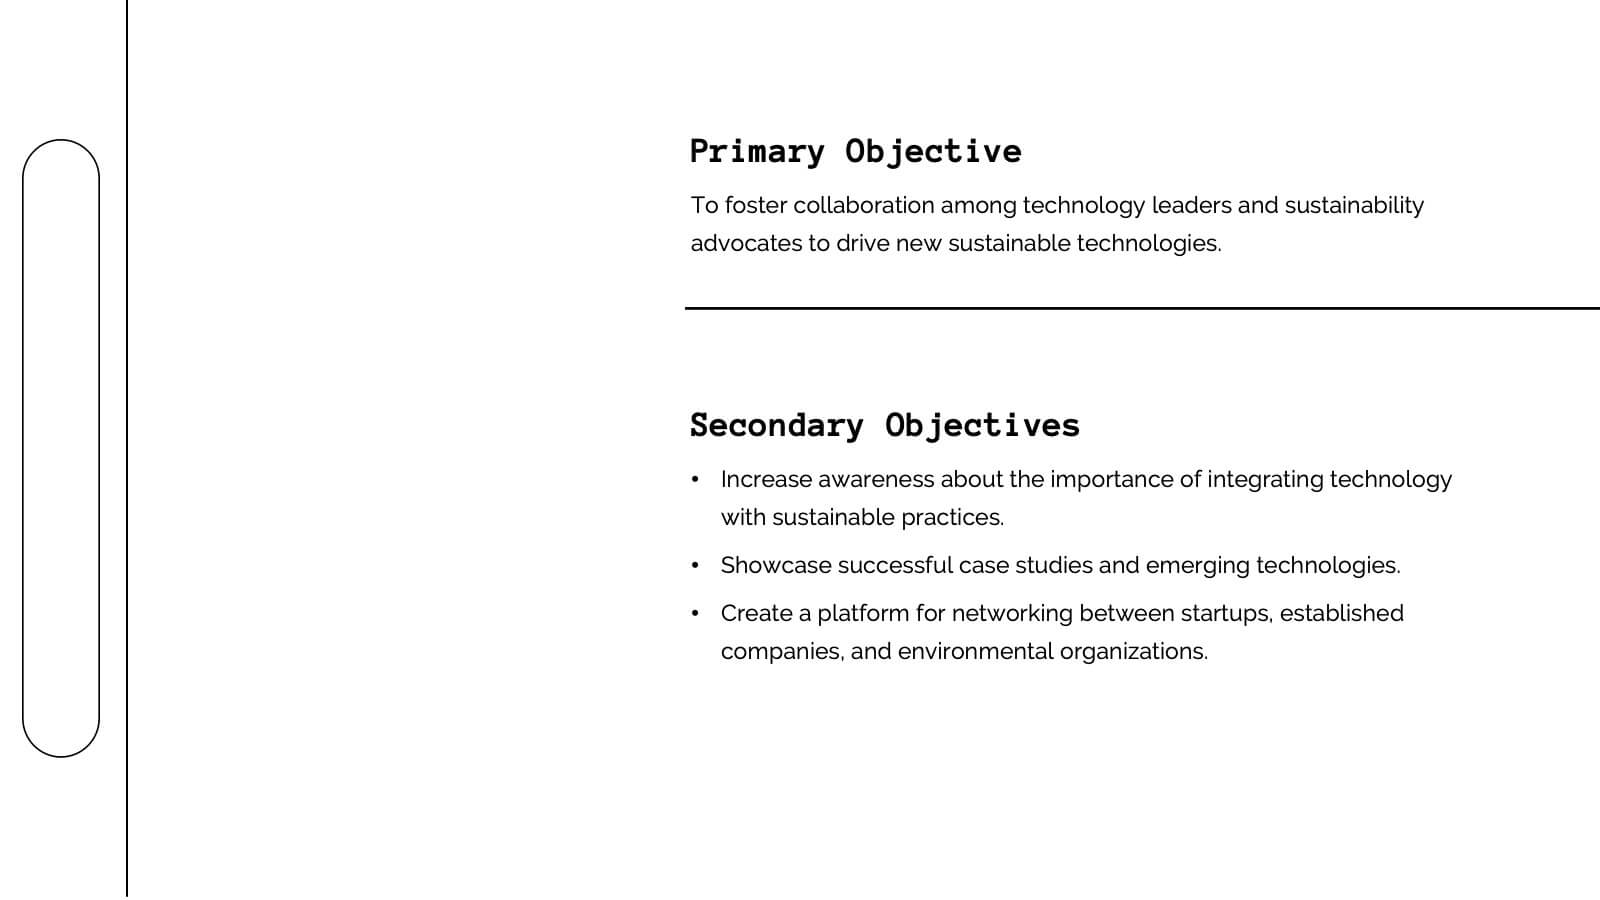
This vibrant and adaptable event agenda template is perfect for organizing your business conference or corporate event. It includes customizable sections for session details, speaker information, and key activities like networking breaks, workshops, and panel discussions. Compatible with PowerPoint, Keynote, and Google Slides, it ensures a smooth and engaging event presentation experience!


6 diapositivas
Evolution of an Industry Through Time Presentation
Visualize industry transformation with the Evolution of an Industry Through Time Presentation. This timeline-style layout is perfect for highlighting key milestones, technological shifts, or growth stages across decades. Ideal for consultants, educators, or corporate strategists. Fully editable in Canva, PowerPoint, Keynote, and Google Slides for easy adaptation.


6 diapositivas
Porter's Five Forces Competitive Rivalry Infographics
Analyze competitive rivalry effectively with our Porter's Five Forces Competitive Rivalry infographic template. This template is fully compatible with popular presentation software like PowerPoint, Keynote, and Google Slides, allowing you to easily customize it to illustrate and communicate the factors influencing competitive rivalry within an industry. The Porter's Five Forces Competitive Rivalry infographic template offers a visually engaging platform to outline Michael Porter's framework for analyzing competitive dynamics, with a focus on the competitive rivalry component. Whether you're a business strategist, analyst, or anyone interested in understanding industry competition, this template provides a user-friendly canvas to create informative presentations and educational materials. Deepen your understanding of Competitive Rivalry with this SEO-optimized infographic template, thoughtfully designed for clarity and ease of use. Customize it to showcase the factors affecting rivalry, such as the number of competitors, industry growth, differentiation, and exit barriers, ensuring that your audience gains valuable insights into competitive forces at play. Start crafting your personalized infographic today to analyze and strategize for competitive advantage effectively.


5 diapositivas
Business Decision-Making Questions
Streamline critical thinking with this interactive Business Decision-Making Questions template. Featuring a creative circular diagram and visual cues, it helps structure questions around options, evaluations, and outcomes. Ideal for brainstorming, strategic planning, and executive decision sessions. Fully editable in PowerPoint, Keynote, and Google Slides.