


Características


¿Tienes alguna pregunta?
Recomendar


6 diapositivas
Target Audience Segmentation Strategy
Break down your audience with clarity using the Target Audience Segmentation Strategy Presentation. This slide features a vibrant vertical funnel layout, ideal for displaying five customer segments or persona categories. Each layer is numbered and color-coded, with connected callout areas for detailed insights. Perfect for marketers, campaign strategists, or product teams presenting customer journey data, audience demographics, or behavioral insights. Fully customizable in PowerPoint, Keynote, and Google Slides—easily align the design with your brand colors and content structure.


7 diapositivas
Flow Chart Diagram Presentation
Flow charts are important because they provide a visual representation of a process or system, which helps to simplify complex information and make it easier to understand. Our Infographic flow charts are easy to use because they combine visual elements such as icons, and colors with concise text, making complex information more digestible and memorable. These highly adaptable flow charts are ideal due to their complete customizability, allowing for universal utilization to cater to the unique requirements of any individual. Do not waste any more precious time and get started right away.


6 diapositivas
Scope Planning Template for Project Teams Presentation
Turn teamwork into strategy with a clear, circular layout that maps every phase of your project plan. This modern presentation helps teams define objectives, assign roles, and visualize scope effortlessly. Easy to edit and fully compatible with PowerPoint, Keynote, and Google Slides for seamless collaboration and customization.


5 diapositivas
New Venture Pitch Deck Structure Presentation
Outline your pitch with clarity using the New Venture Pitch Deck Structure Presentation. Designed for startups and entrepreneurs, this vertical timeline layout helps you present key sections like business model, problem/solution, and go-to-market strategy. Fully editable in PowerPoint, Canva, and Google Slides to fit your branding needs.


6 diapositivas
Trends and Forecast Through Data Analytics Presentation
Visualize growth trajectories and future performance with the Trends and Forecast Through Data Analytics Presentation. Featuring clean bar charts and segmented legends, this template is ideal for financial projections, sales trends, and business growth analysis. Fully editable in PowerPoint, Keynote, and Google Slides for seamless customization.


5 diapositivas
Training and Development Onboarding
Streamline your employee learning journey with the Training and Development Onboarding Presentation. This modern, five-step roadmap uses a wave-style flow from A to E, allowing you to break down each stage of training with matching step labels and title placeholders. Ideal for HR professionals, team leaders, and onboarding managers, it’s perfect for introducing structured learning, role-specific training, or compliance modules. Compatible with PowerPoint, Keynote, and Google Slides, and fully editable to match your brand style.


10 diapositivas
Search Engine Optimization (SEO) Strategy Presentation
Present your digital marketing plan with clarity using this vibrant SEO strategy layout. Featuring a magnifying glass infographic at the center and five segmented areas for key actions, this template is ideal for mapping keyword research, on-page optimization, content creation, link building, and performance tracking. Great for marketing agencies, SEO consultants, and website owners. Fully editable in PowerPoint, Keynote, and Google Slides.


2 diapositivas
Bold and Minimal Opening Presentation Layout
Make your first slide speak volumes with this bold yet minimal opening layout. Designed to grab attention while keeping things simple, this template helps you introduce your presentation with clarity and confidence. Great for modern business decks, it’s fully customizable and works seamlessly in PowerPoint, Keynote, and Google Slides.

22 diapositivas
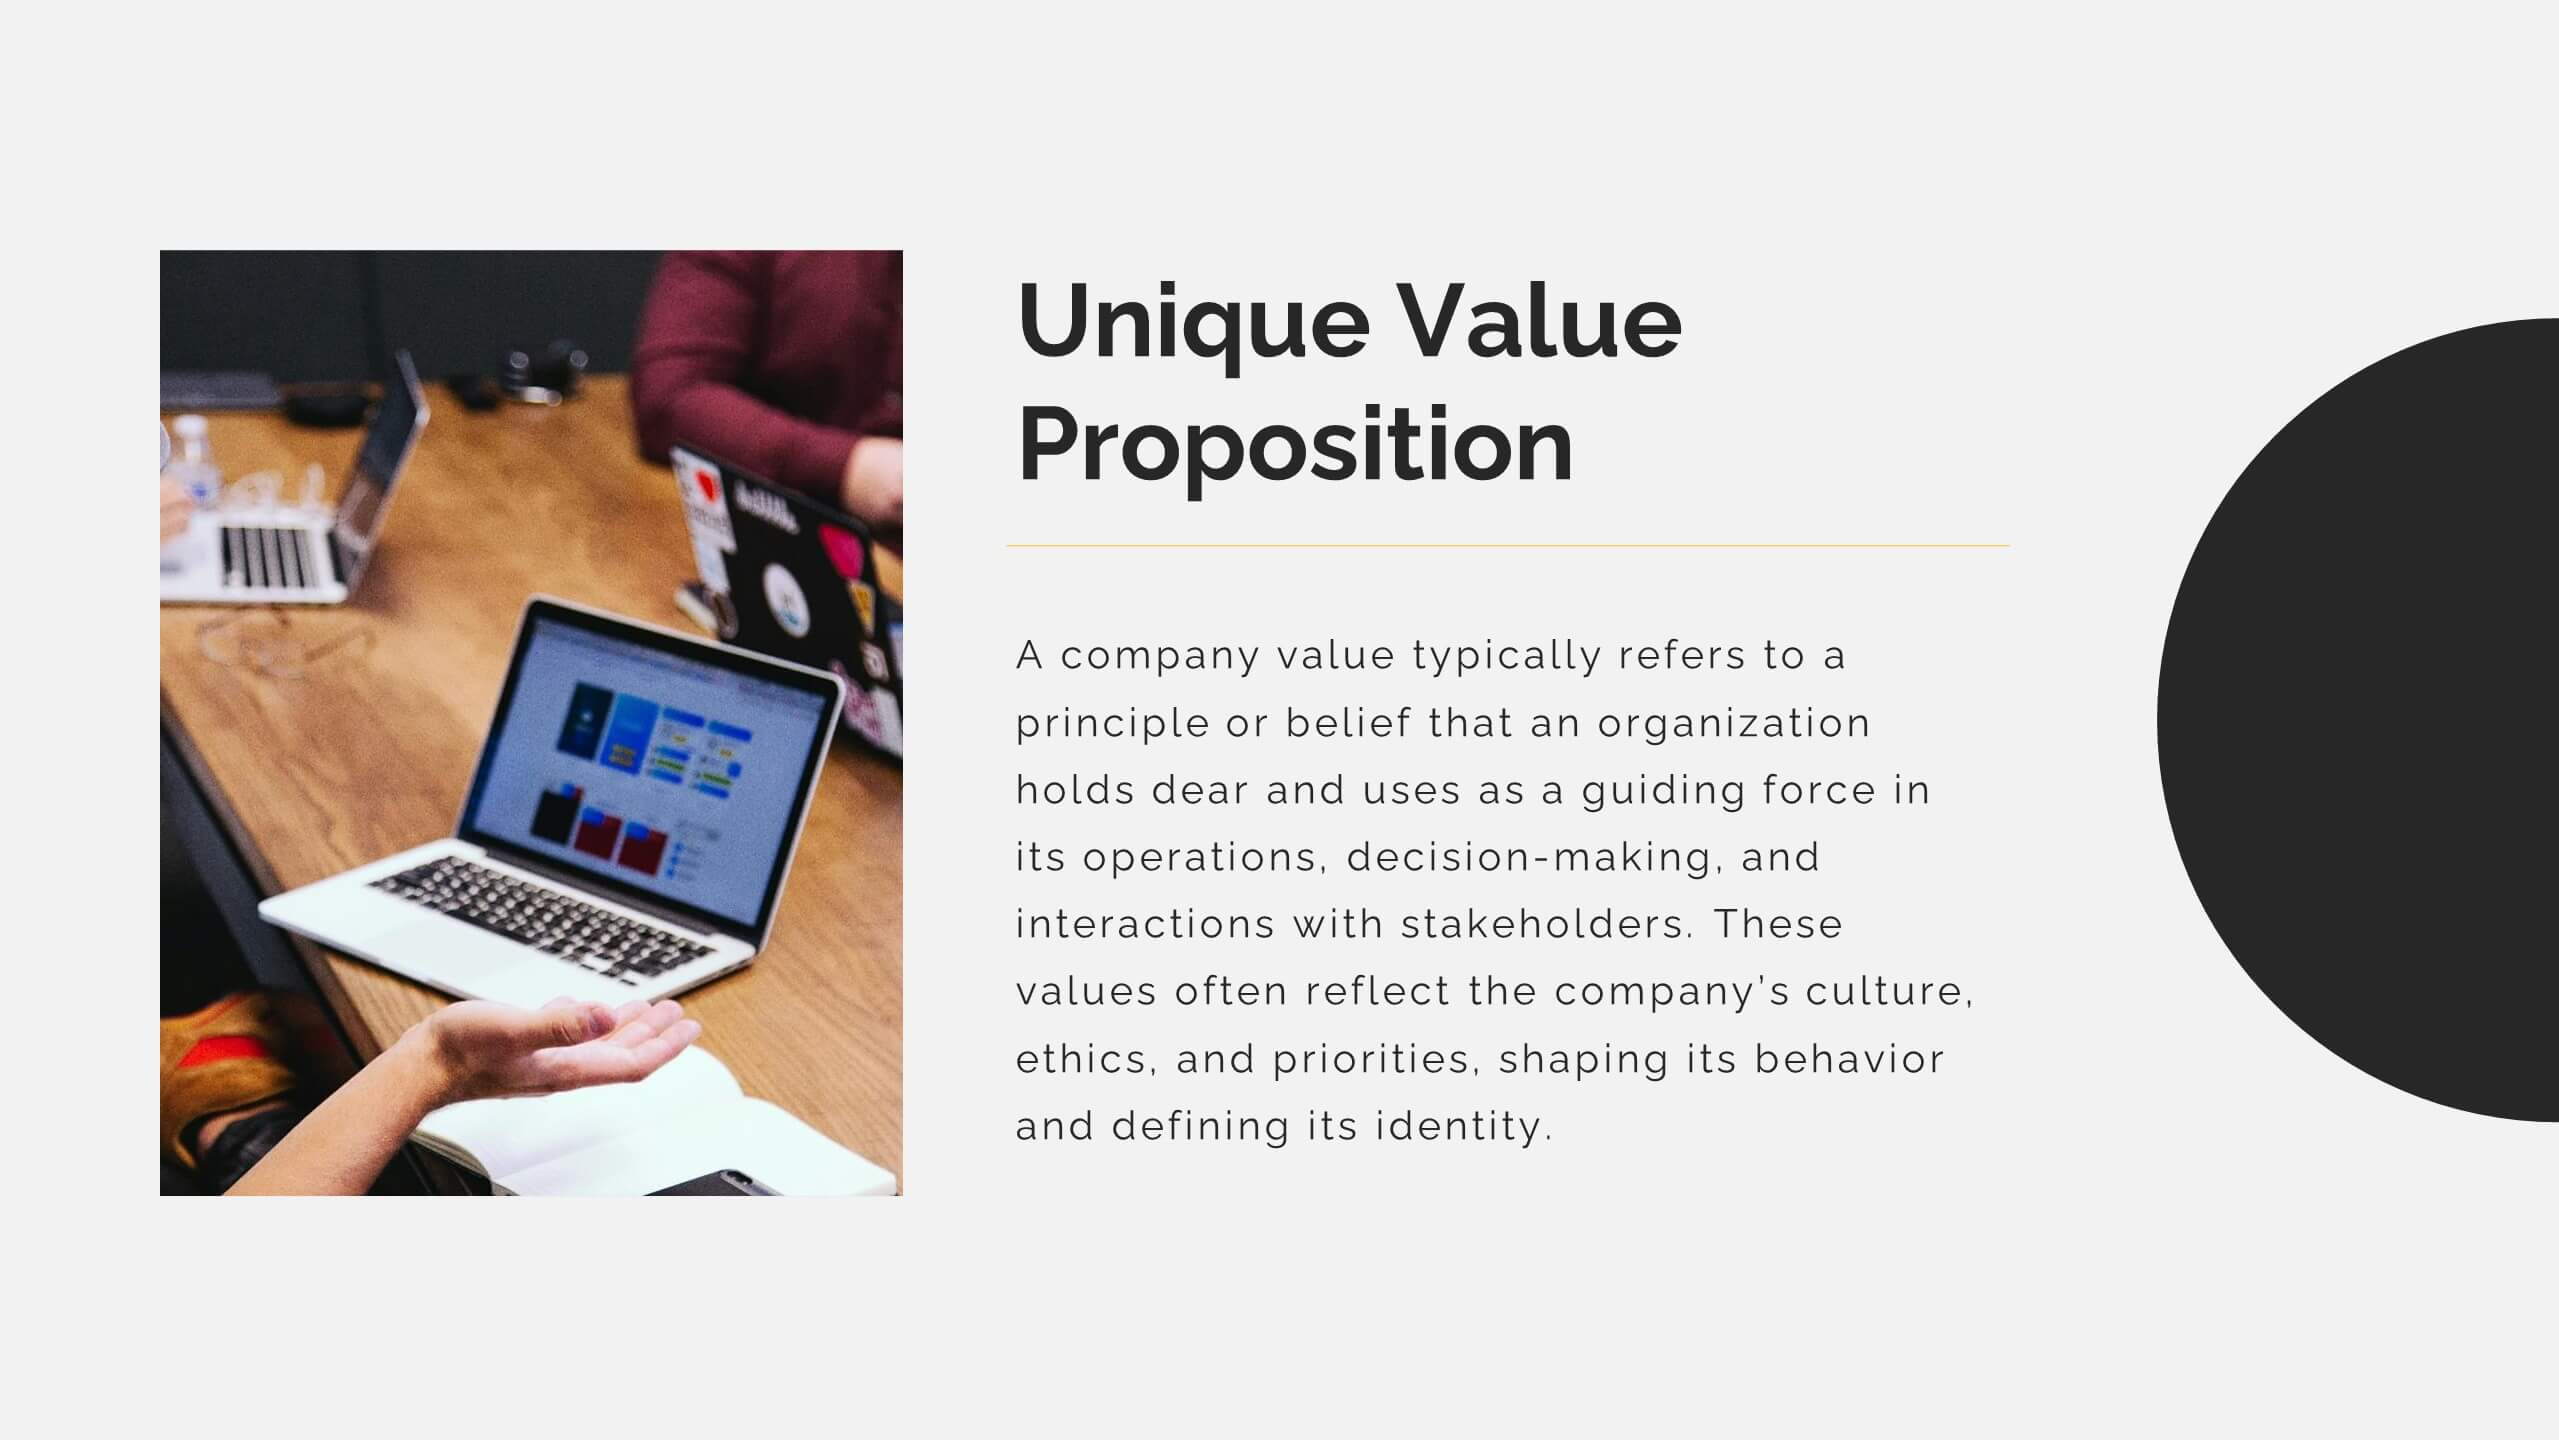
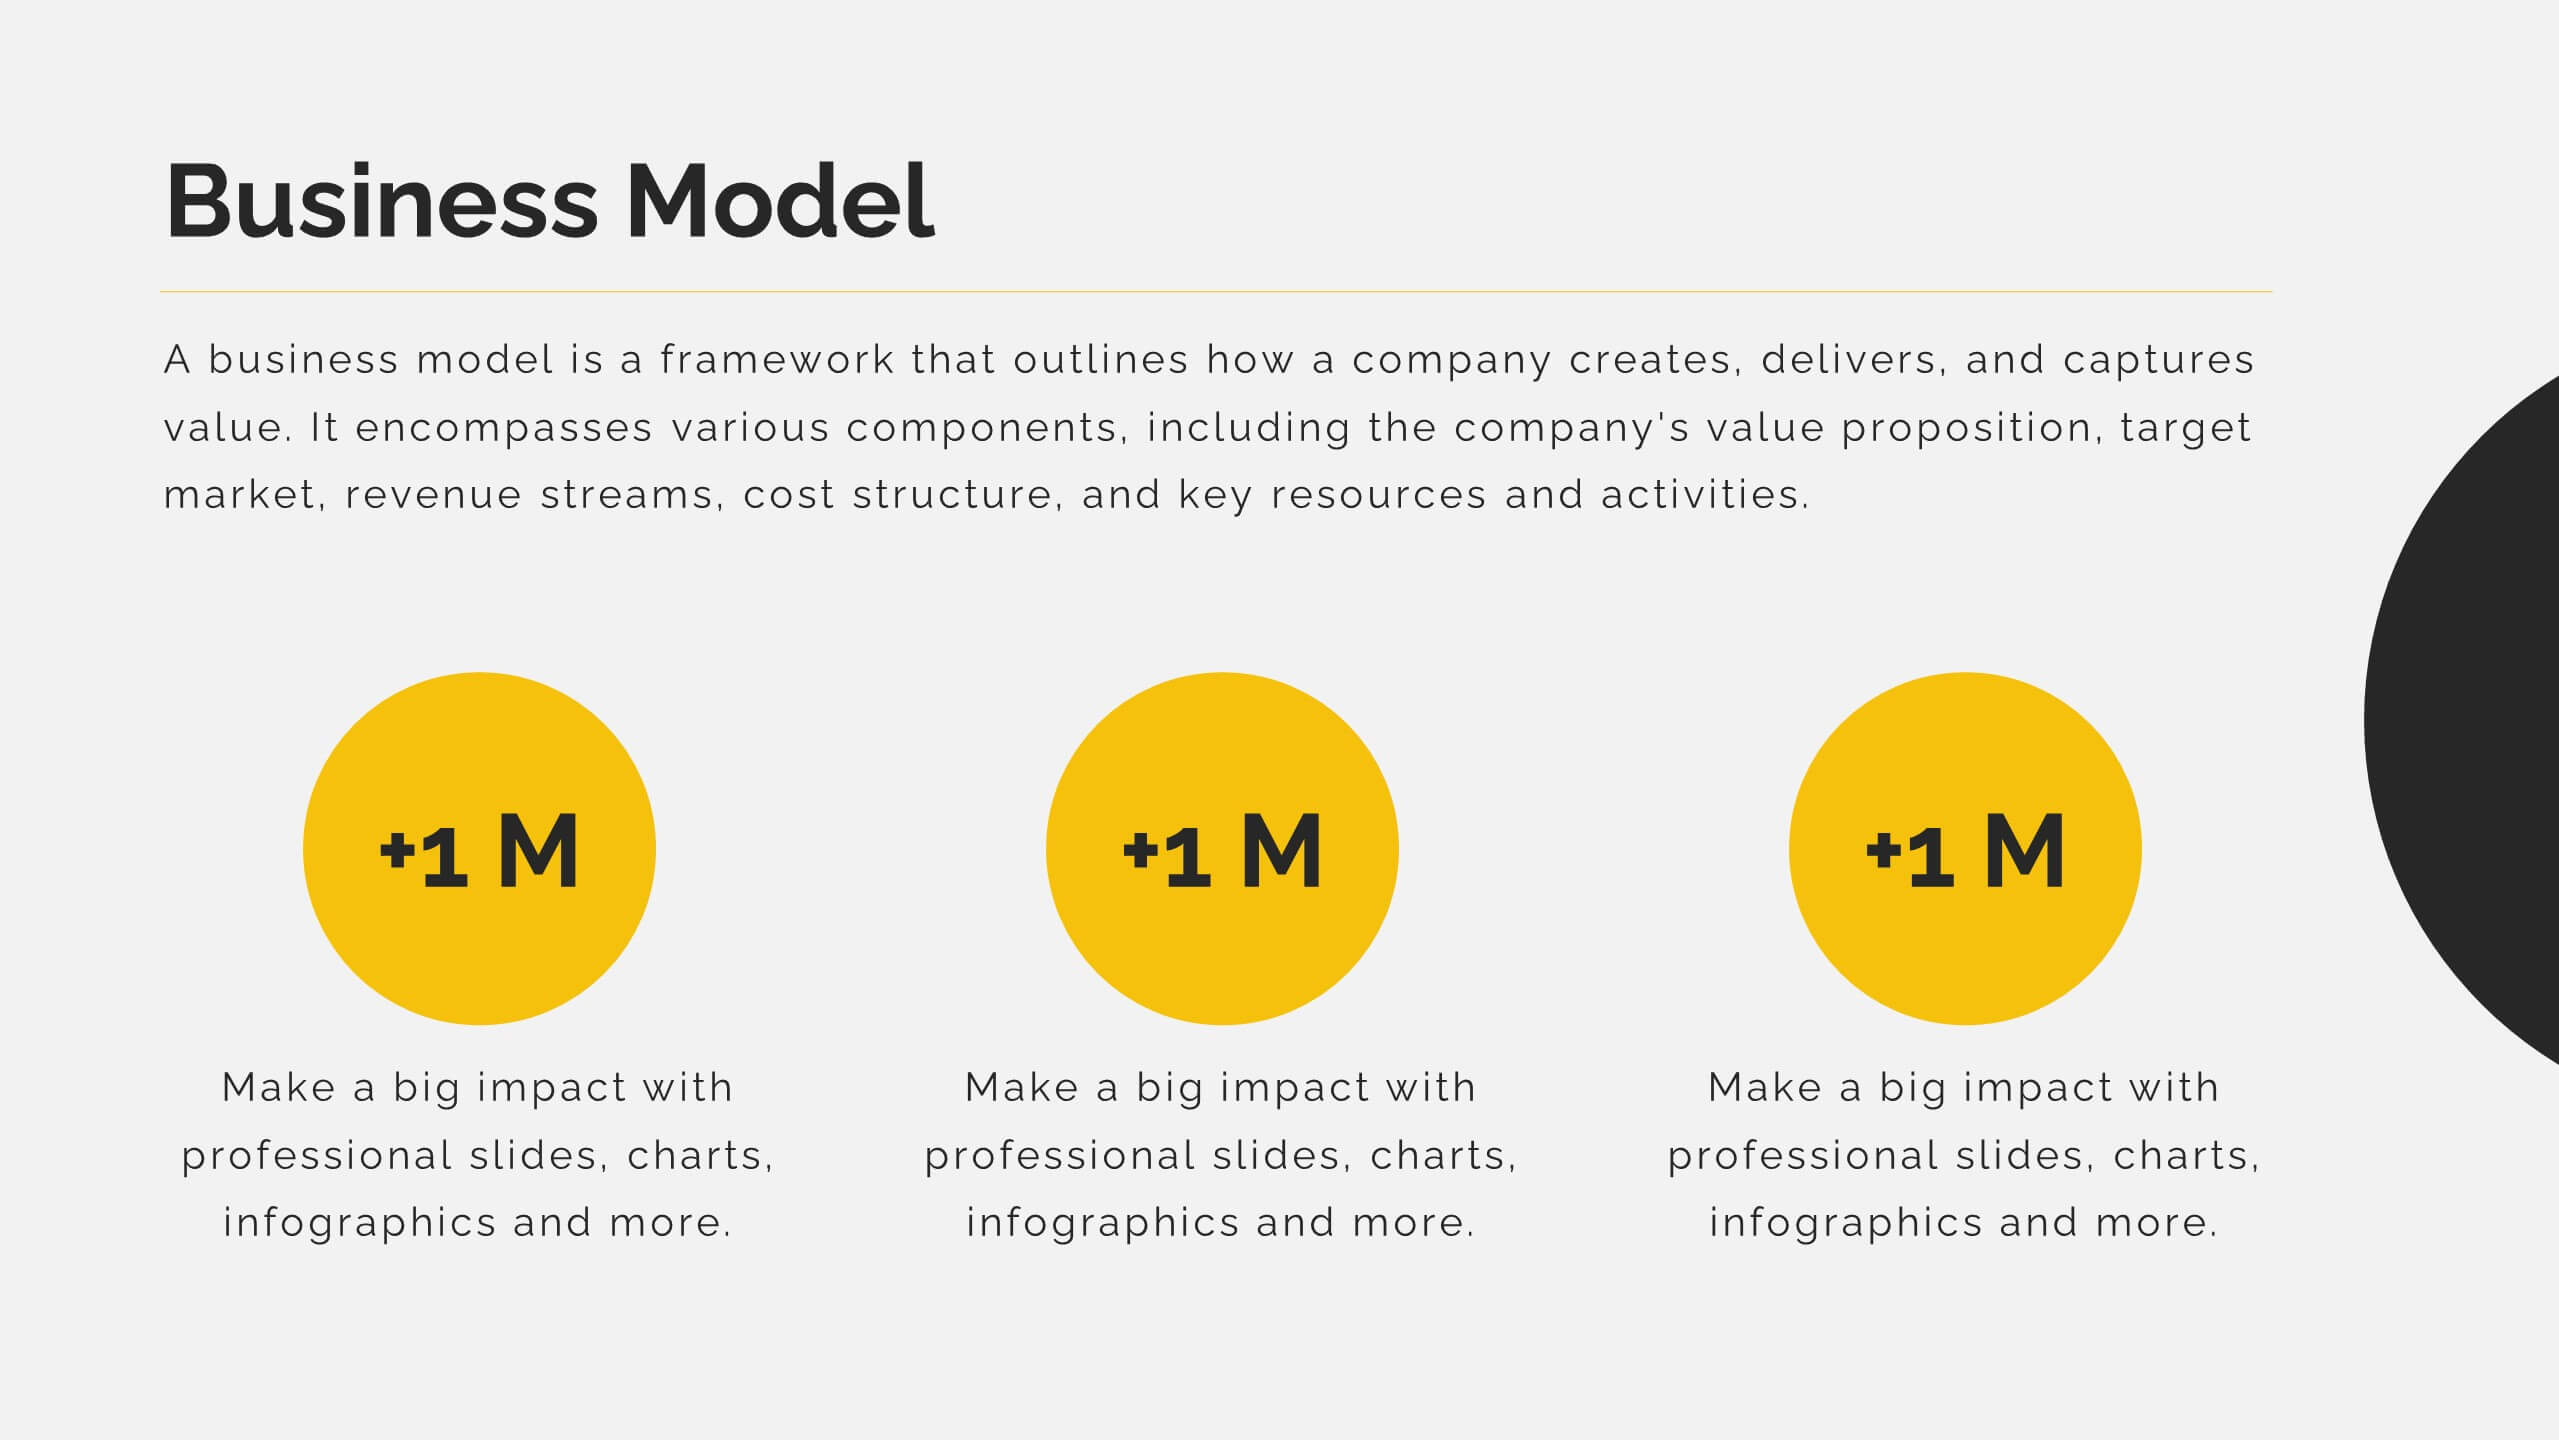
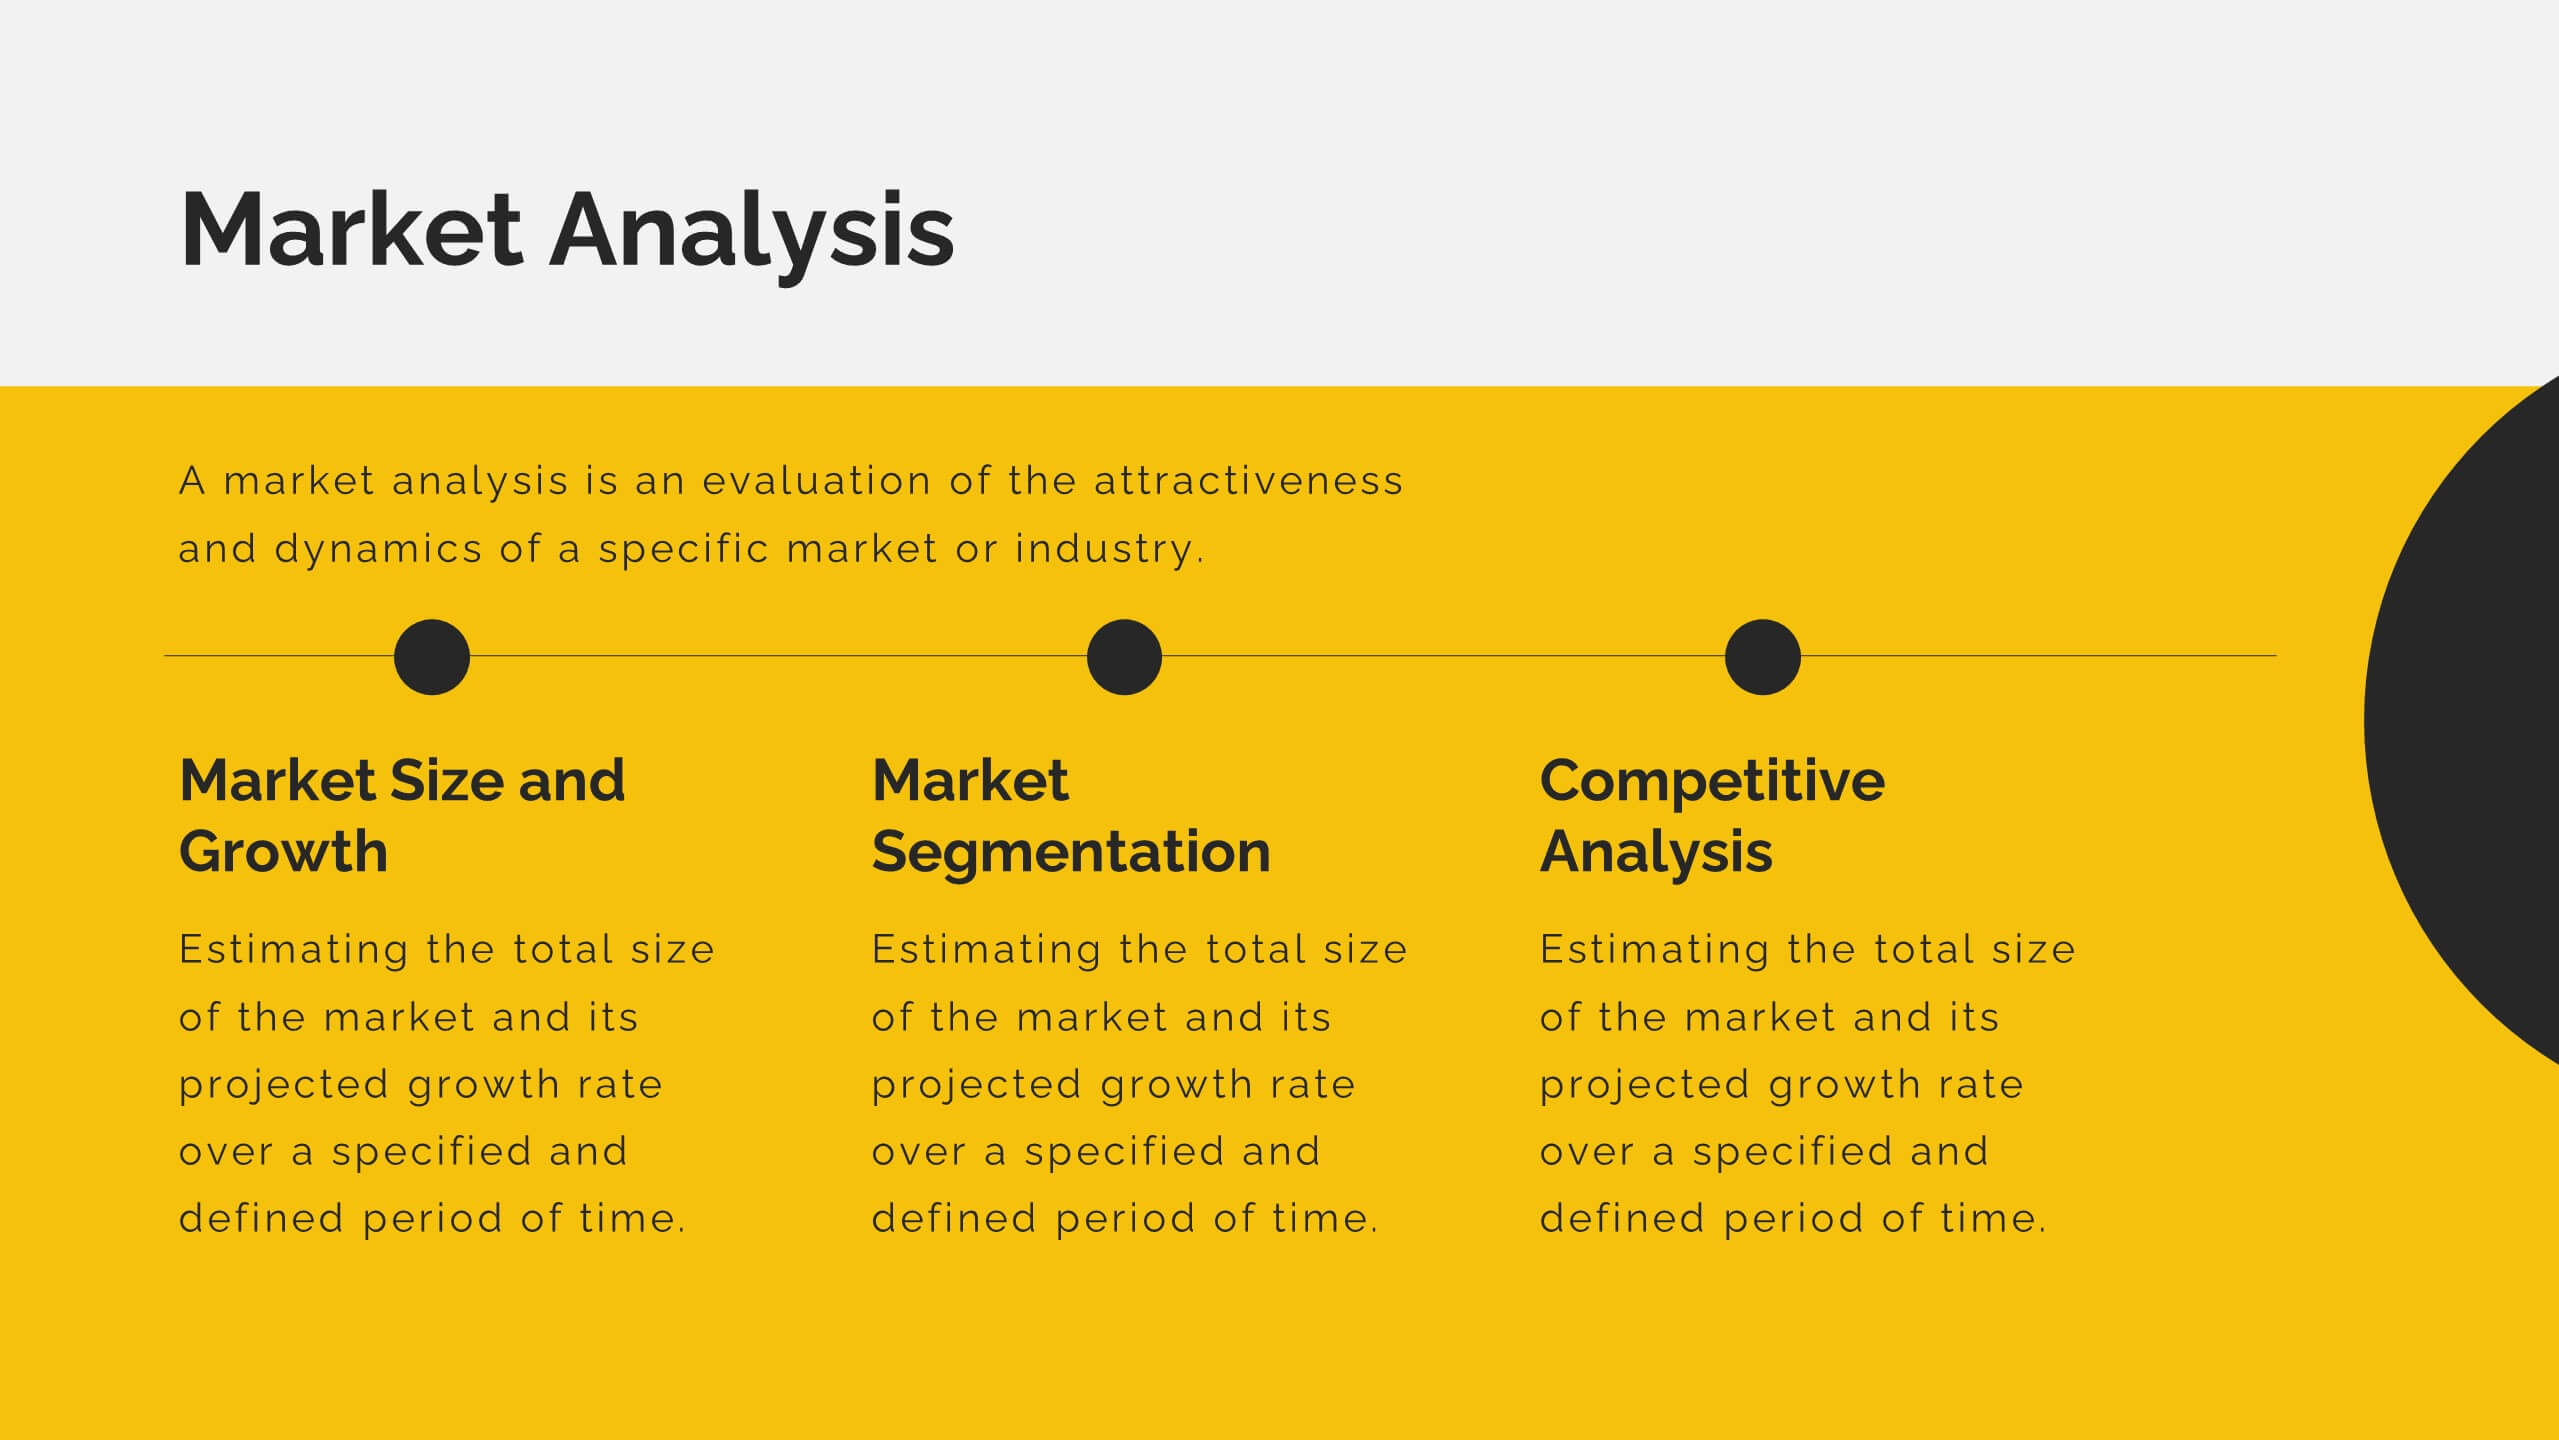
Mirage Startup Funding Proposal Presentation
Secure funding with this dynamic startup proposal template! Perfect for presenting your mission, vision, business model, and market analysis. Ideal for entrepreneurs aiming to impress investors and stakeholders. Compatible with PowerPoint, Keynote, and Google Slides, this template ensures your proposal is clear, professional, and compelling. Achieve your startup goals today!


23 diapositivas
Tempest Design Portfolio Presentation
Elevate your creative showcase with the Tempest Design Portfolio Presentation template! This beautifully crafted layout is designed to highlight your best work in a sophisticated and professional manner. The subtle earthy tones and minimalist design create a perfect backdrop for presenting your projects, from the initial concept to the final execution. Whether you're an individual designer or a creative agency, this template allows you to elegantly present your portfolio, philosophy, and style, making a powerful impact on your audience. Each slide is thoughtfully designed to emphasize your achievements, client testimonials, and services offered, ensuring that your work shines through with clarity and style. Ideal for client presentations, creative pitches, or showcasing your portfolio online, this template is fully compatible with PowerPoint, Keynote, and Google Slides. Make your design story unforgettable with the Tempest template, and let your creativity speak volumes!


5 diapositivas
Coffee Tasting Infographics
Coffee Tasting, also known as coffee cupping, is the process of evaluating and appreciating the flavors, aromas, and characteristics of different coffee beans. These infographic templates are designed to educate participants about the art of coffee tasting. The captivating visuals will empower your audience to appreciate the flavors and nuances of different coffee varieties. Whether you're hosting a coffee tasting event or sharing information with coffee enthusiasts, this template will help you deliver an engaging and visually appealing presentation that celebrates the joy of coffee tasting. Compatible with Powerpoint, Keynote, and Google Slides.


4 diapositivas
Left and Right Brain Diagram Presentation
Unlock the perfect blend of logic and creativity with a visual layout that highlights how analytical thinking and imaginative ideas work together. This presentation makes it easy to compare concepts, explain processes, and illustrate dual perspectives with clarity and color. Fully compatible with PowerPoint, Keynote, and Google Slides.


5 diapositivas
Effects of Cyberbullying Infographics
Cyberbullying refers to the use of electronic communication platforms, such as social media, text messages, or online forums, to harass, intimidate, or target individuals. With these infographics, you can effectively communicate the seriousness of cyberbullying and its detrimental effects on individuals. Whether you're delivering a presentation, creating educational materials, or sharing information online, this template provides a visually impactful way to raise awareness and promote conversations about cyberbullying prevention and support for victims. They incorporate eye-catching visuals, icons, and color schemes to effectively convey information and engage your audience.


7 diapositivas
Meeting Infographic Presentation Template
Meetings are an important part of workplace culture. They help people build relationships, share ideas and make decisions. This template is a great way to show the importance of meetings to your managers and employees. This presentation can be used in a workplace to show how meetings help team members share knowledge and work. By providing an open dialogue, they can also be a useful tool for making employees feel valued and heard. Using the fun customizable illustrations provided in the template, keep your team members engaged on meetings and boost the entire team’s work ethic.


3 diapositivas
Triangle Diagram for Strategic Layers Presentation
Visualize interconnected processes or layered strategies with the Triangle Diagram for Strategic Layers Presentation. This slide features three dynamic triangle shapes arranged in a circular flow, perfect for representing cycles, frameworks, or pillars of a system. Each point includes space for a title, icon, and supporting text. Great for illustrating collaboration, dependencies, or strategic pillars. Compatible with PowerPoint, Keynote, and Google Slides.


6 diapositivas
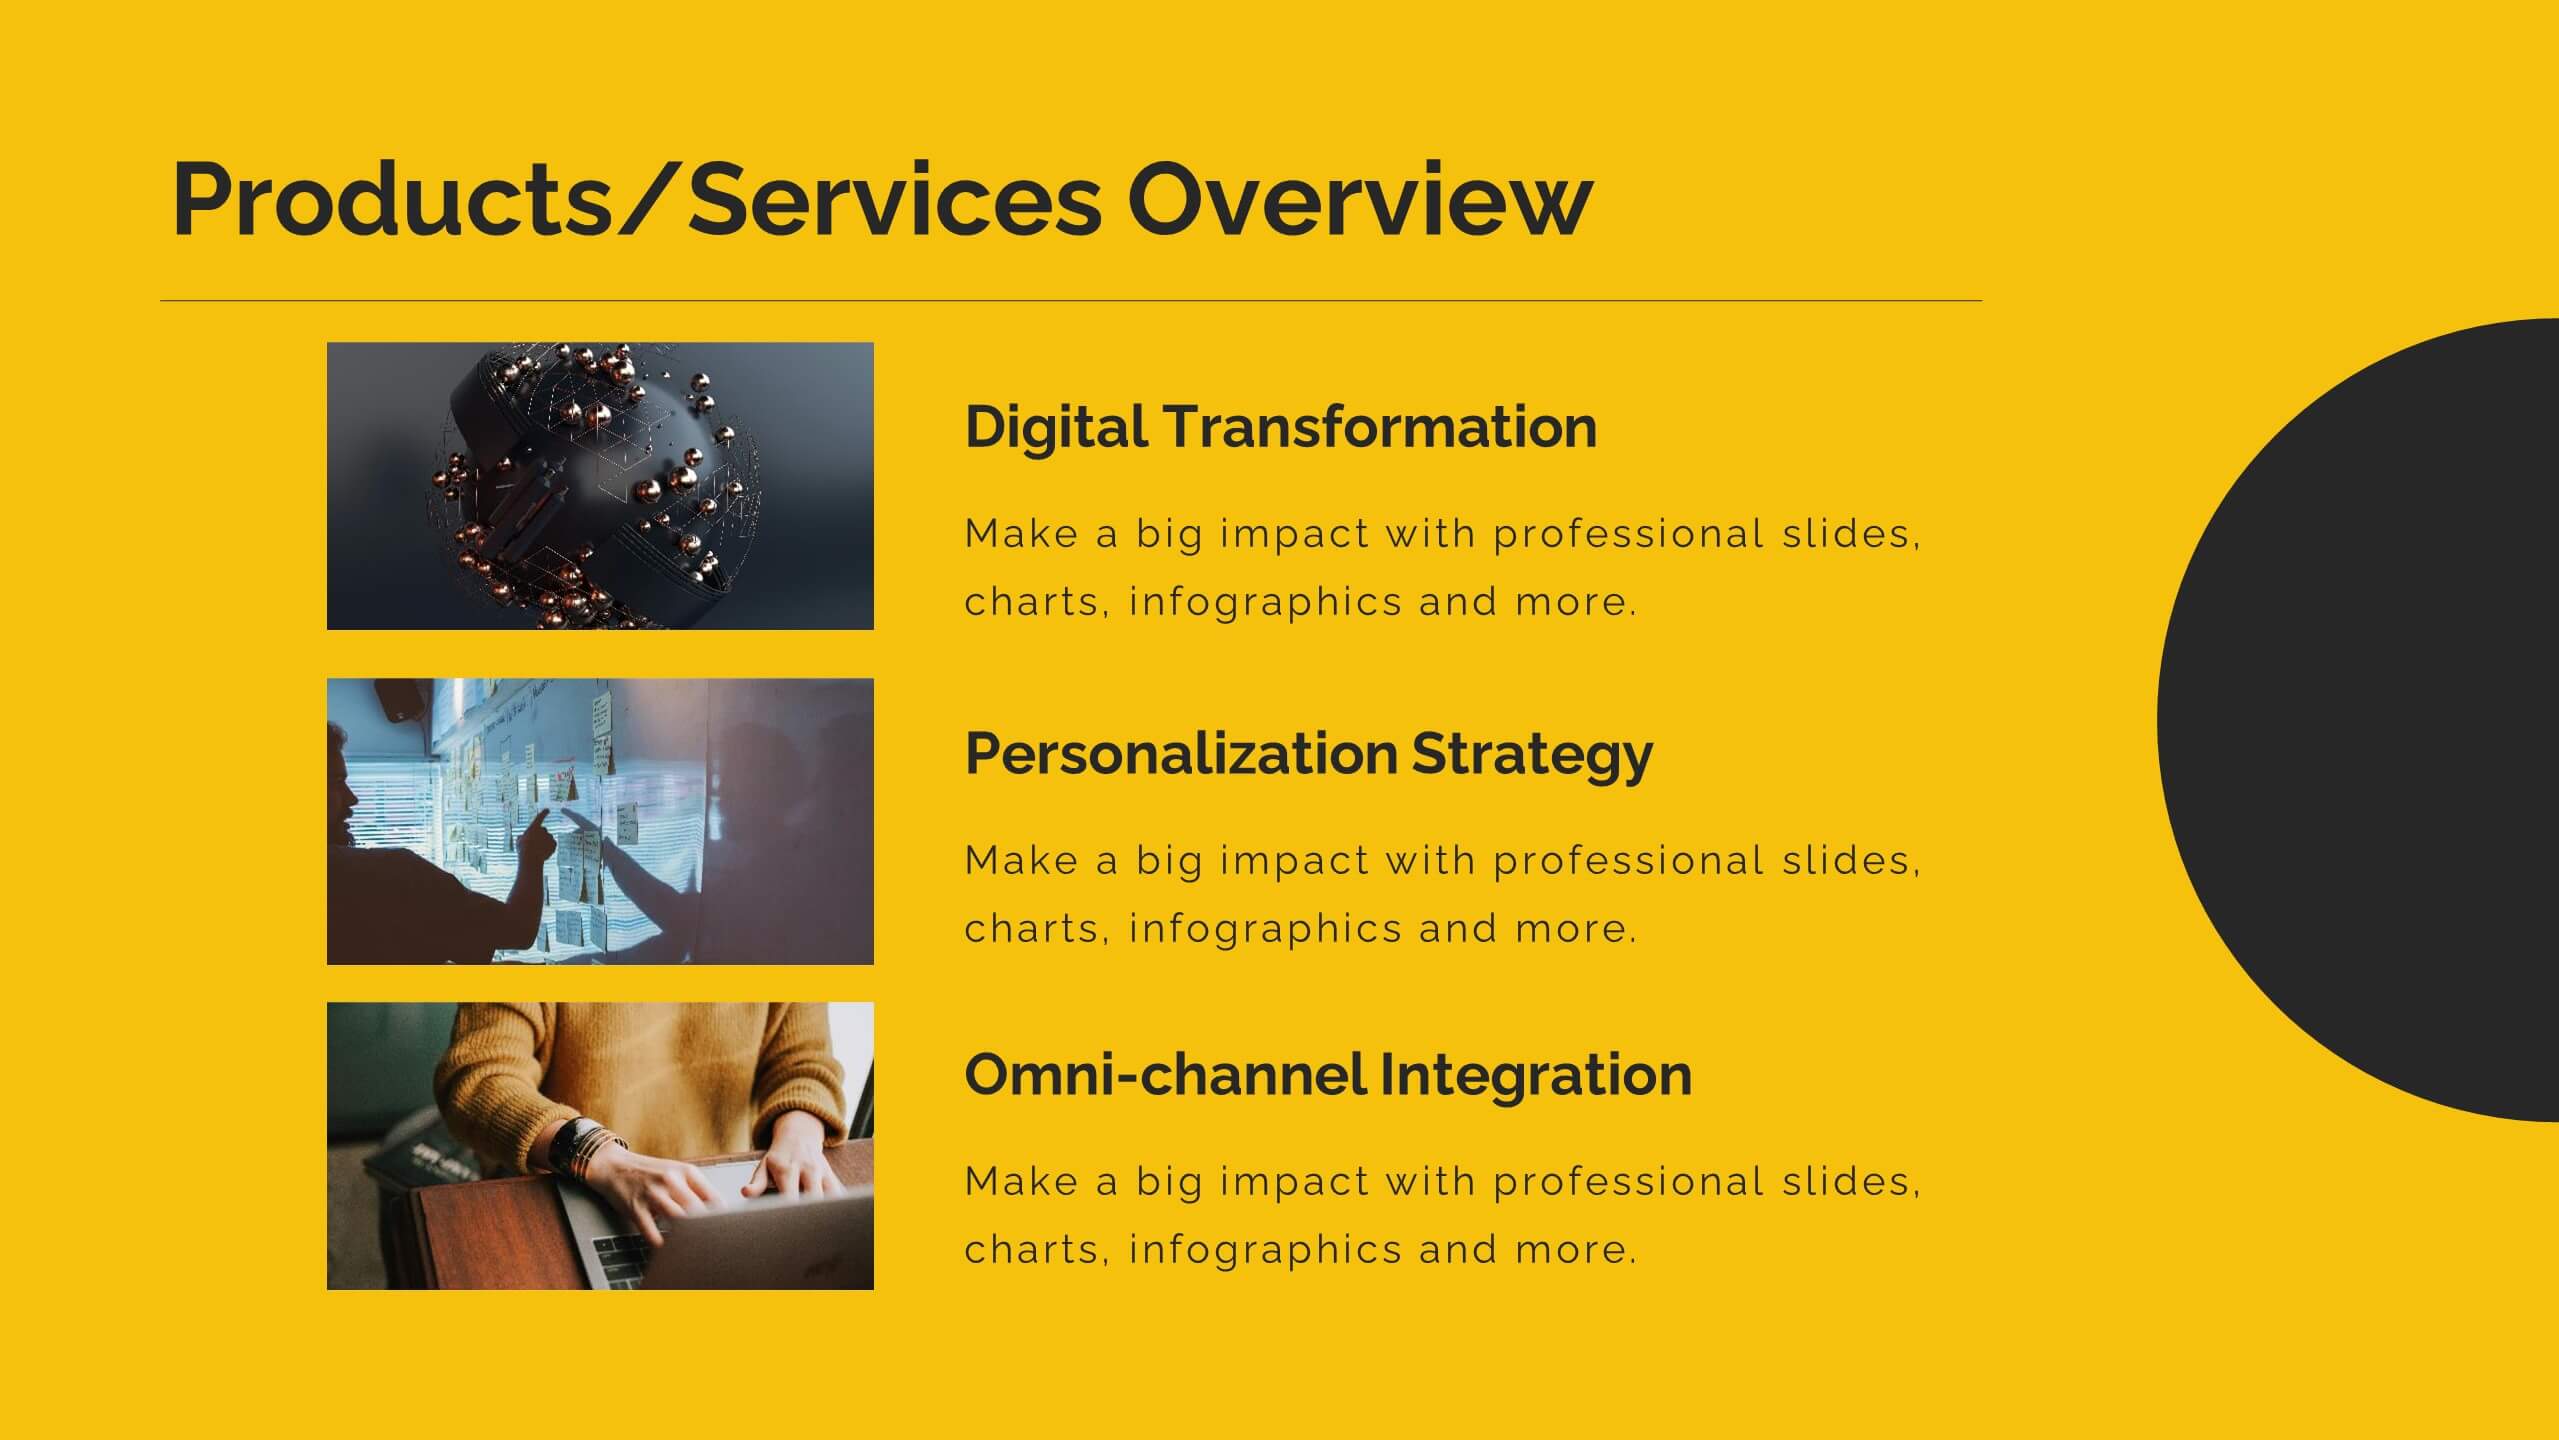
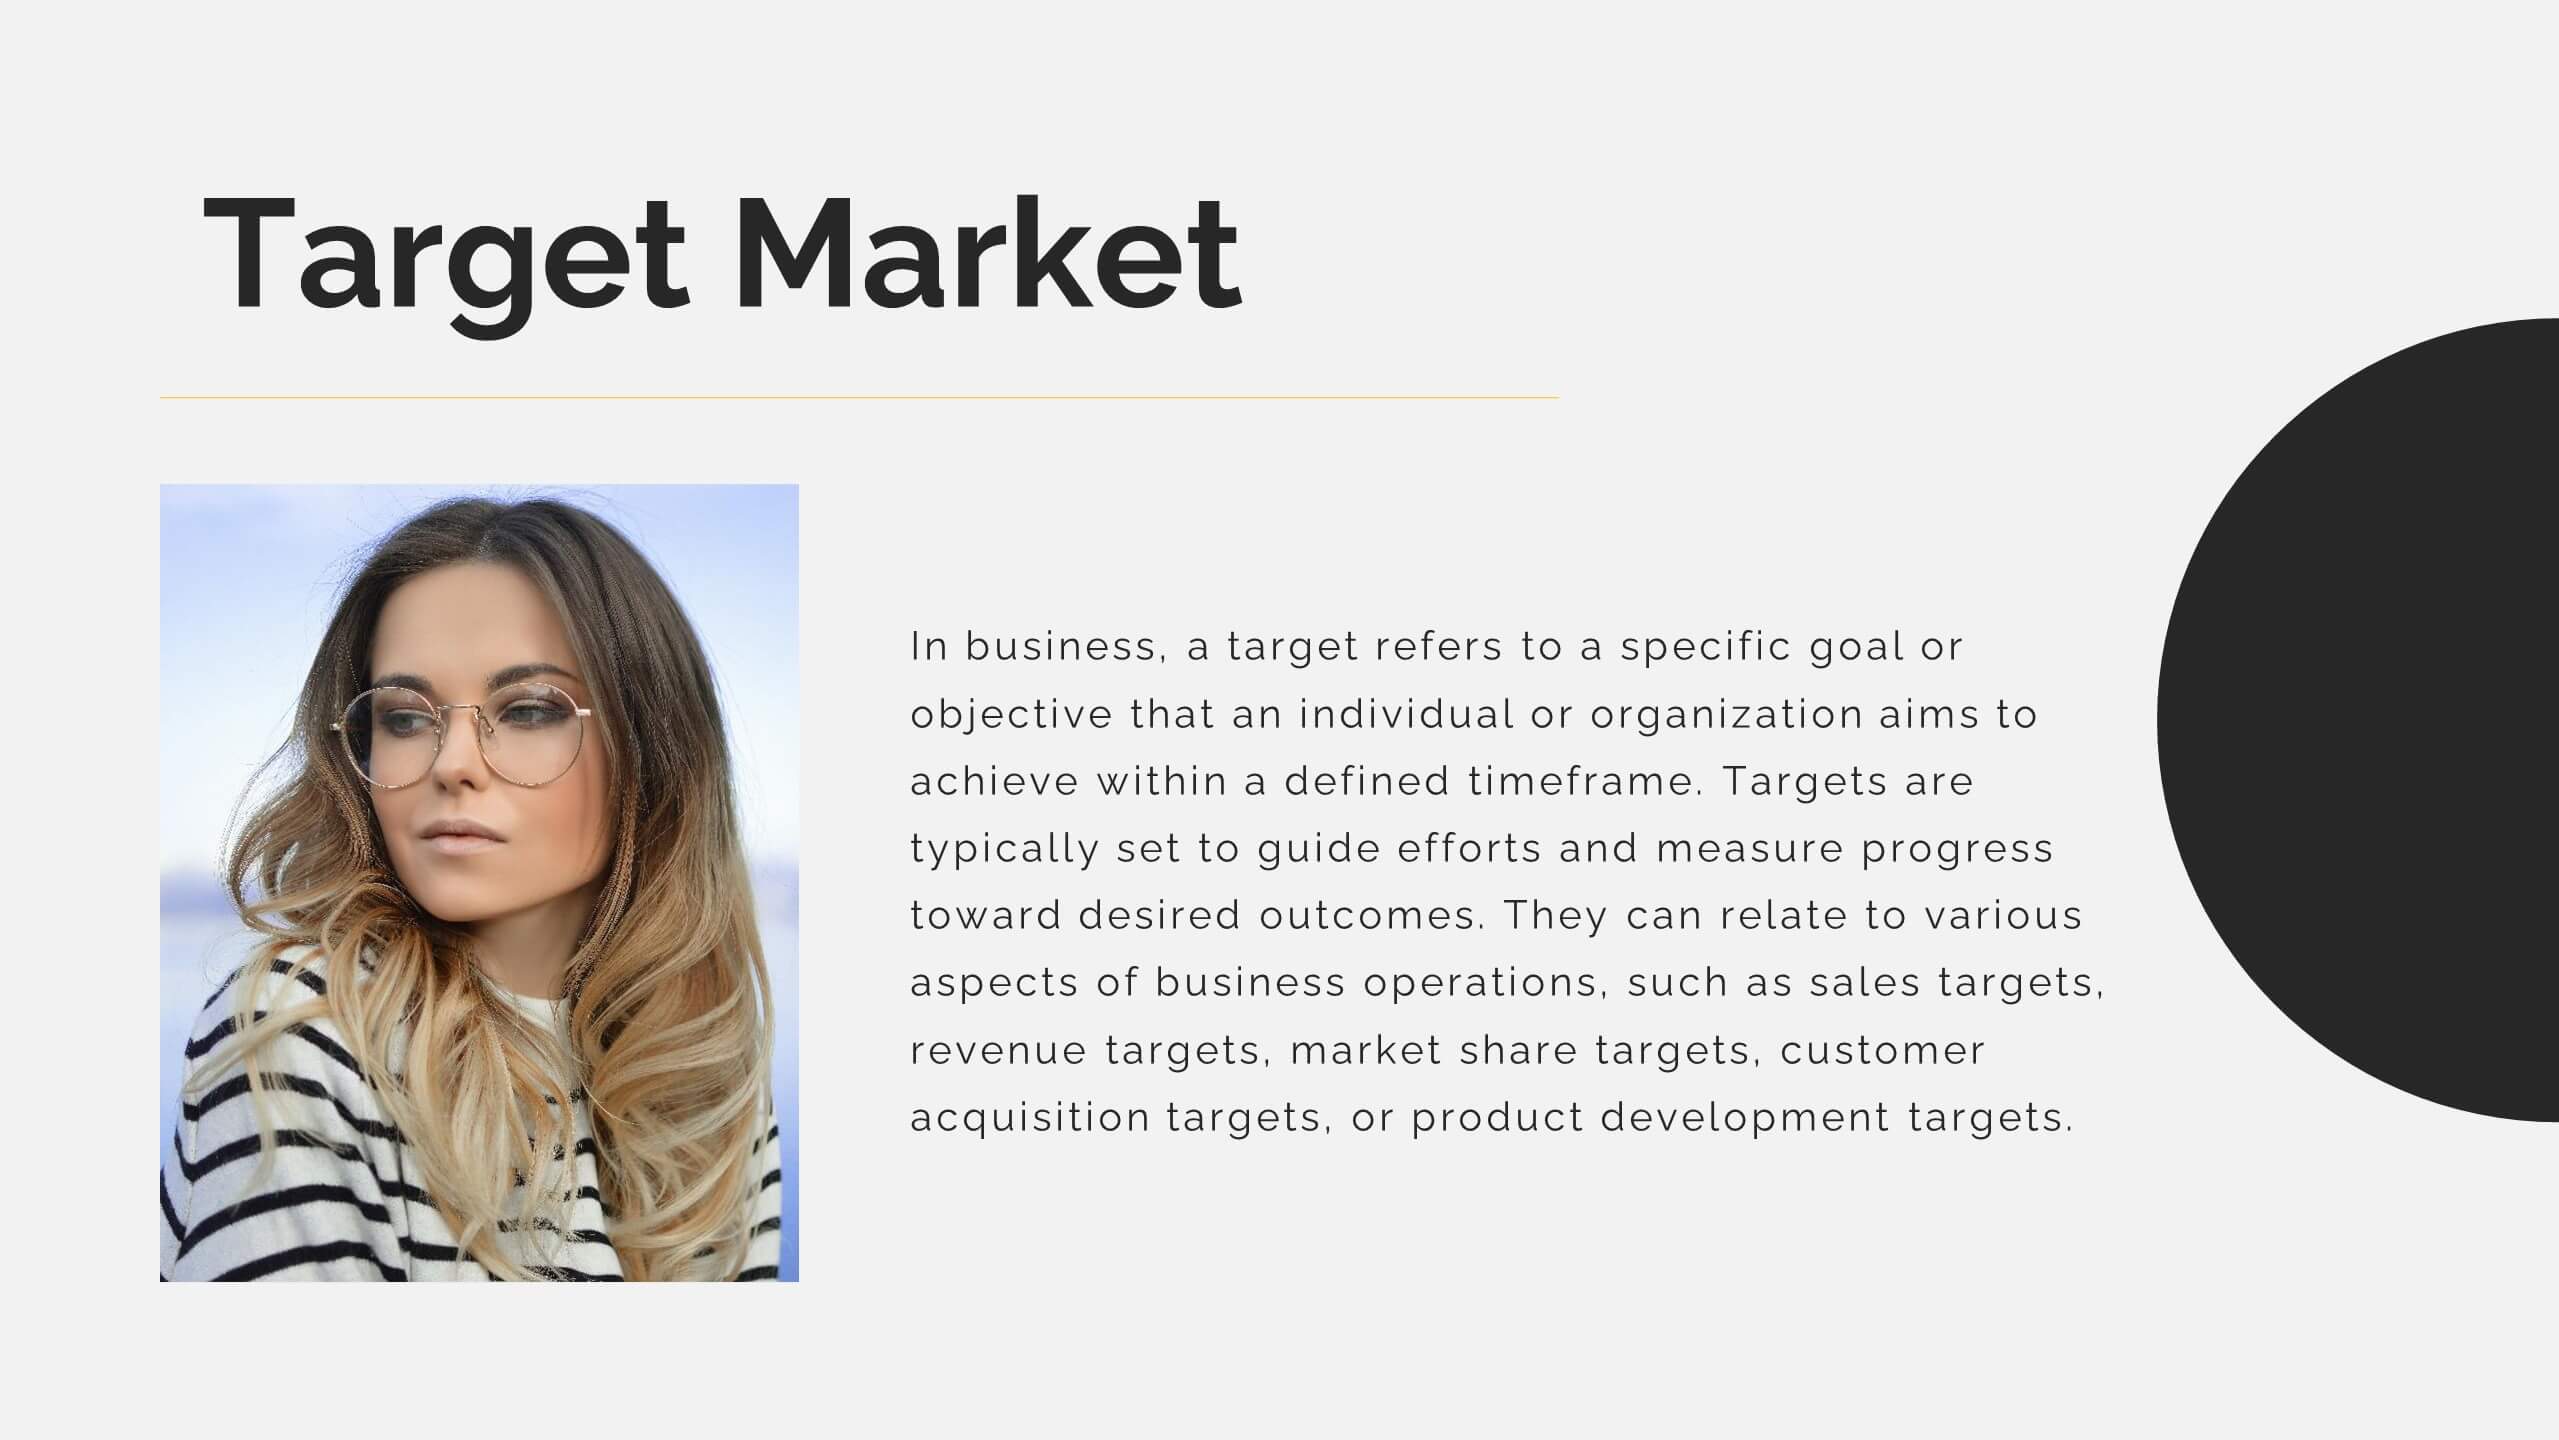
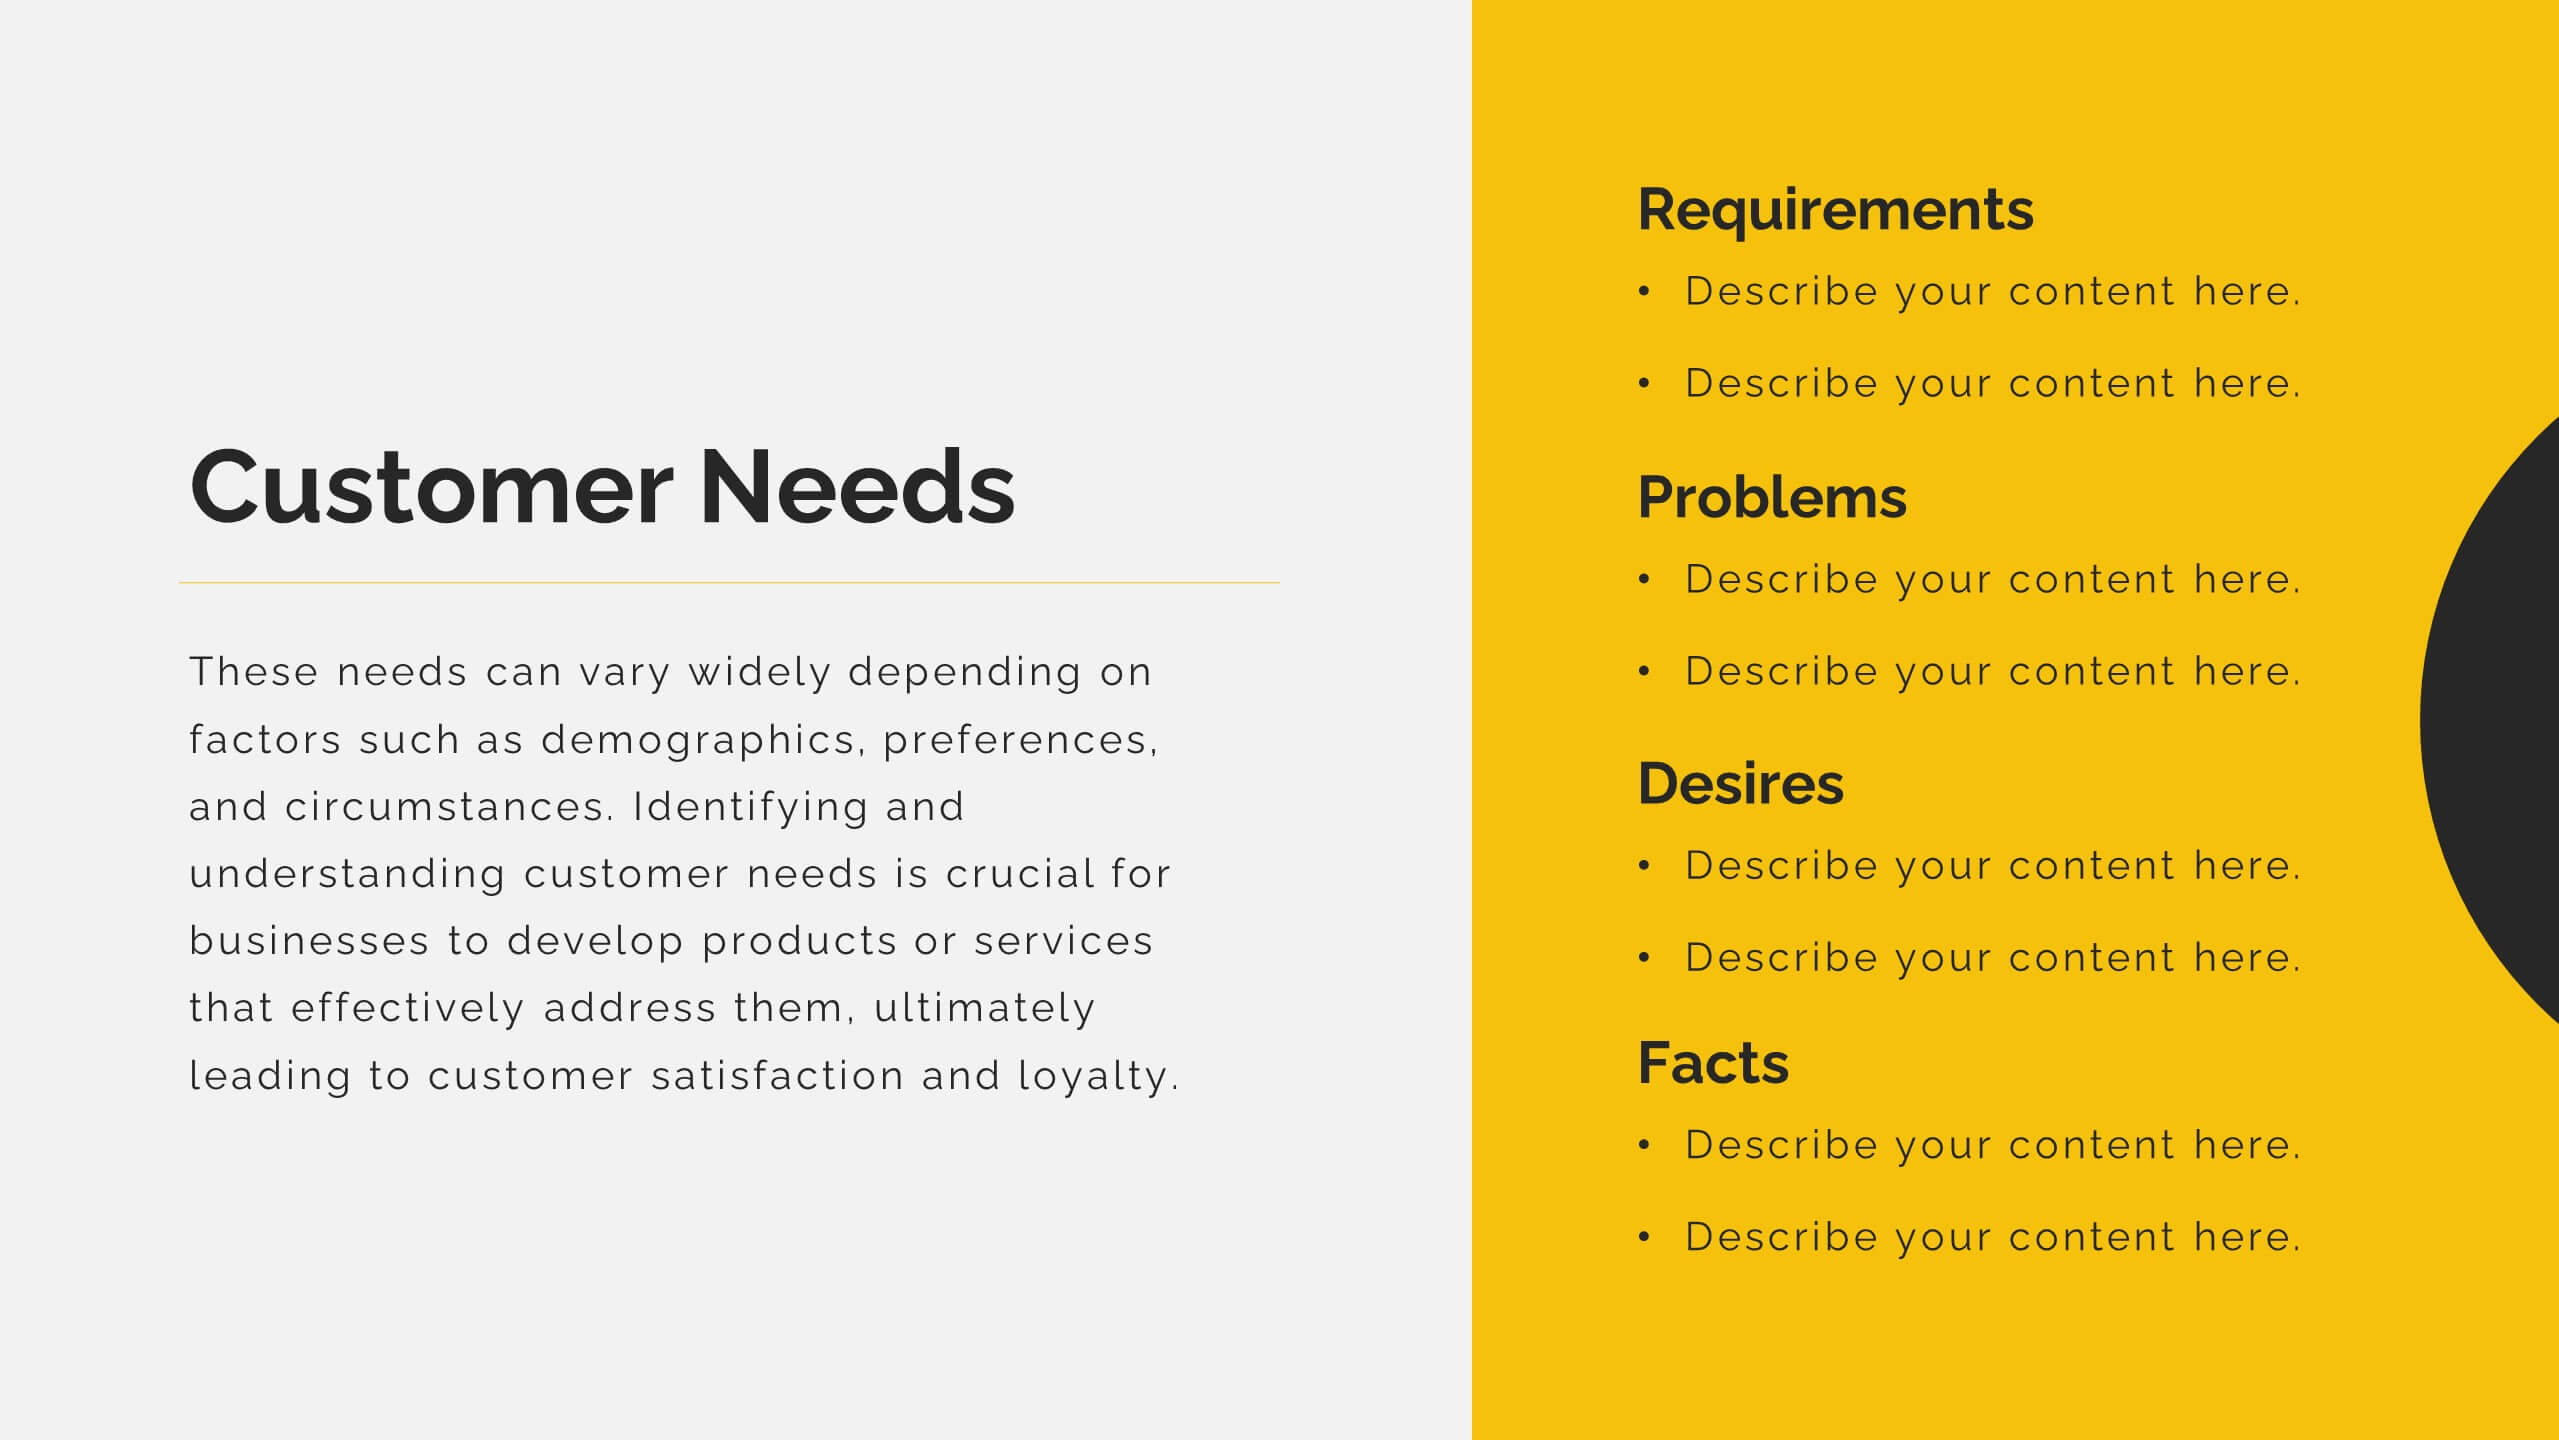
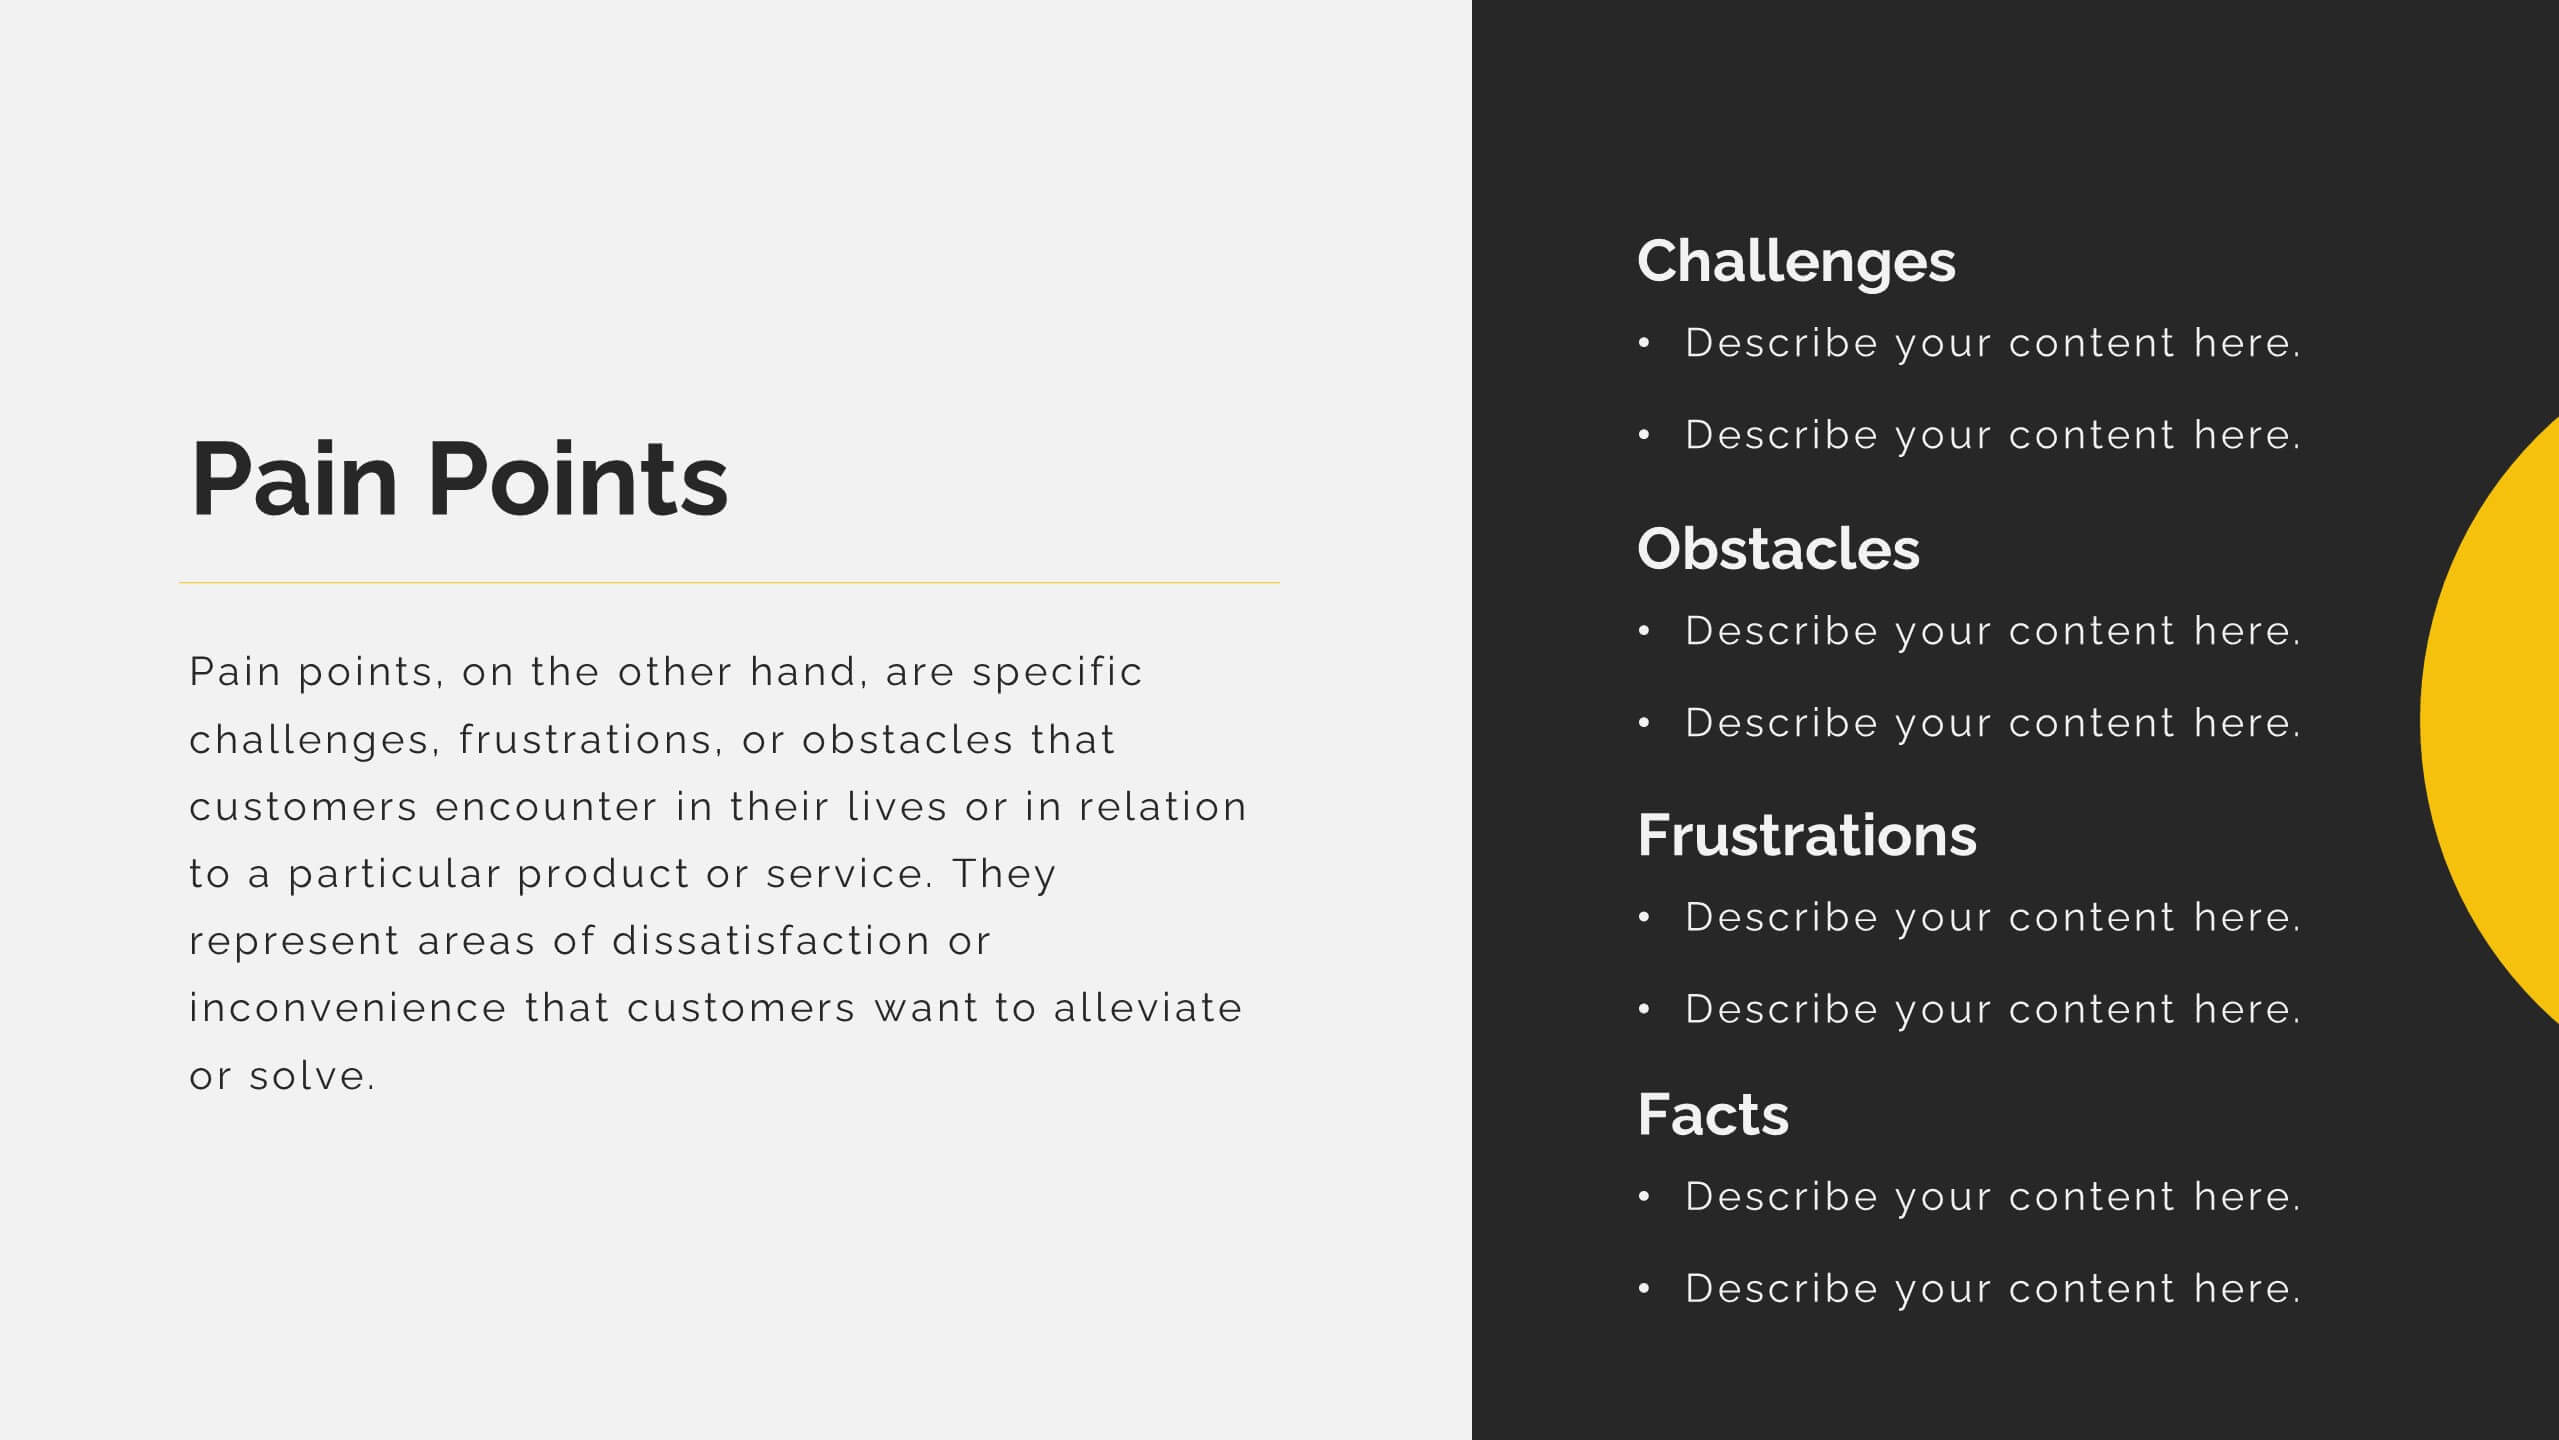
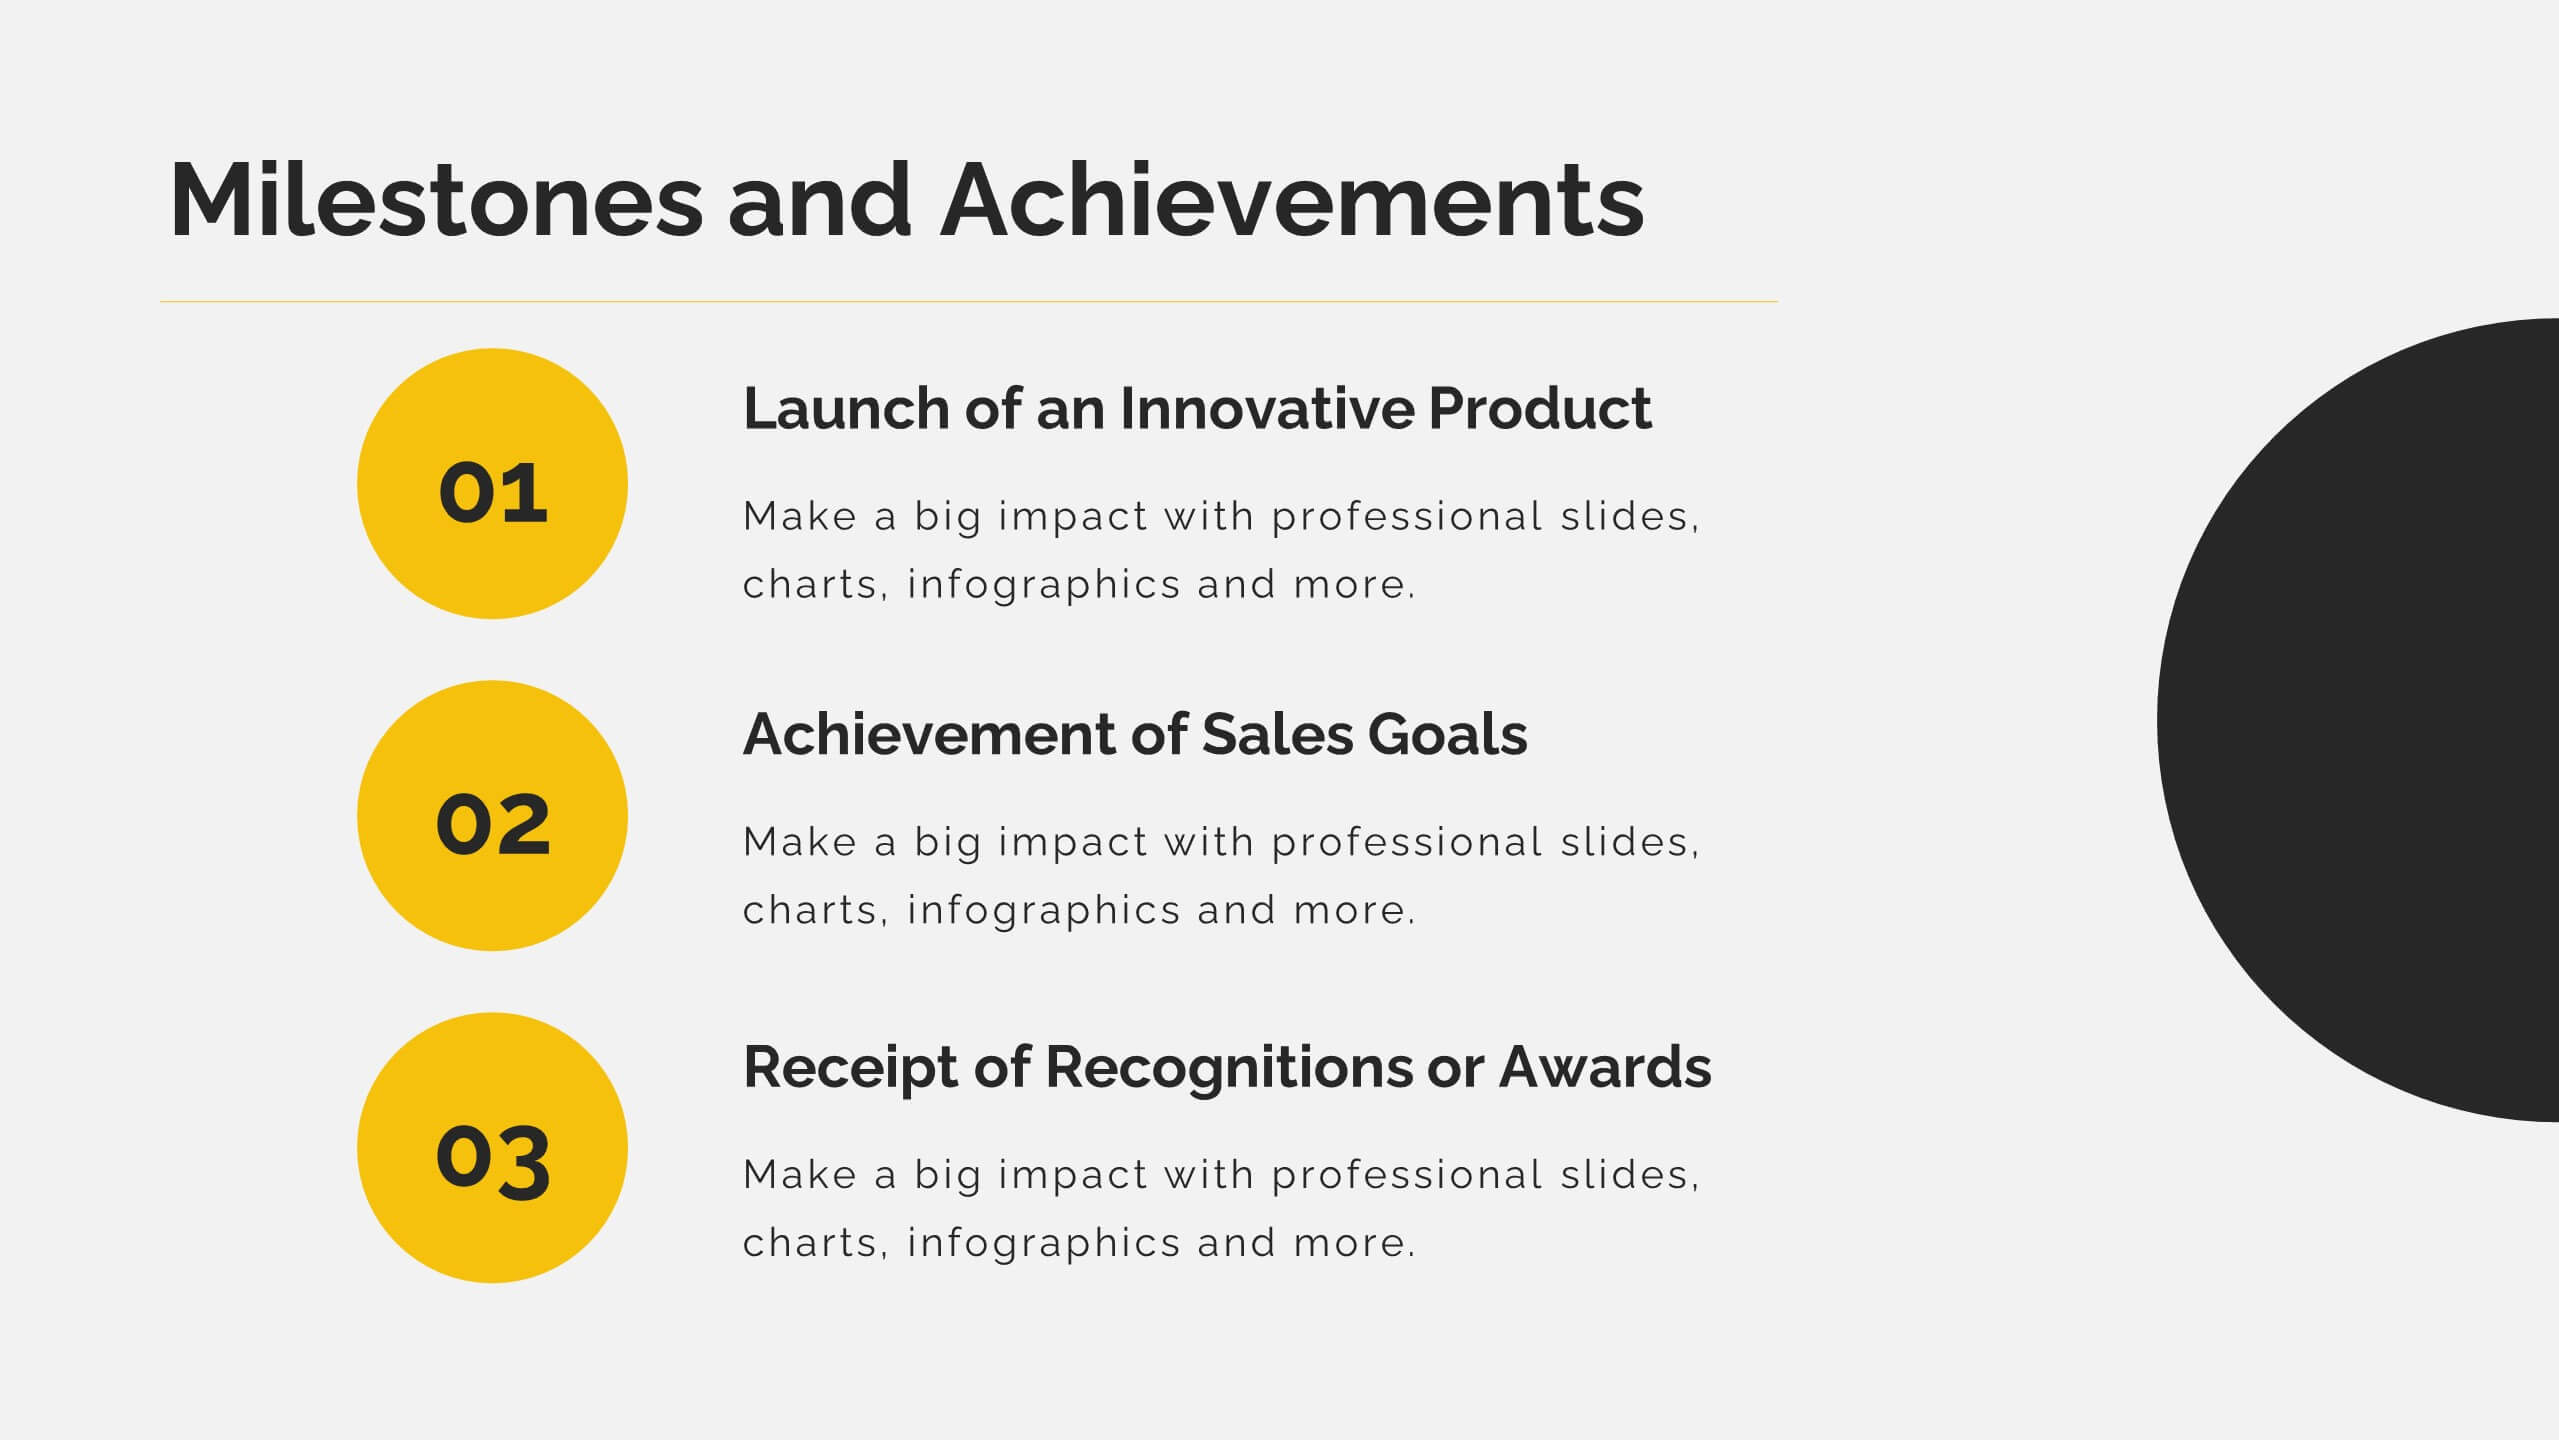
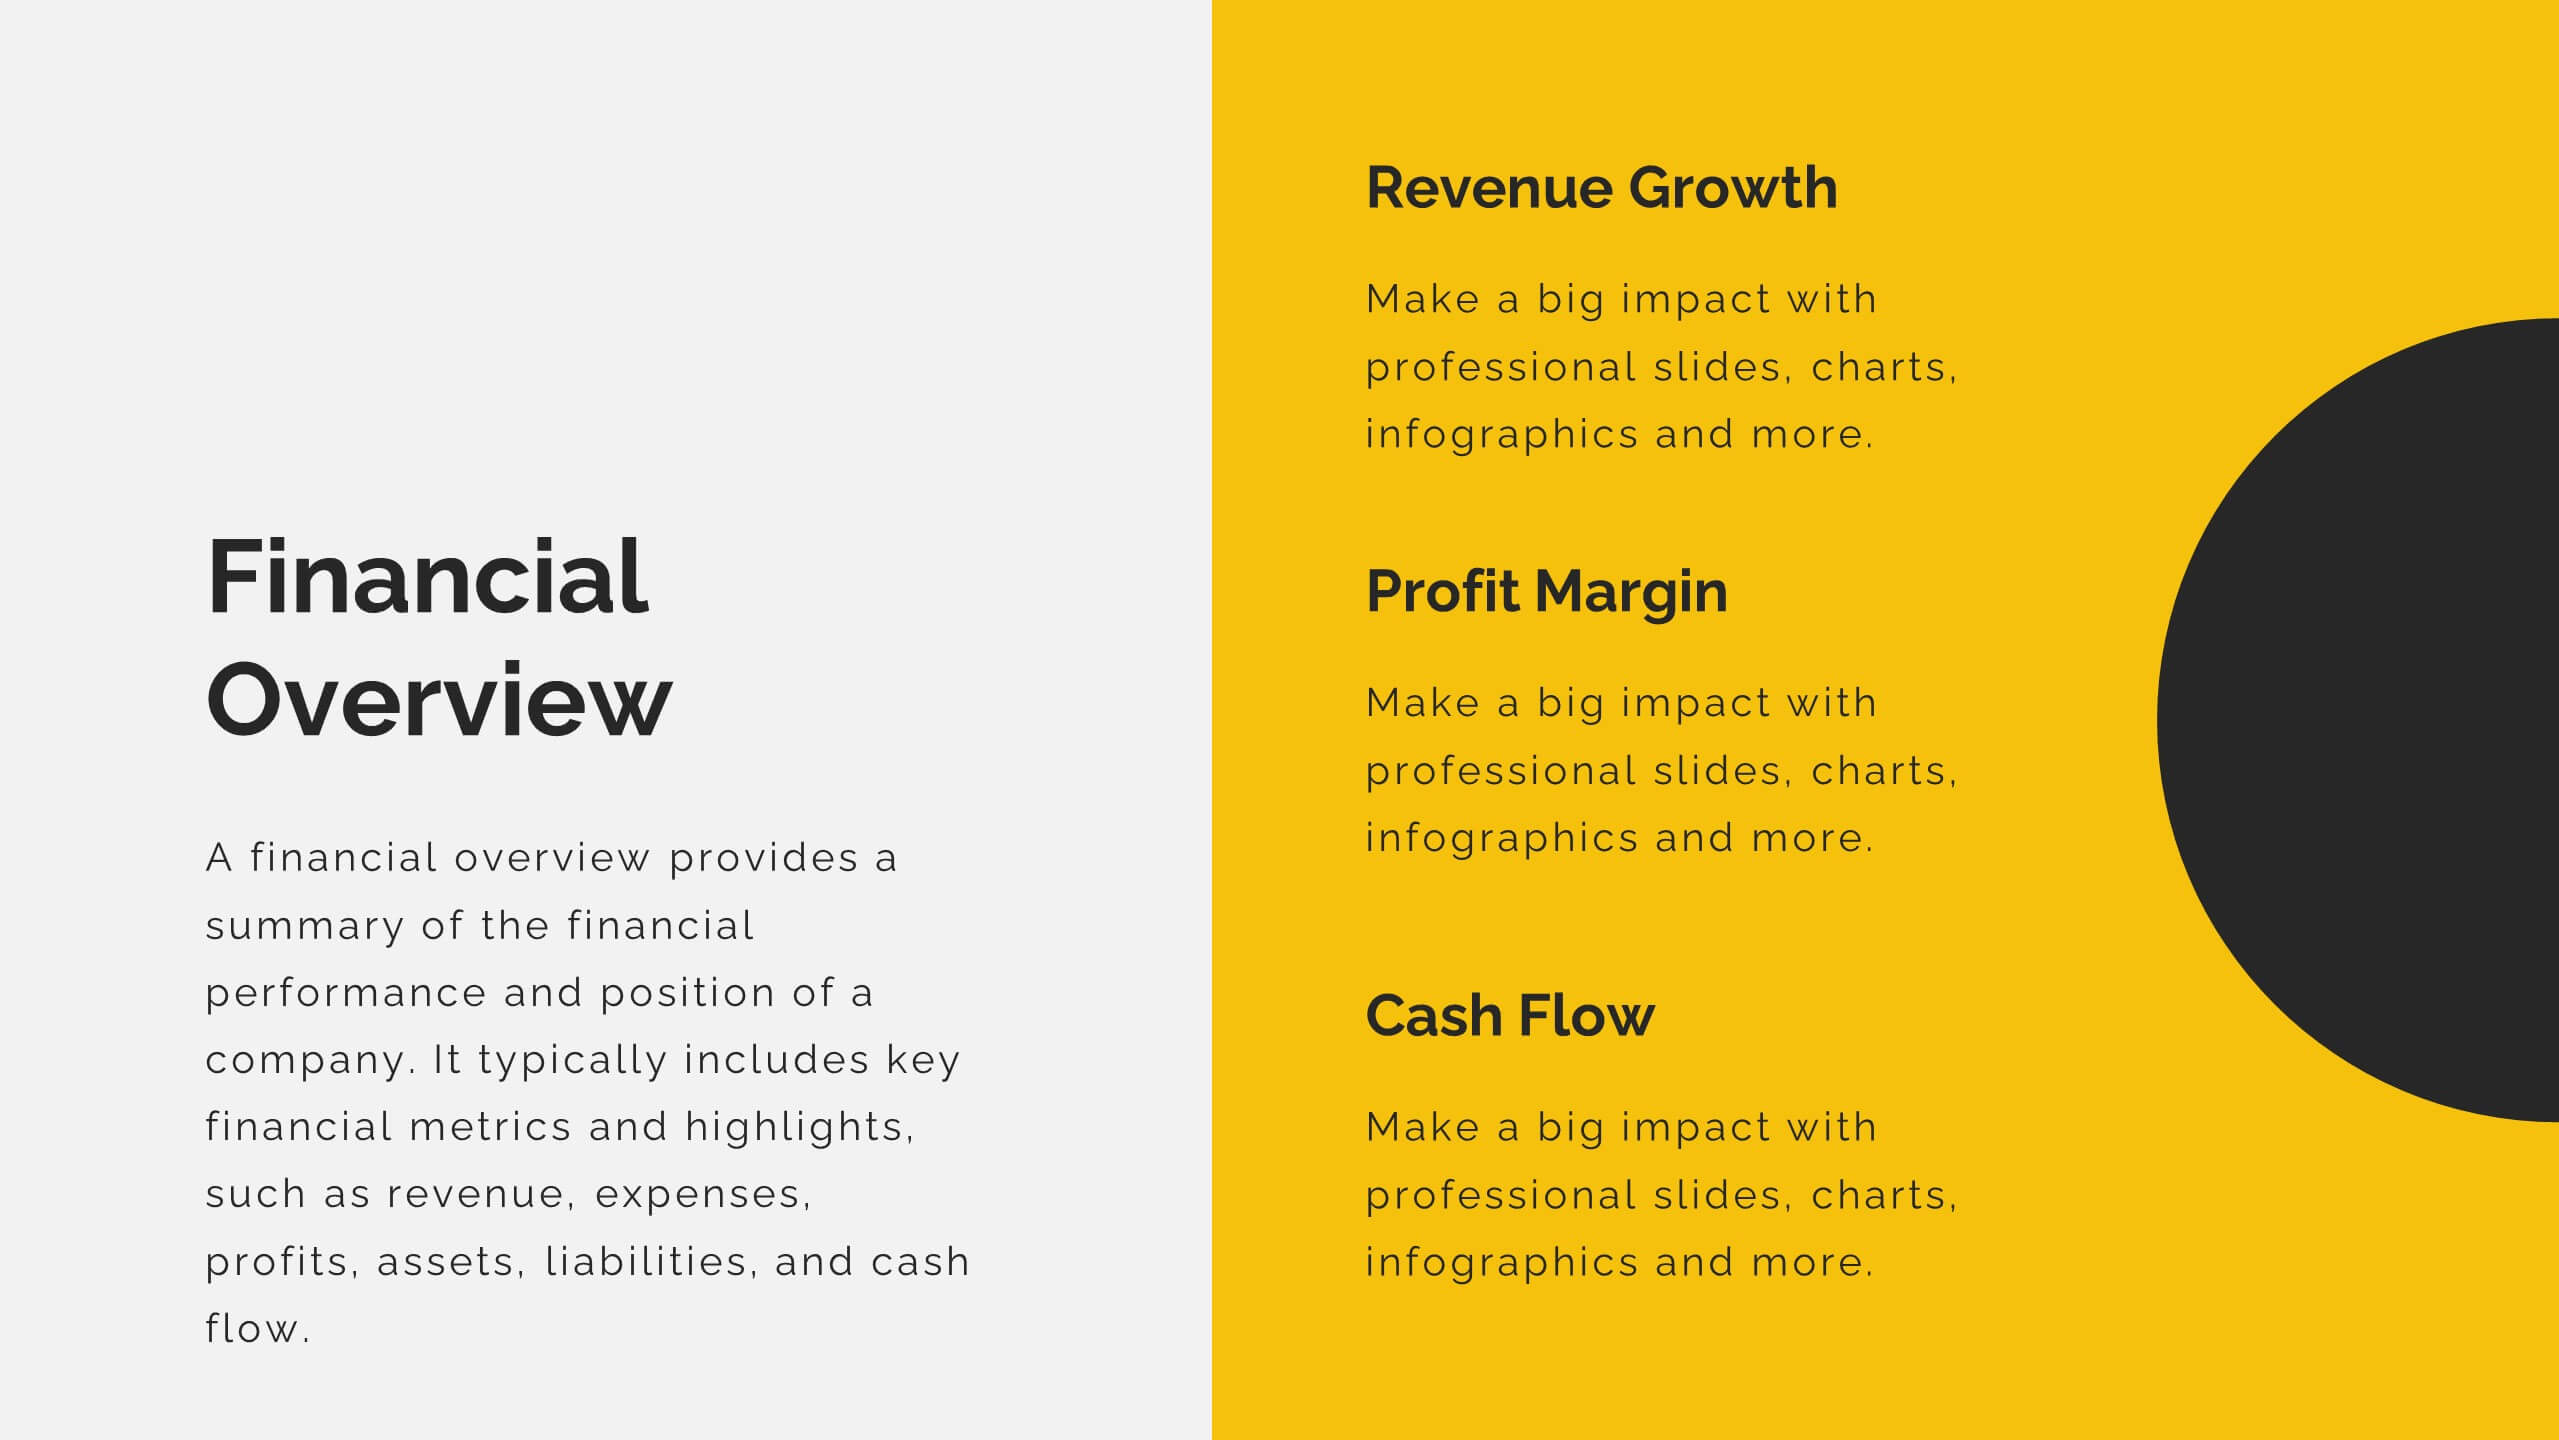
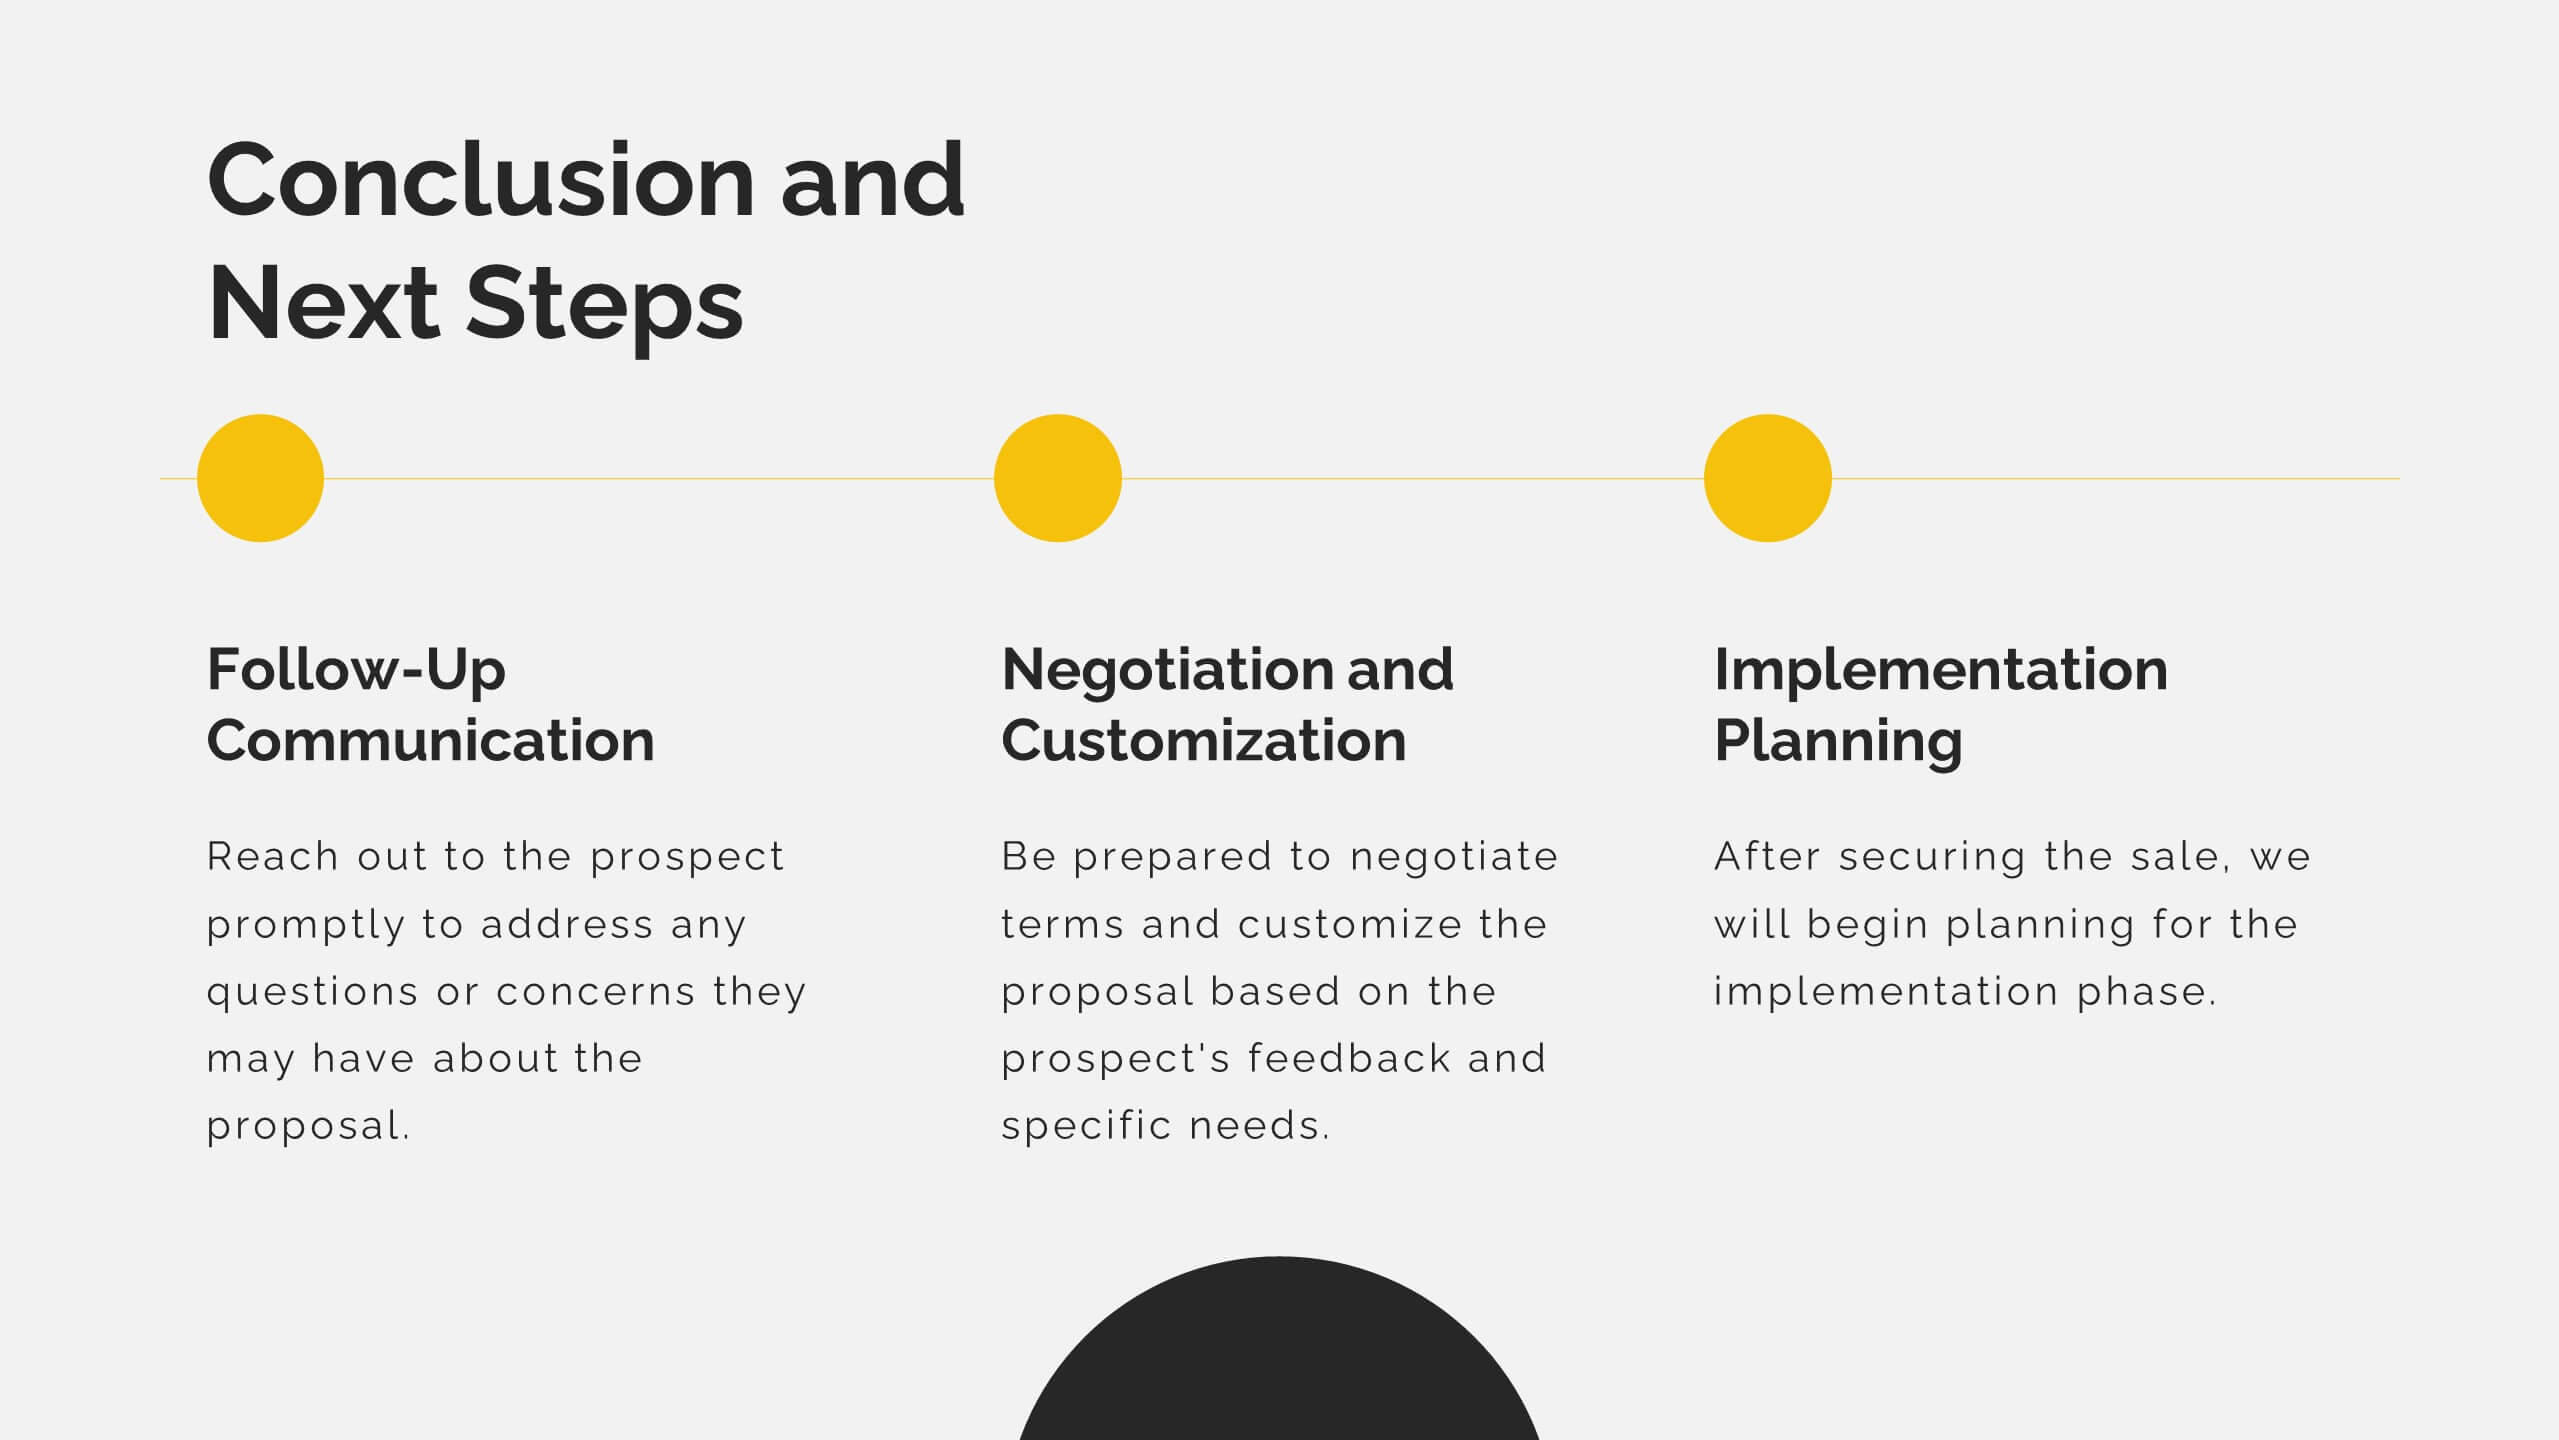
Professional Business Portfolio Presentation
Present your work with confidence using this sleek Professional Business Portfolio presentation. Designed to showcase your project highlights, performance data, and key insights, this layout features a clean two-column structure with space for visuals, icons, and statistics. Perfect for consultants, agencies, or entrepreneurs wanting to highlight business outcomes. Fully customizable and compatible with PowerPoint, Keynote, and Google Slides.


4 diapositivas
Cybersecurity Risk Protection Plan Presentation
Secure your message with a fingerprint-inspired layout that stands out. This Cybersecurity Risk Protection Plan template breaks down risk mitigation strategies into four clear points—ideal for tech, IT, and compliance presentations. Showcase protocols and data protection methods effectively. Works seamlessly with PowerPoint, Keynote, and Google Slides.