


Características


¿Tienes alguna pregunta?
Recomendar


5 diapositivas
CBD Black Market Infographics
Navigate the intricate realities of the cannabis industry with our CBD black market infographics. This essential visual resource, marked by its striking use of pink, orange, and purple hues. It's a tool for law enforcement agencies, legal consultants, and market researchers who are tracking or presenting on the unauthorized distribution within the cannabis industry. The template doesn't just illustrate statistics; it educates on the precautions and market dynamics overshadowed by the black market's presence. Featuring compelling graphics, relevant icons, these infographics synthesize data into more digestible content, aiding in informed decision-making and public awareness campaigns.


6 diapositivas
Brain Vector Infographic
This Brain Vector Infographic is an imaginative tool for presenting complex concepts and ideas in an easy-to-digest visual format. The design employs brain imagery to symbolize various aspects of thought processes, intelligence, brainstorming, or mental health. Its sections are strategically placed to reflect different cognitive areas, making it perfect for educational settings or business workshops focused on innovation. Fully editable and compatible with PowerPoint, Google Slides, and Keynote, this template allows for full customization, from colors to text, adapting to your unique presentation needs. Whether for academic, or personal use, this infographic simplifies conveying intricate information.


5 diapositivas
Client Success Story Presentation
Celebrate achievements and highlight results with a vibrant, storytelling layout that turns client wins into memorable visuals. Perfect for showcasing success milestones, project outcomes, and impact metrics, this presentation helps build trust and credibility. Fully compatible with PowerPoint, Keynote, and Google Slides for easy editing and smooth professional delivery.

20 diapositivas
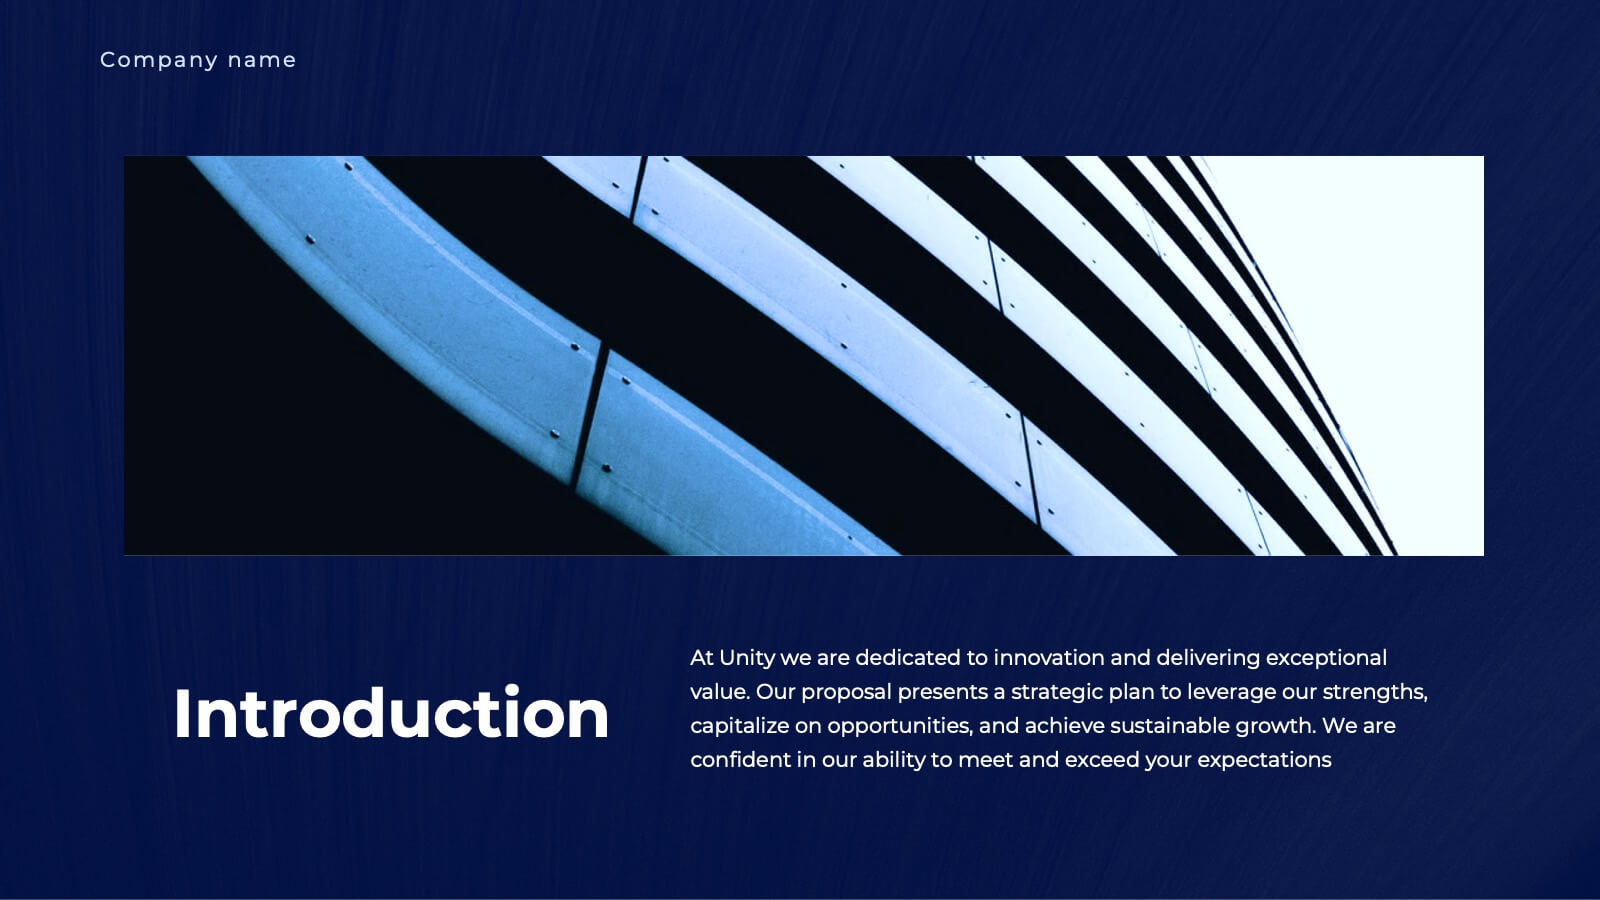
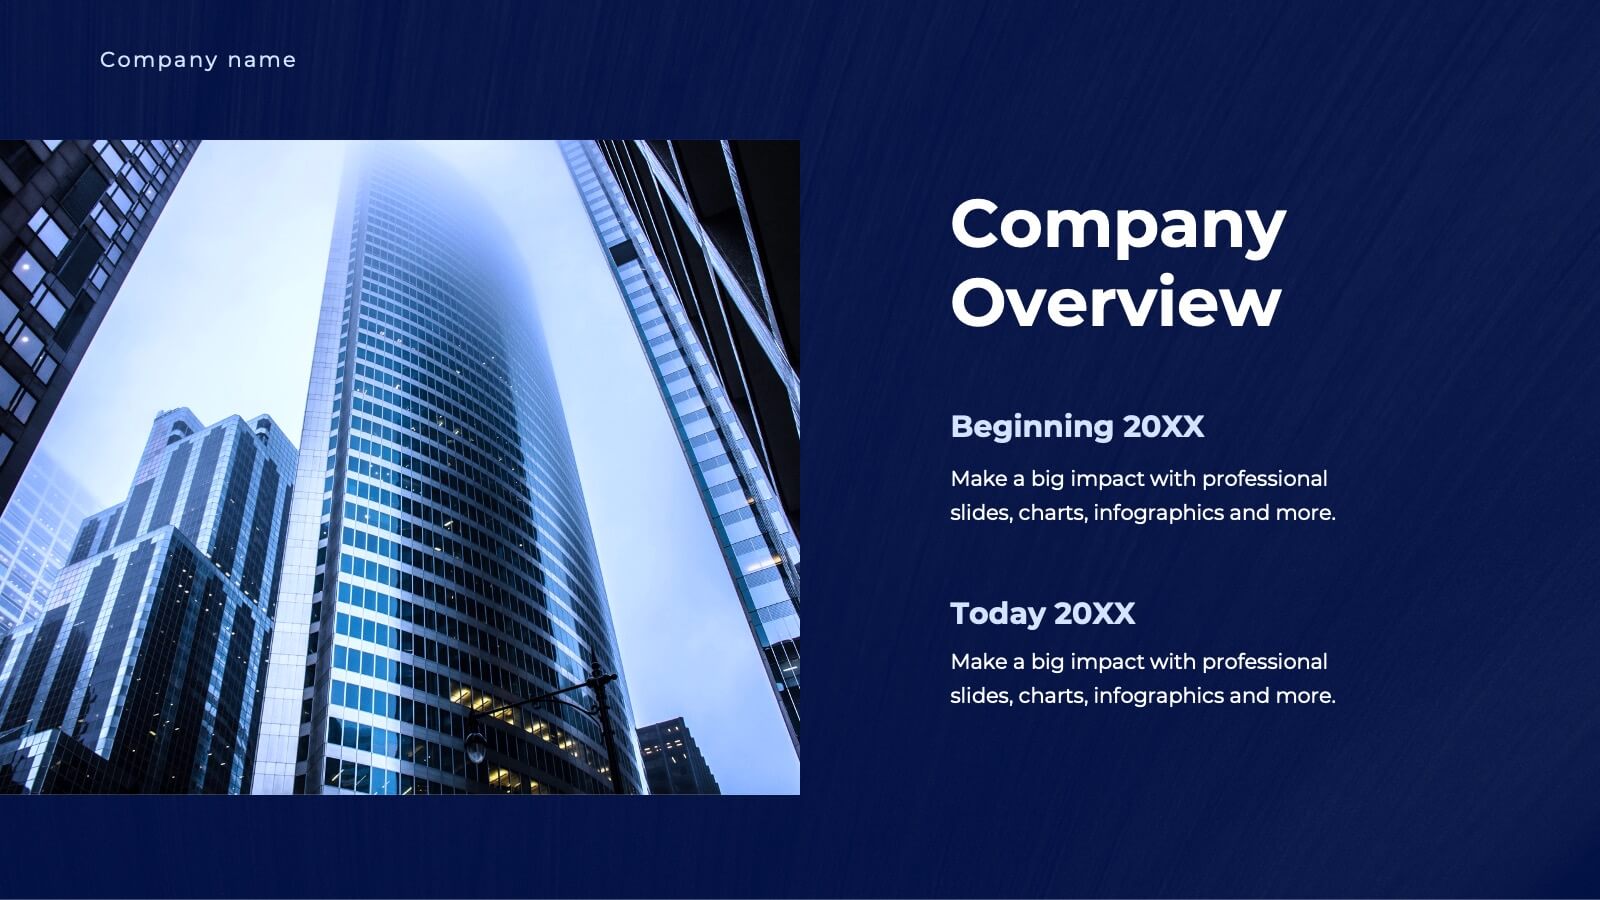
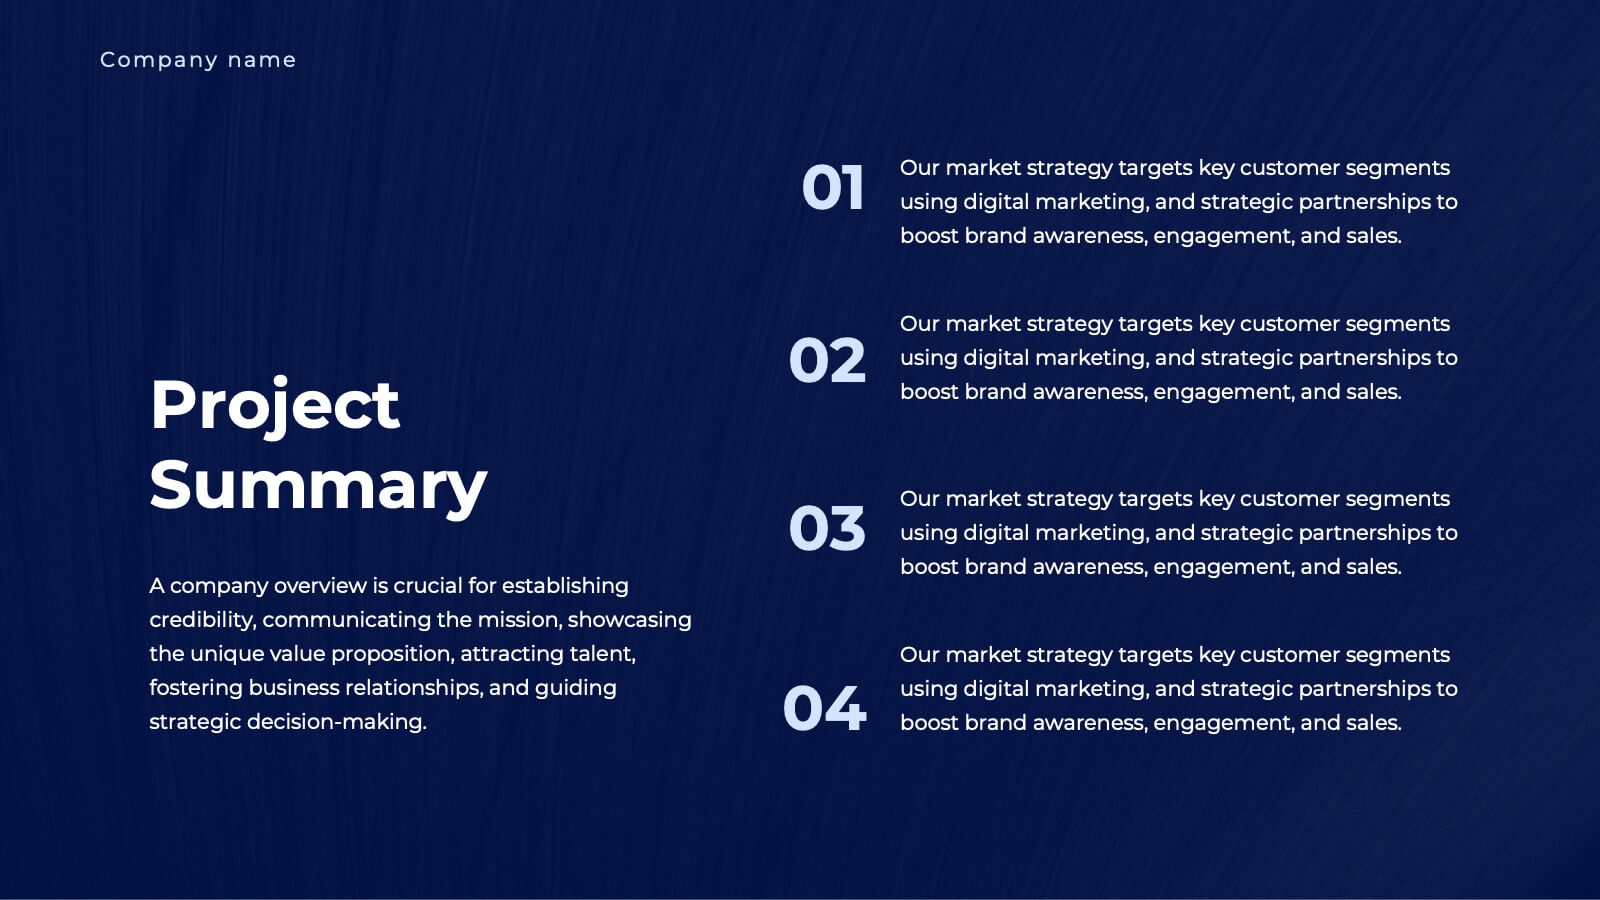
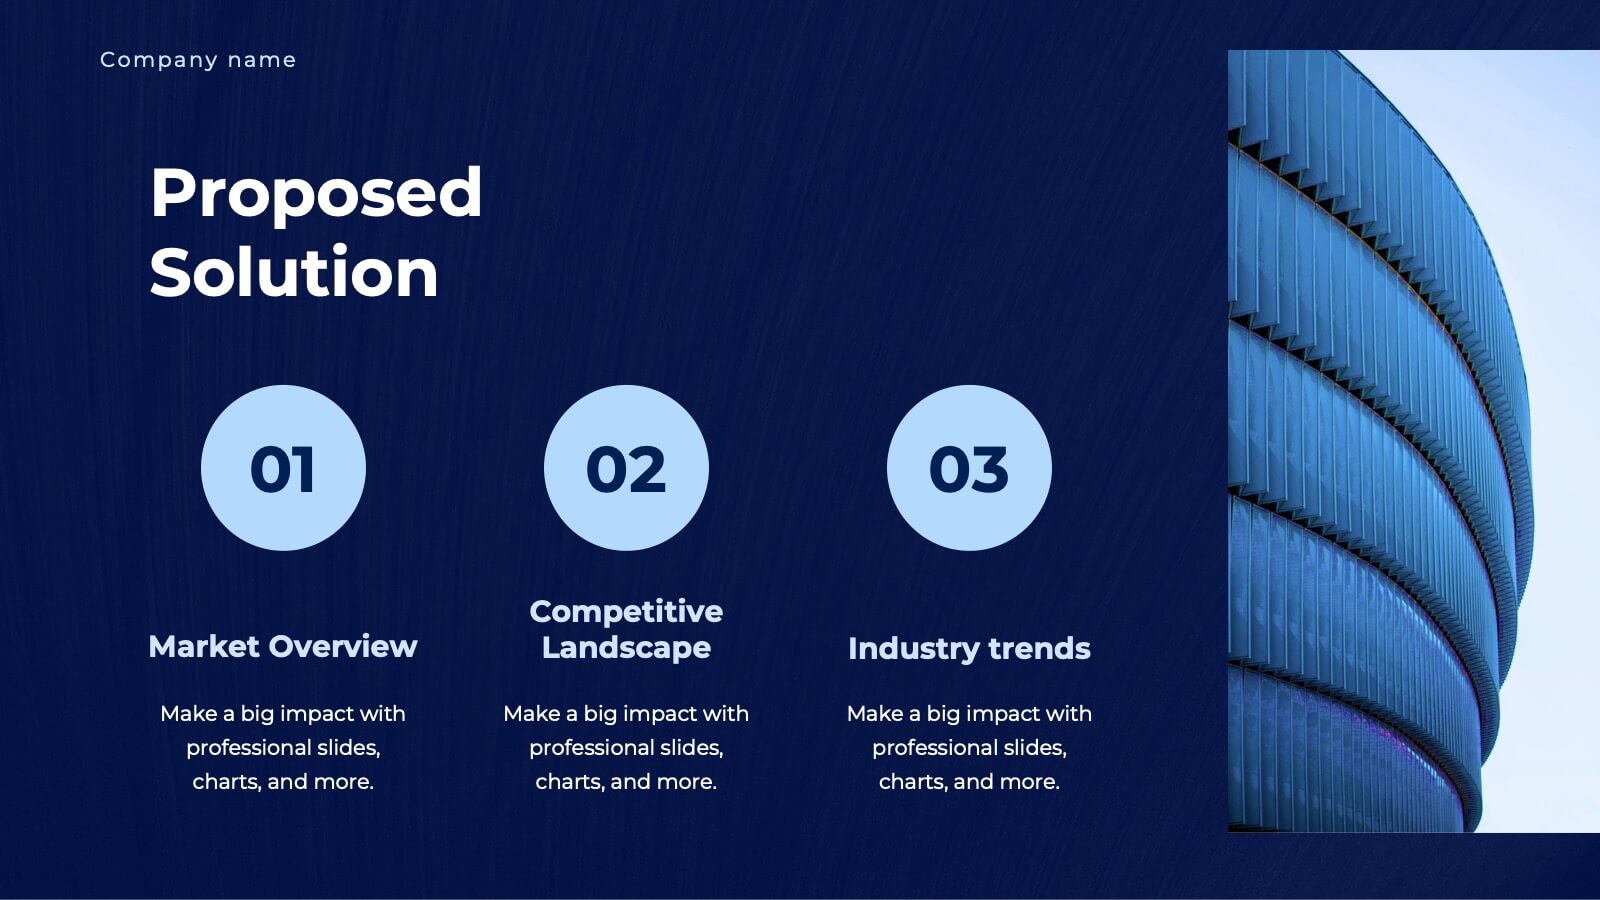
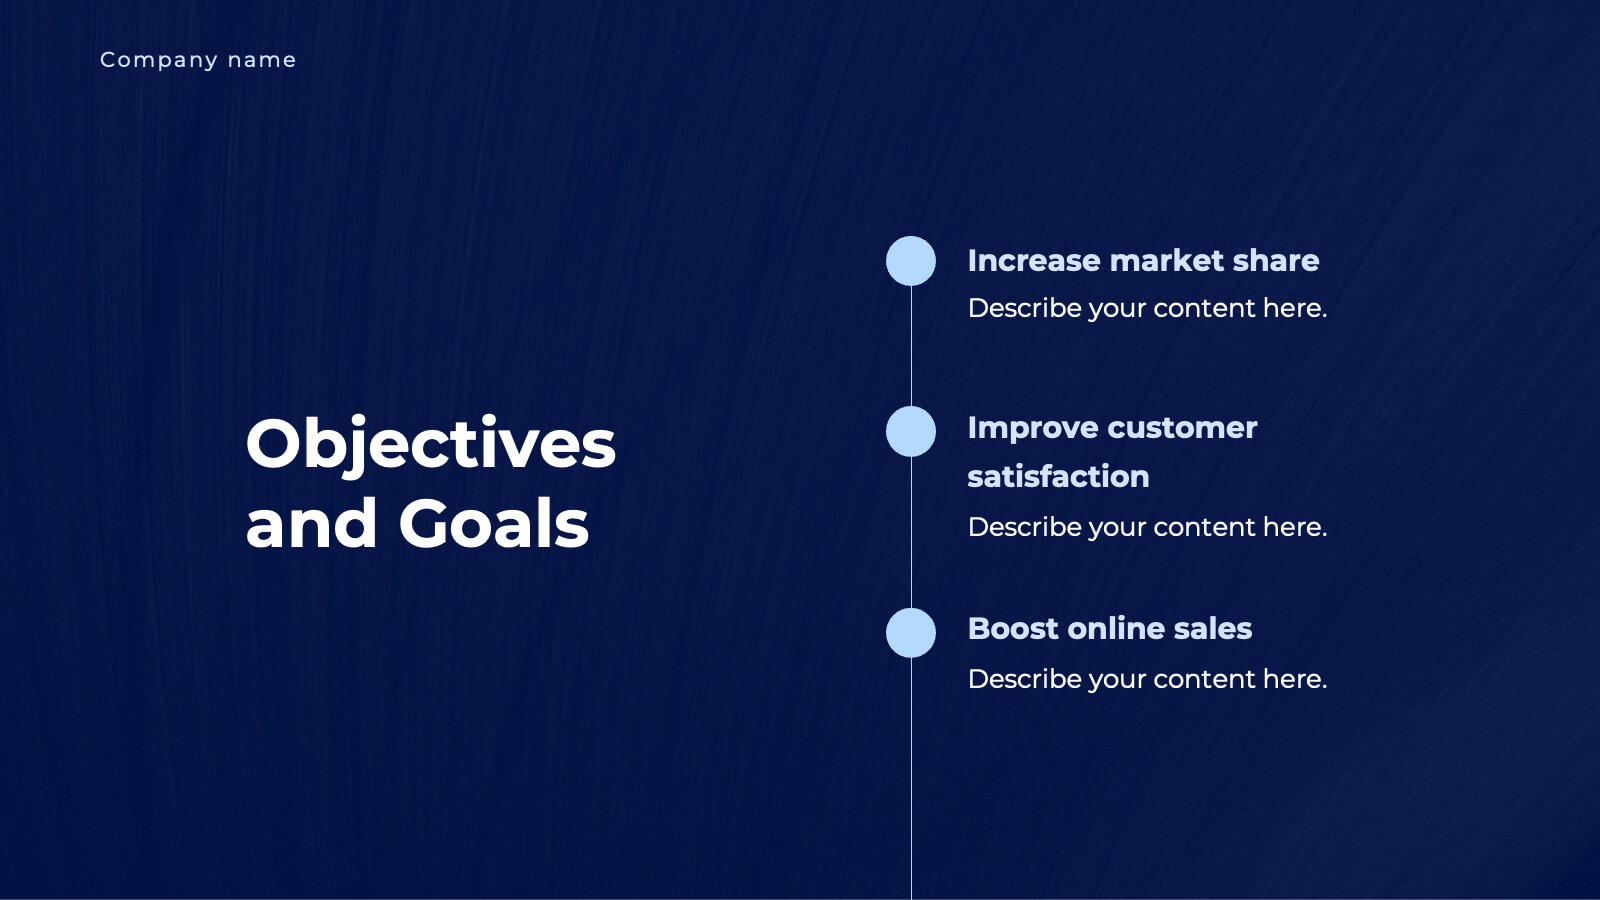
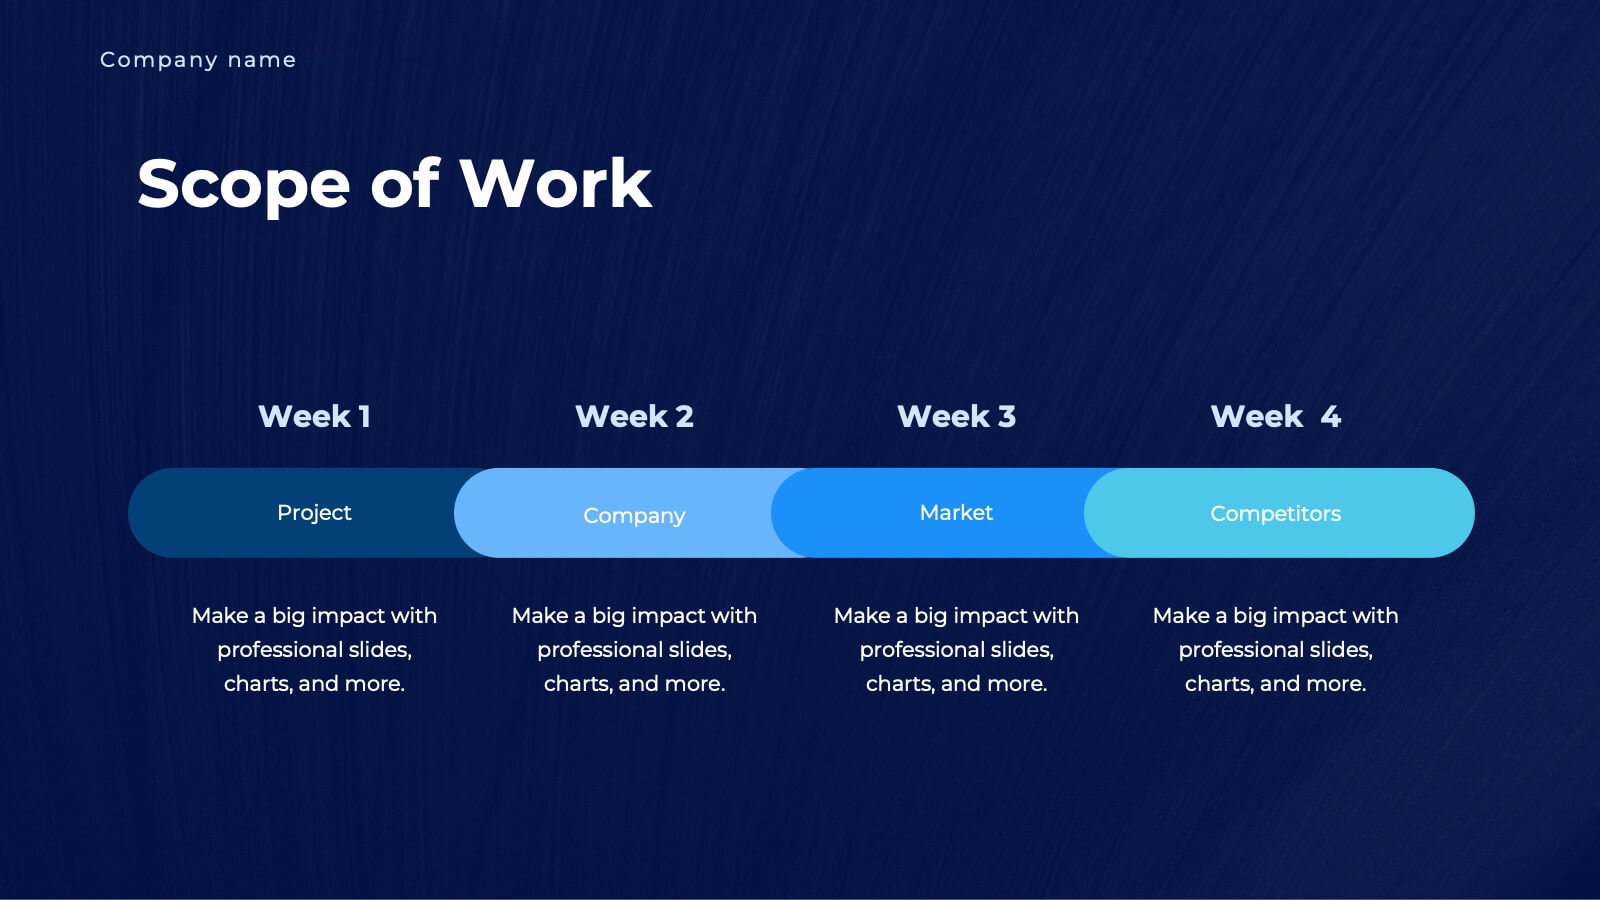
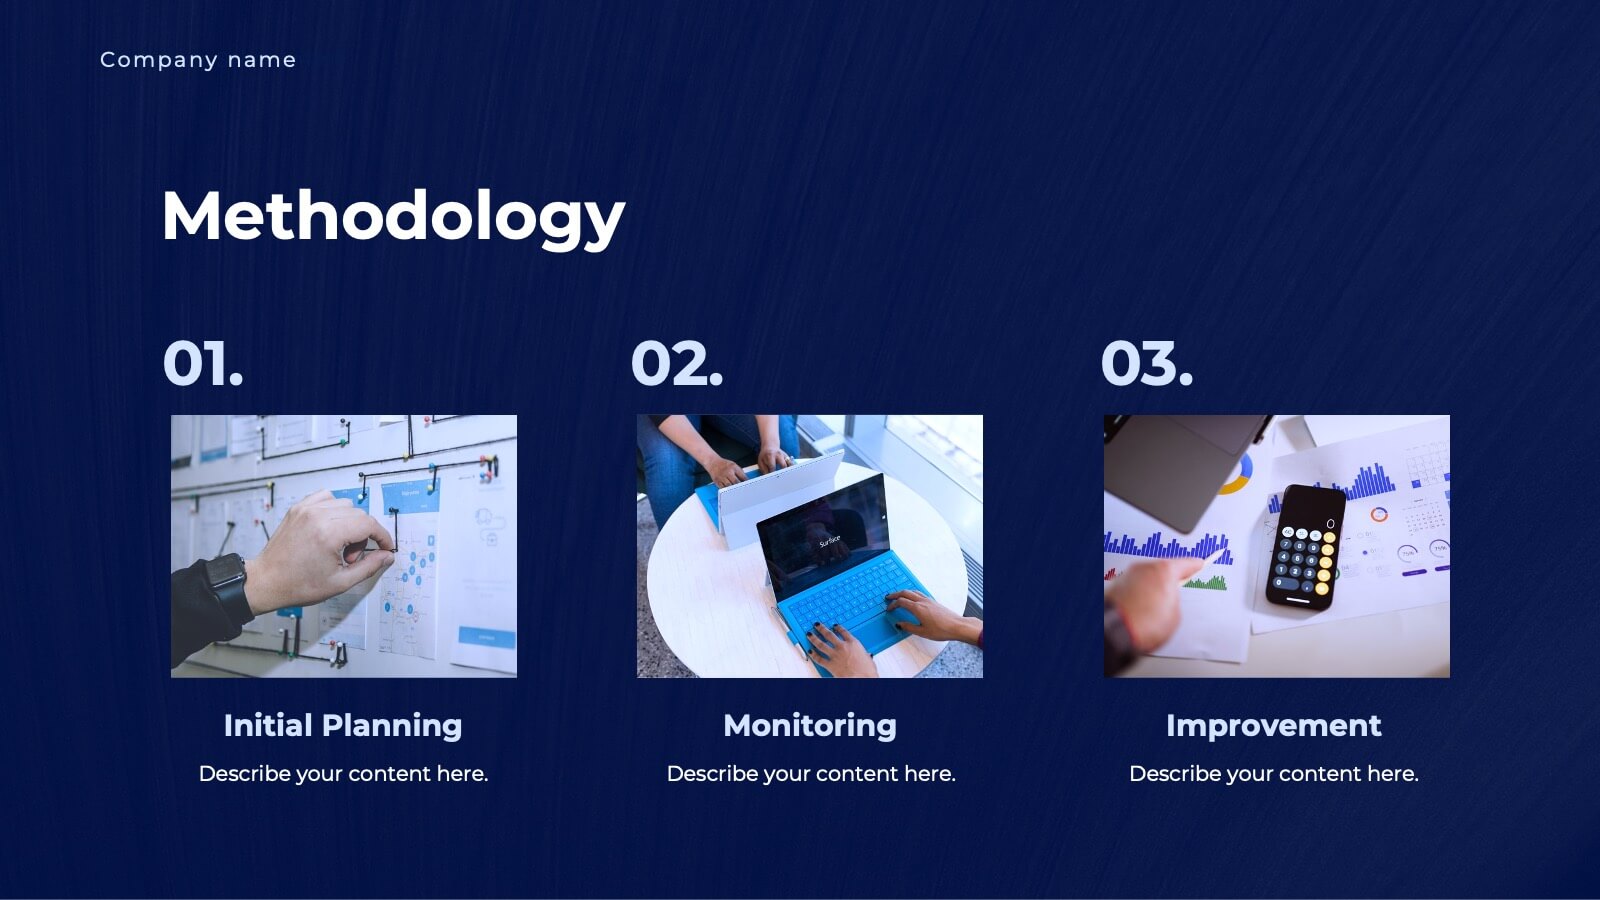
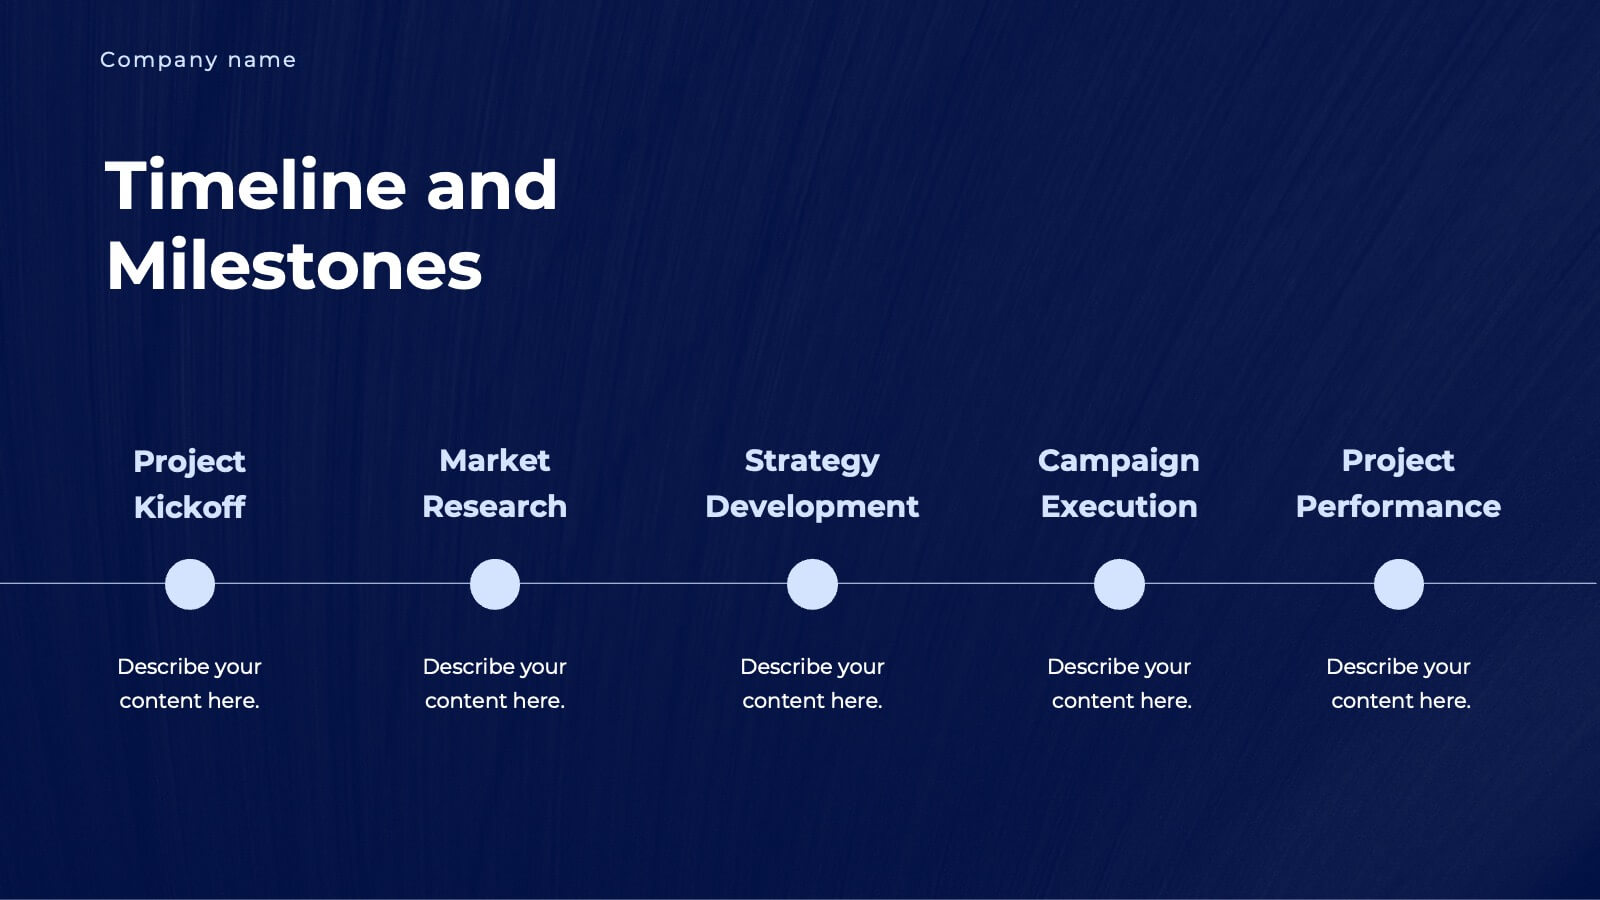
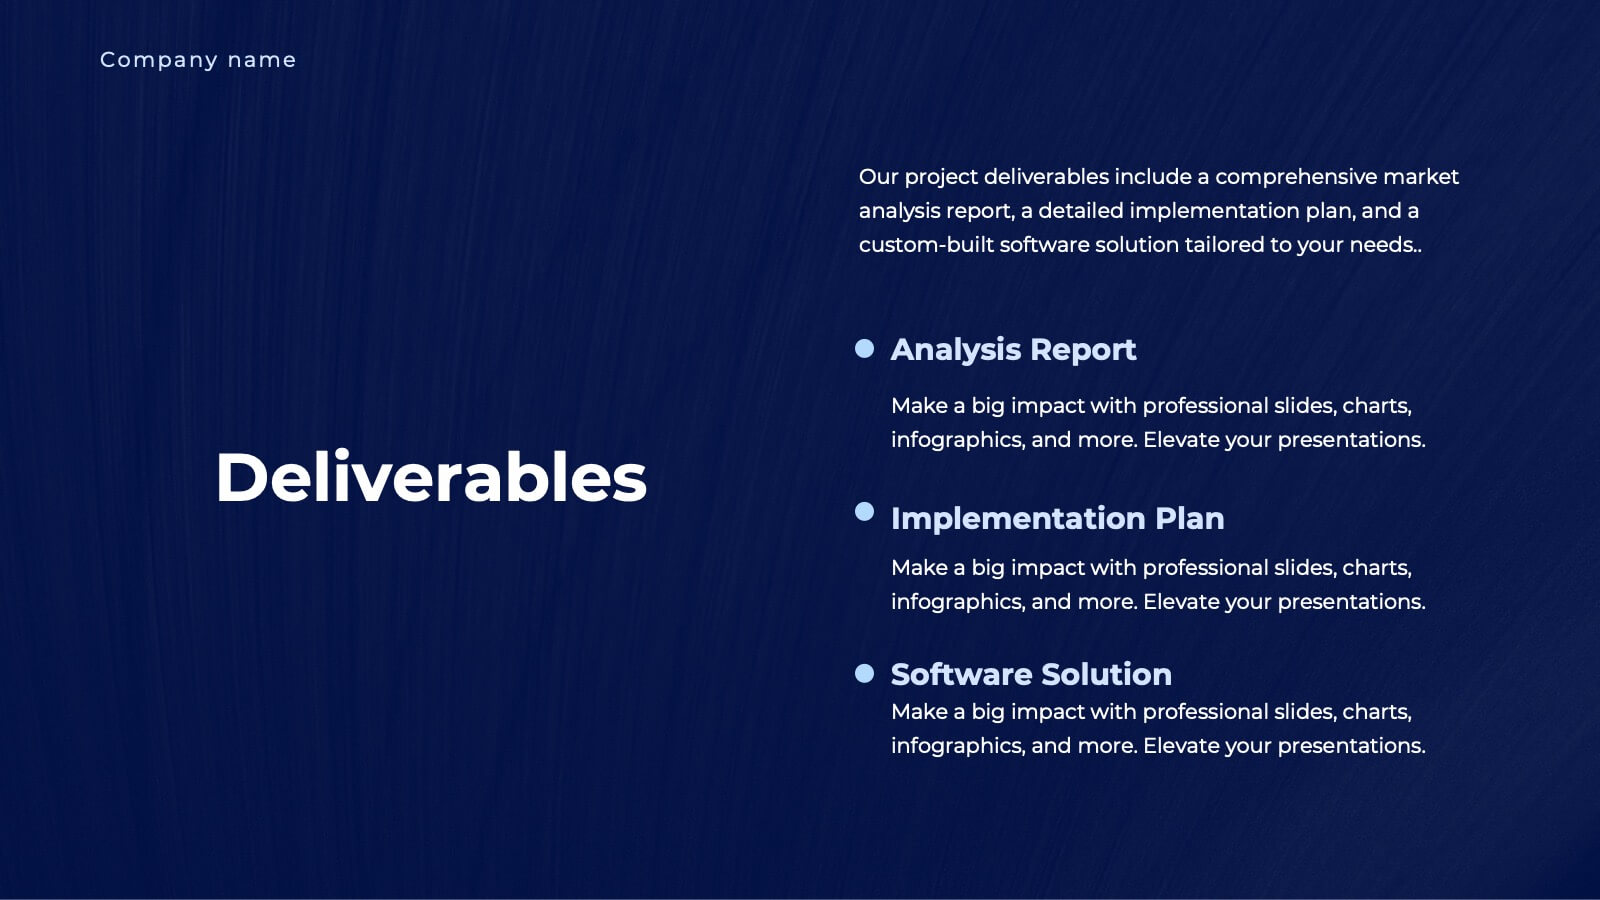
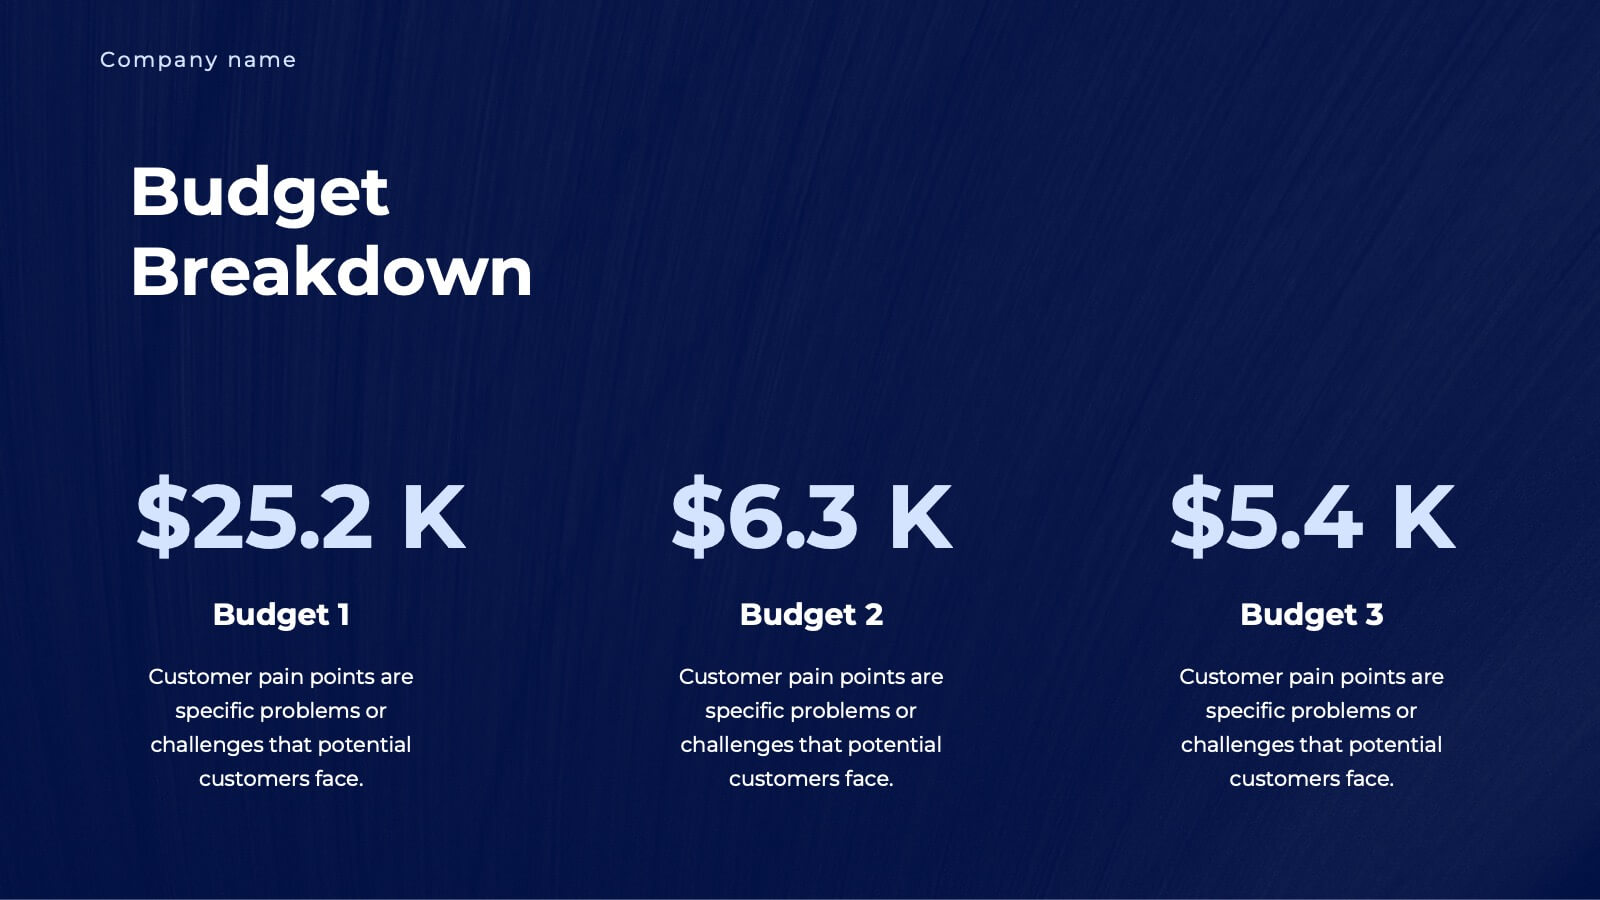
Unity Business Proposal Presentation
Take your business proposals to the next level with this elegant and comprehensive template! Perfect for presenting company overviews, project summaries, and detailed solutions. Ideal for business professionals looking to impress clients and stakeholders. Compatible with PowerPoint, Keynote, and Google Slides, this template ensures your proposals are impactful and professional.


4 diapositivas
Productivity and Task Prioritization Presentation
Streamline efficiency with structured task prioritization using this Productivity and Task Prioritization template. Designed with rating indicators, pie charts, and color-coded sections, this slide helps visualize task importance, workload distribution, and performance evaluations. Ideal for team leaders, project managers, and business strategists, this template is fully customizable and compatible with PowerPoint, Keynote, and Google Slides.


6 diapositivas
Business Investment Market in Africa Map Presentation
Highlight key investment hotspots across Africa with this clean, location-based map template. Featuring labeled markers, progress bars, and editable data points, it’s ideal for showcasing project focus, regional funding, or development opportunities. Customize easily in PowerPoint, Keynote, or Google Slides to create compelling, data-driven business and finance presentations.


7 diapositivas
Timeline Schedule Infographics
A Timeline Schedule is an effective way to communicate complex schedules or timelines. It's a constructive tool for coordinating work and managing projects. This template can help you build a timeline, show the overview and present your value proposition. This timeline Infographic can be used for any business, personal, or academic project. This is a fully editable template so you can change the color, size and everything as per your needs. The timeline charts have been designed with various categories and time range pattern through which you can plan your projects in an effective way!


7 diapositivas
KPI Sales Dashboard Infographic
A KPI (Key Performance Indicator) Dashboard is a visual tool or interface that provides a real-time snapshot of an organization's or a specific department's key performance indicators. Empower your sales team with our KPI sales dashboard infographic template. This visually striking and insightful template allows you to present key performance indicators and metrics in an easily understandable and engaging format. Compatible with Powerpoint, Keynote, and Google Slides. This template will transform your sales data into a dynamic, easy-to-understand dashboard, helping your team stay informed, motivated, and focused on achieving sales targets.


26 diapositivas
Kohen Presentation Template
Kohen is a minimal coffee shop template that features slide designs you can use together, making it perfect for sharing your business and services. It is easy to use, resulting in convenient high quality presentations. This template design can be used to create more elaborate presentations about food and restaurants. It is complete with charts, images, and text boxes for endless presentation possibilities. This template will help make your message more compelling and informative. The presentation includes a variety of tools and resources, to highlight key points and ideas with minimal text.


5 diapositivas
Investment Opportunity Business Case
Visualize the value behind your proposal with this key-themed layout, ideal for presenting compelling reasons to invest. Each section highlights a unique point, making it easy to walk stakeholders through critical benefits and insights. Fully editable and compatible with PowerPoint, Keynote, and Google Slides.


7 diapositivas
Root Cause Protocol Infographic Presentation
A Root Cause Infographic is a visual tool that is used to analyze and identify the underlying causes of a problem or issue. This template is perfect to use for quality control, project management, or problem-solving processes to help organizations identify the root cause of an issue and develop effective solutions. This infographic includes a series of interconnected elements or components, with the central element representing the problem or issue being analyzed. This template includes text, icons, and other graphic elements to help illustrate the relationships between different components.


7 diapositivas
Project Status Infographic Presentation Template
Project status reports are a great way for project managers to track the progress of their projects and identify risks, challenges and opportunities. They can also help stakeholders better understand what’s going on in the project. They are a critical part of the project documentation system. They allow you to monitor the state of your project’s progress, efficiently share information with upper management and help everyone involved understand where things stand. You can use project status reports to guarantee that you have a constant information flow and higher productivity.


4 diapositivas
Governance Practices for Risk Mitigation Presentation
Break down your risk strategy with the Governance Practices for Risk Mitigation Presentation. This slide features a step-stair 3D block visual, ideal for illustrating layered compliance initiatives, control measures, and escalation paths. Perfect for corporate governance teams, compliance officers, and strategic risk planners. Fully editable in PowerPoint, Keynote, and Google Slides.


6 diapositivas
Product Development Roadmap Presentation
Visualize your innovation journey with this Product Development Roadmap template. Perfect for outlining each stage from concept to launch, it keeps teams aligned on goals and timelines. Ideal for startups, tech teams, or product managers. Fully editable in PowerPoint, Keynote, and Google Slides for flexible, streamlined use.


4 diapositivas
Risk Assessments Matrix Presentation
Bring clarity to complex decisions with this bold, color-coded layout designed to pinpoint threats, compare impact levels, and communicate risks with confidence. This presentation makes evaluation simple, structured, and visually clear for any audience. Fully editable and ready for professional use. Compatible with PowerPoint, Keynote, and Google Slides.


6 diapositivas
Expert Tables Of Content Infographics
The "Expert Tables of Content" infographic template is a sophisticated and structured tool, designed to enhance presentations in PowerPoint, Keynote, and Google Slides. This template is ideal for authors, researchers, and professionals who need to present detailed content or reports in a clear and accessible format. This template efficiently organizes complex information into an easy-to-navigate format, showcasing chapters, sections, and key topics. It's tailored to highlight the depth and breadth of your content, making it an essential tool for academic presentations, business reports, or any comprehensive document requiring a detailed table of contents. The "Expert Tables of Content" infographic template revolutionizes the way we present complex information, perfectly crafted for PowerPoint, Keynote, and Google Slides. This template is a game-changer for authors, educators, and professionals aiming to captivate their audience with a well-structured and accessible presentation of their rich content. Designed to turn any extensive material into an engaging journey, this template masterfully organizes chapters, sections, and pivotal topics. It's an invaluable asset for transforming detailed reports, comprehensive academic papers, or sprawling creative works into a visually appealing and easily navigable format. With a design that's as striking as it is functional, the template boasts a color scheme that balances professionalism with vibrancy. T....


5 diapositivas
Business Future Vision Strategy Presentation
Visualize the roadmap to your company’s future with this engaging Business Future Vision Strategy slide. The stacked cylinder infographic helps you layer key initiatives, goals, or timelines in a clean and structured format. With five editable tiers and corresponding text areas, this layout is perfect for showcasing development phases, innovation strategies, or long-term planning. Ideal for strategic meetings, business proposals, or future-focused pitches. Compatible with PowerPoint, Keynote, and Google Slides for seamless customization.