


Características


¿Tienes alguna pregunta?
Recomendar


7 diapositivas
Sales Cycle Infographic
A sales cycle, refers to the series of stages or steps that a salesperson or a sales team follows to convert a prospective customer into a paying customer. This infographic template is a structured approach to lead a potential customer from the initial contact to making a purchase. Compatible with Powerpoint, Keynote, and Google Slides. This is an illustrative guide to the fundamental stages of the sales journey. Equip yourself with an understanding of how sales progress, from prospecting to closing the deal, enabling you to optimize your strategies and drive success in the dynamic world of sales.


23 diapositivas
Delphi Investor Pitch Presentation
The Delphi Pitch Deck offers a warm and inviting design, ideal for conveying complex business concepts in a clear and engaging manner. The deck features a cohesive layout that covers all the essential components of a successful pitch, including company overview, problem statement, solution, market opportunity, and target audience. With a focus on optimizing supply chain efficiency, the template is perfect for startups and businesses looking to showcase their unique selling proposition and innovative strategies. The deck also includes detailed sections on business model canvas, revenue model, competitive landscape, and financial projections, ensuring your audience receives a comprehensive understanding of your business. The soft color palette enhances readability while maintaining a professional tone, making it suitable for various industries. Fully compatible with PowerPoint, Keynote, and Google Slides, the Delphi Pitch Deck is the perfect tool for delivering a memorable and persuasive presentation.


2 diapositivas
End Slide with Contact and Gratitude Message Presentation
Say goodbye with impact and leave a lasting impression! This clean, modern slide is perfect for ending presentations with a clear contact section and a heartfelt thank-you message. Ideal for client decks, proposals, or reports. Fully compatible with PowerPoint, Keynote, and Google Slides for easy editing and customization.


5 diapositivas
New Hire Onboarding Roadmap Presentation
Guide new employees with clarity using the New Hire Onboarding Roadmap Presentation. This visual roadmap features a timeline layout with icons resembling briefcases, each representing a stage in the onboarding process. Ideal for HR professionals or team leads, it helps outline milestones such as orientation, training, and integration steps. Fully editable in Canva, PowerPoint, Google Slides, and Keynote.


5 diapositivas
Four-Step Marketing Funnel Plan Presentation
Streamline your messaging with the Four-Step Marketing Funnel Plan Presentation. This clean, vertical funnel layout highlights each stage of your strategy—ideal for visualizing lead nurturing, sales processes, or campaign progression. Each level is clearly marked and editable, helping you deliver focused insights with ease. Fully compatible with PowerPoint, Canva, Keynote, and Google Slides.


10 diapositivas
Africa Market Potential and Growth Map Presentation
Unlock business opportunities with the Africa Market Potential and Growth Map template, designed to showcase market analysis and growth trends across different African regions. It features a map highlighting specific countries coupled with adjustable data bars reflecting market potential percentages. This template is ideal for presentations focusing on market trends, investment opportunities, and growth forecasts in Africa.


10 diapositivas
SEO and Social Media Marketing Presentation
Shine a spotlight on your brand’s digital growth with this bold and professional layout designed to showcase analytics, engagement, and SEO strategies. Ideal for marketers, strategists, and agencies, it transforms data into visuals that persuade and inform. Fully compatible with PowerPoint, Keynote, and Google Slides for easy editing.


26 diapositivas
Navigating Freelance and Flexible Work Presentation
Take control of your career with this insightful presentation on navigating freelance and flexible work. Covering key topics like client management, productivity strategies, income stability, and remote work tools, this template helps you present a clear roadmap to success. Fully customizable and compatible with PowerPoint, Keynote, and Google Slides for a seamless experience.


6 diapositivas
RACI Responsibilities Assignment Matrix Presentation
Bring clarity and structure to your workflow with a clean layout that instantly shows who’s doing what and when. This presentation helps you assign ownership, improve communication, and eliminate confusion across projects using a simple visual matrix. Fully editable and compatible with PowerPoint, Keynote, and Google Slides.


20 diapositivas
Aether Marketing Research Report Presentation
The Marketing Research Report Presentation Template offers a sleek design with 20 fully customizable slides, ideal for presenting in-depth marketing insights. This template features sections for industry analysis, consumer behavior, emerging technologies, and marketing trends like SEO, social media, and influencer strategies. It also highlights e-commerce trends, personalization, sustainability, and storytelling techniques. The modern black-and-gold gradient aesthetic adds sophistication, making it perfect for professional reports. Compatible with PowerPoint, Keynote, and Google Slides, this template ensures a polished and engaging presentation experience.


4 diapositivas
Project Timeline & Milestone Presentation
Stay on track and visualize your progress with this Project Timeline & Milestone Presentation. Perfect for project managers and team leads, this template features a clean Gantt-style layout that spans multiple months, allowing you to clearly map out tasks, timelines, and key milestones. Use it to enhance stakeholder reporting or internal planning sessions. Fully editable in PowerPoint, Keynote, and Google Slides.


6 diapositivas
5-Level Risk Assessment Diagram Presentation
Simplify complex risk analysis with a clean, layered design that walks your audience through five key levels of impact and probability. Perfect for corporate reports, project management, or strategic planning, this presentation ensures clarity and engagement. Fully compatible with PowerPoint, Keynote, and Google Slides for easy customization.


5 diapositivas
Veterinary Diagnostics and Treatment Presentation
Clearly outline your care process with the Veterinary Diagnostics and Treatment presentation. This slide features a visually appealing medical bag segmented into four quadrants, each marked by colorful paw prints and editable titles. Ideal for showcasing diagnosis steps, treatment plans, or service categories for veterinary clinics. Fully customizable and easy to adapt for use in PowerPoint, Keynote, and Google Slides. Perfect for pet care professionals seeking a professional, pet-friendly visual.


10 diapositivas
Cloud Services Deployment Strategy Presentation
Present your IT roadmap with clarity using the Cloud Services Deployment Strategy slide. This vertical flowchart features ascending arrows and cloud icons, ideal for showing phased rollouts, service tiers, or migration plans. Easy to customize in PowerPoint, Keynote, and Google Slides.


7 diapositivas
Compliance Gap Analysis Infographic
Navigate the complexities of organizational compliance with our compliance gap analysis infographic. Using a vibrant palette of orange, white, and green, this infographic elucidates the differences between current compliance practices and desired standards. Specifically designed for business analysts, compliance officers, and risk managers, this template is an invaluable tool to identify, analyze, and bridge compliance-related gaps. With its fun yet informative style, communicating these insights becomes more engaging and understandable. This infographic is ready for integration with PowerPoint, Keynote, and Google Slides, ensuring smooth presentations across various platforms.


20 diapositivas
Museara Sales Pitch Deck Presentation
Create a compelling sales pitch with this dynamic and modern presentation template. It includes key sections like company overview, competitive analysis, pricing strategy, and future opportunities to help you showcase your value proposition effectively. Ideal for startups and enterprises alike. Compatible with PowerPoint, Keynote, and Google Slides for easy editing.


23 diapositivas
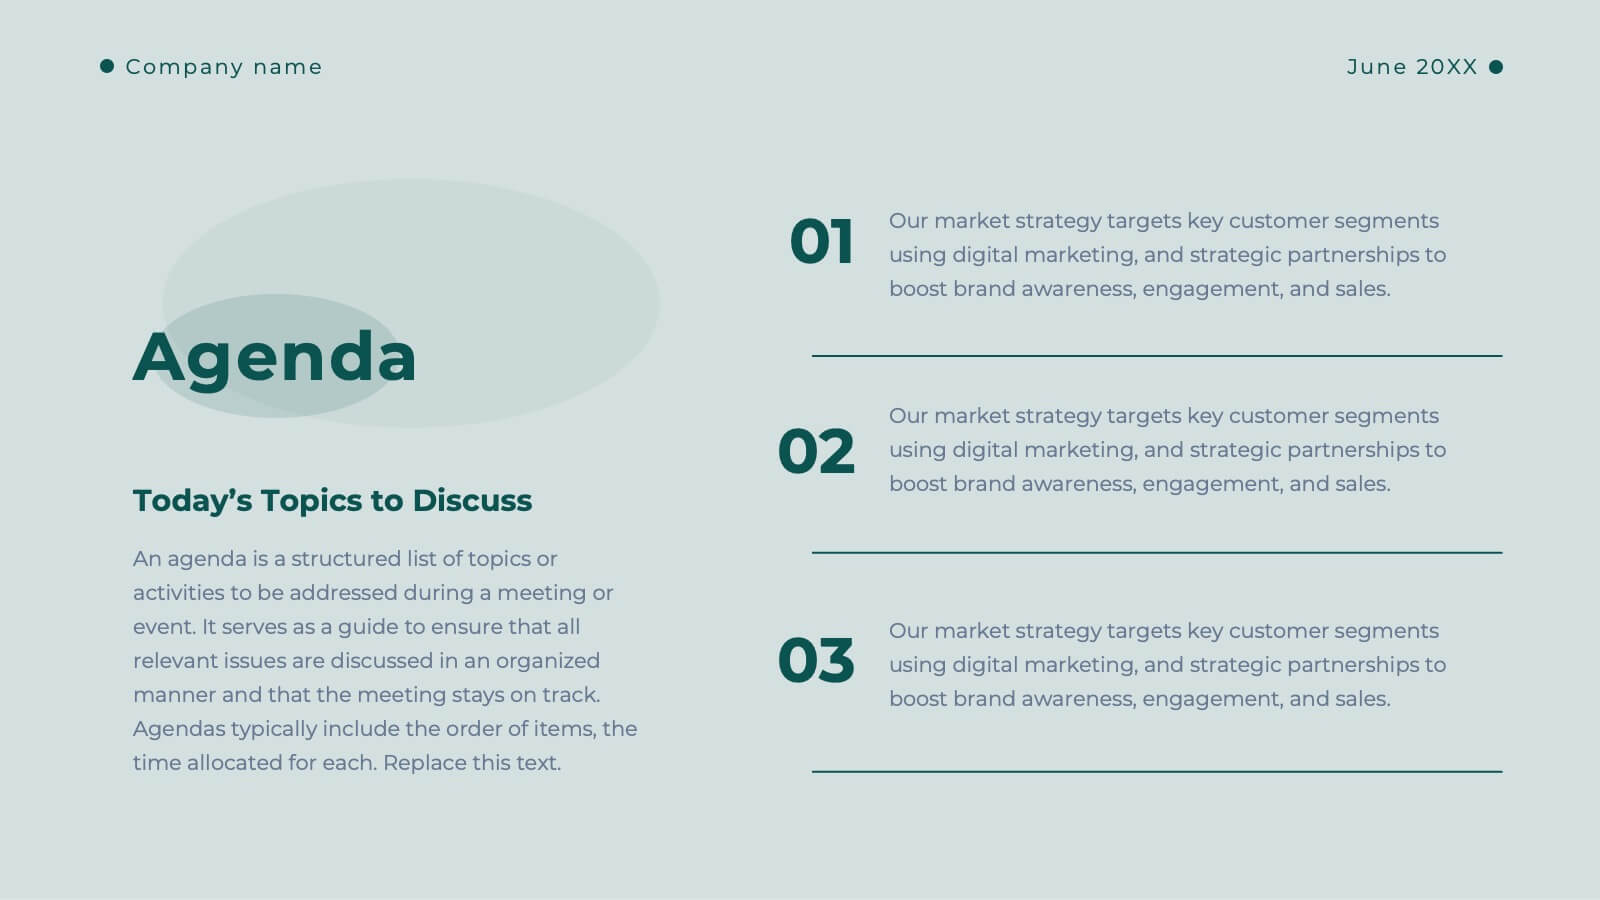
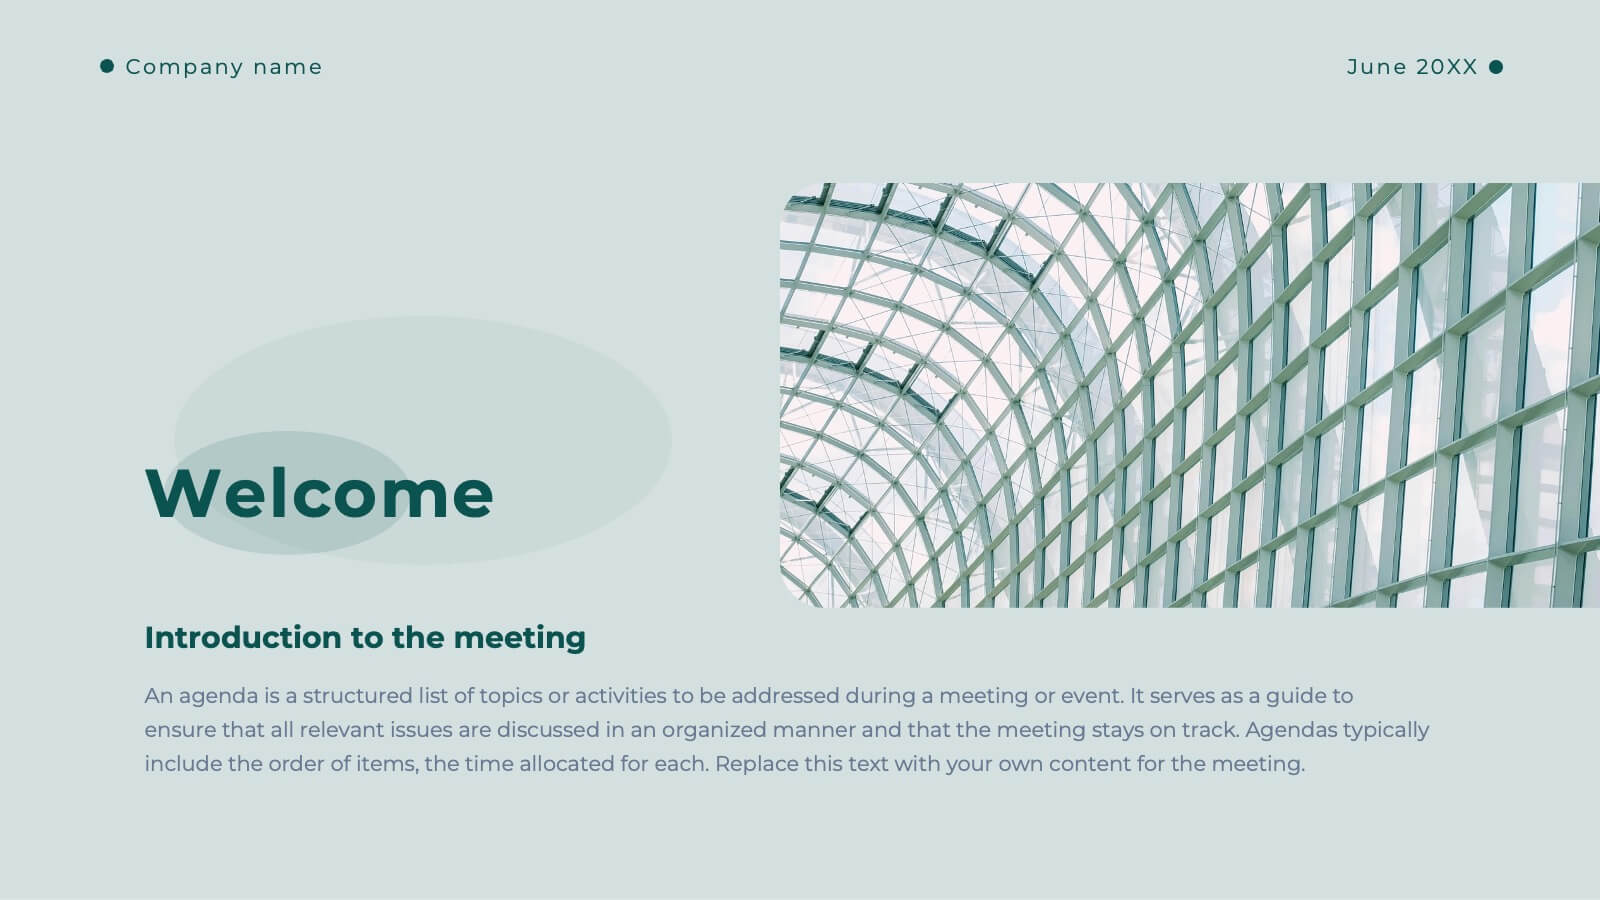
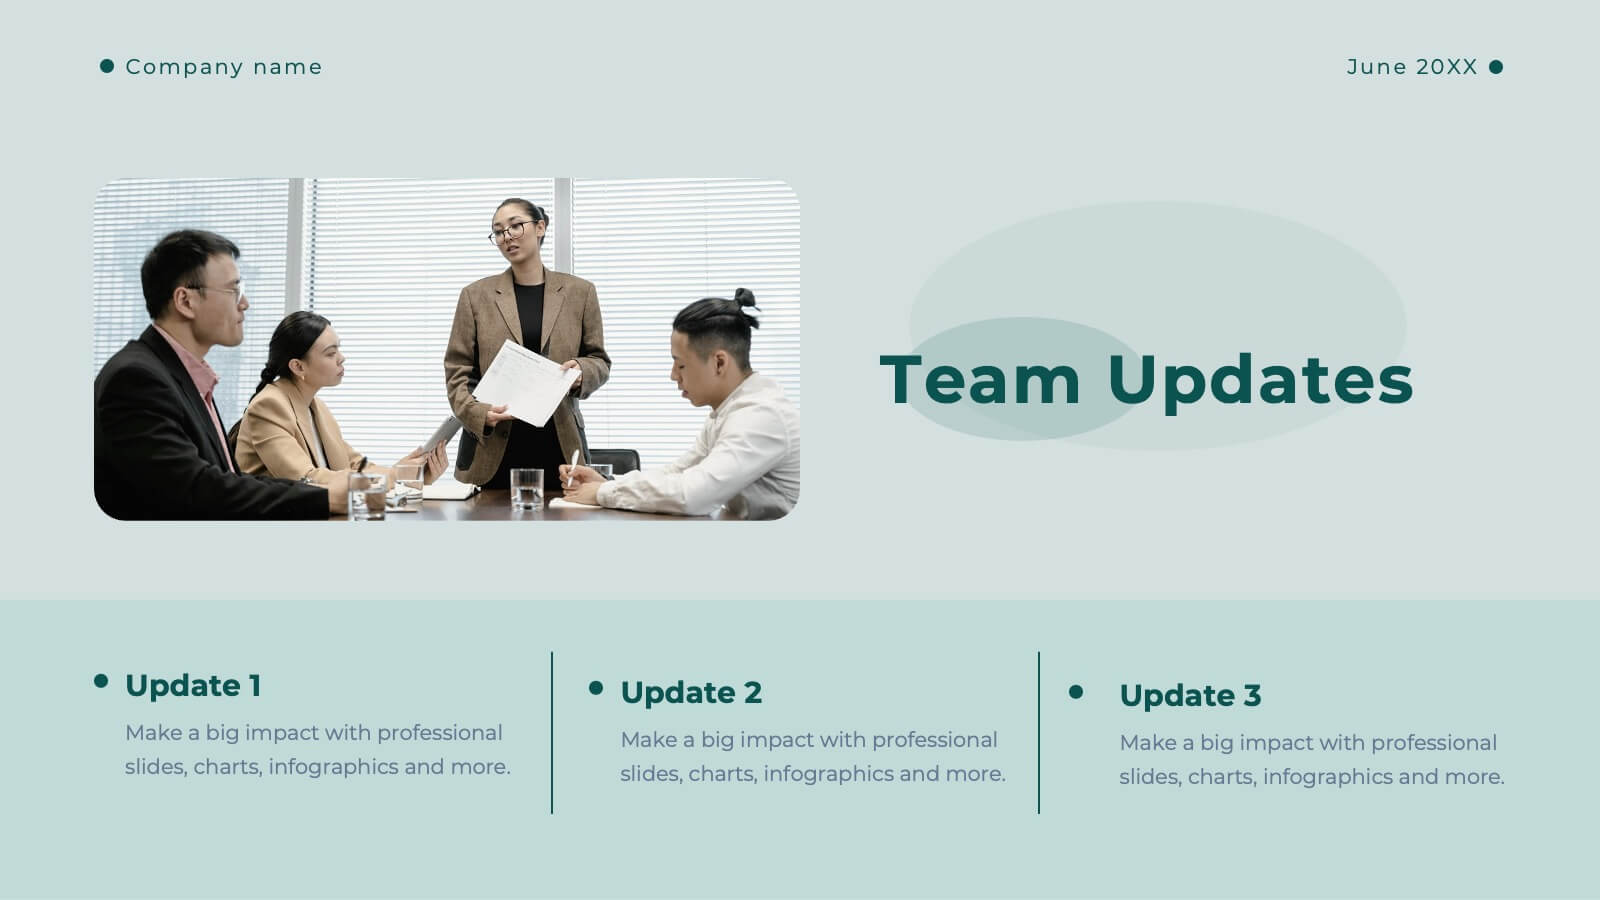
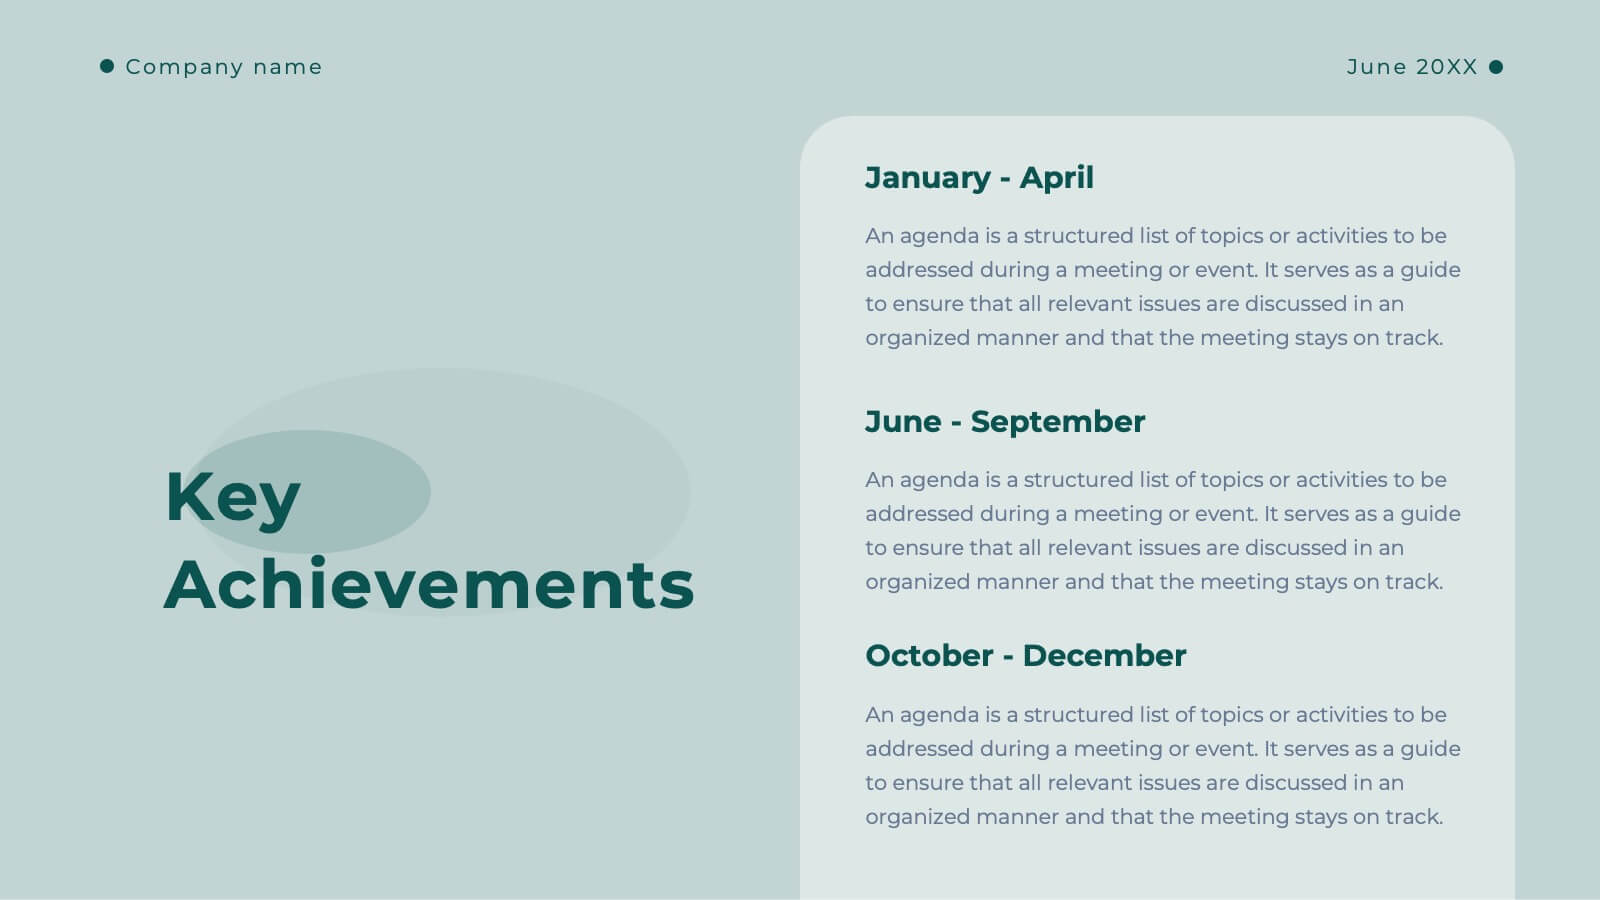
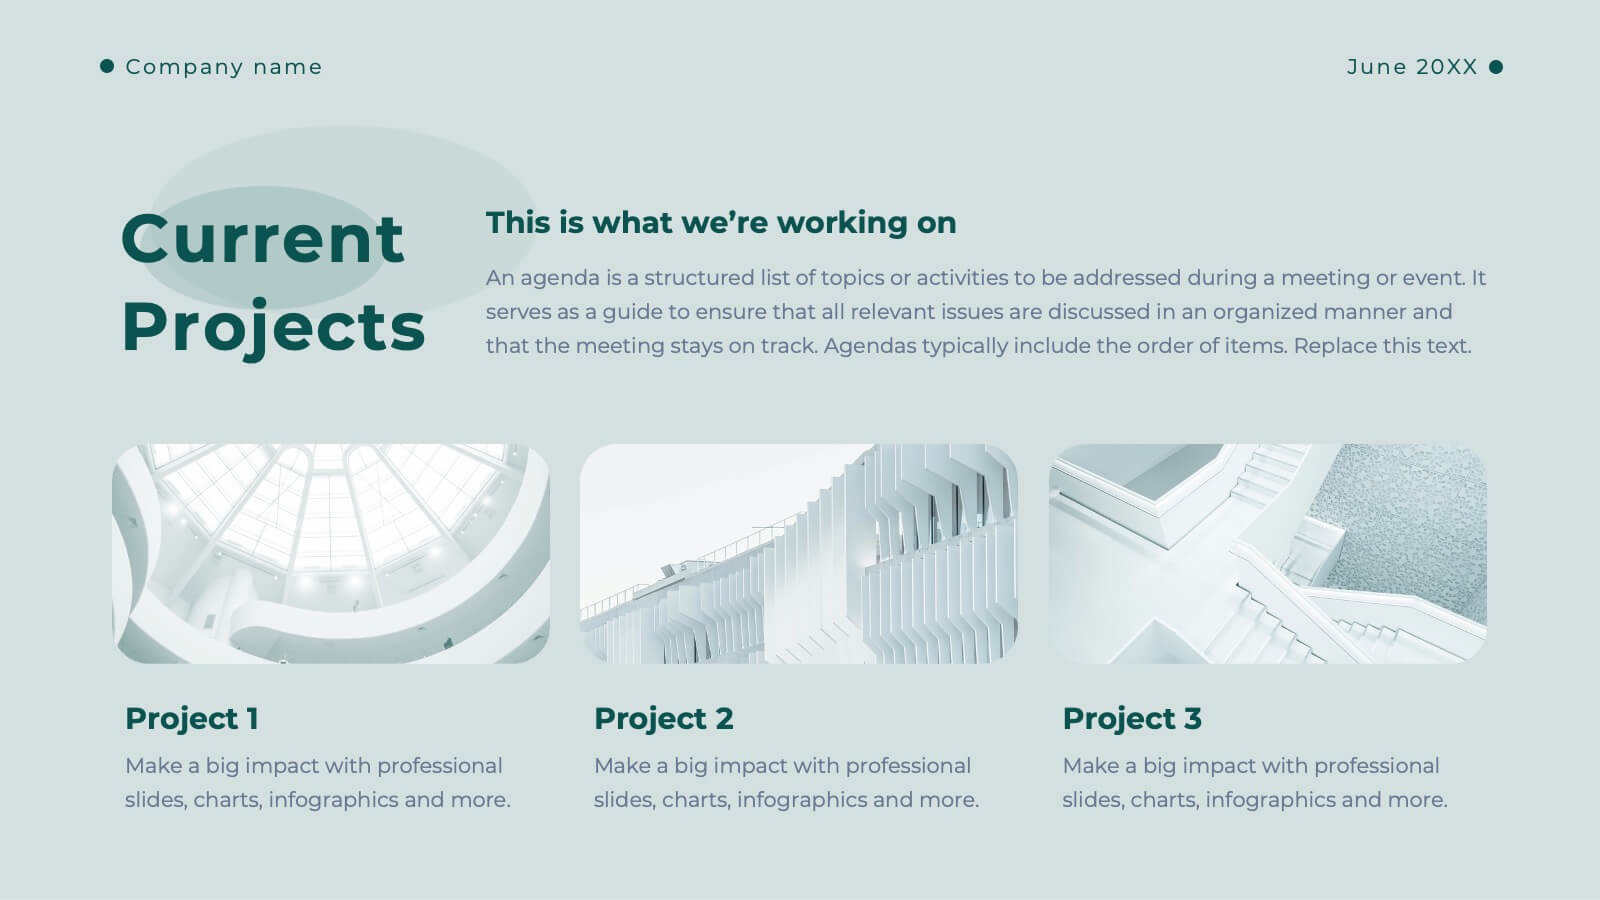
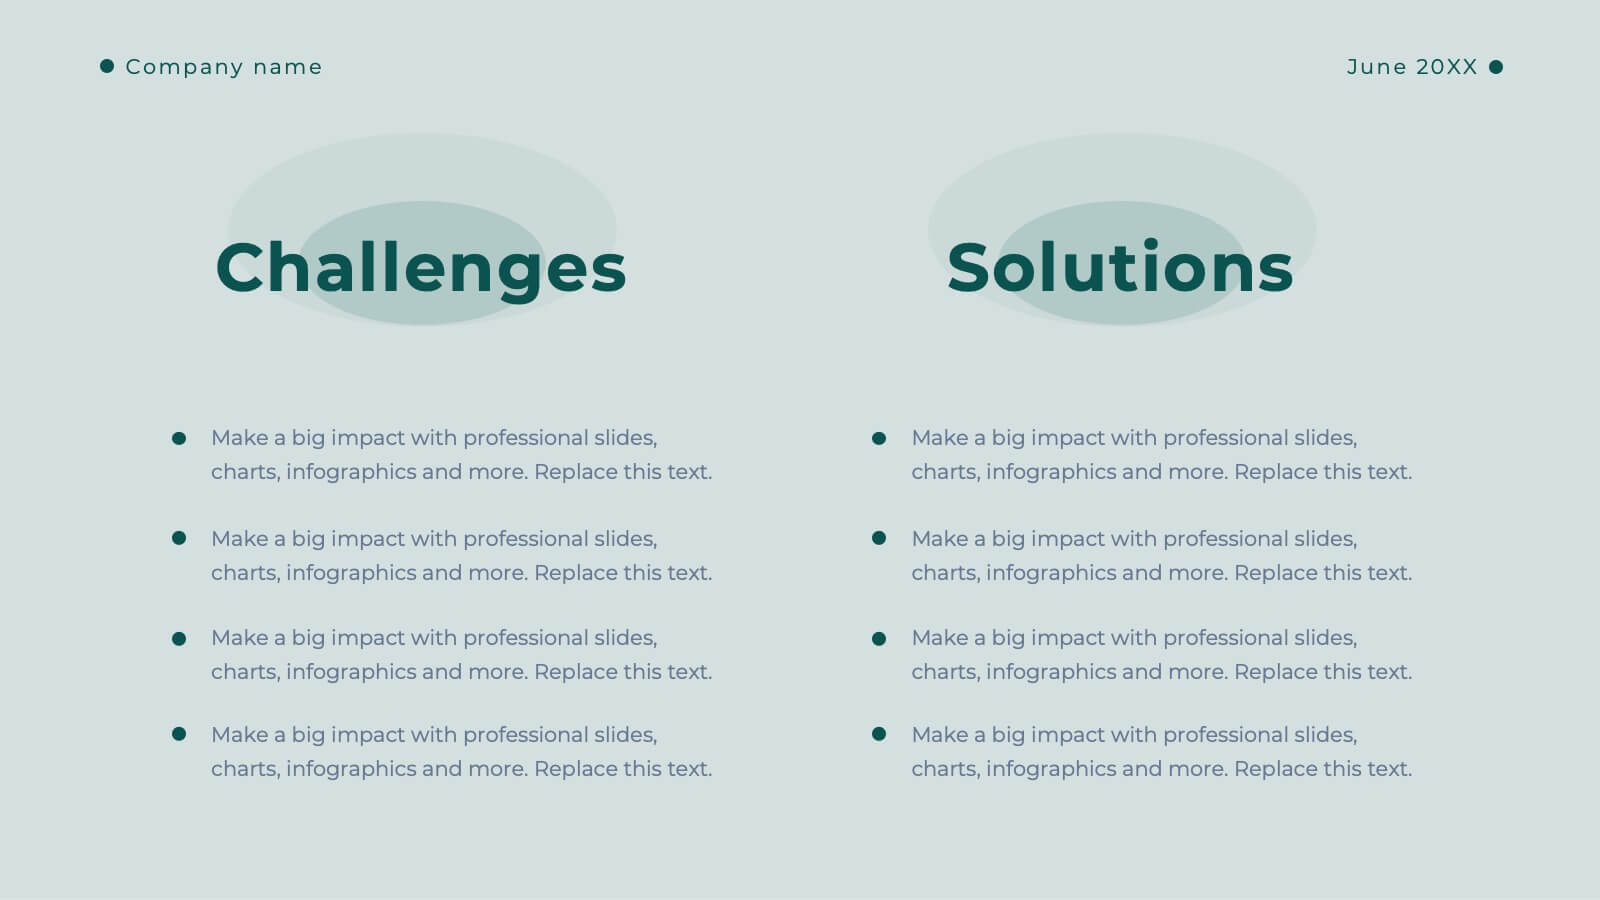
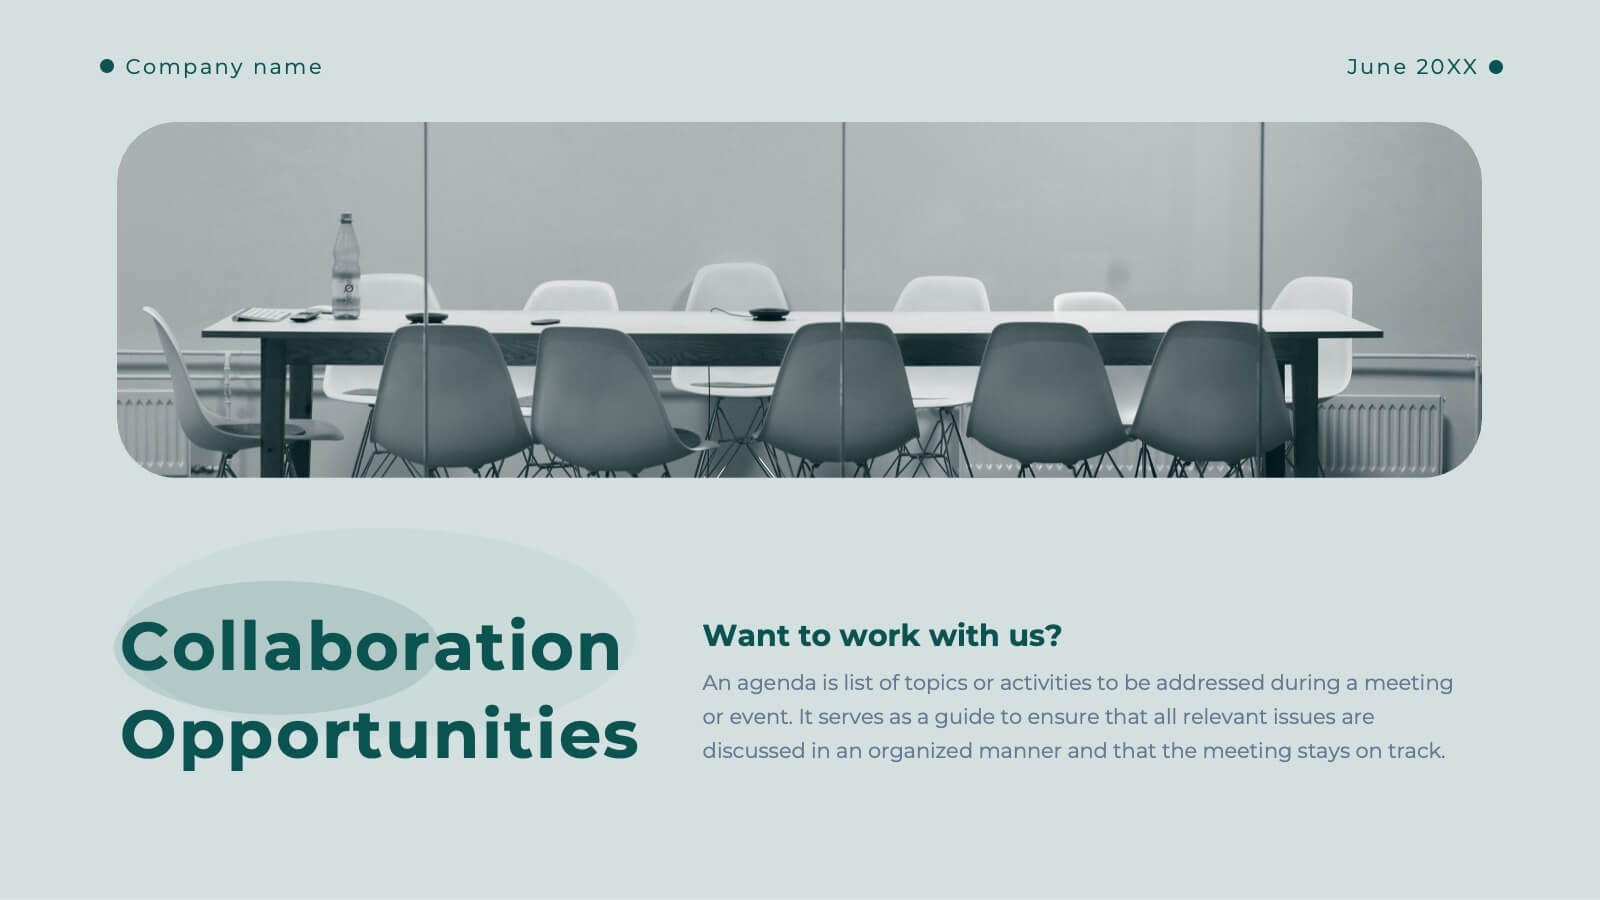
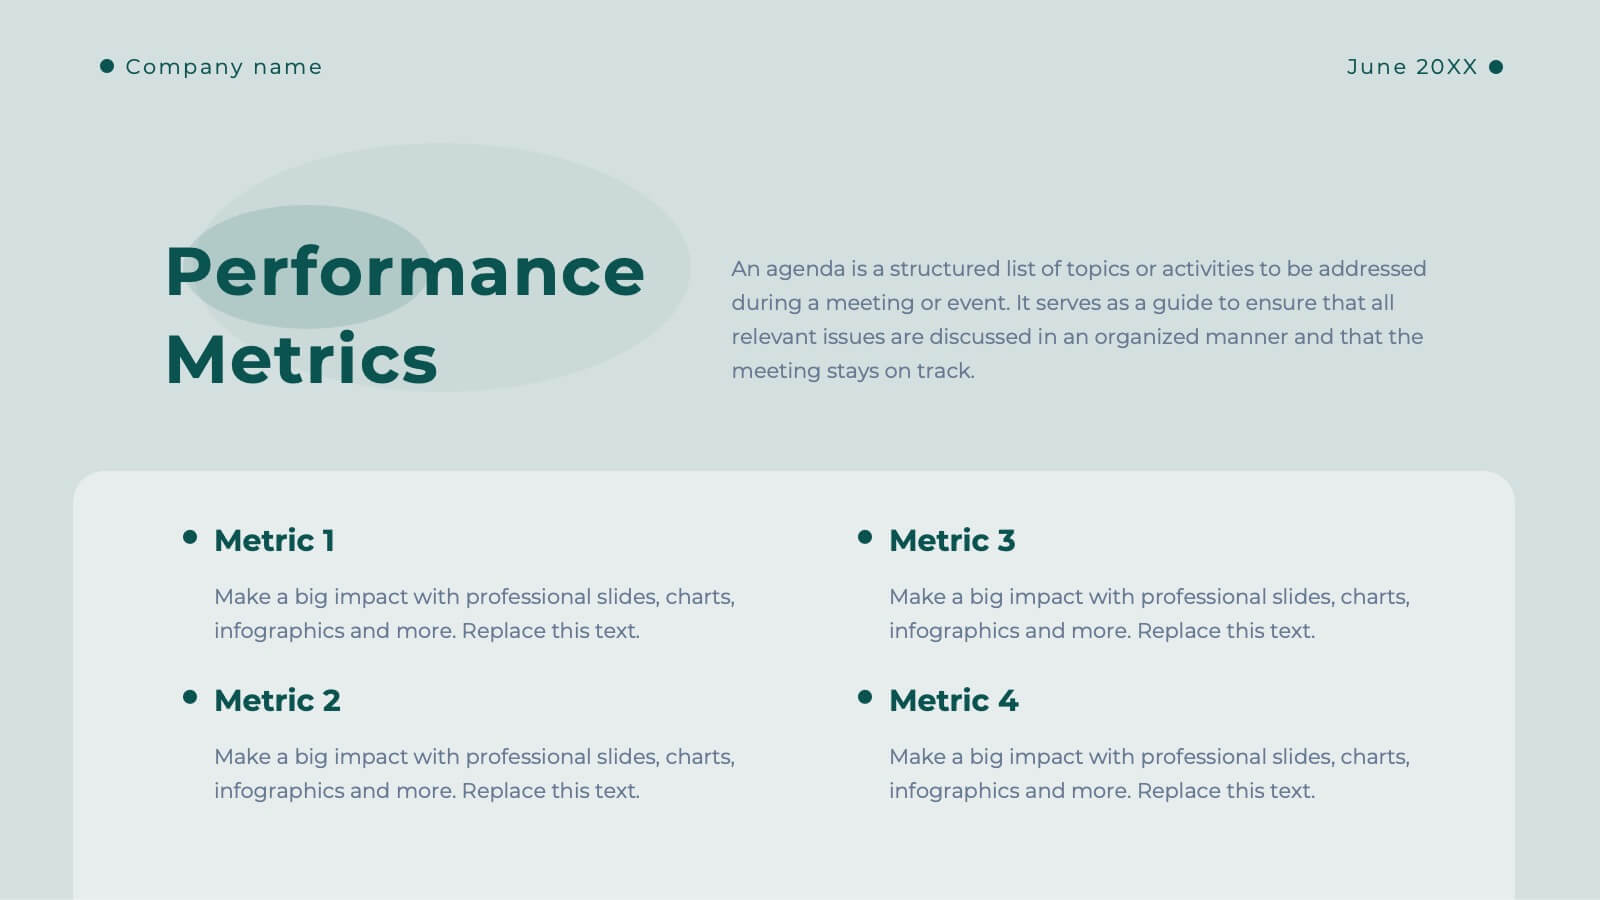
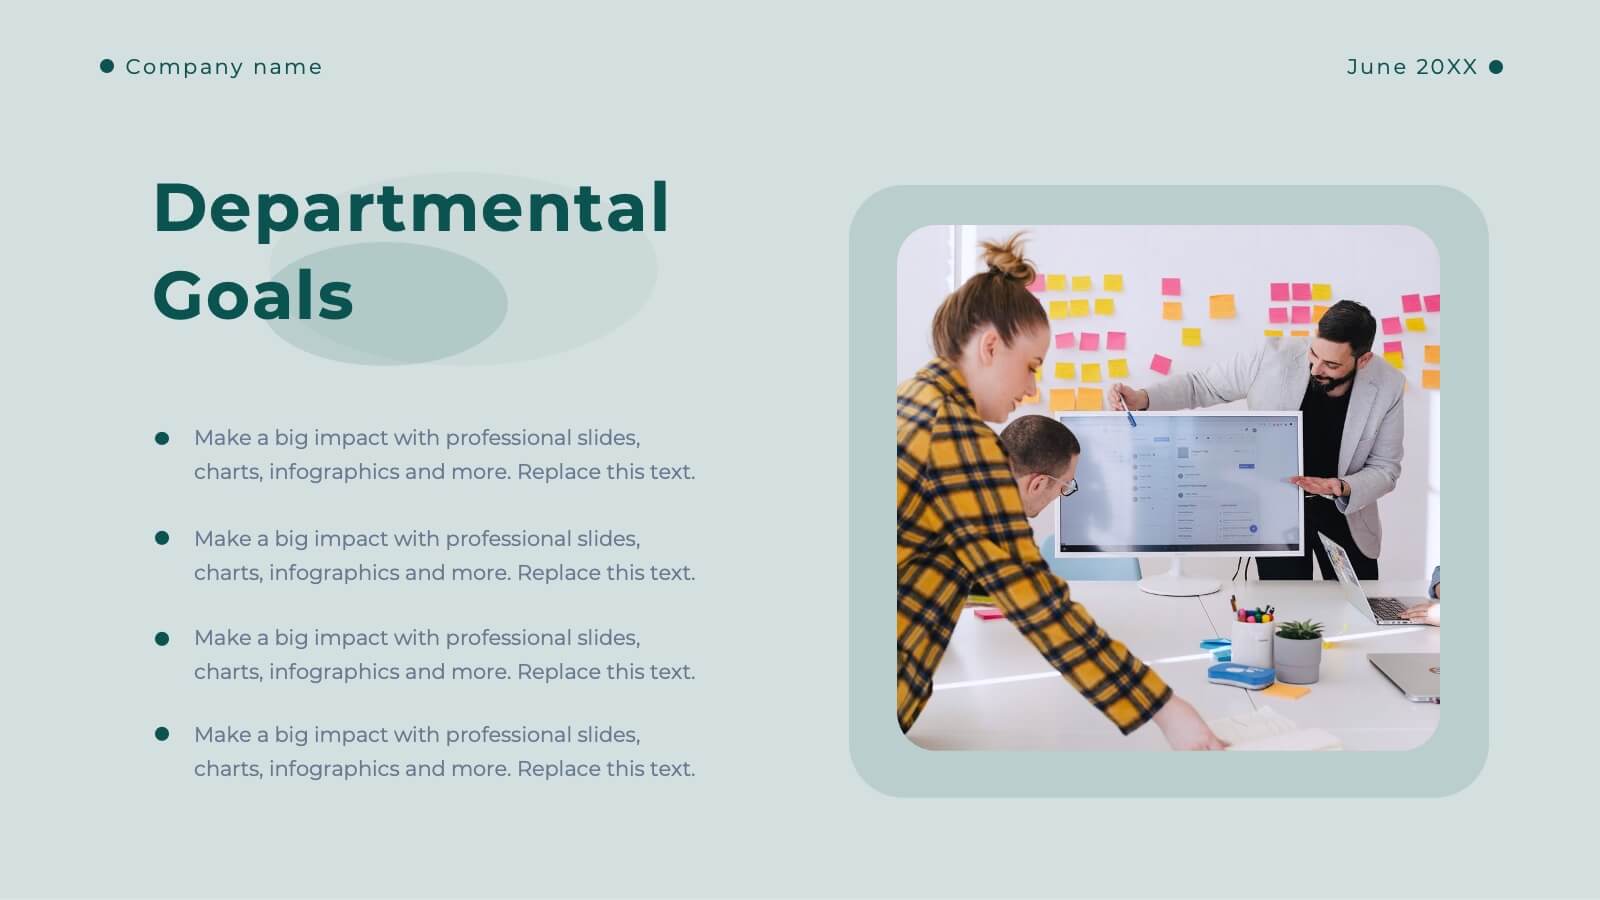
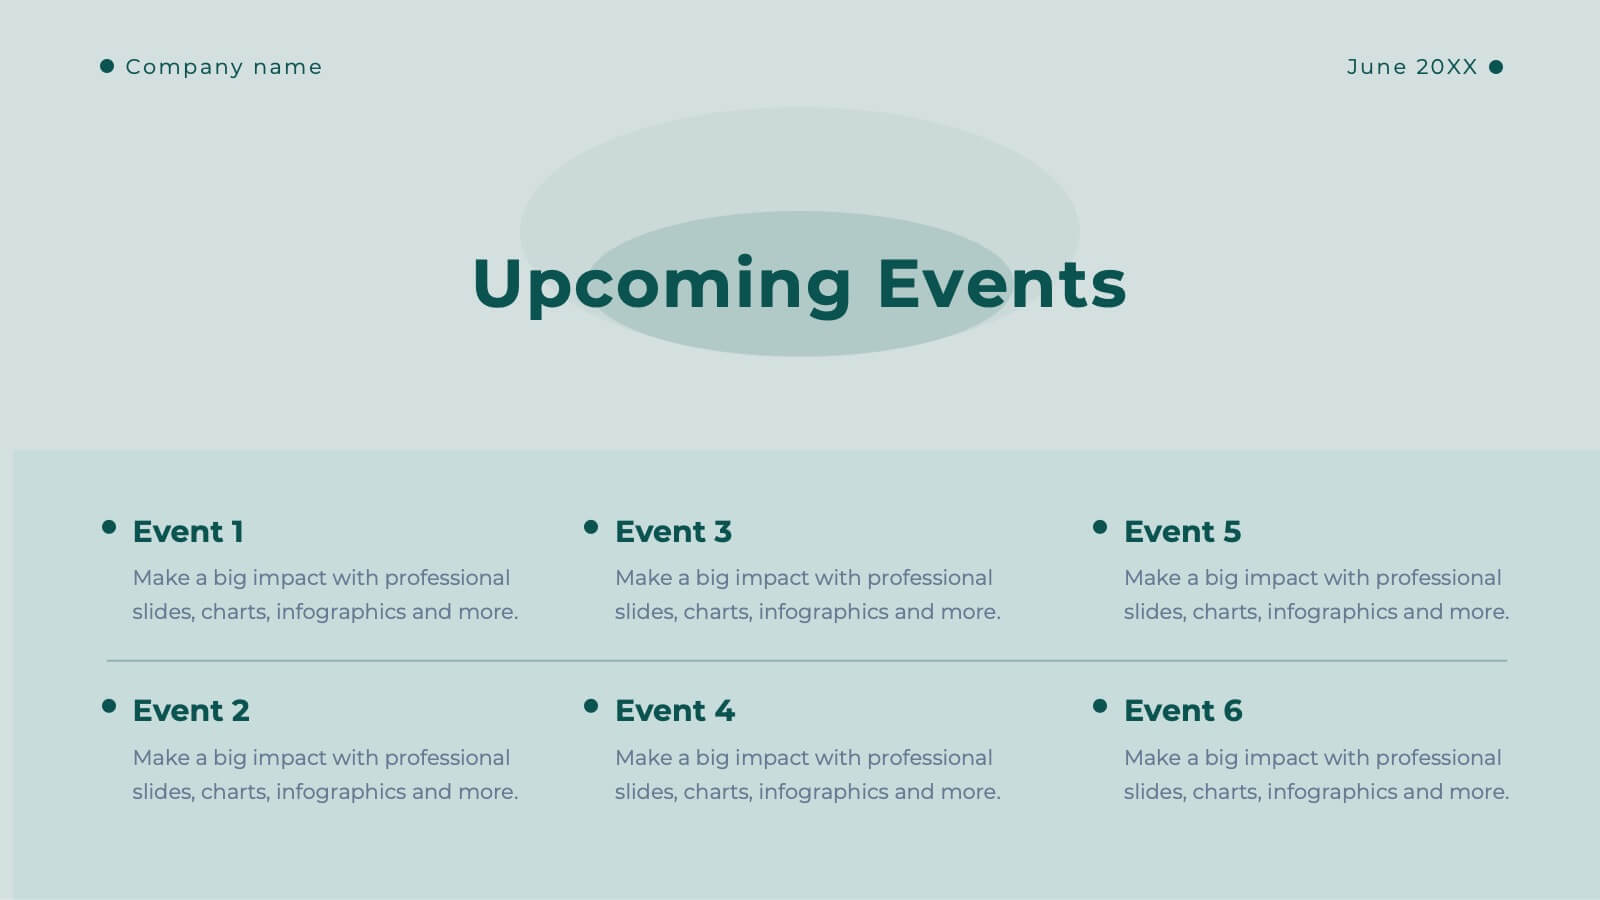
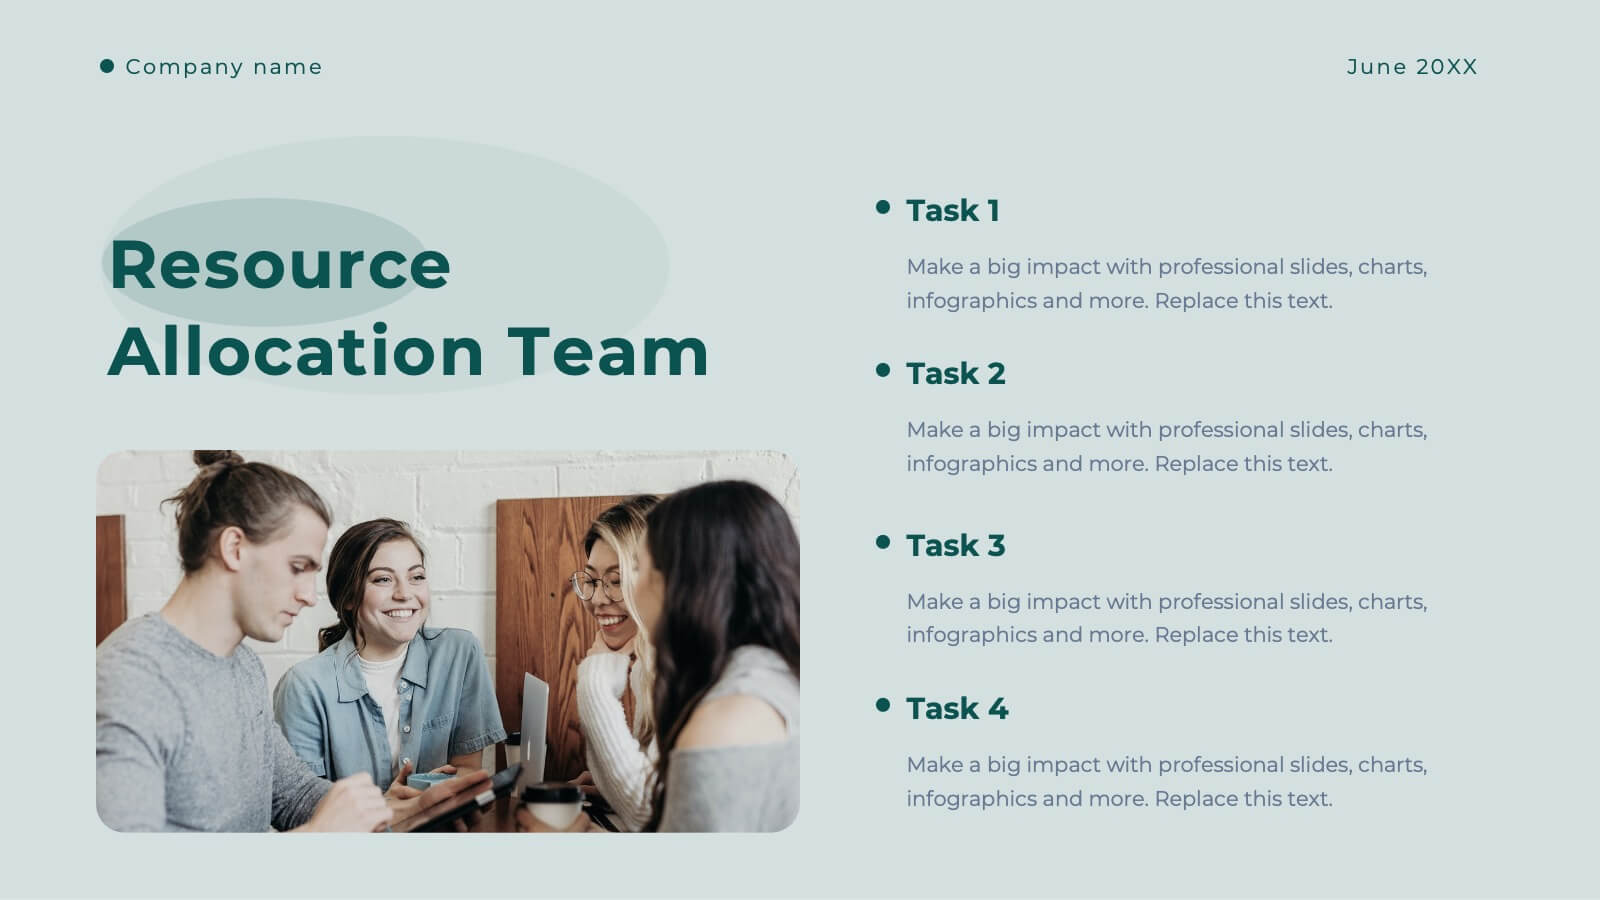
Clarity Business Operations Plan Presentation
Optimize your business operations with this sleek presentation template! Perfect for outlining team updates, key achievements, and performance metrics, it includes slides for departmental goals, process improvements, and upcoming events. Engage your team with clear visuals and detailed content. Compatible with PowerPoint, Keynote, and Google Slides for seamless presentations on any platform.