


Características


¿Tienes alguna pregunta?
Recomendar


12 diapositivas
Business Environmental Factors PESTEL Analysis Presentation
Visualize critical external influences on your business strategy with this Business Environmental Factors PESTEL Analysis slide. Designed for consultants, business analysts, and executive teams, this template uses a circular layout to highlight the six core PESTEL categories—Political, Economic, Sociocultural, Technological, Environmental, and Legal. Each segment is clearly marked with icons and labels, offering space to insert key insights or impact notes. Perfect for competitive analysis, board presentations, and long-term planning. Fully editable in PowerPoint, Keynote, and Google Slides.


10 diapositivas
Corporate Governance Model Presentation
Bring clarity and structure to complex leadership systems with this clean, modern slide, perfect for explaining how key responsibilities flow across an organization. It helps simplify roles, decisions, and oversight for any business audience. Fully editable and easy to use in PowerPoint, Keynote, and Google Slides.


7 diapositivas
Interpersonal Communication Infographic
Interpersonal communication is the process by which people exchange information, feelings, and meaning through verbal and non-verbal messages in various contexts. This vibrant infographic template is a visual exploration of the art of effective communication, revealing the key to building strong relationships both personally and professionally. Compatible with Powerpoint, Keynote, and Google Slides. Immerse yourself in the world of communication, where understanding and connection are paramount. This template will help you explore how technology has transformed communication, showcasing its advantages in the modern world.

22 diapositivas
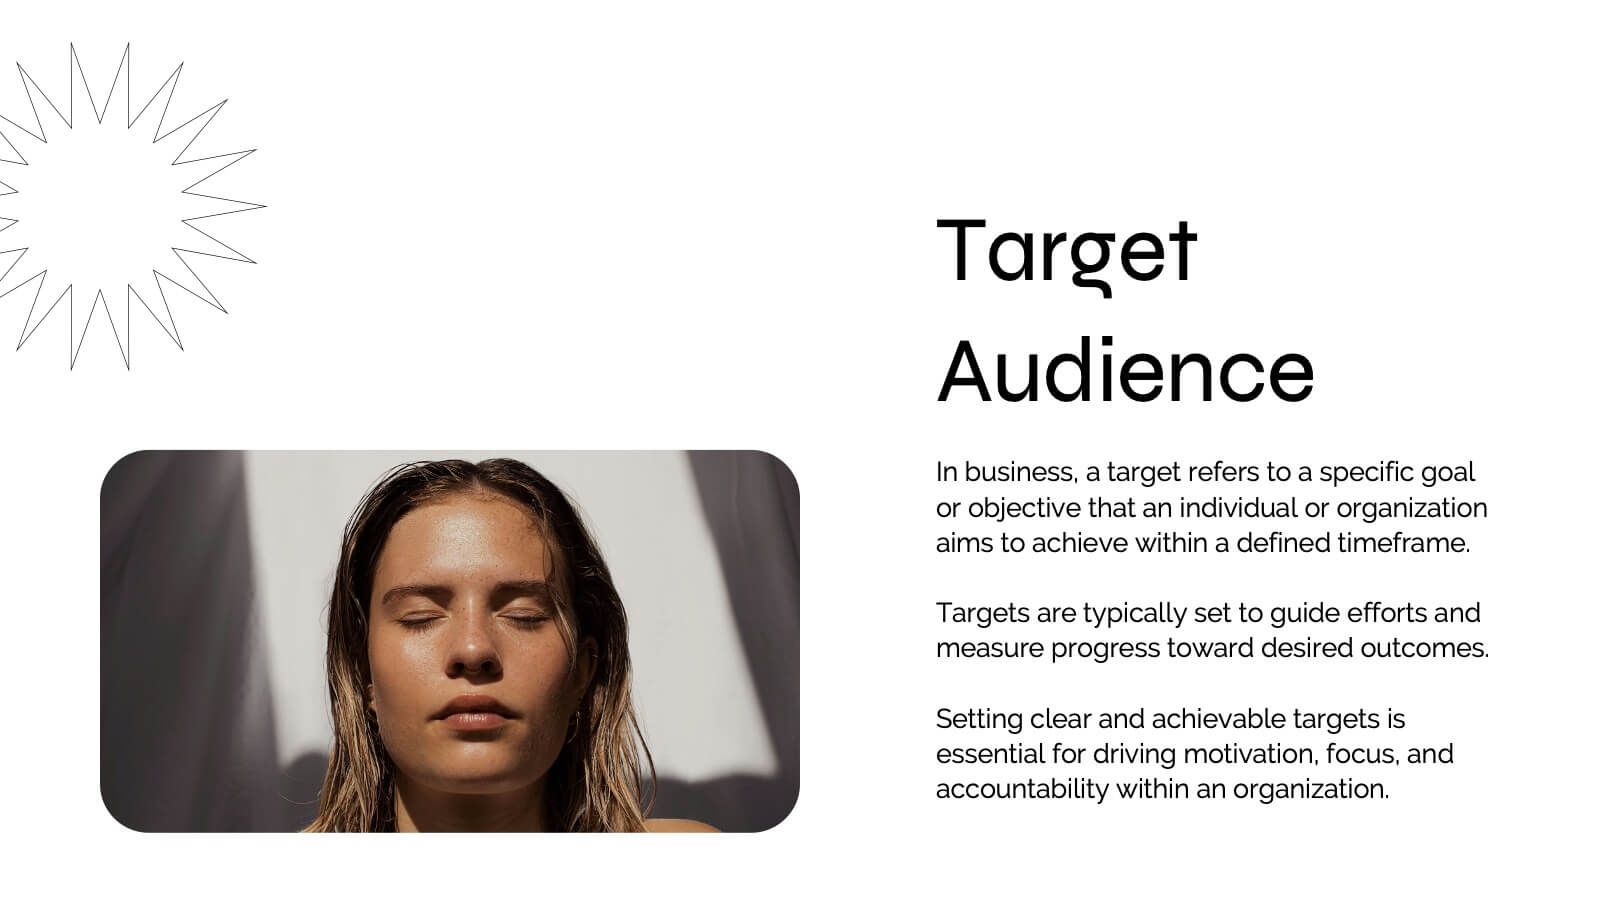
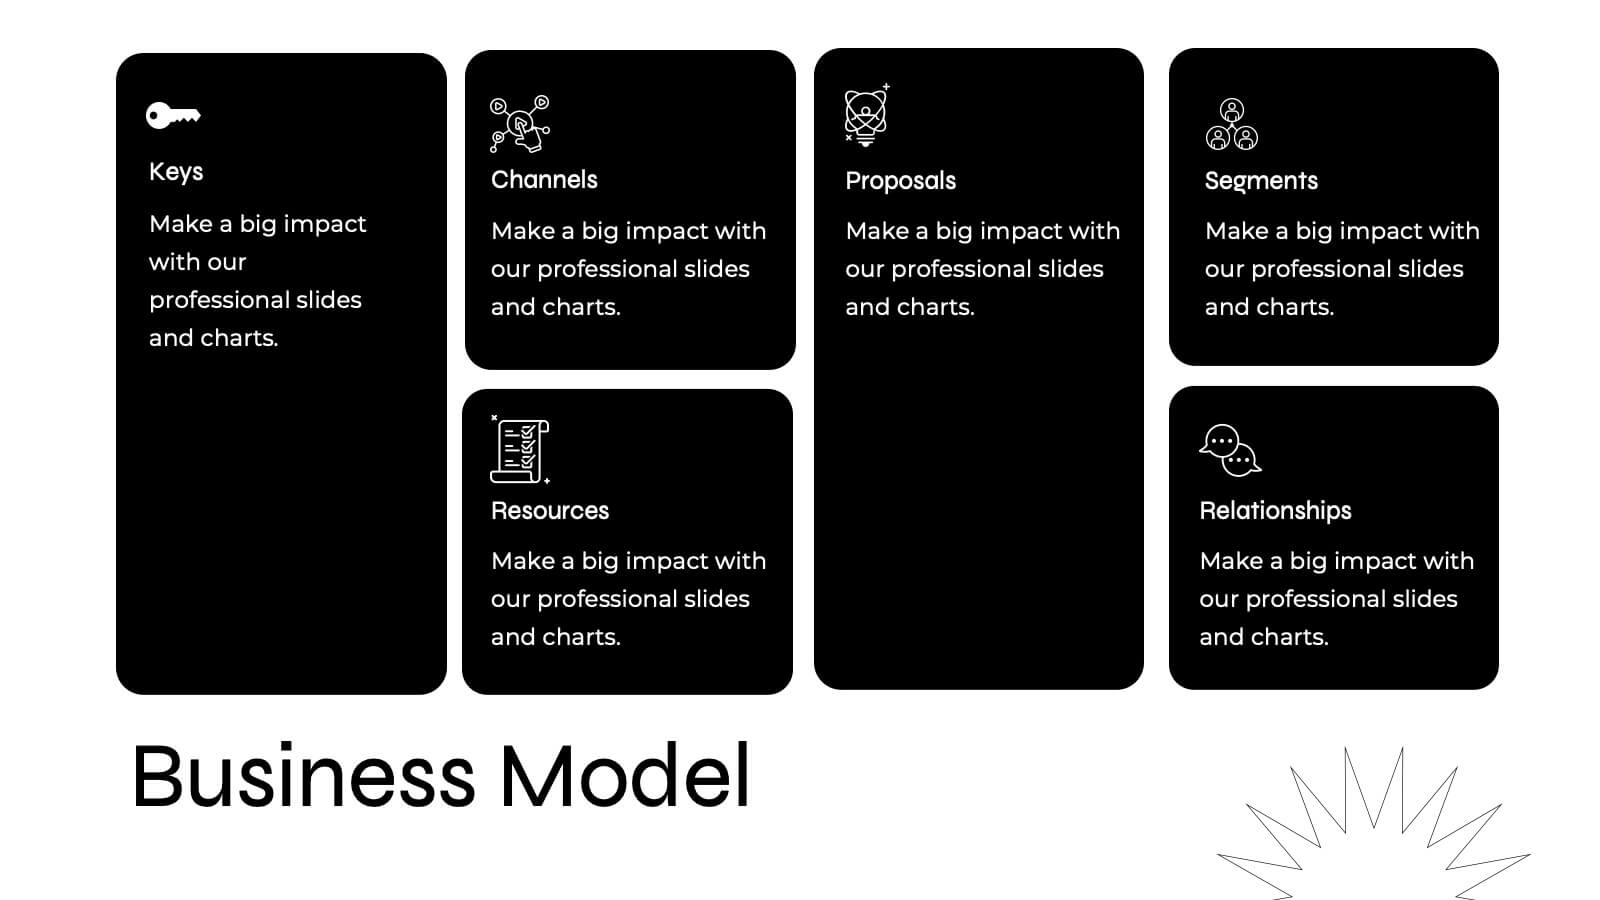
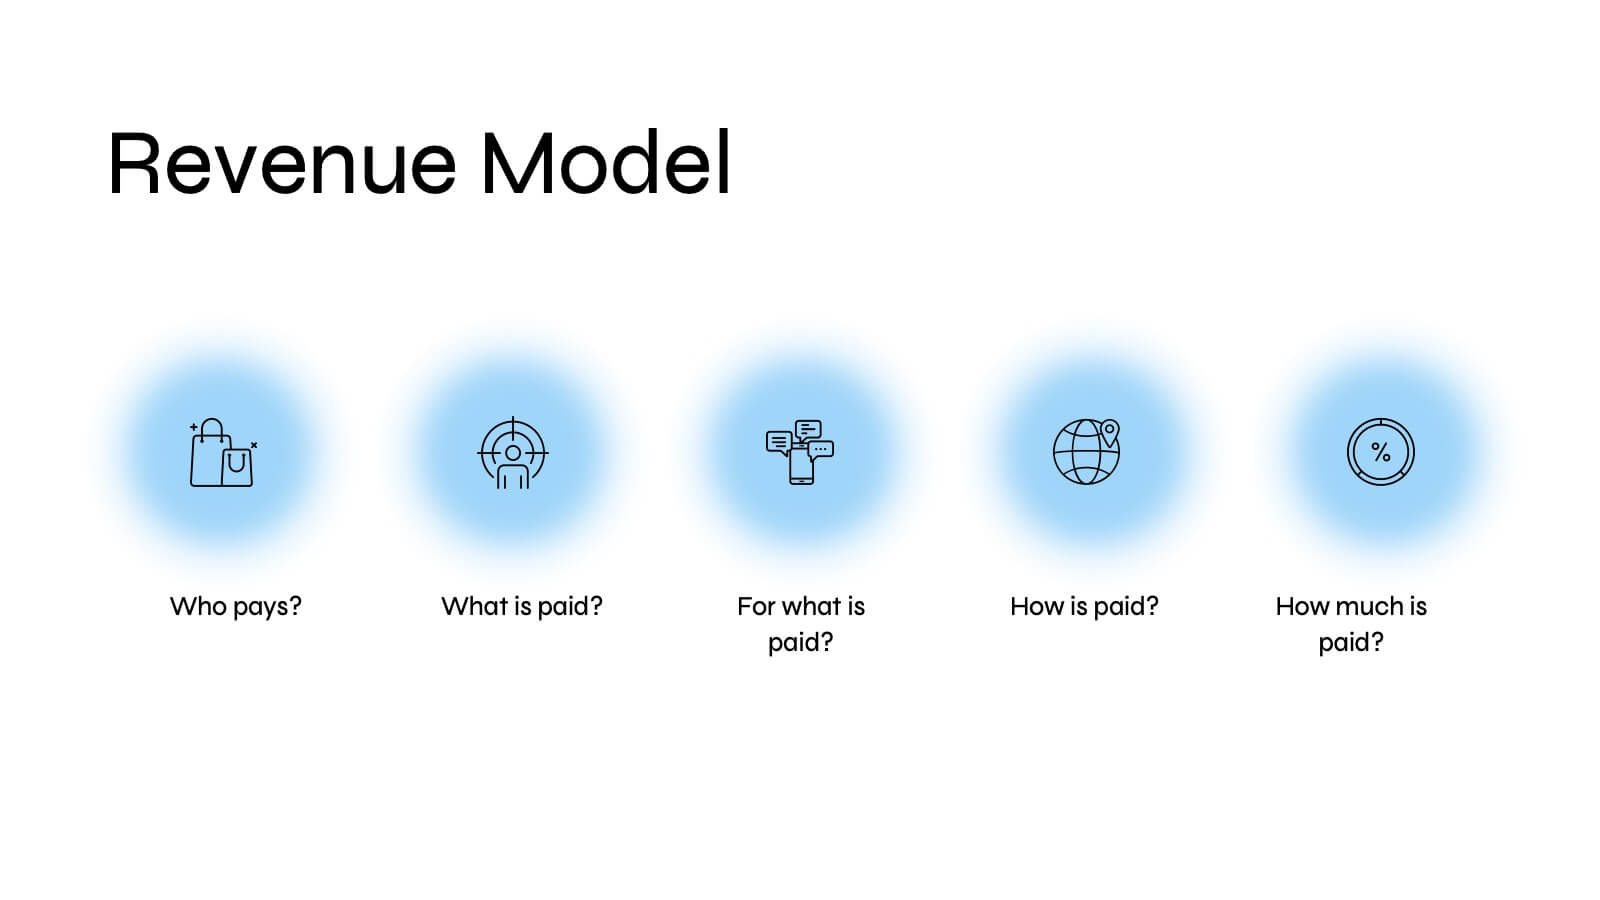
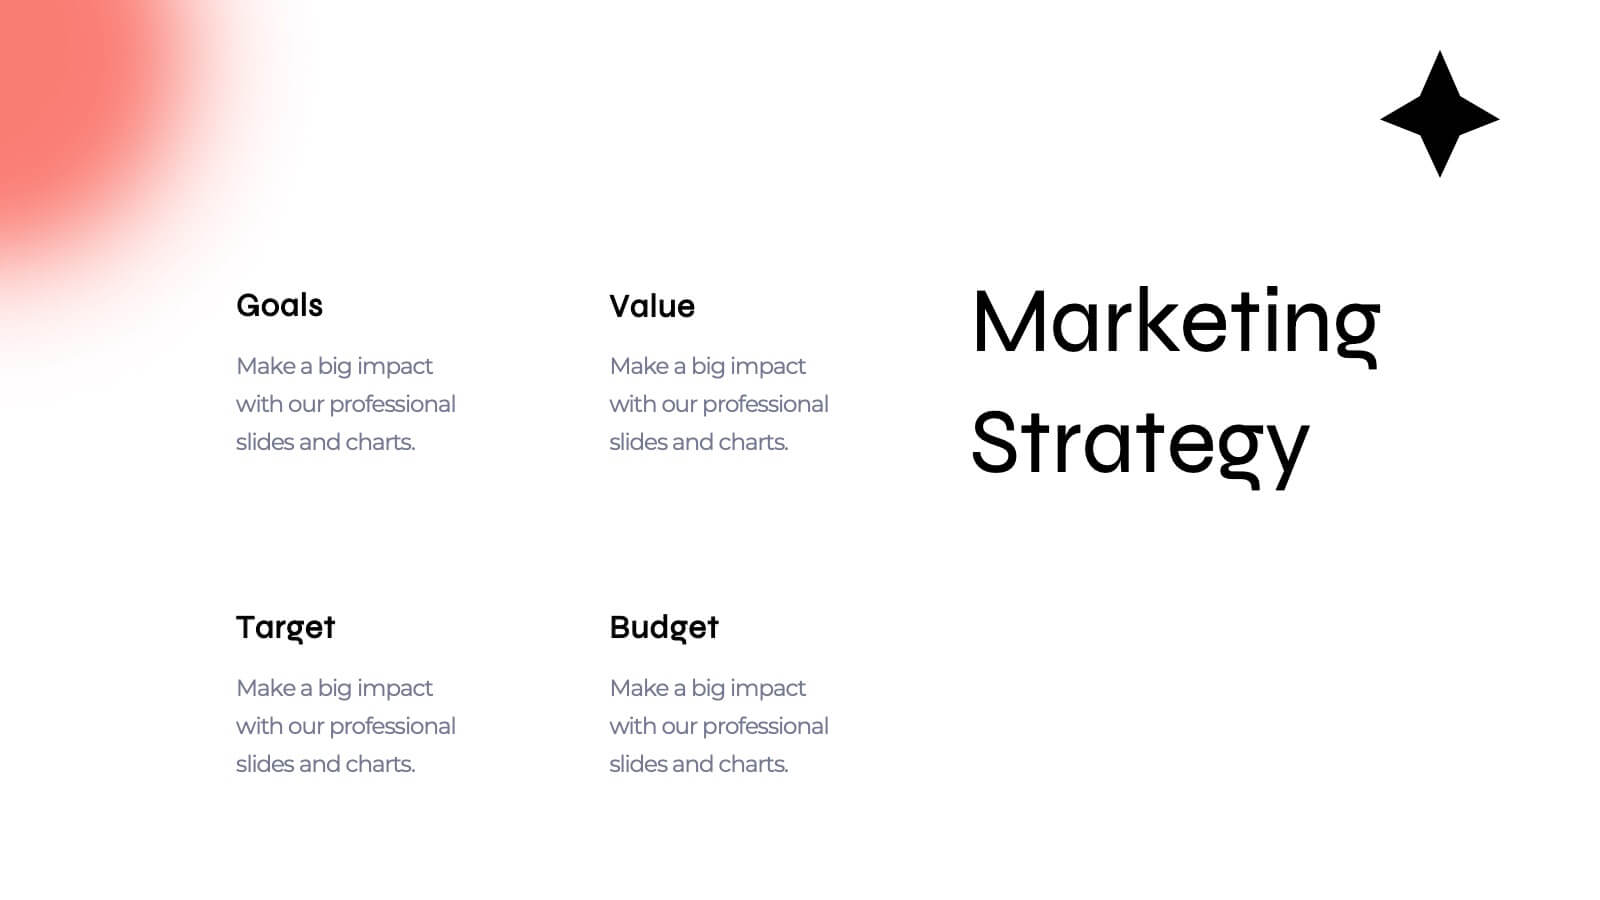
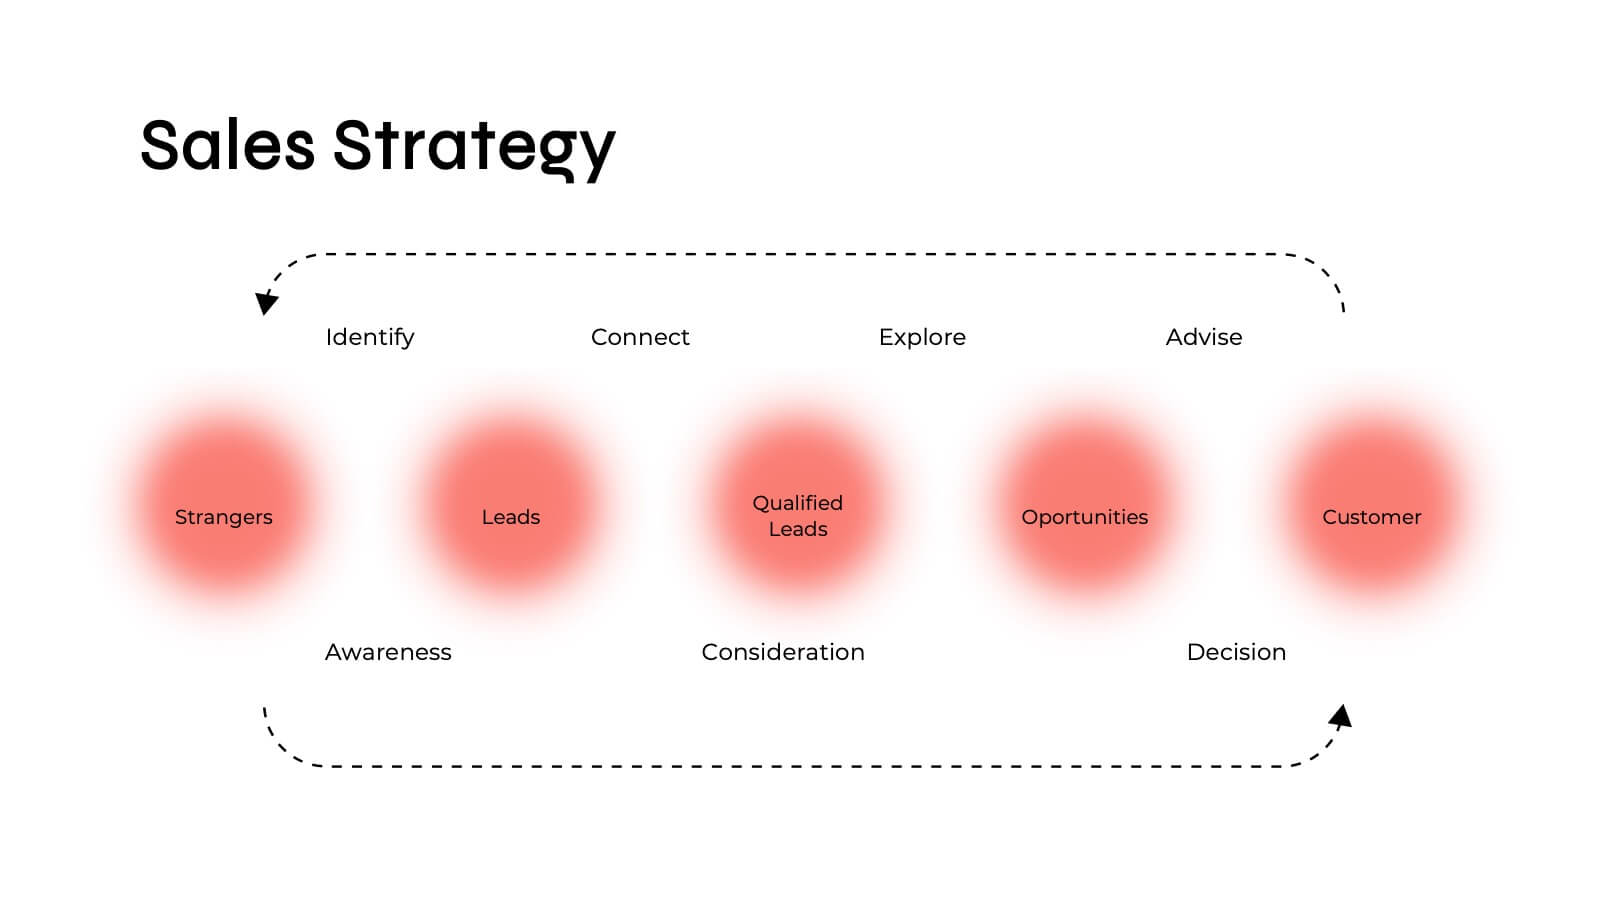
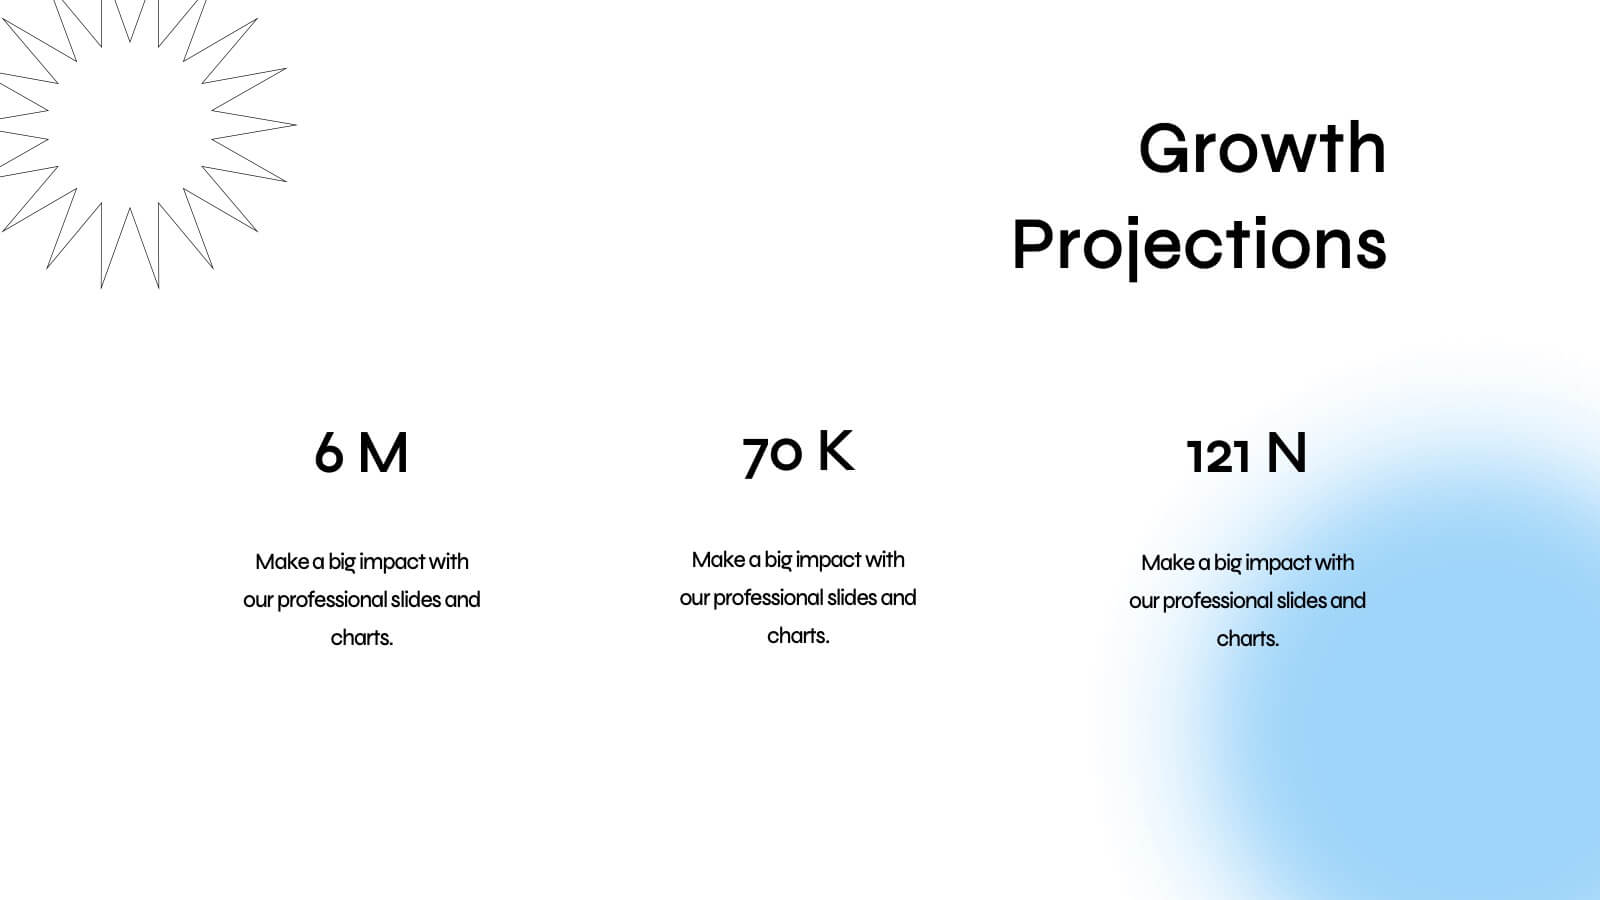
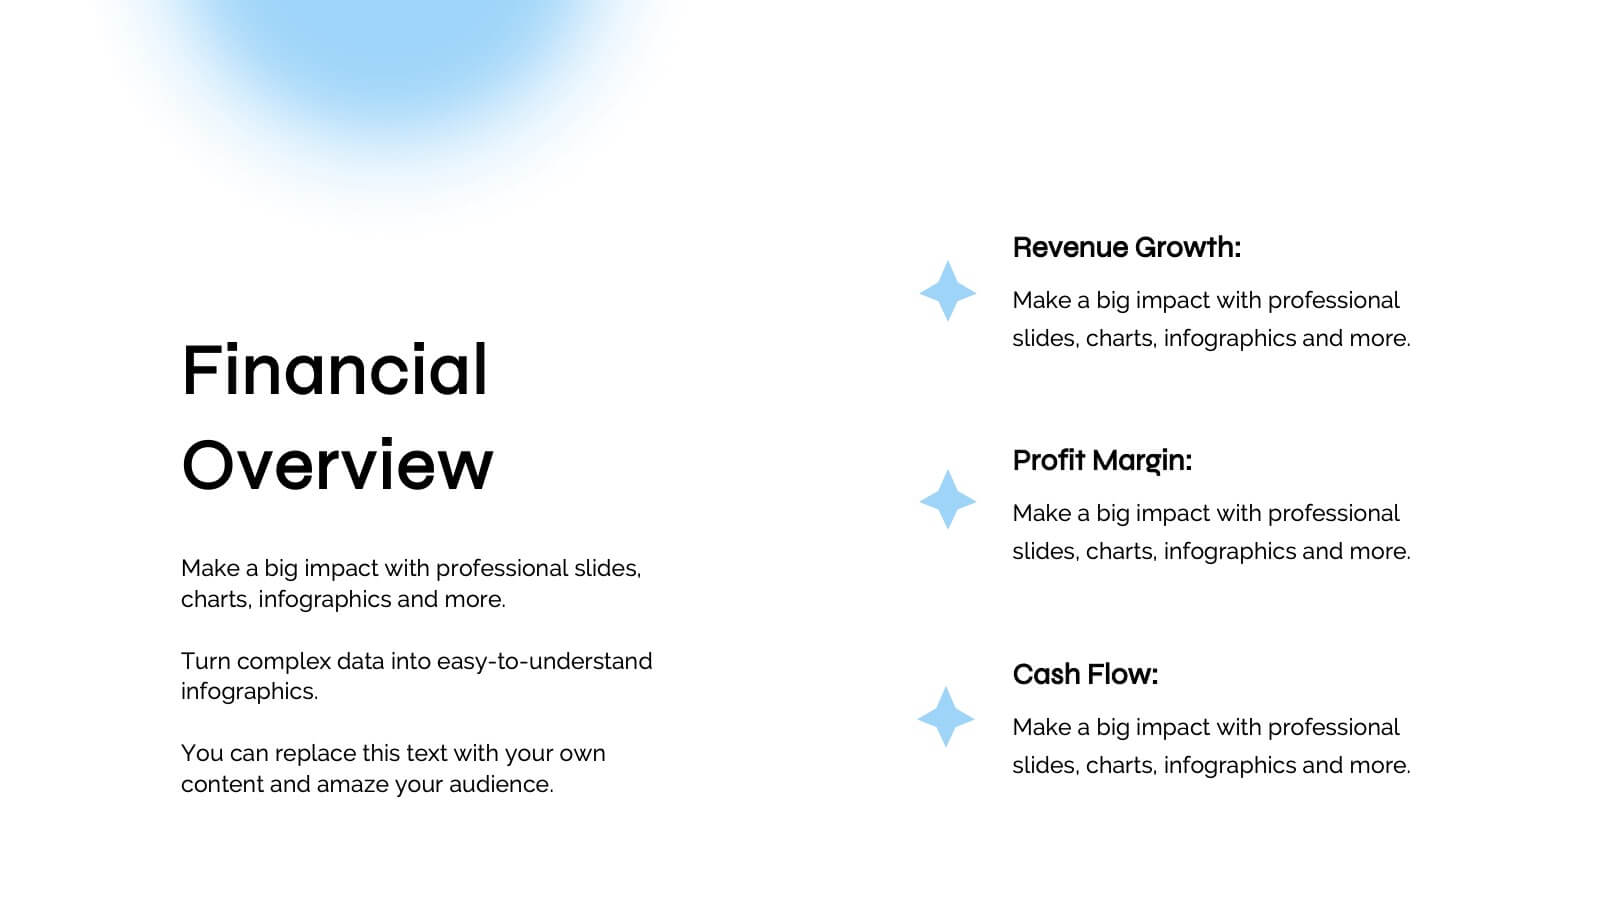
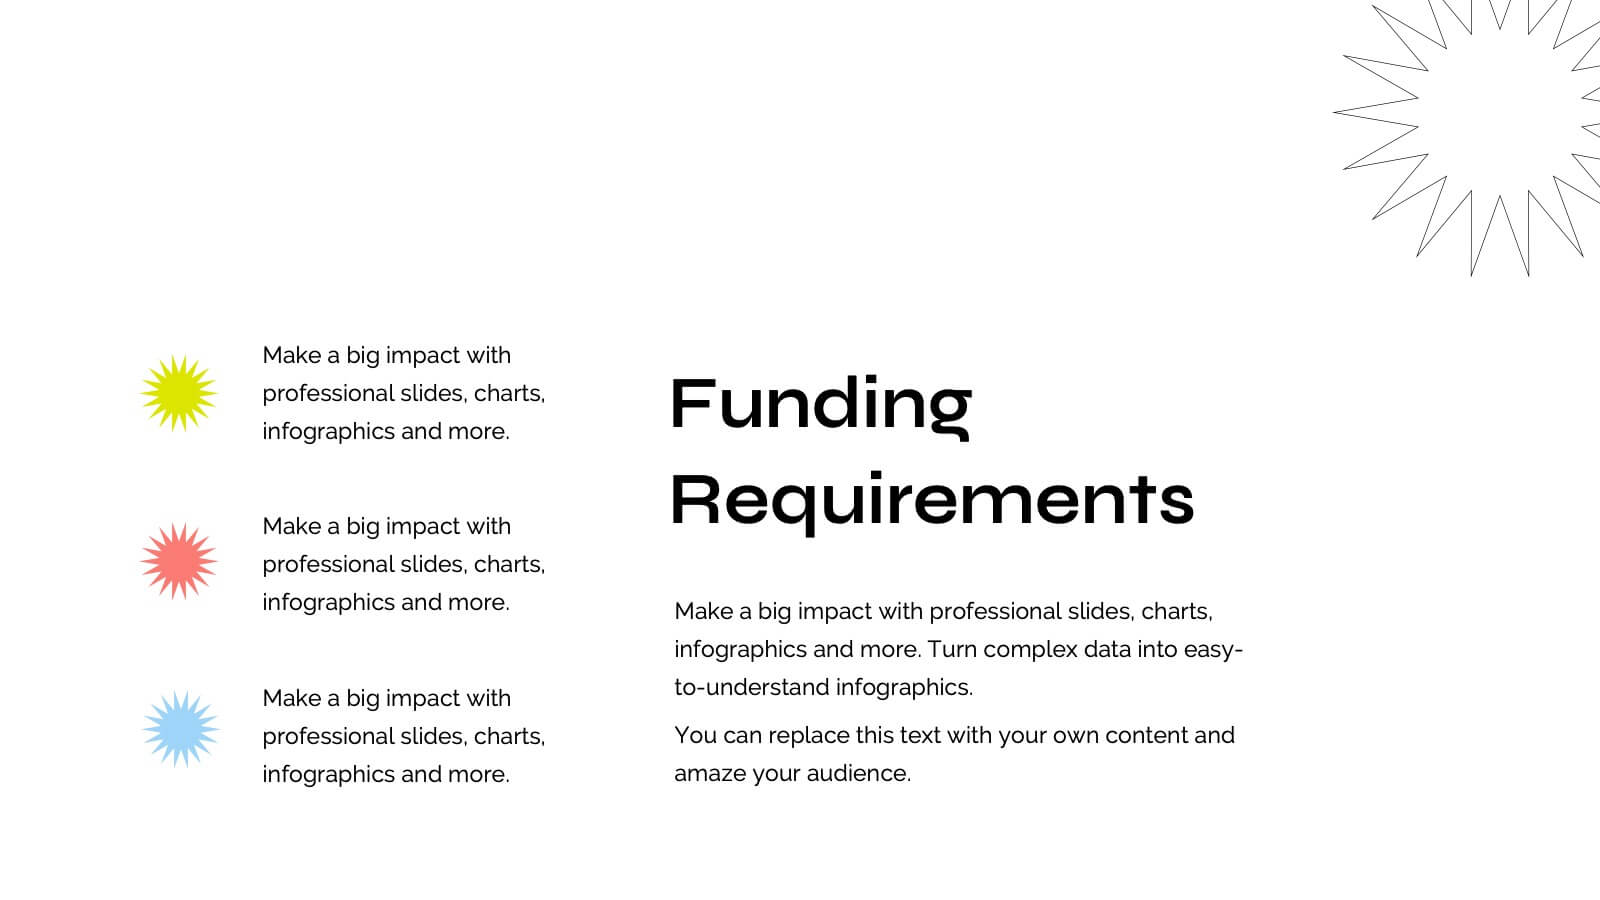
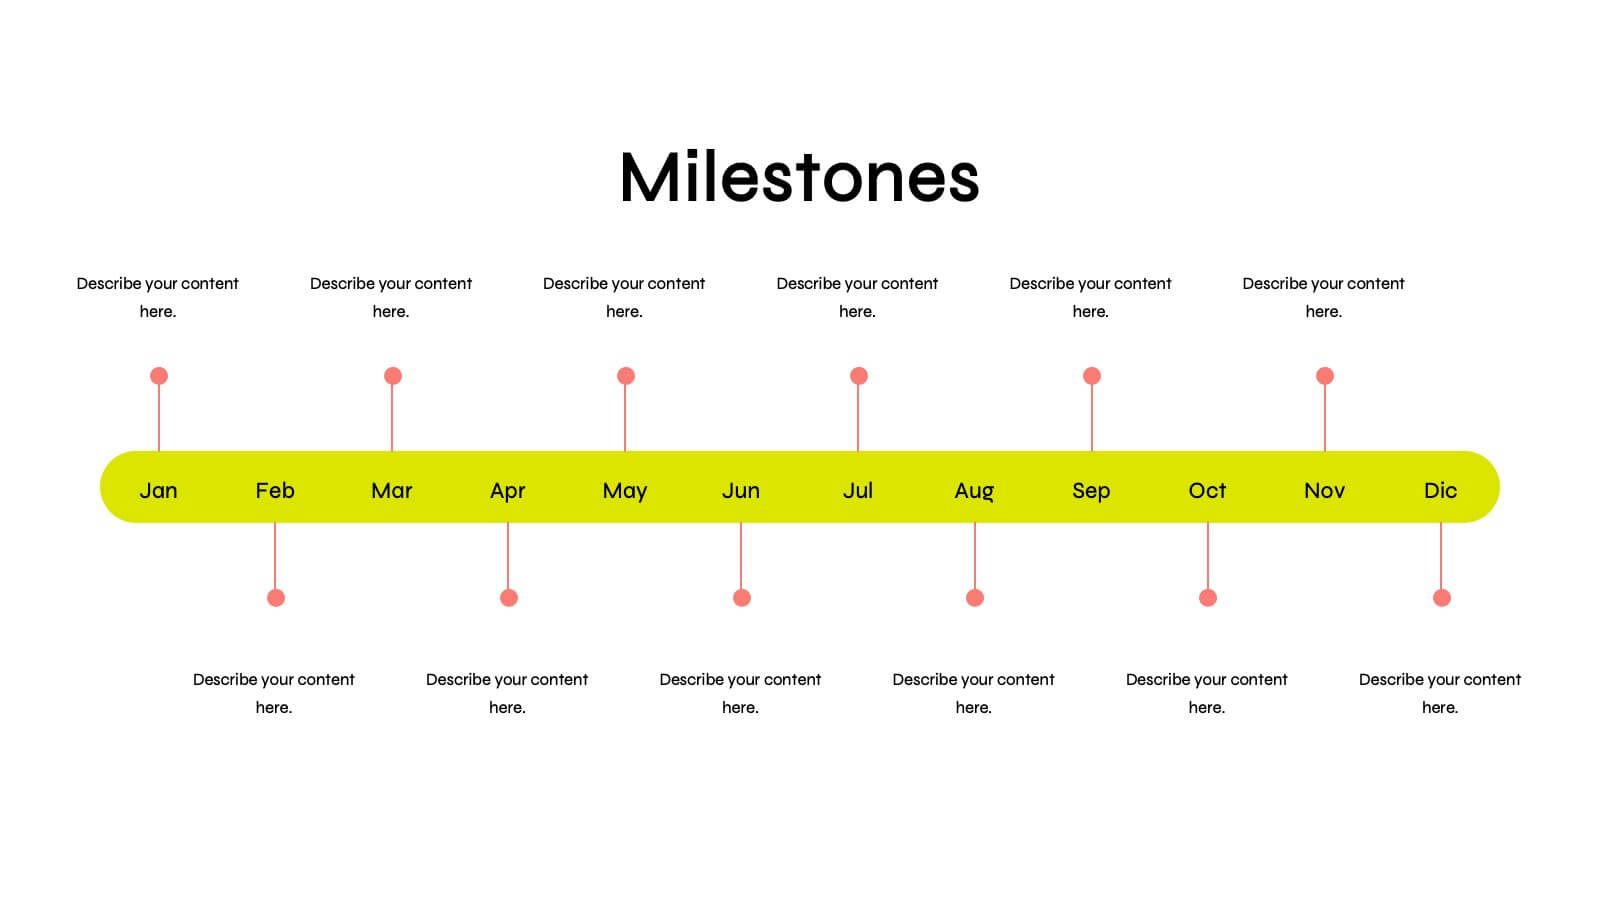
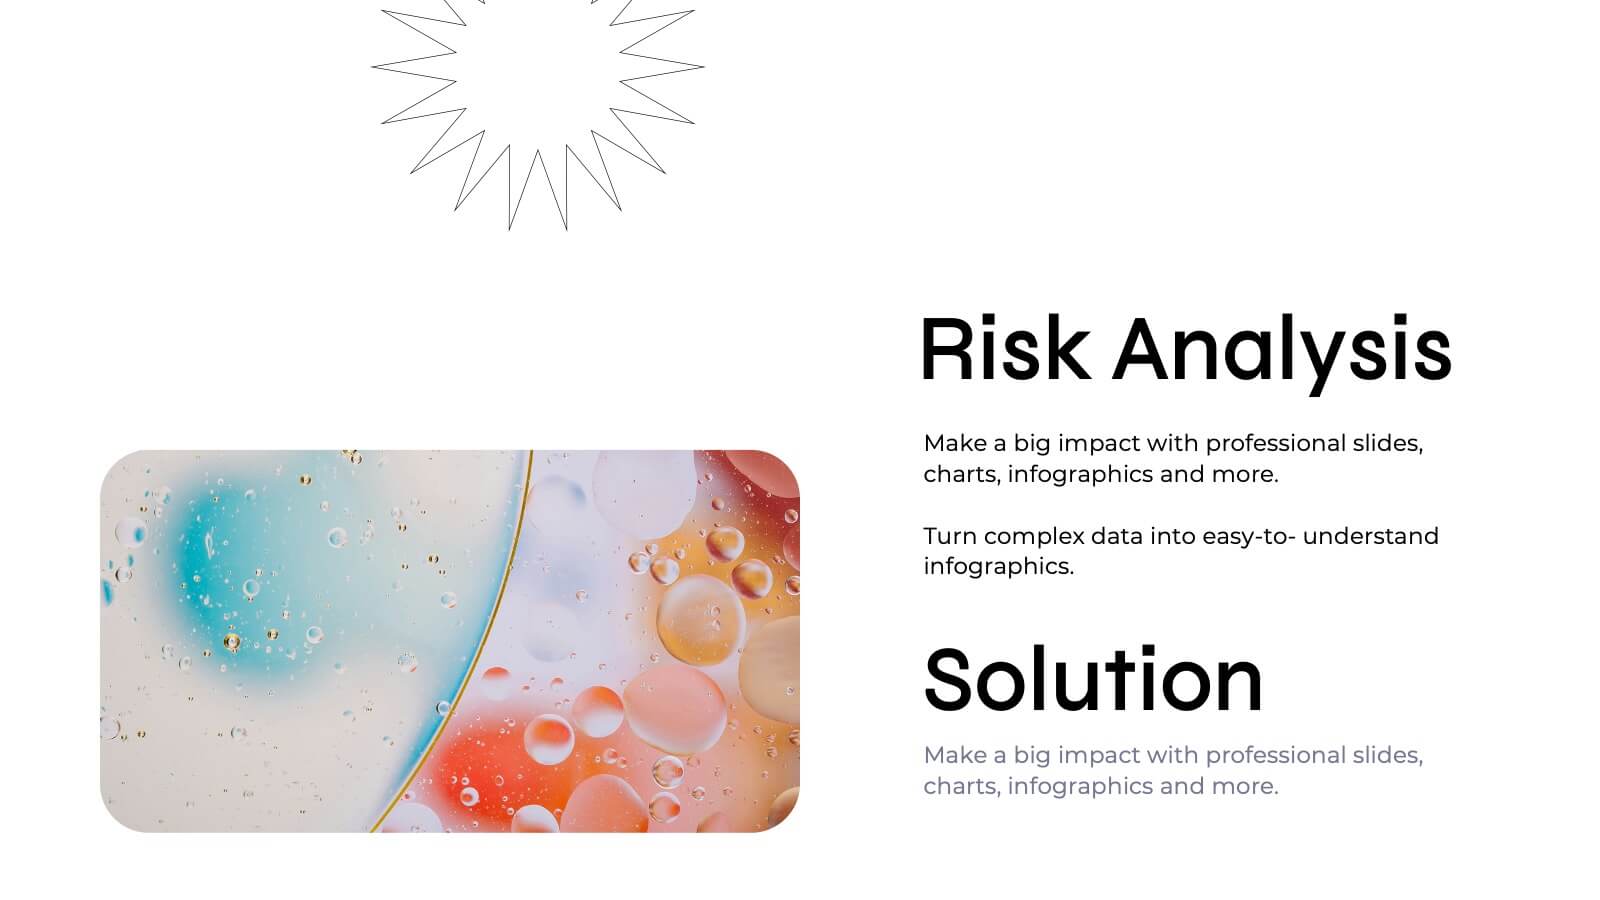
Quirinus Investor Pitch Presentation
Ready to impress investors and stakeholders? This sleek and modern pitch deck template covers all the essentials, from problem statements and market opportunities to revenue models and growth projections. Each slide is designed to convey clear and compelling information for maximum impact. Fully compatible with PowerPoint, Keynote, and Google Slides, making it the perfect tool for your next product launch!


6 diapositivas
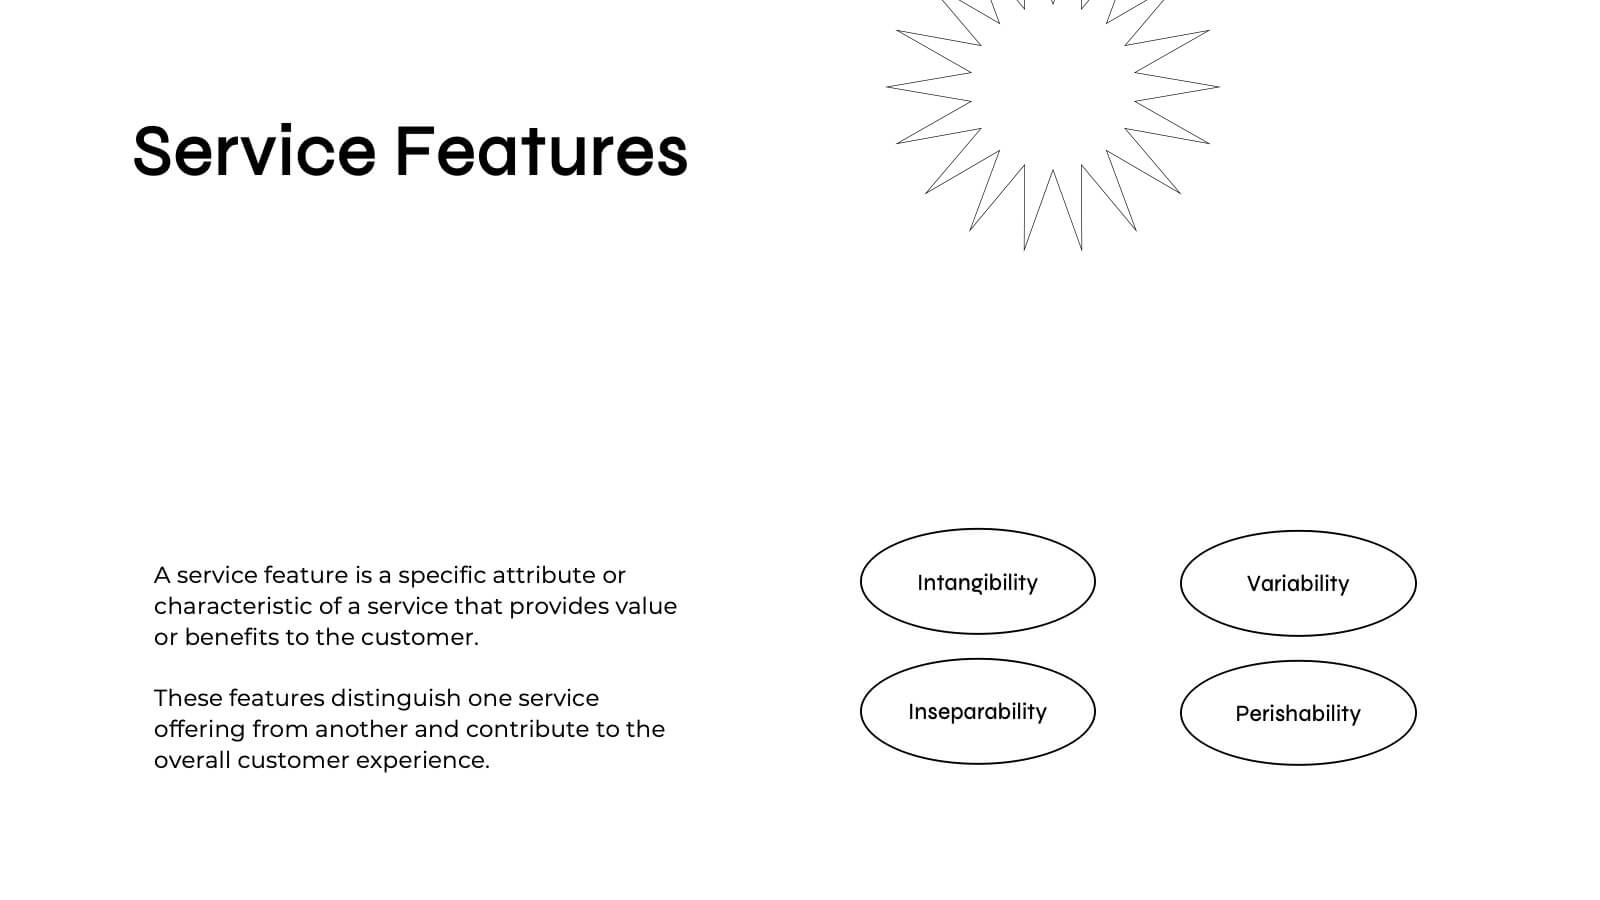
Patient Care & Treatment Presentation
Highlight the pillars of patient care with this modern, block-style layout. Each icon-embedded cube represents a different treatment or healthcare process, perfect for outlining procedures, services, or stages of medical support. Fully editable in PowerPoint, Keynote, and Google Slides—customize colors, icons, and labels with ease to suit your medical presentation needs.


7 diapositivas
Project Management Infographic Presentation Template
Project management is the process of leading a team of people to plan, organize, and complete a project within a specific timeframe and budget. It involves defining project goals, determining tasks and responsibilities, and tracking progress to ensure the project is completed on time and within budget. This template works with Powerpoint, keynote, and google slides, so you can use it on any device. Use this template for effective project management to ensure that resources are used efficiently, risks are minimized, and stakeholders are satisfied with the outcome of the project.


5 diapositivas
Hidden Layers Iceberg Presentation
Reveal what lies beneath the surface with this Hidden Layers Iceberg Presentation. Ideal for explaining visible outcomes versus underlying causes, it’s perfect for business, psychology, or education topics. Clearly segmented layers with labeled callouts enhance clarity. Fully customizable in PowerPoint, Keynote, and Google Slides for effortless professional use.


5 diapositivas
Project Risk Management Framework Presentation
Visualize challenges before they arise with this dynamic framework designed to map, assess, and mitigate project risks efficiently. Its circular layout highlights every critical stage, helping you communicate strategies clearly and professionally. Fully editable and compatible with PowerPoint, Keynote, and Google Slides for effortless customization and presentation flexibility.


8 diapositivas
Training and Development Onboarding Presentation
Streamline the training and development process for new hires with a structured onboarding funnel. This Training and Development Onboarding template provides a clear, step-by-step visualization of how employees progress through the learning process. Perfect for HR managers, trainers, and corporate educators. Fully editable and compatible with PowerPoint, Keynote, and Google Slides for easy customization.


7 diapositivas
Home Buyer Checklist Infographic
Step into your dream home with confidence using our Home Buyer Checklist Infographic Template. This visually engaging guide is meticulously designed to streamline the home-buying process, making it transparent and manageable for first-time buyers and seasoned investors alike. This template provides a comprehensive checklist that covers every important aspect of home buying, from budgeting and financing to inspecting and closing. Its intuitive layout and vibrant design elements make complex tasks approachable and easy to understand, ensuring you don’t miss a beat on your journey to homeownership. Tailor each slide to your specific needs by customizing colors, text, and graphics to reflect your personal style or brand identity. Ideal for real estate agents, mortgage advisors, and educational workshops, this template empowers users to navigate the maze of real estate transactions with ease and assurance.


5 diapositivas
Online Video Games Infographics
Dive into the digital realm with our online video games infographics template, tailored in striking shades of purple, blue, pink, and black that echo the electric ambiance of the gaming world. This dynamic ensemble, perfect for game developers, and gaming communities, brings to life the universe of online gaming. Compatible with Powerpoint, Keynote, and Google Slides. It features creative graphics and gaming icons, capturing everything from player statistics to game mechanics. Whether you're spotlighting trends or unveiling a revolutionary game, this template levels up your presentation, engaging your audience right from the start screen.


21 diapositivas
Nucleus Project Timeline Presentation
Plan with precision using this clean and modern Project Timeline Presentation Template. Highlight key phases, milestones, and deliverables with visually organized sections such as Project Overview, Objectives, Budget Breakdown, Resource Allocation, and Risk Management. Perfect for presenting timelines, evaluation criteria, and next steps to stakeholders. Fully customizable and compatible with PowerPoint, Keynote, and Google Slides.


22 diapositivas
Nimbus Project Milestones Report Presentation
This project plan template offers a modern, vibrant design that clearly outlines key project components, including problem statements, objectives, deliverables, timelines, and risk management. It’s perfect for teams looking to present a comprehensive project overview. Compatible with PowerPoint, Keynote, and Google Slides for impactful presentations with a polished look!


6 diapositivas
Strategic Task and To-Do List Slide Presentation
Keep your team aligned and on track with the Strategic Task and To-Do List Slide Presentation. This layout is ideal for showcasing action items, project priorities, and status updates using a visual notepad style. Color-coded sections and checkmark indicators make it easy to communicate task progress. Fully customizable in PowerPoint, Keynote, and Google Slides.


20 diapositivas
Axisflare Artist Portfolio Presentation
Showcase your creative journey with this vibrant artist portfolio template, featuring sections for project highlights, philosophy, style, and client testimonials. Ideal for presenting your work and artistic approach, this template is compatible with PowerPoint, Keynote, and Google Slides for seamless presentation across various platforms.


6 diapositivas
Leadership Program Infographic
A leadership program is a structured and intentional learning experience designed to develop and enhance leadership skills and qualities in individuals. This infographic template aims to provide a concise overview of the program's objectives, target audience, curriculum, and expected outcomes. This template includes icons, graphics, and color schemes that align with the organization's branding and make the infographic visually appealing. This infographic serves as an effective marketing tool to attract potential participants, showcase the value of the program, and communicate the positive outcomes of joining the leadership development journey.


4 diapositivas
Circular Strategy Model Presentation
Turn your ideas into a story that flows effortlessly with this clean and modern presentation design. Perfect for visualizing continuous improvement, collaboration strategies, or organizational frameworks, it helps you present key points in a clear circular format. Fully compatible with PowerPoint, Keynote, and Google Slides for easy customization.