


Características


¿Tienes alguna pregunta?
Recomendar


7 diapositivas
Skills Gap Analysis Tool Infographic
Optimize workforce potential with our Skills Gap Analysis Tool Infographic, designed for HR professionals, team leaders, and organizational development experts. This infographic provides a visual representation of the skills present within a team and identifies areas requiring development. Our infographic lays out a systematic approach to assessing competency levels across various skill sets, highlighting strengths and gaps in your team's abilities. It includes segments for rating proficiency, mapping skill distribution, and planning for training or recruitment to bridge any gaps. With this tool, you can create a clear and actionable skills inventory that supports strategic workforce planning and personal development. This SEO-optimized infographic is crafted to guide you in aligning your team's skills with organizational goals. Leverage this infographic to conduct comprehensive skills gap analyses, ensuring your team has the capabilities to meet current and future challenges effectively.


22 diapositivas
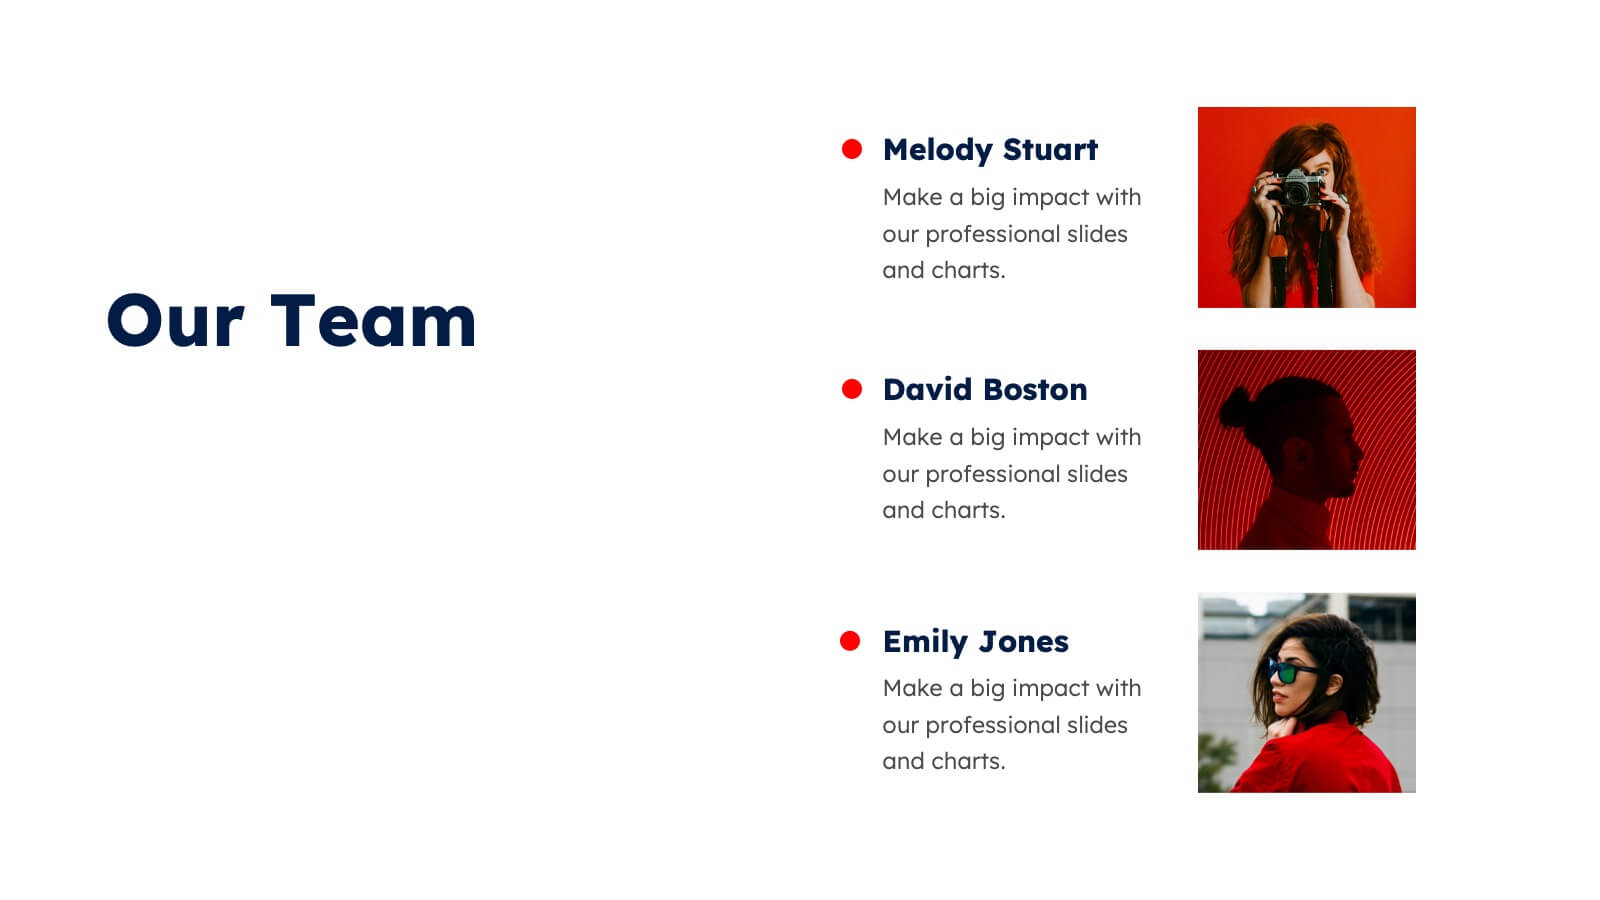
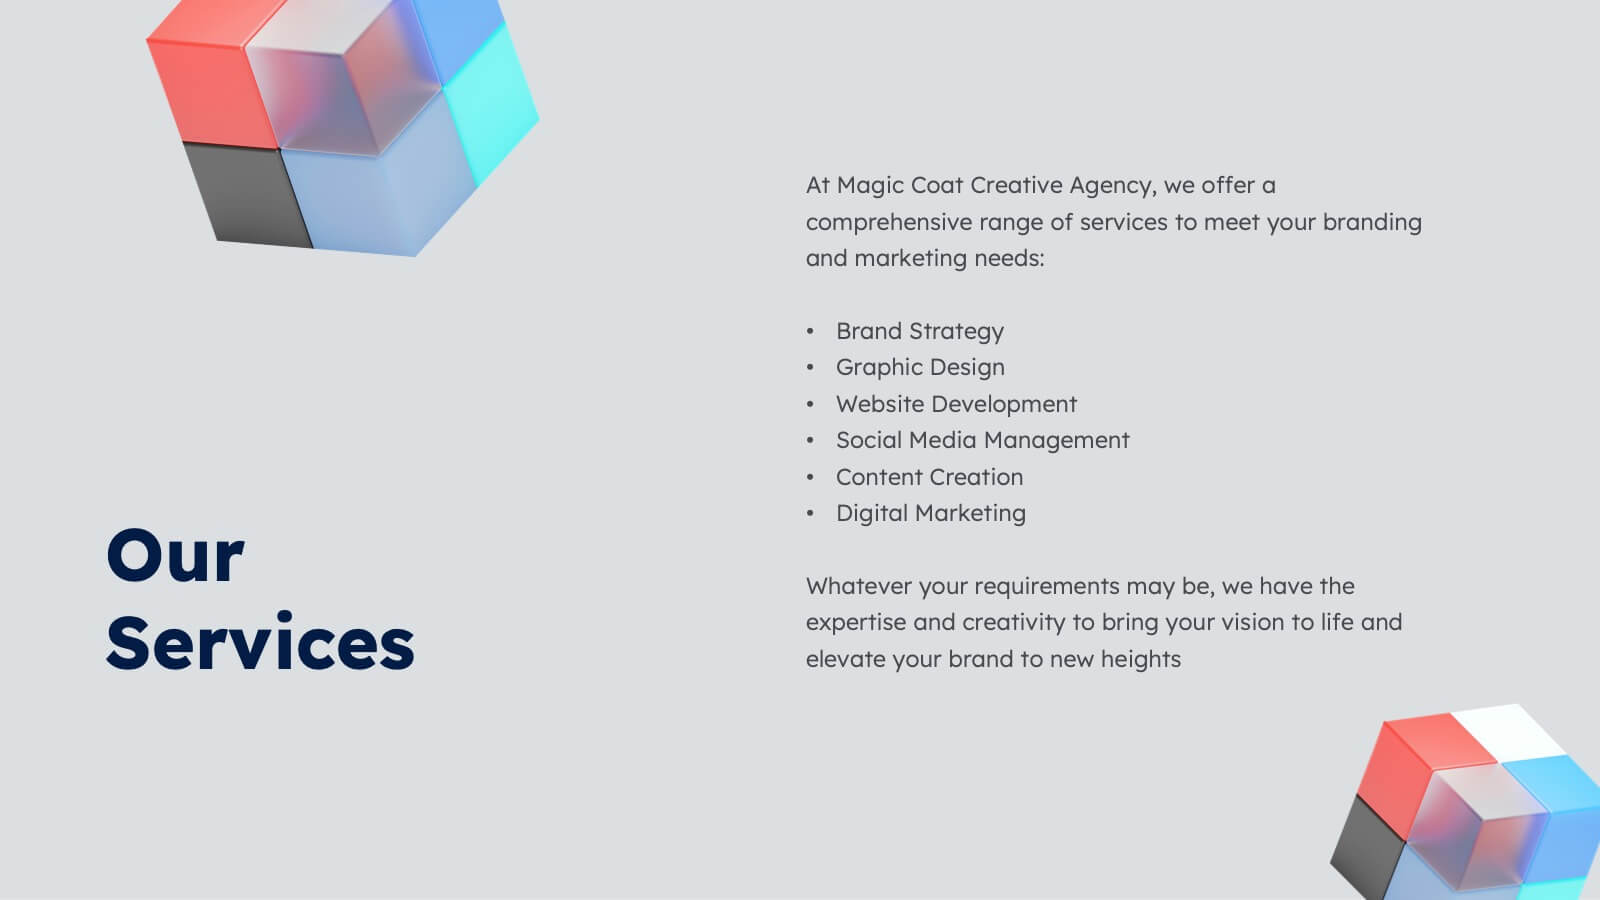
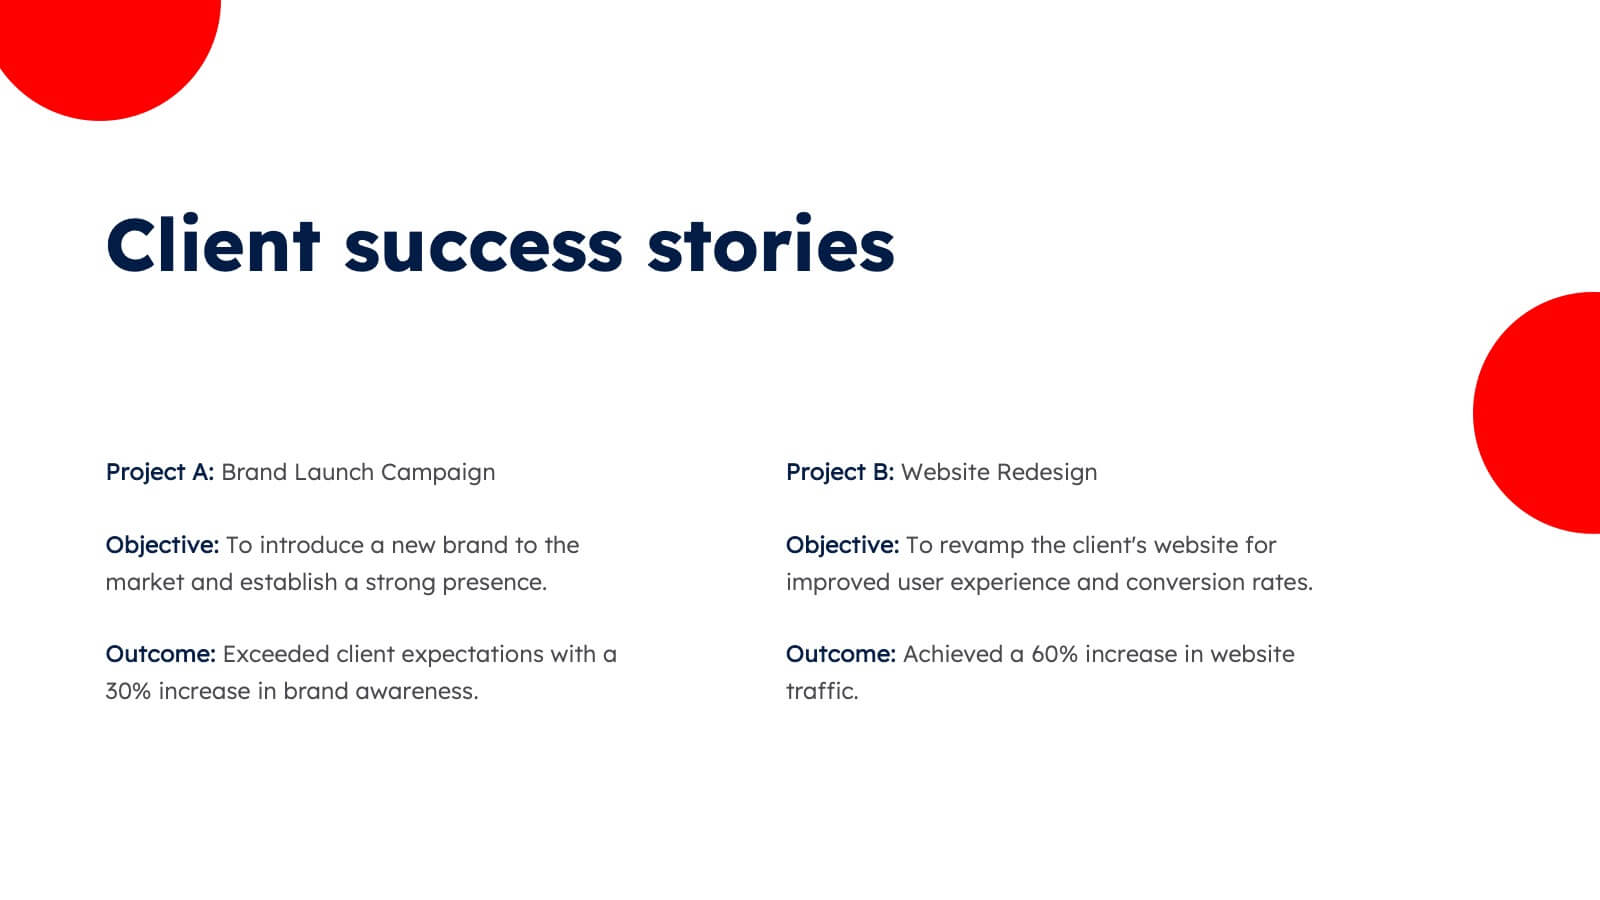
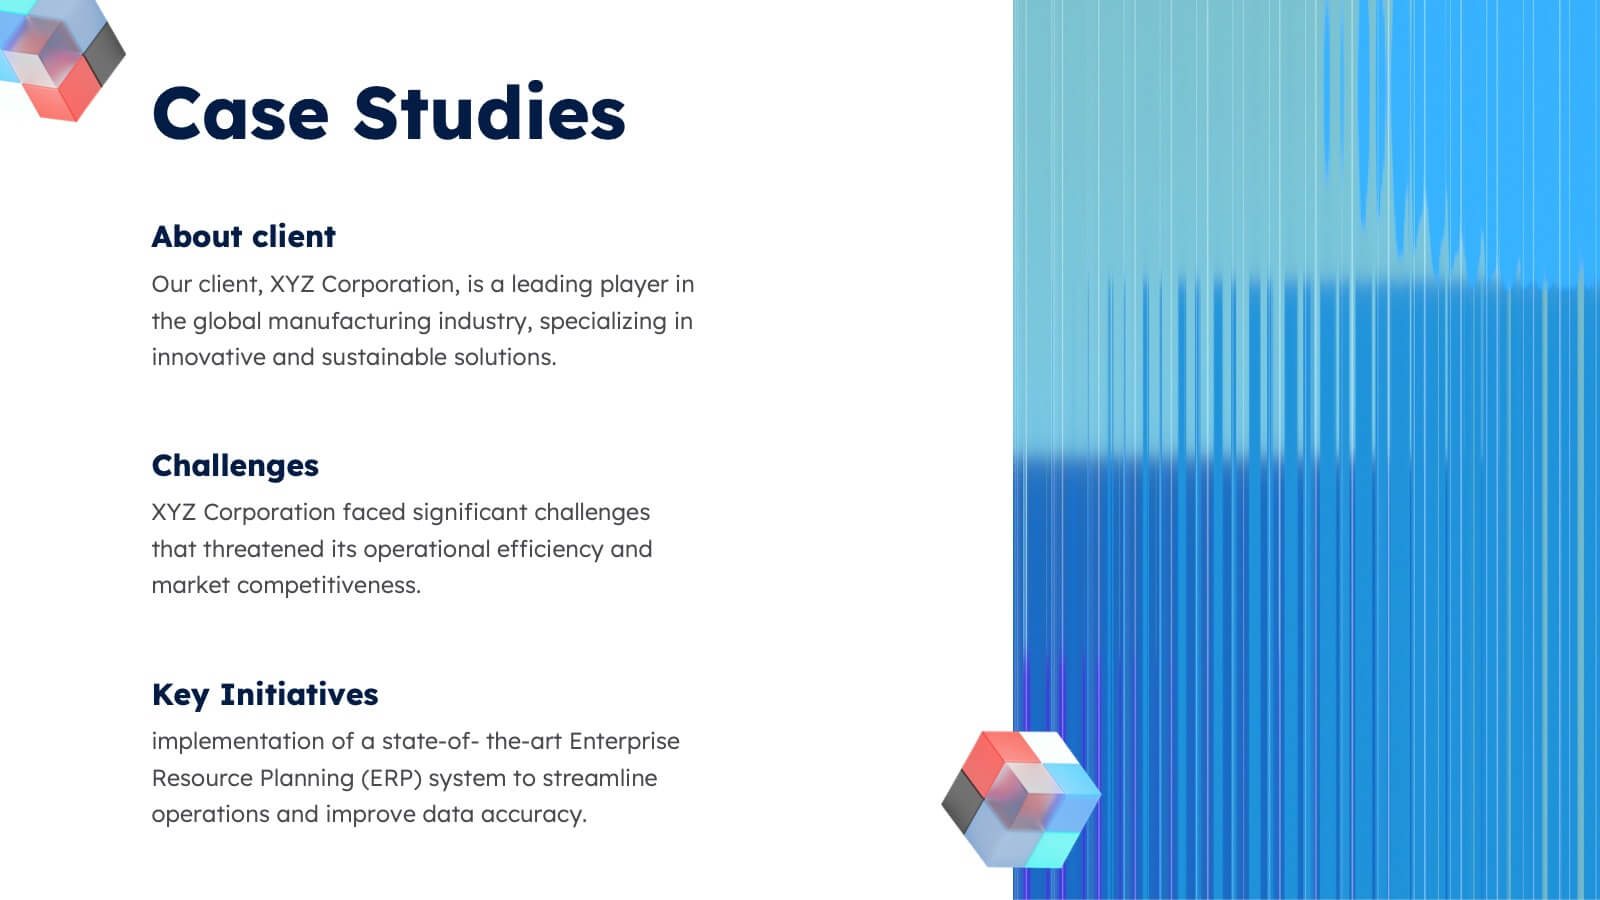
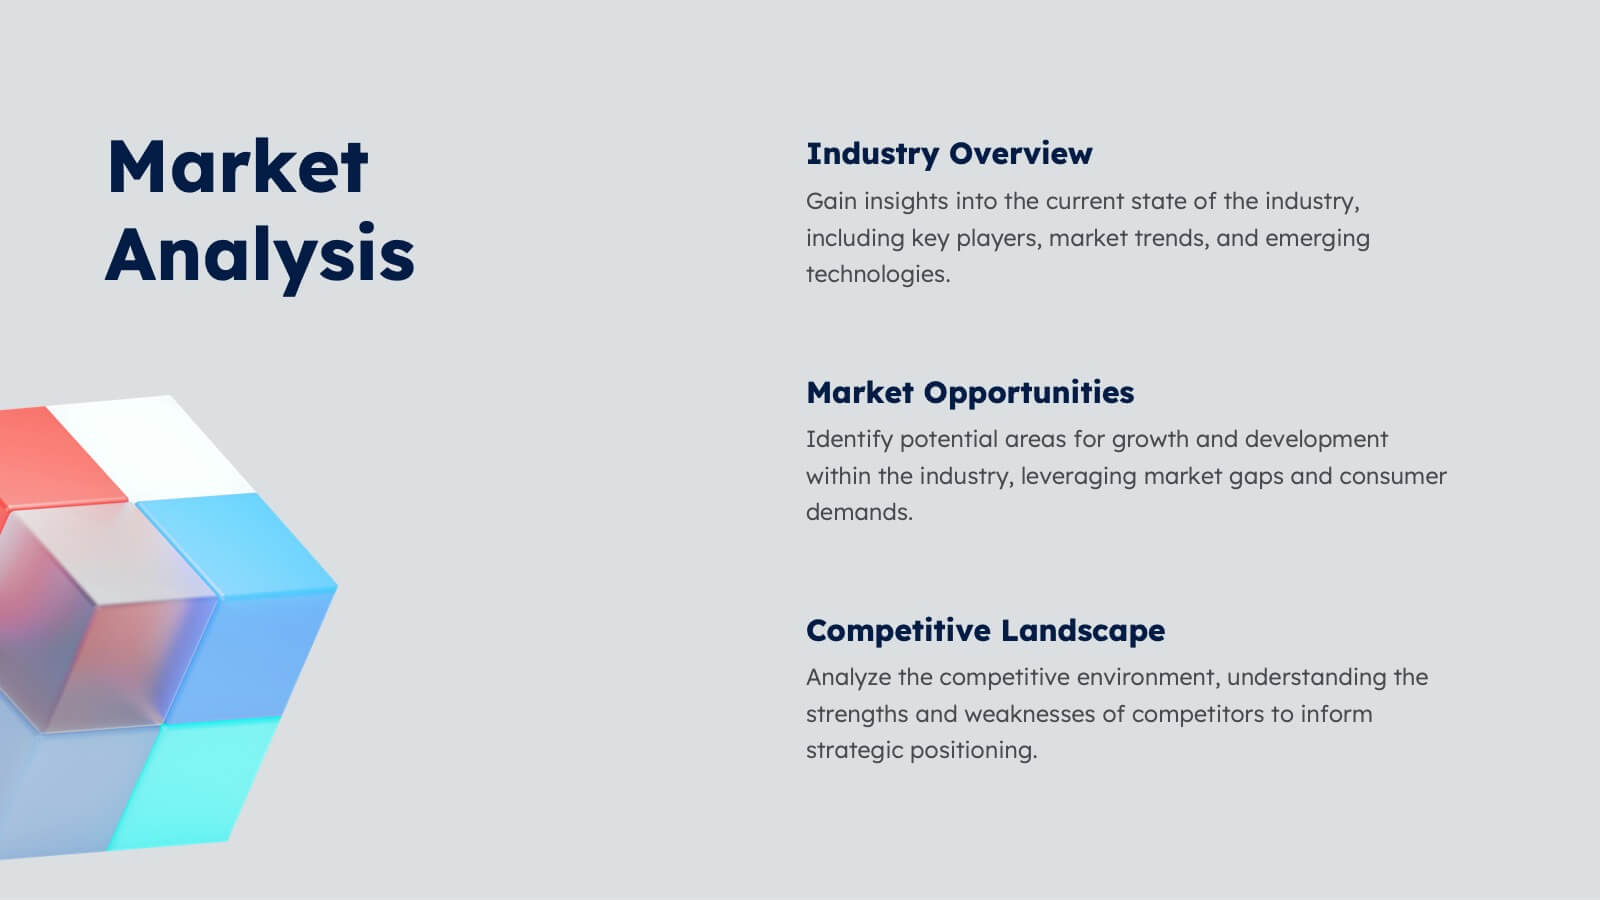
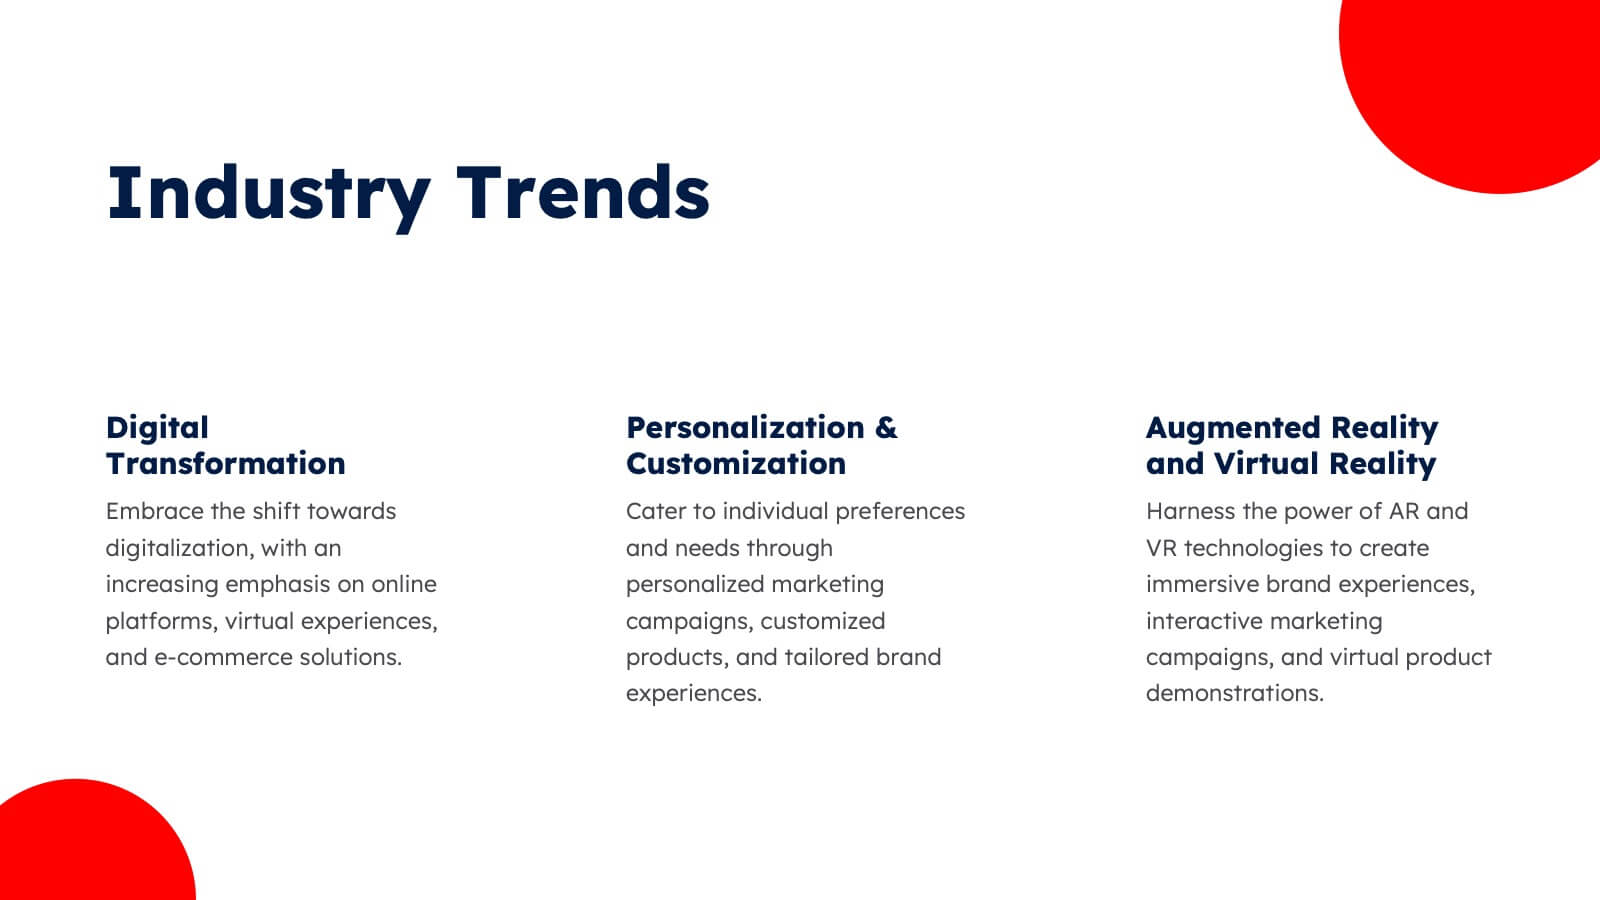
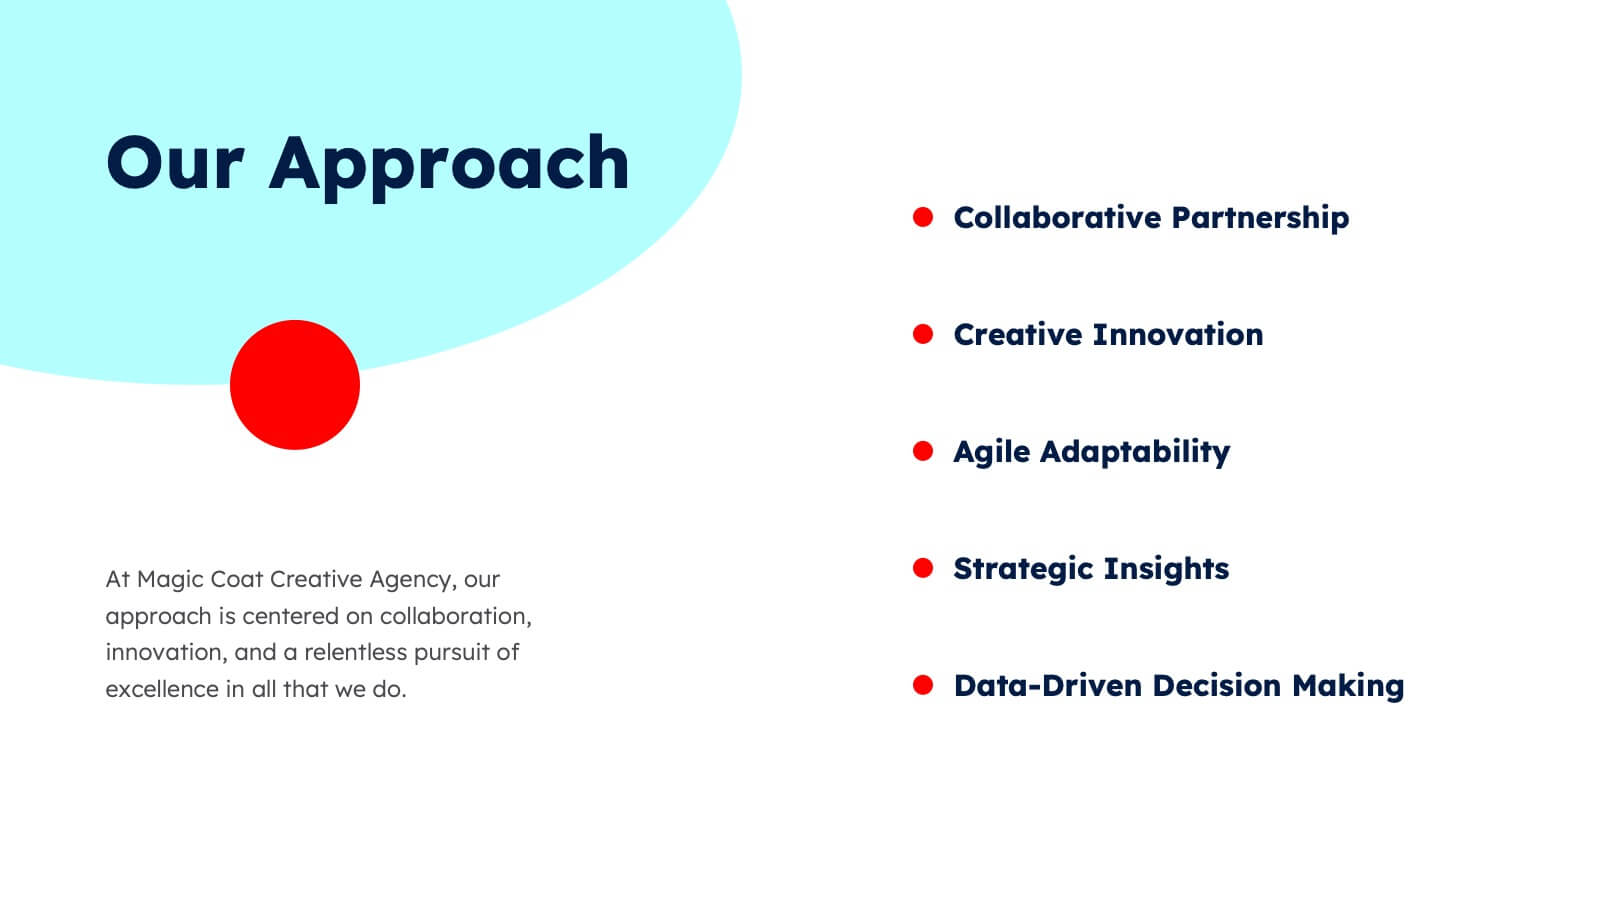
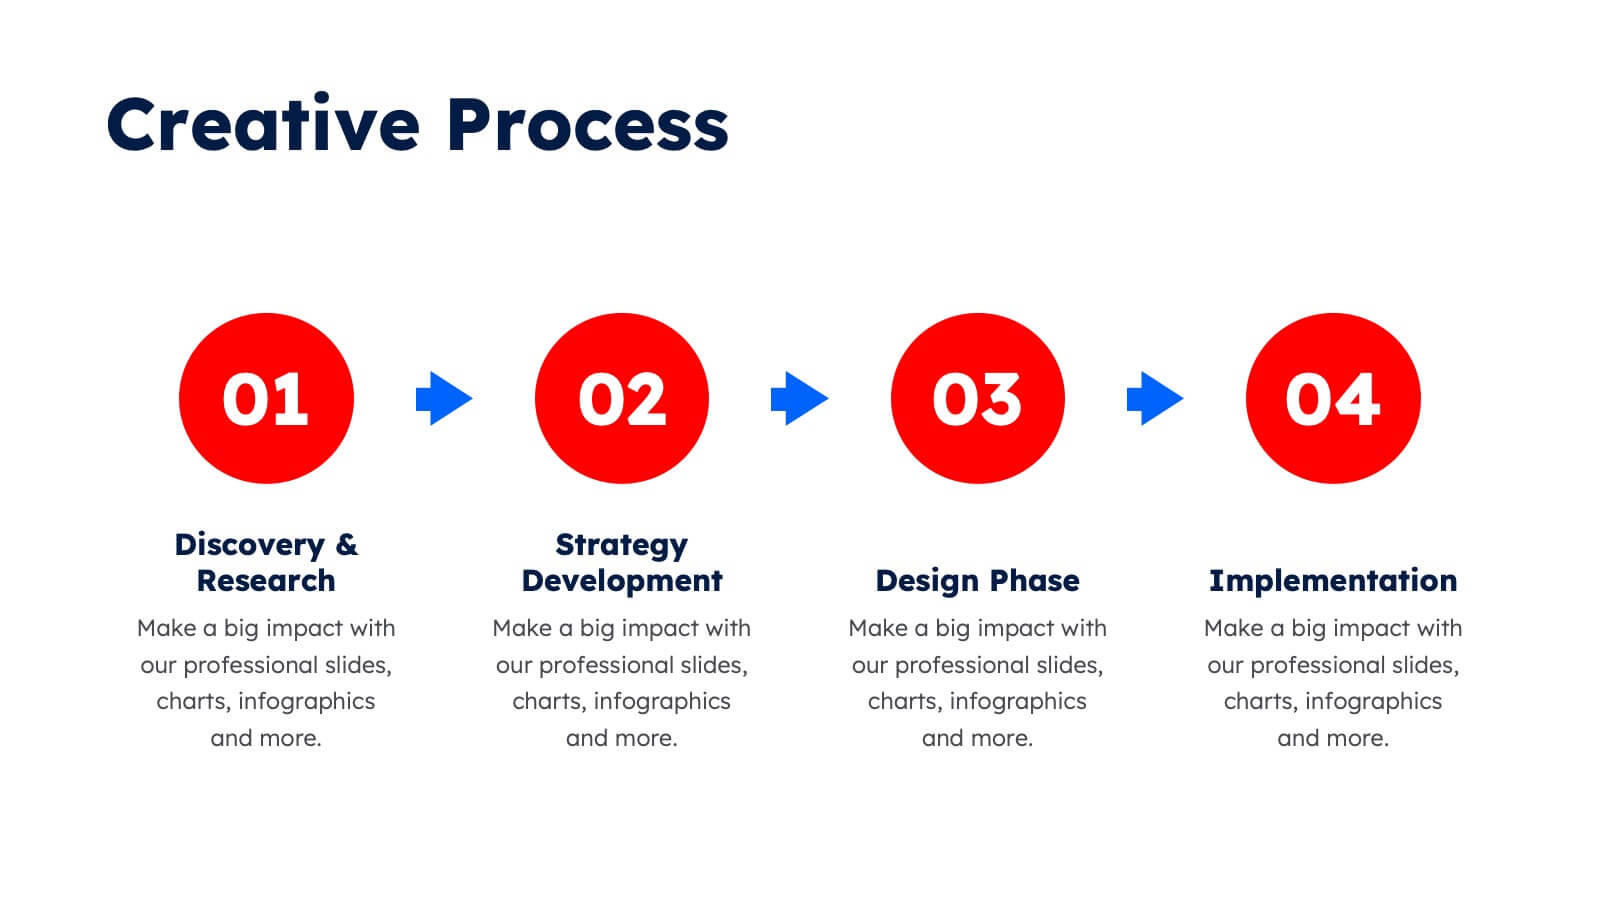
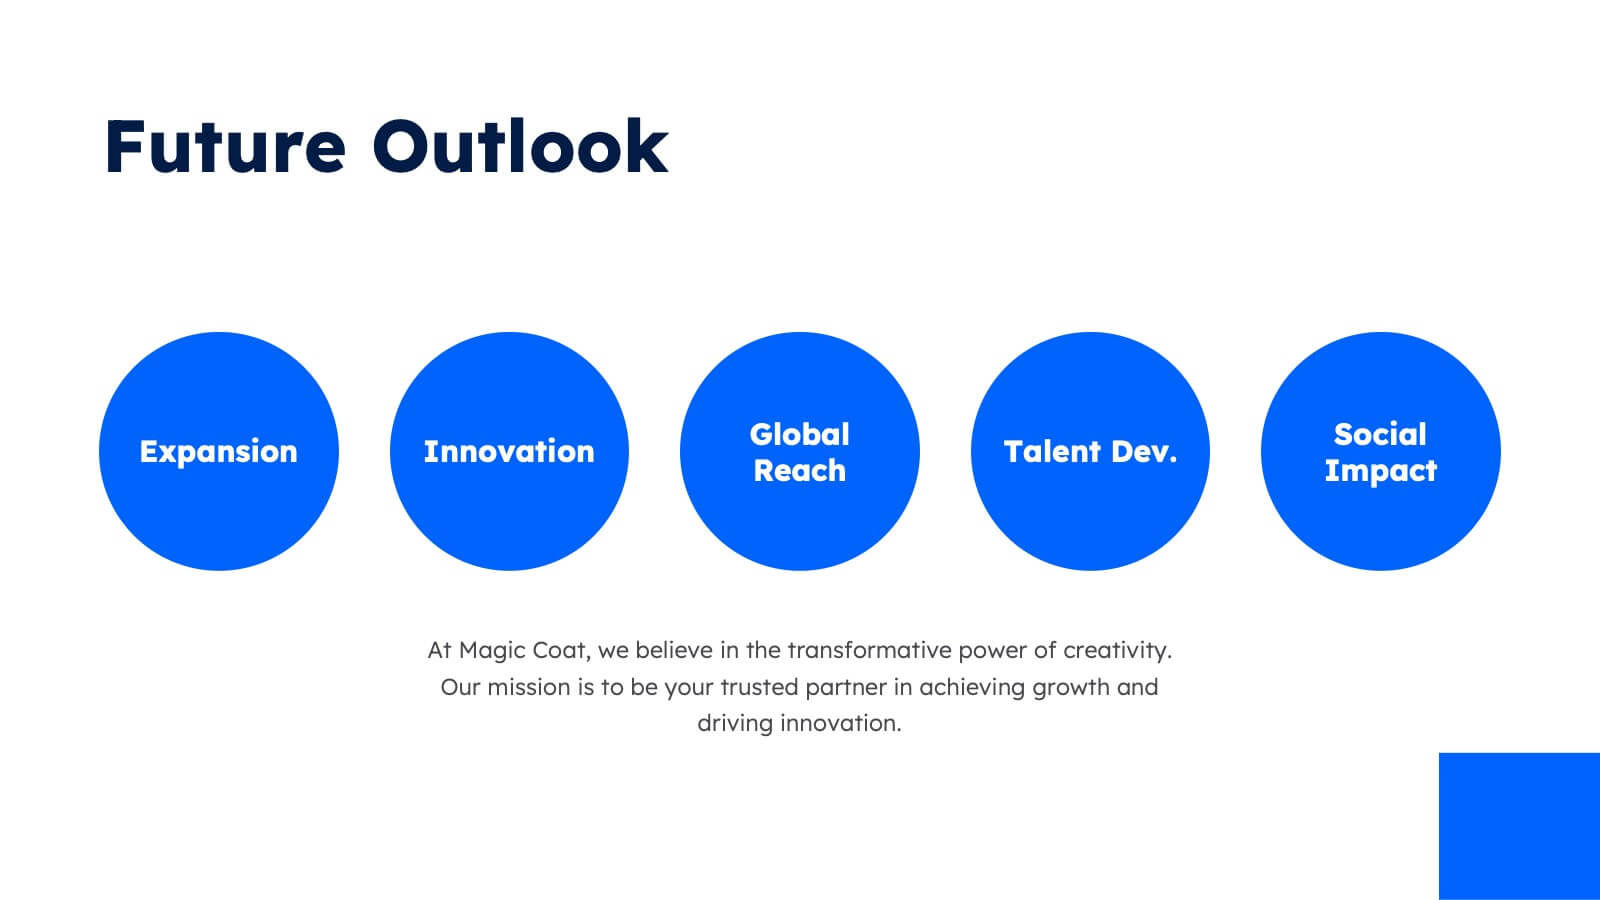
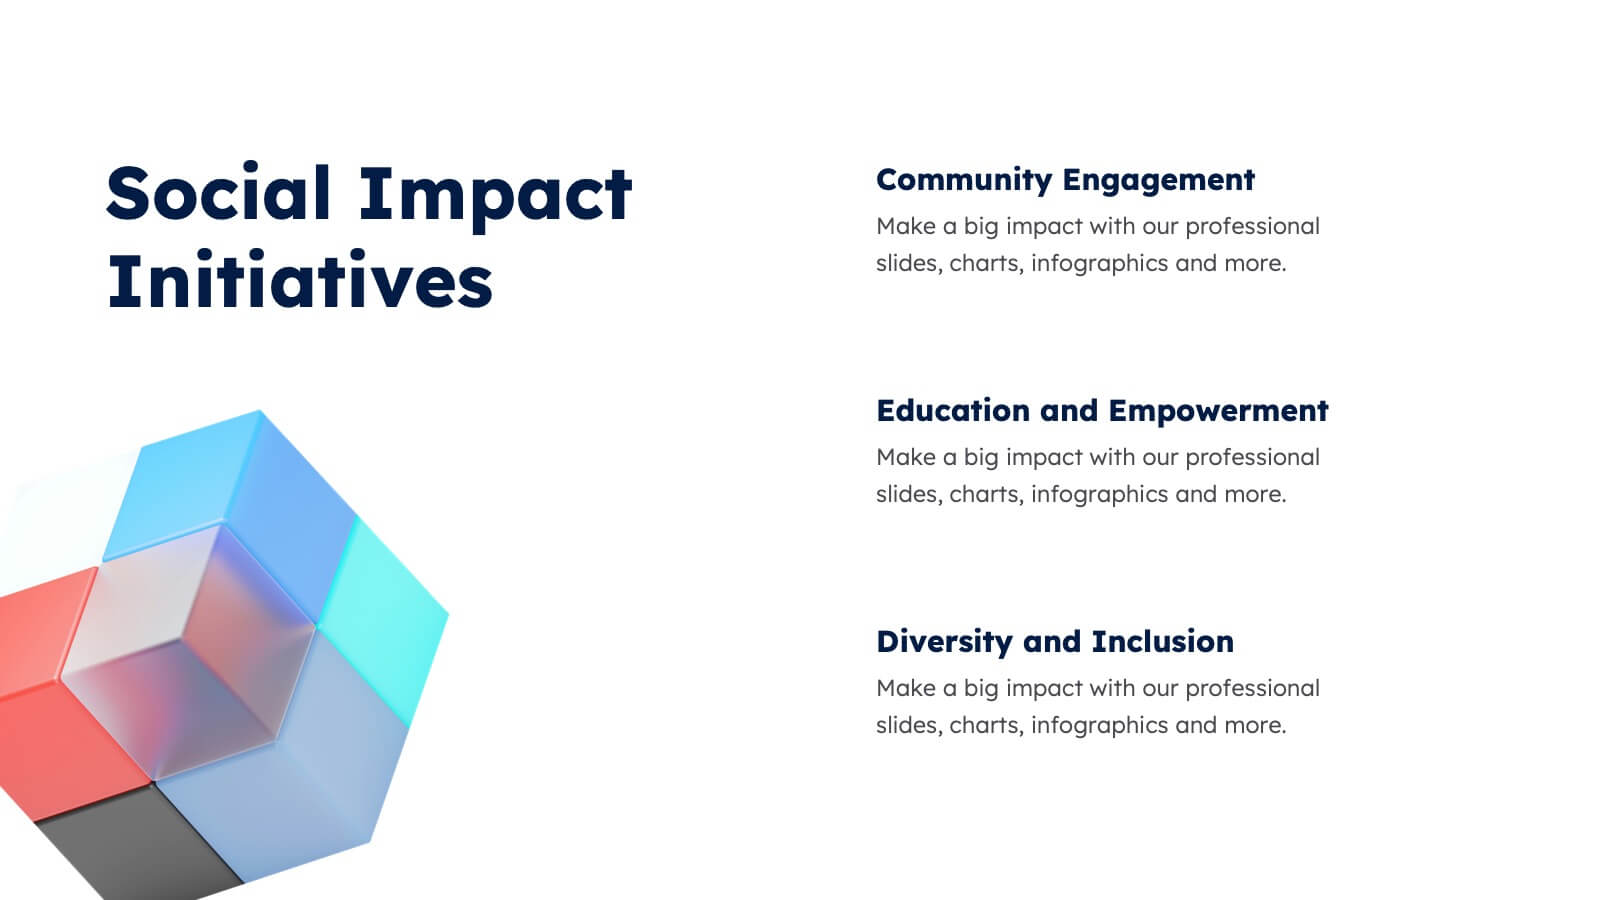
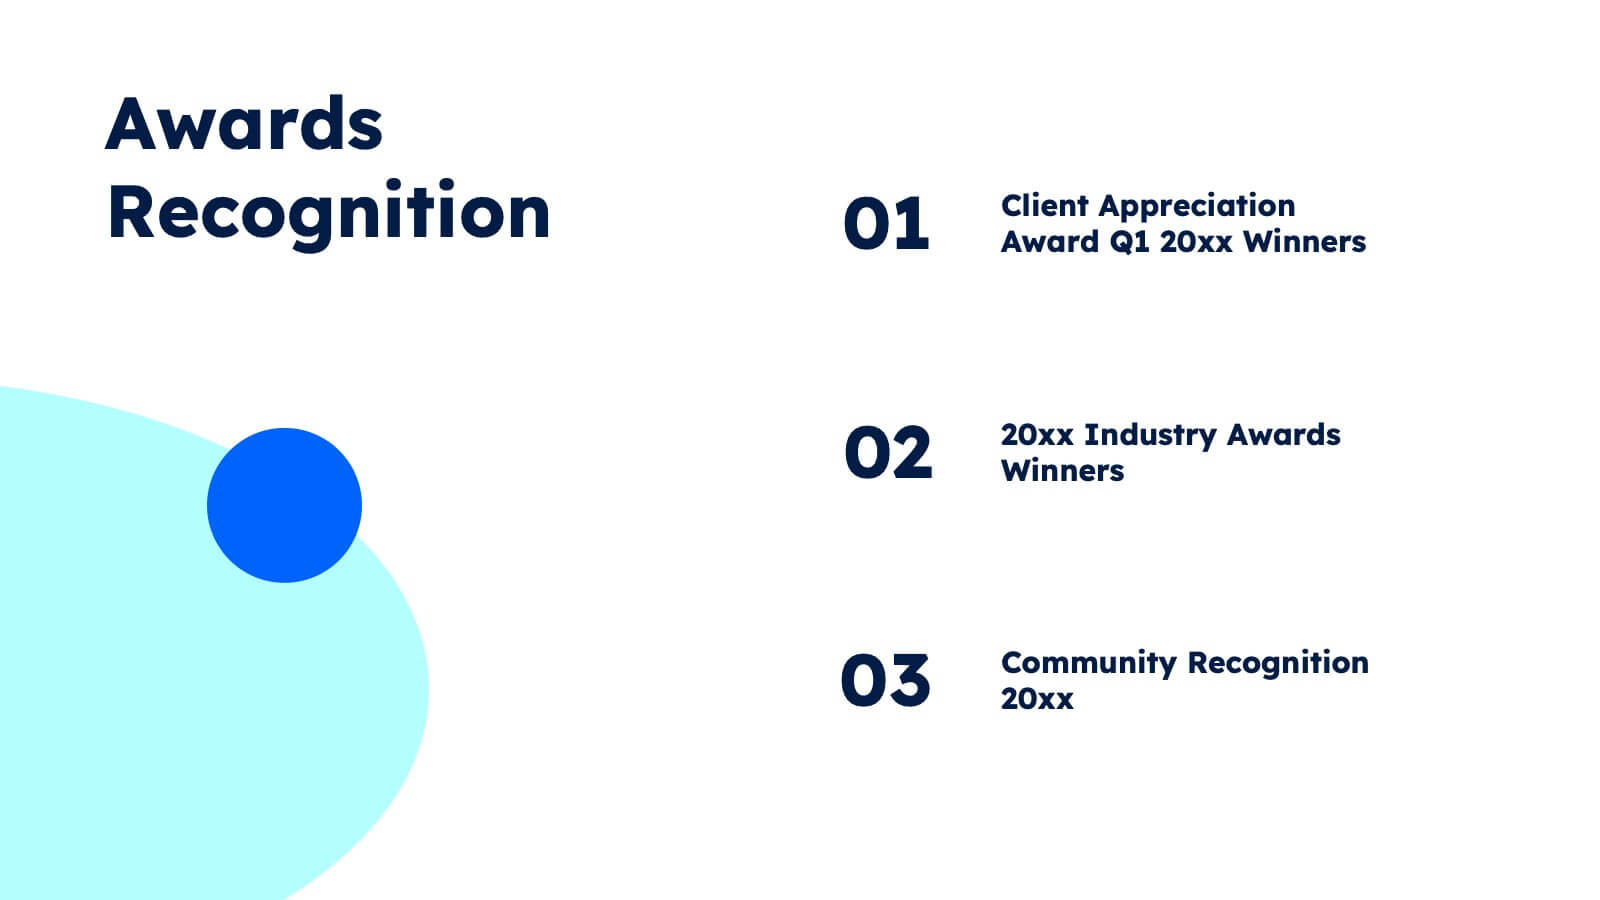
Aura Agency Portfolio Presentation
Showcase your agency's brilliance with this vibrant portfolio presentation template! Ideal for highlighting your mission, vision, case studies, and market analysis, it brings your achievements to life with colorful, engaging slides. Impress clients and partners with a well-structured, visually appealing narrative. Compatible with PowerPoint, Keynote, and Google Slides for easy use on any platform.


5 diapositivas
Water Problems Infographics
Water Problems refer to the various issues that arise due to the scarcity, pollution, or mismanagement of water resources. These vertical infographics are perfect for addressing various issues related to water management and conservation. They are effective tools for raising awareness about water-related issues and promoting sustainable water management practices. This template is completely customizable and includes various icons and images related to water such as water droplets, faucets, and ocean waves. The color scheme is predominantly blue, signifying the importance of water conservation and preservation.


7 diapositivas
College Schedule Infographic Presentation
A College Schedule infographic is a visual representation of a typical college schedule, which includes classes, extracurricular activities, and other commitments. This template can be used to help students plan and organize their time effectively, ensuring that they can balance their academic and personal responsibilities. This infographic includes weekly timed schedules in table and chart formats to present the schedules in a clear and easy to understand way. This template is a helpful tool for college students looking to manage their time effectively and balance their various tasks.


7 diapositivas
Operational Risk Management Infographic
Dive into the methodical domain of risk management with our sleek risk management infographic. Cloaked in varying blue tones, our template embodies the serenity and stability that effective risk management brings to operations. Enhanced with precise infographics, clear icons, and relevant image placeholders, it transforms complex risk analysis into easily comprehensible visual insights. Flawlessly crafted for Powerpoint, Keynote, or Google Slides. A pivotal tool for business strategists, operations managers, financial analysts, or any organization aiming to fortify its operational resilience. Strategize with clarity; let every slide be a shield against potential pitfalls.


22 diapositivas
Leviathan Sales Pitch Deck Presentation
This sales pitch deck template is designed to captivate your audience with a sleek, modern design. It features key slides like problem statement, solution, business model, and financials, ensuring a comprehensive presentation. Compatible with PowerPoint, Keynote, and Google Slides, it's perfect for showcasing your business's unique value proposition and growth strategy.


7 diapositivas
Digital Marketing Course Infographic
Dive into the dynamic realm of digital marketing with our Digital Marketing Course Infographic. Bathed in a clean white canvas, accentuated with the depth of blue, the optimism of yellow, and the innovation of green, our template captures the multifaceted nature of online marketing. Equipped with sharp infographics, relevant icons, and customizable image placeholders, it provides a comprehensive overview of digital marketing modules and strategies. Perfectly tailored for Powerpoint, Keynote, or Google Slides. An invaluable resource for marketing trainers, course instructors, students, or any organization aiming to upskill in the digital domain.


21 diapositivas
Ember Echo Graphic Design Project Plan Presentation
The Ember Graphic Design Project Plan template is the perfect canvas for your creative journey! Kickstart your project with a sleek and professional introduction that sets the tone for your design vision. This template is designed to guide you through every step of the design process, from the initial brief to the final presentation. Highlight your target audience, concept development, and design elements with beautifully crafted slides that capture the essence of your project. Dive into the specifics with dedicated sections for brand identity components, textures, and the design process itself, ensuring that every detail is covered. The template also includes mood boards, prototypes, and design assets, making it easy to showcase your work in progress. With feedback and testing slides, you can iterate and refine your designs before presenting the final product. This template is fully compatible with PowerPoint, Keynote, and Google Slides, making it versatile and easy to use for any creative project.


6 diapositivas
Domestic Statistics Infographic
Domestic statistics typically refers to numerical data and information related to a specific country's internal affairs, activities, and demographics. This infographics can be an effective way to present important data and trends related to a specific country or region. This template is designed with a balance between design aesthetics and data accuracy. By presenting the information in a visually engaging manner, you can effectively communicate key insights to your target audience. Compatible with Powerpoint, Keynote, and Google Slides. This ensures that your infographic is accessible by providing alternative text for images and using high-contrast colors.


5 diapositivas
Social Media Strategies Presentation
Bring your online vision to life with a clean, modern layout that makes planning campaigns feel effortless. This presentation helps you map out goals, content pillars, audience insights, and platform tactics with clarity and impact. Fully editable and compatible with PowerPoint, Keynote, and Google Slides.


26 diapositivas
Fundraising Event Presentation
Inspire generosity and support for your cause with our Fundraising Event presentation template, ideal for PowerPoint, Keynote, and Google Slides. This template is crafted with non-profit organizations, charity foundations, and event coordinators in mind, featuring a heartwarming design that encourages giving and communal effort. The slides are tailored to highlight the importance of philanthropy, with 'big image slides' to tell the stories of those you're helping, 'process infographics' to explain how donations are used, and 'chart slides' to show the impact of collected funds. The soothing color palette and thoughtful graphics create an atmosphere of hope and solidarity. Our Fundraising Event template is more than just a collection of slides; it's a powerful storytelling tool that can galvanize audiences into action. Download it now to create a moving presentation that not only shares the vision of your event but also rallies the community around your noble cause.


5 diapositivas
Operational Process Logic Map
Visualize how every function interconnects with the Operational Process Logic Map Presentation. This template uses a radial node structure to break down workflows, responsibilities, or systems into logical clusters, showing how different units or steps interact within an operational framework. Each node is color-coded and icon-marked for clarity, ideal for explaining process flows, department roles, or system dependencies. Fully editable in PowerPoint, Keynote, and Google Slides.


6 diapositivas
Business Network Diagram Presentation
Bring your digital ecosystem to life with this modern presentation design. Ideal for showcasing system connections, IT workflows, or organizational networks, it helps visualize how key components interact seamlessly. Clean, structured, and fully customizable—compatible with PowerPoint, Keynote, and Google Slides for a professional and cohesive presentation every time.


5 diapositivas
Creative Alphabet Display Template
Make your message memorable with the Creative Alphabet Display Template Presentation. This slide uses bold, interlocking letter shapes to showcase four key ideas in a linear, eye-catching format—perfect for step-by-step processes, value breakdowns, or themed concepts. Fully editable in PowerPoint, Keynote, and Google Slides.


5 diapositivas
Business and Personal Goal Planning Presentation
Align your vision with action using the Business and Personal Goal Planning slide. This clean, professional layout helps break down up to four key objectives using flag-themed visuals, customizable text blocks, and supportive icons. Perfect for comparing business goals with personal development targets in a single view. Fully editable in PowerPoint, Keynote, and Google Slides—ideal for team meetings, coaching sessions, or strategic planning.


7 diapositivas
Data Analysis Tools Infographic
The Data Analysis Tools Infographic provides a dynamic and intuitive way to represent data analytics and performance metrics visually. This template offers various graph styles, such as bar graphs, line charts, and human figures, to illustrate statistical data effectively. Whether it's market research, financial analysis, website analytics, or any other form of quantitative data, this infographic is designed to make data easily understandable at a glance. Compatible with popular presentation software like PowerPoint, Google Slides, and Keynote, it's an excellent tool for professionals who aim to communicate complex data in a simplified, engaging manner.


5 diapositivas
Online Advertising and SEO Marketing Presentation
Elevate your digital marketing strategy with this engaging infographic template! Designed for clarity, it simplifies online advertising and SEO concepts, covering key metrics, trends, and strategies. Perfect for teams, clients, or stakeholders, it’s fully customizable and compatible with PowerPoint, Keynote, and Google Slides for seamless presentations that captivate and inform.