


Características


¿Tienes alguna pregunta?
Recomendar


3 diapositivas
Transportation Services Workflow Presentation
Showcase your delivery process with clarity. This template tracks each transportation step—from port to truck to doorstep—with minimal, modern visuals and editable callouts. It’s perfect for workflow overviews, operations planning, or client onboarding. Use it in PowerPoint, Keynote, or Google Slides without losing style or structure.


5 diapositivas
Visual Gap Analysis Between Goals and Results Presentation
Hit the bullseye by clearly showing the gap between what was planned and what was achieved. This sleek, target-based presentation design helps visualize discrepancies between goals and results in a way that's easy to grasp and great for decision-making. Fully compatible with PowerPoint, Keynote, and Google Slides.


6 diapositivas
Business Challenges and Solutions Presentation
Address challenges with strategic solutions using this Business Challenges and Solutions template. Featuring a clear side-by-side layout, this design helps visualize business obstacles and their corresponding solutions for effective decision-making. Perfect for problem-solving discussions, strategy meetings, and brainstorming sessions, this template ensures your content remains structured and impactful. Fully customizable for PowerPoint, Keynote, and Google Slides.


5 diapositivas
Business Cycle and Wheel Diagram
Illustrate key stages, continuous workflows, or strategic frameworks with this circular business diagram. Ideal for visualizing four connected steps in a clean, modern style. Easily editable in PowerPoint, Keynote, and Google Slides for full customization.


5 diapositivas
Organ Structure Breakdown Slide Presentation
Bring your anatomy data to life with this clear and engaging organ breakdown slide. Designed to visually map out key organ functions or statistics, this layout makes complex info feel simple. Whether you're teaching biology or sharing medical research, it's editable and works with PowerPoint, Keynote, and Google Slides.


5 diapositivas
Infographic Business Charts Presentation
Bring your data to life with a bold, visual storytelling layout designed to make insights instantly clear and impossible to ignore. This presentation highlights key metrics using clean, modern business charts that simplify comparisons and trends for any audience. Fully compatible with PowerPoint, Keynote, and Google Slides.


6 diapositivas
Corporate Hierarchy Structure
Visualize your organization’s leadership and team structure with this clean, modern hierarchy chart. Ideal for corporate overviews, HR planning, or team introductions in company profiles and proposals. Fully editable in PowerPoint, Keynote, and Google Slides.


4 diapositivas
Healthcare Access and Preventive Care Presentation
Bring your health strategy to life with this engaging heart-themed infographic slide. Perfect for illustrating patient access points, wellness checkpoints, or preventive initiatives, each segment is cleanly organized with icons and text. Ideal for medical presentations, this template works seamlessly in PowerPoint, Keynote, and Google Slides for total flexibility.


5 diapositivas
Modern Design with Geometric Elements Presentation
Elevate your message with this clean, modern layout featuring four-leaf geometric icons and subtle color accents. Perfect for showcasing strategic concepts or business pillars in a stylish, easy-to-read format. Ideal for proposals, updates, or team presentations. Fully editable in PowerPoint, Google Slides, Keynote, and Canva. Professional and versatile.


6 diapositivas
Cloud Computing Infrastructure Overview Presentation
Break down complex systems with ease using the Cloud Computing Infrastructure Overview slide. This layout features a central cloud icon with multiple surrounding components, perfect for mapping out services, connections, or infrastructure layers. Fully editable in PowerPoint, Keynote, and Google Slides.


5 diapositivas
Market Growth Strategy
Break down your strategic growth roadmap with this layered Market Growth Strategy template. Each stack represents a phase in your market expansion journey—ideal for illustrating plans, KPIs, or product scaling. Fully editable and compatible with PowerPoint, Keynote, and Google Slides for seamless use across platforms.


5 diapositivas
Business Figures and Key Numbers Overview Presentation
Present your data with clarity using this key-themed slide layout. Ideal for outlining five important metrics, business highlights, or strategic figures. The bold numerical format and clean design make your content easy to follow. Fully customizable in Canva, perfect for professional reports, pitches, and data-driven presentations.


28 diapositivas
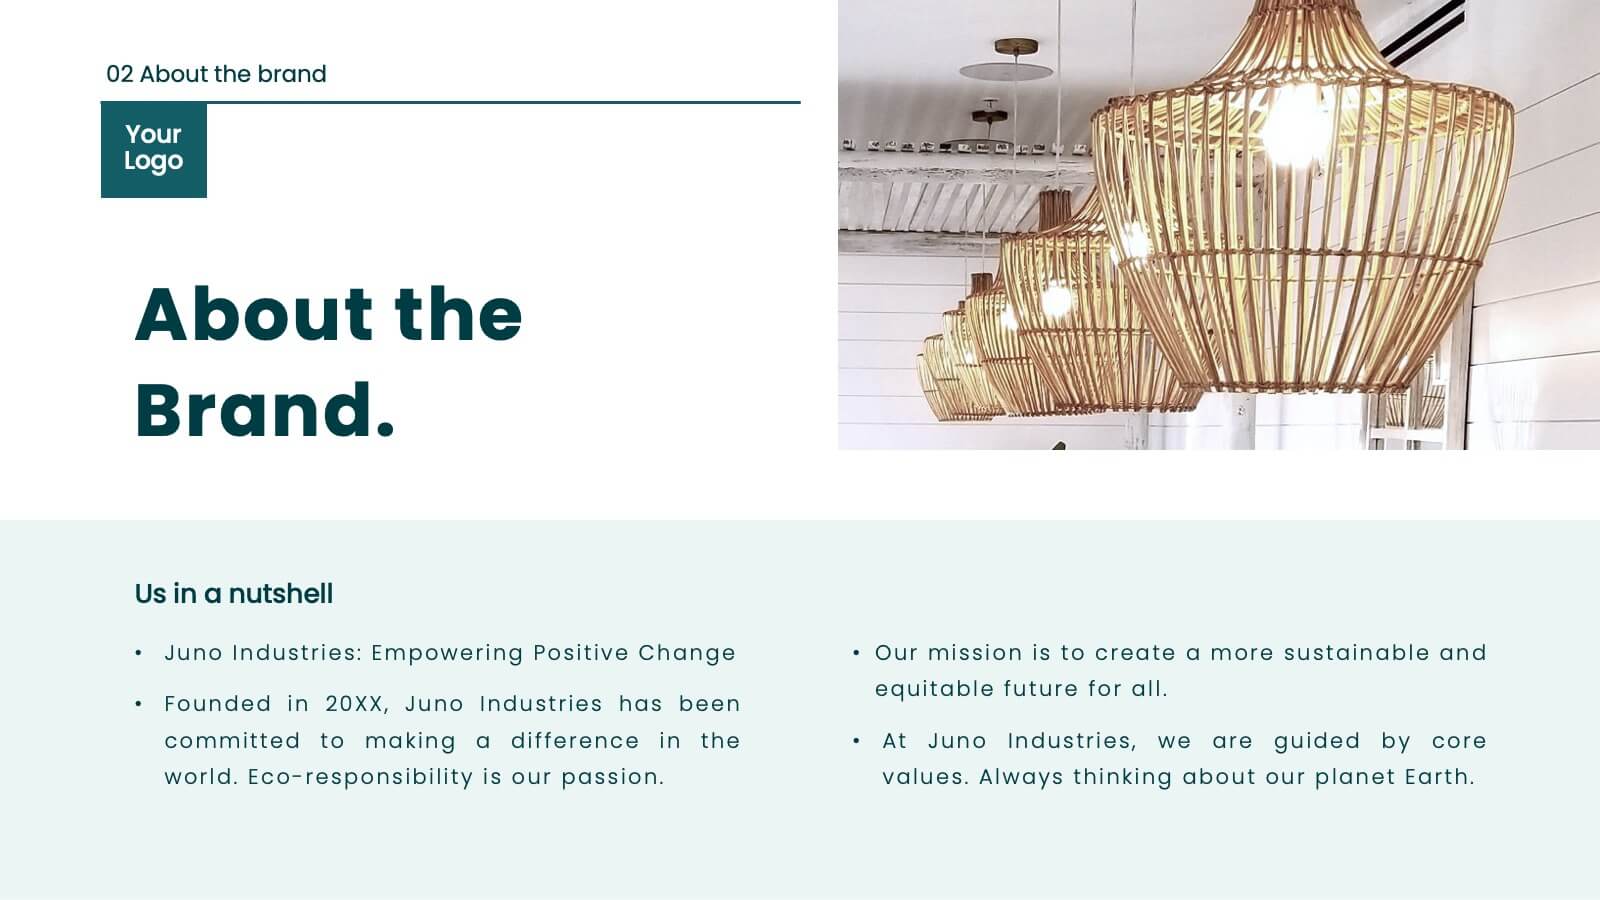
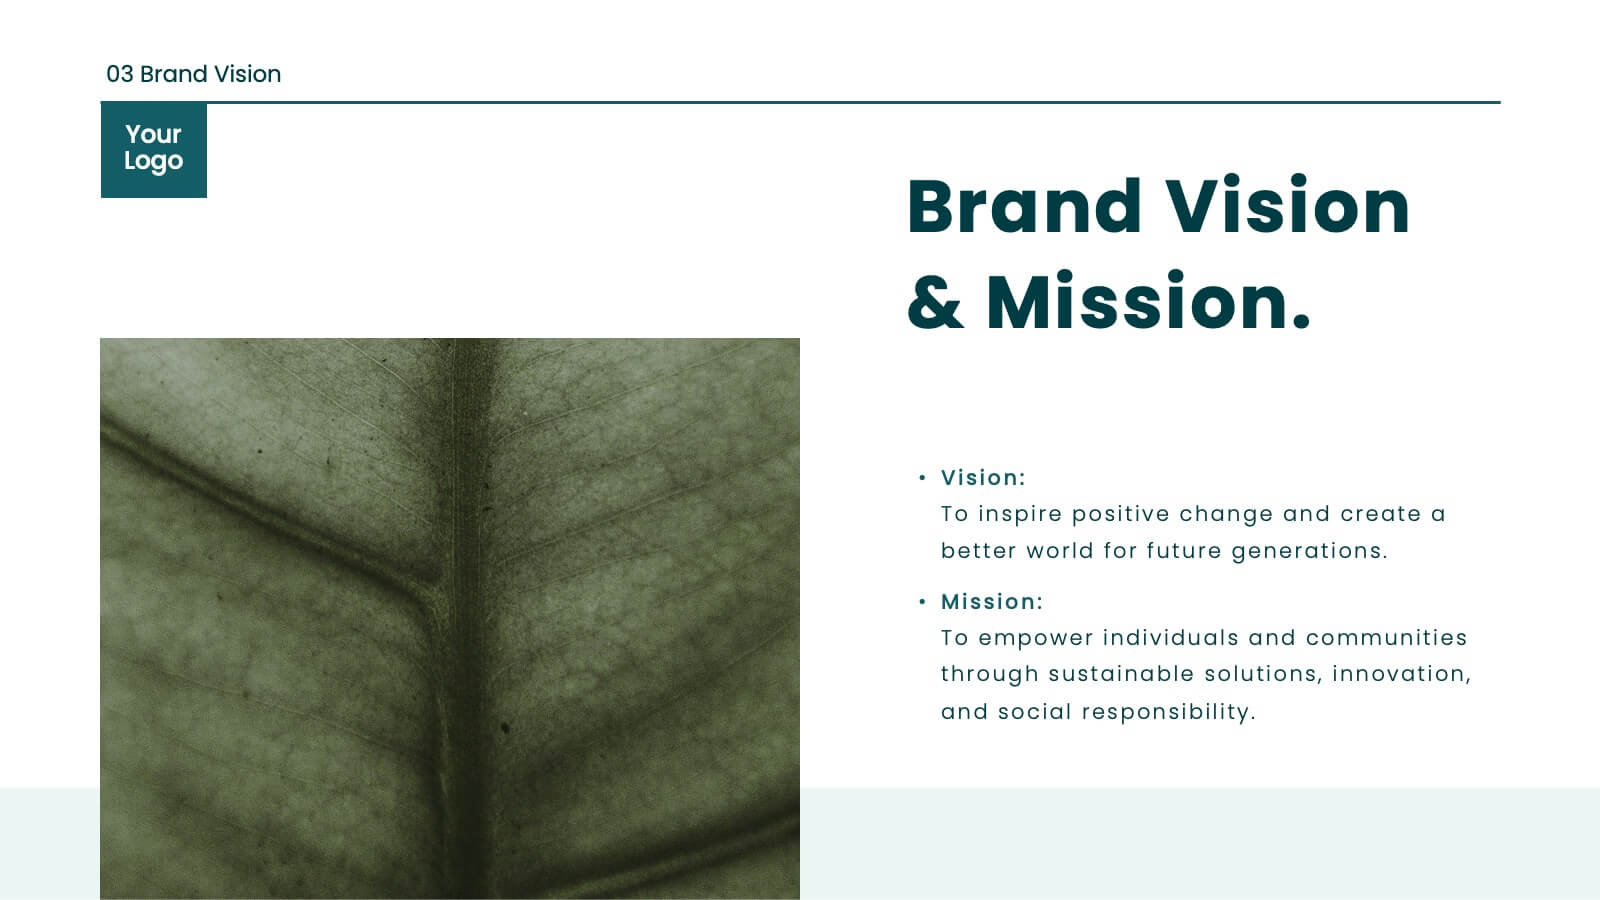
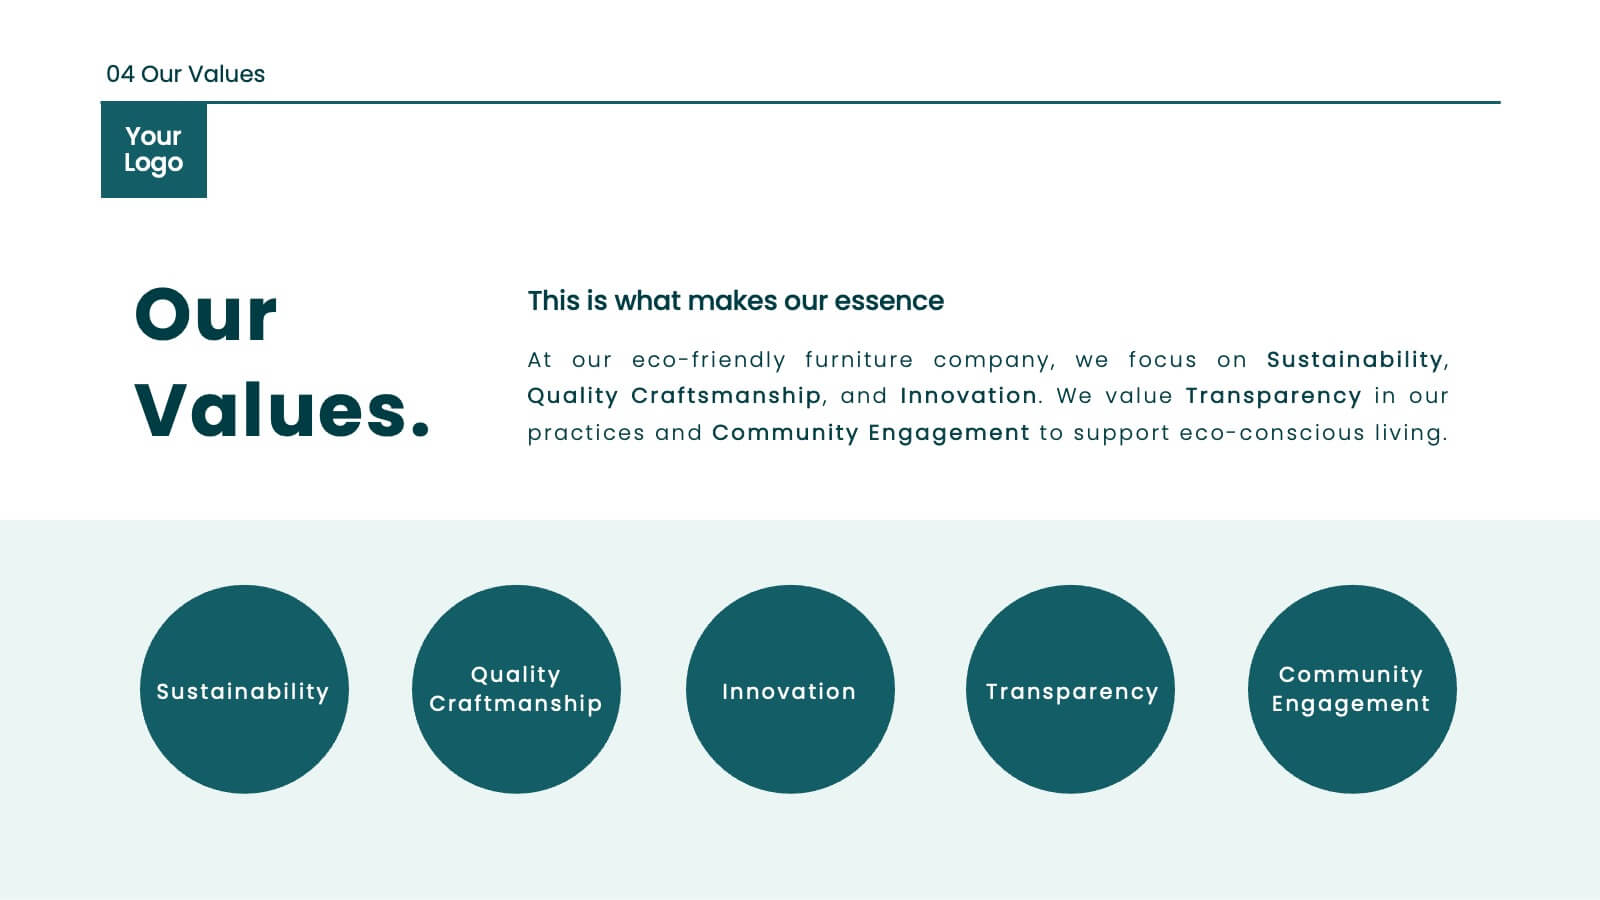
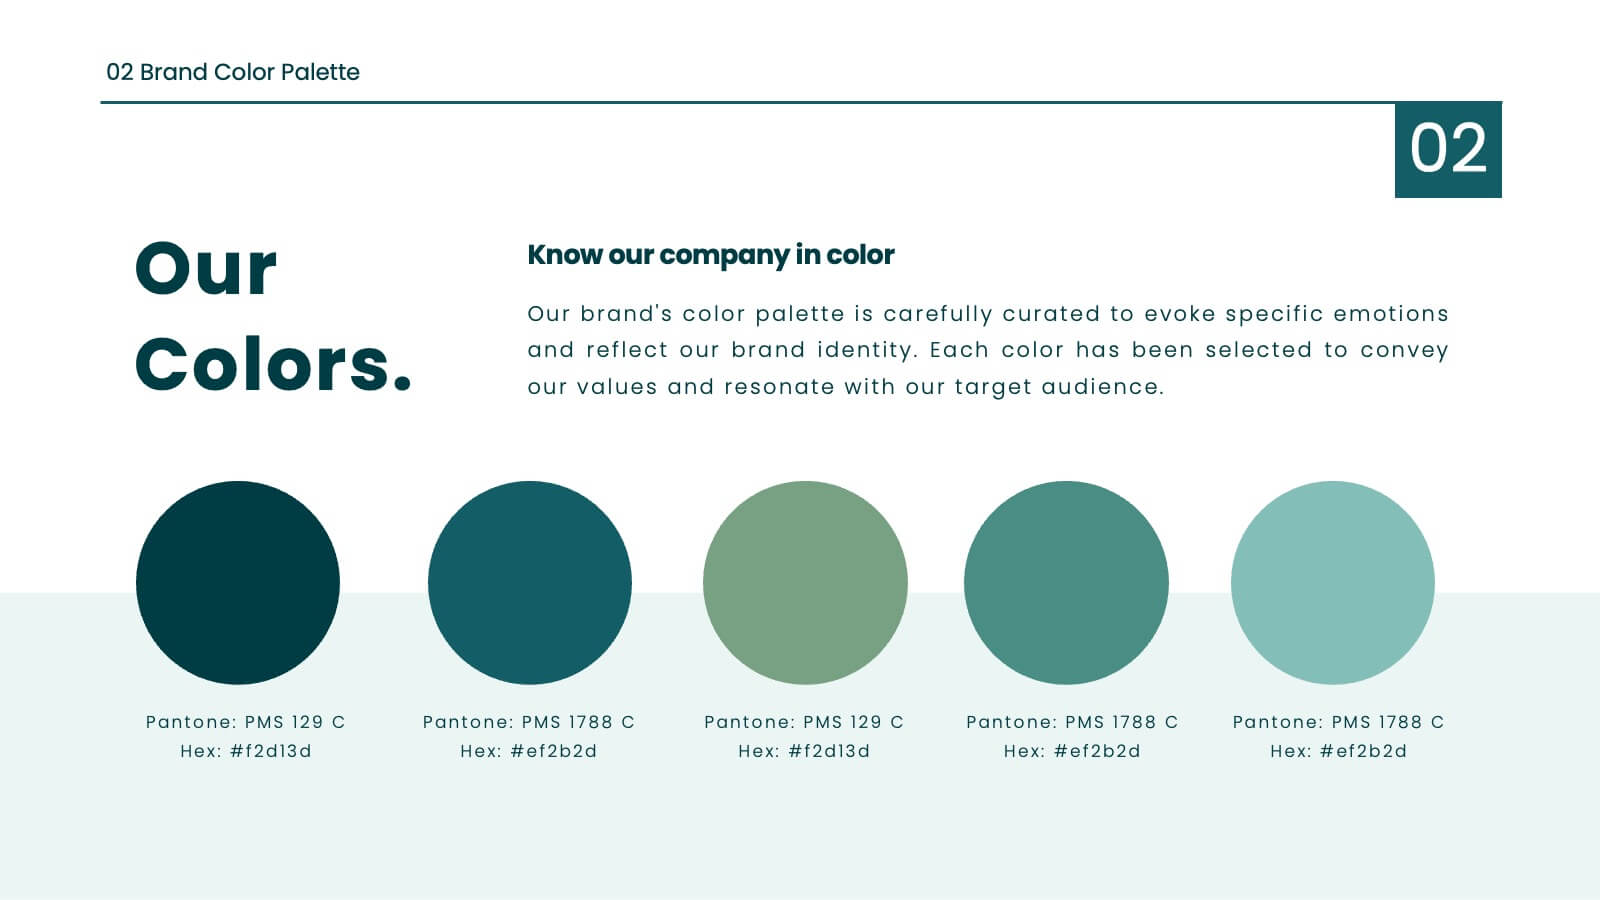
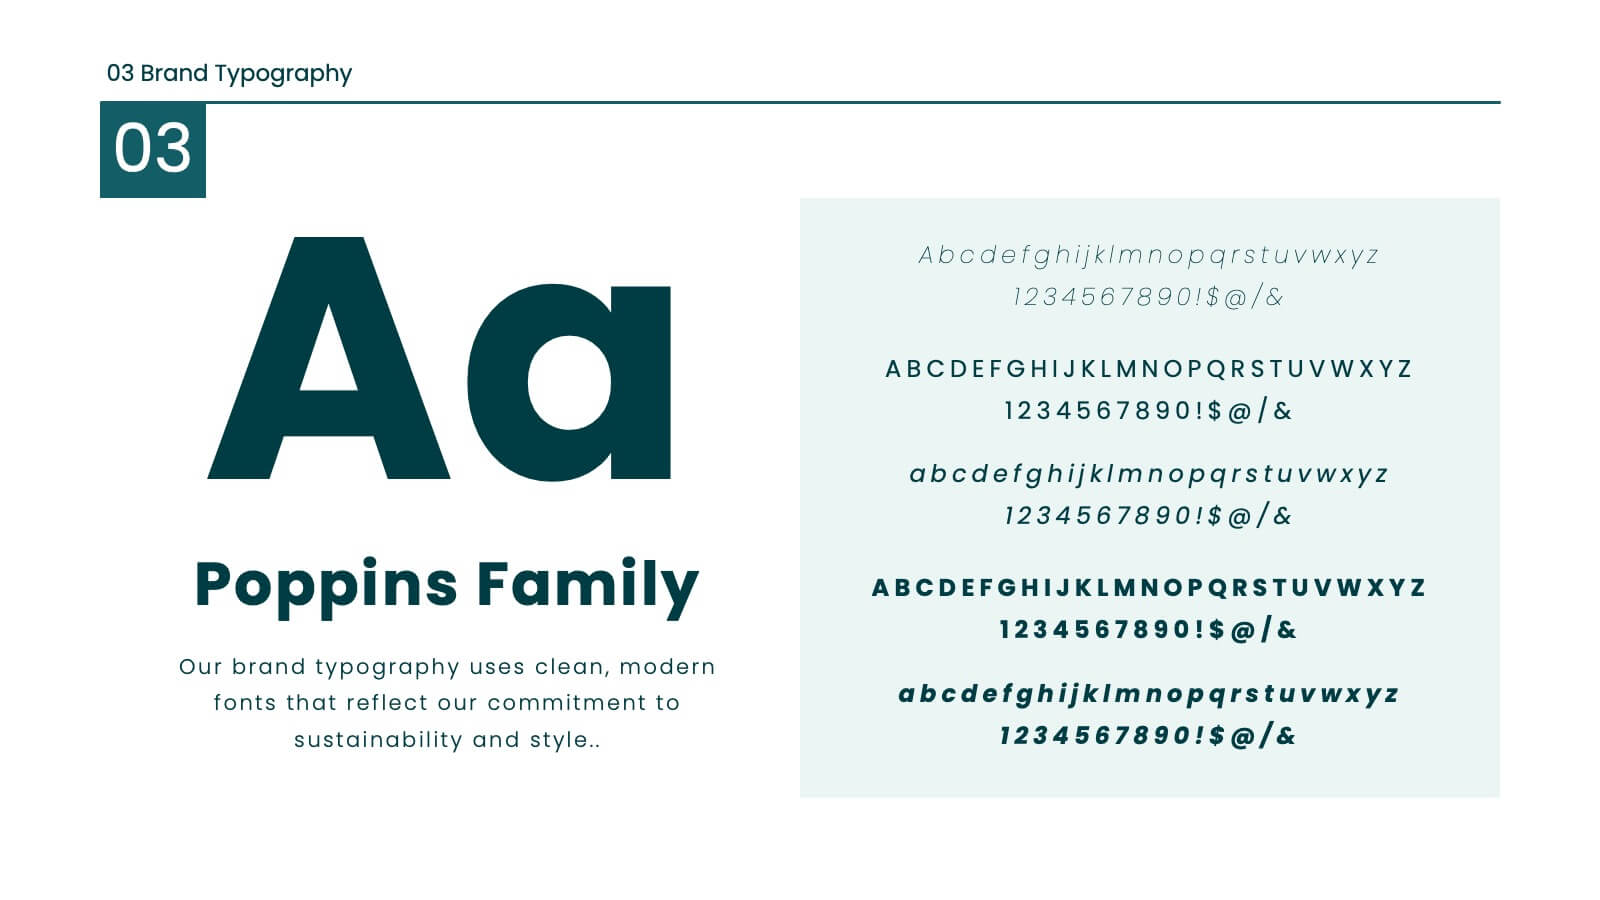
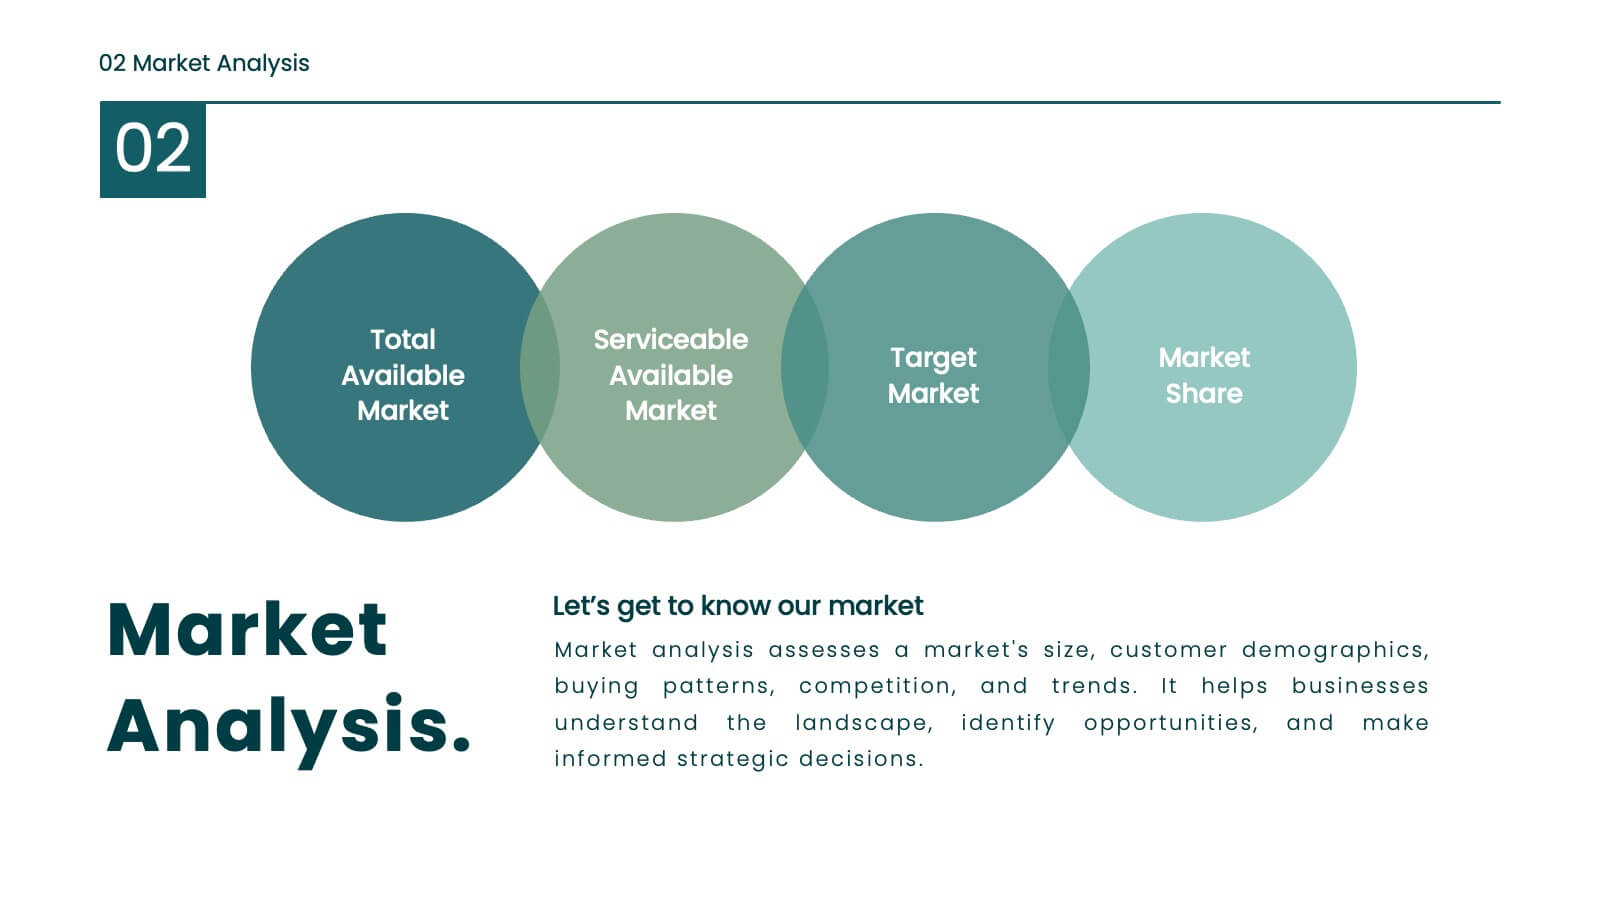
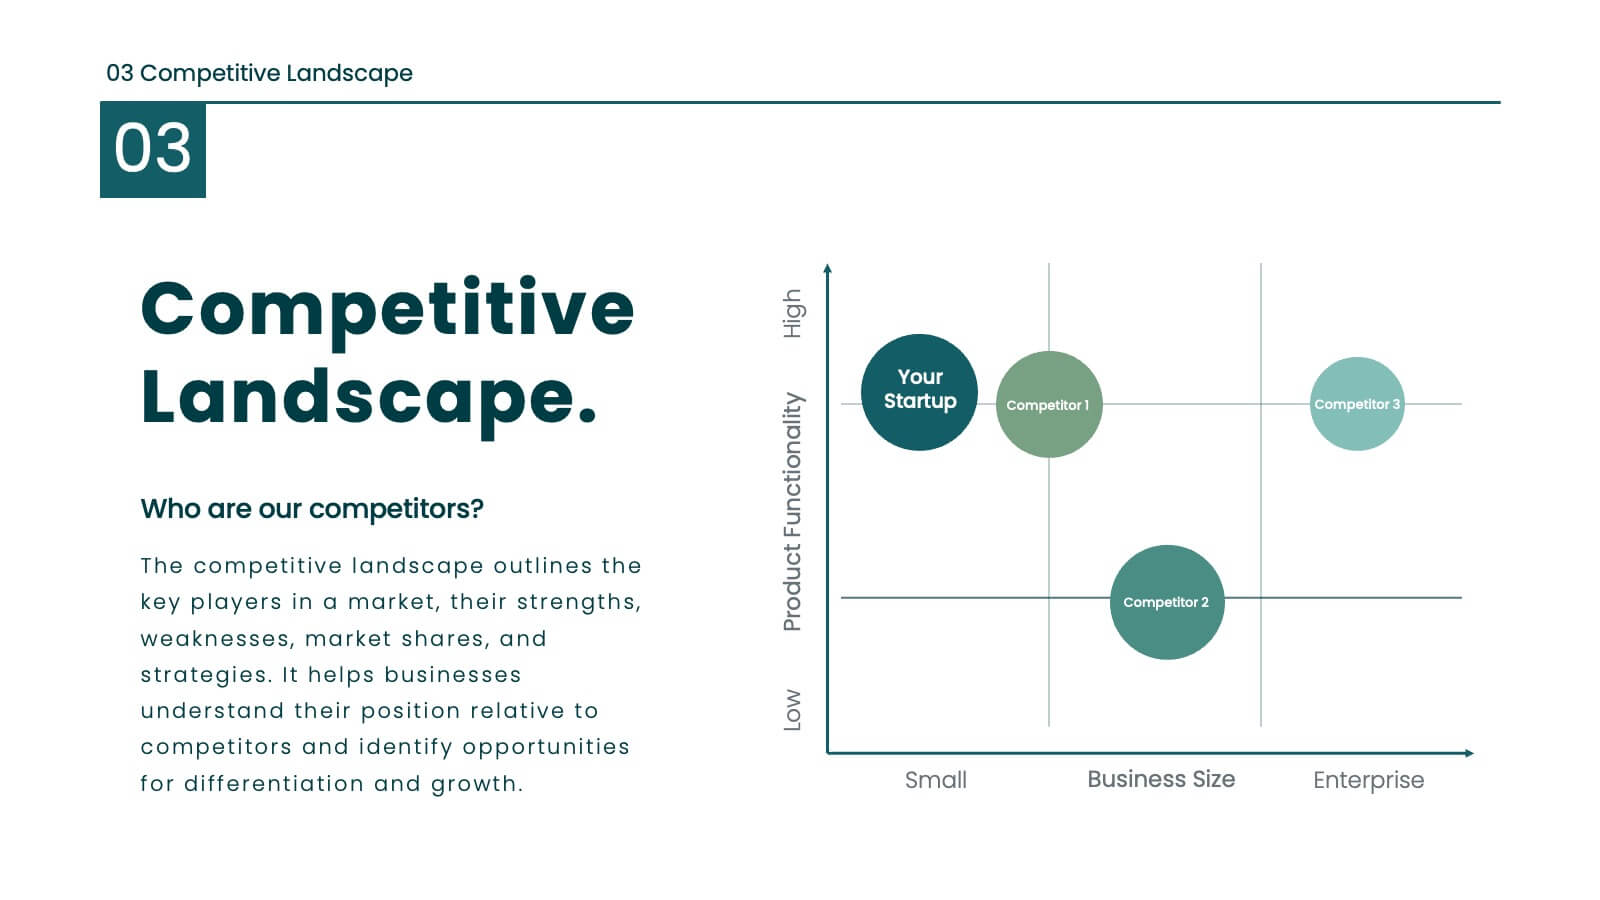
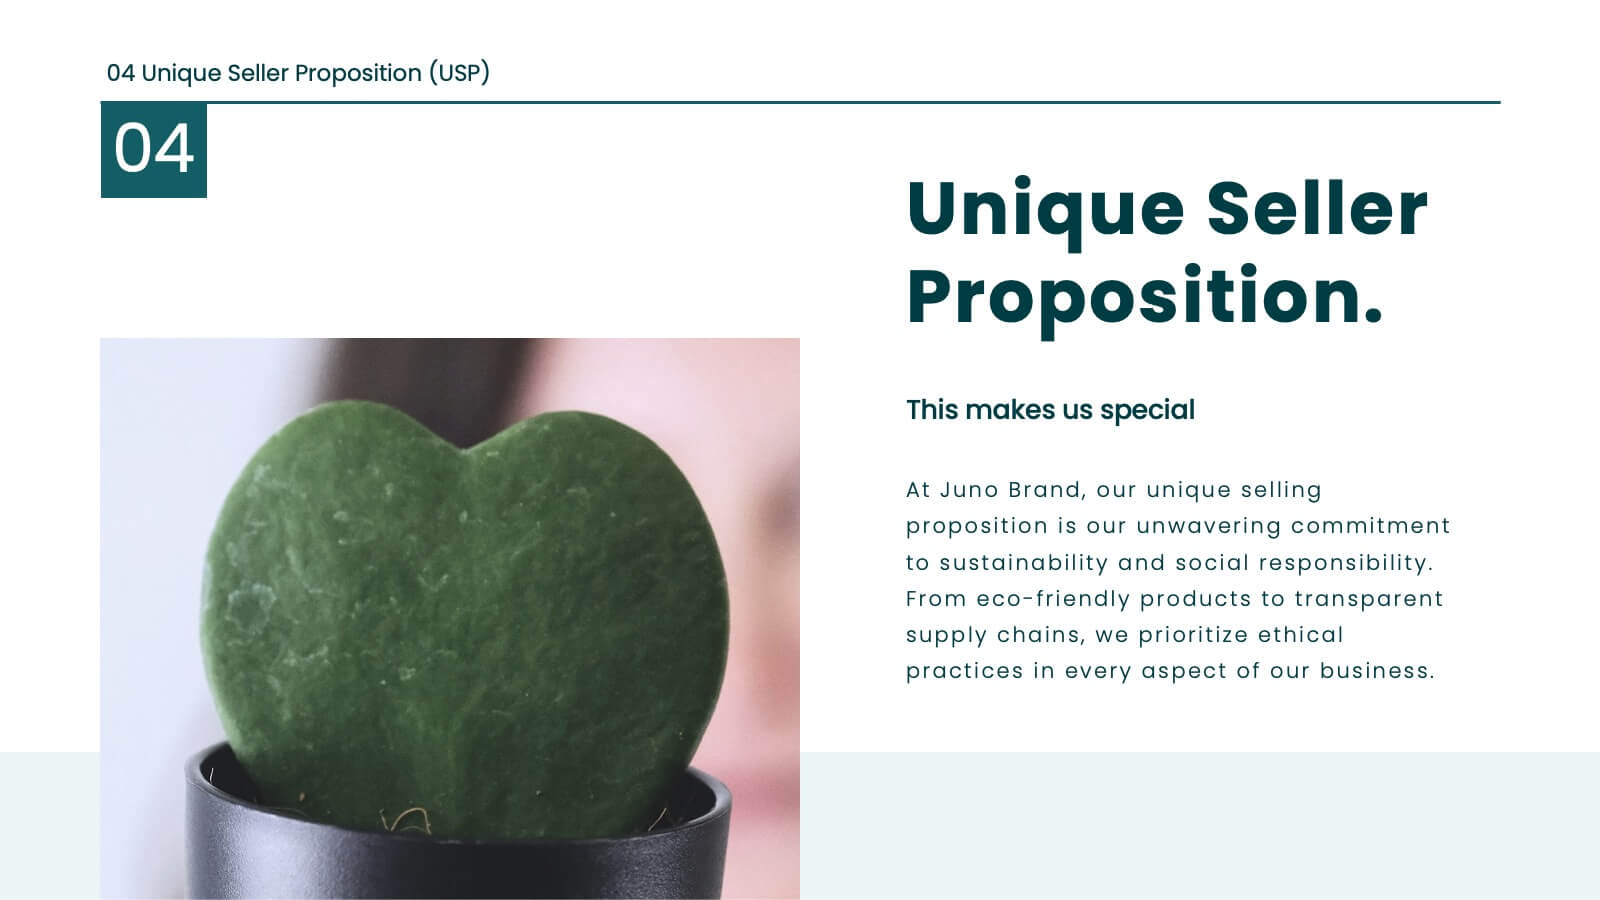
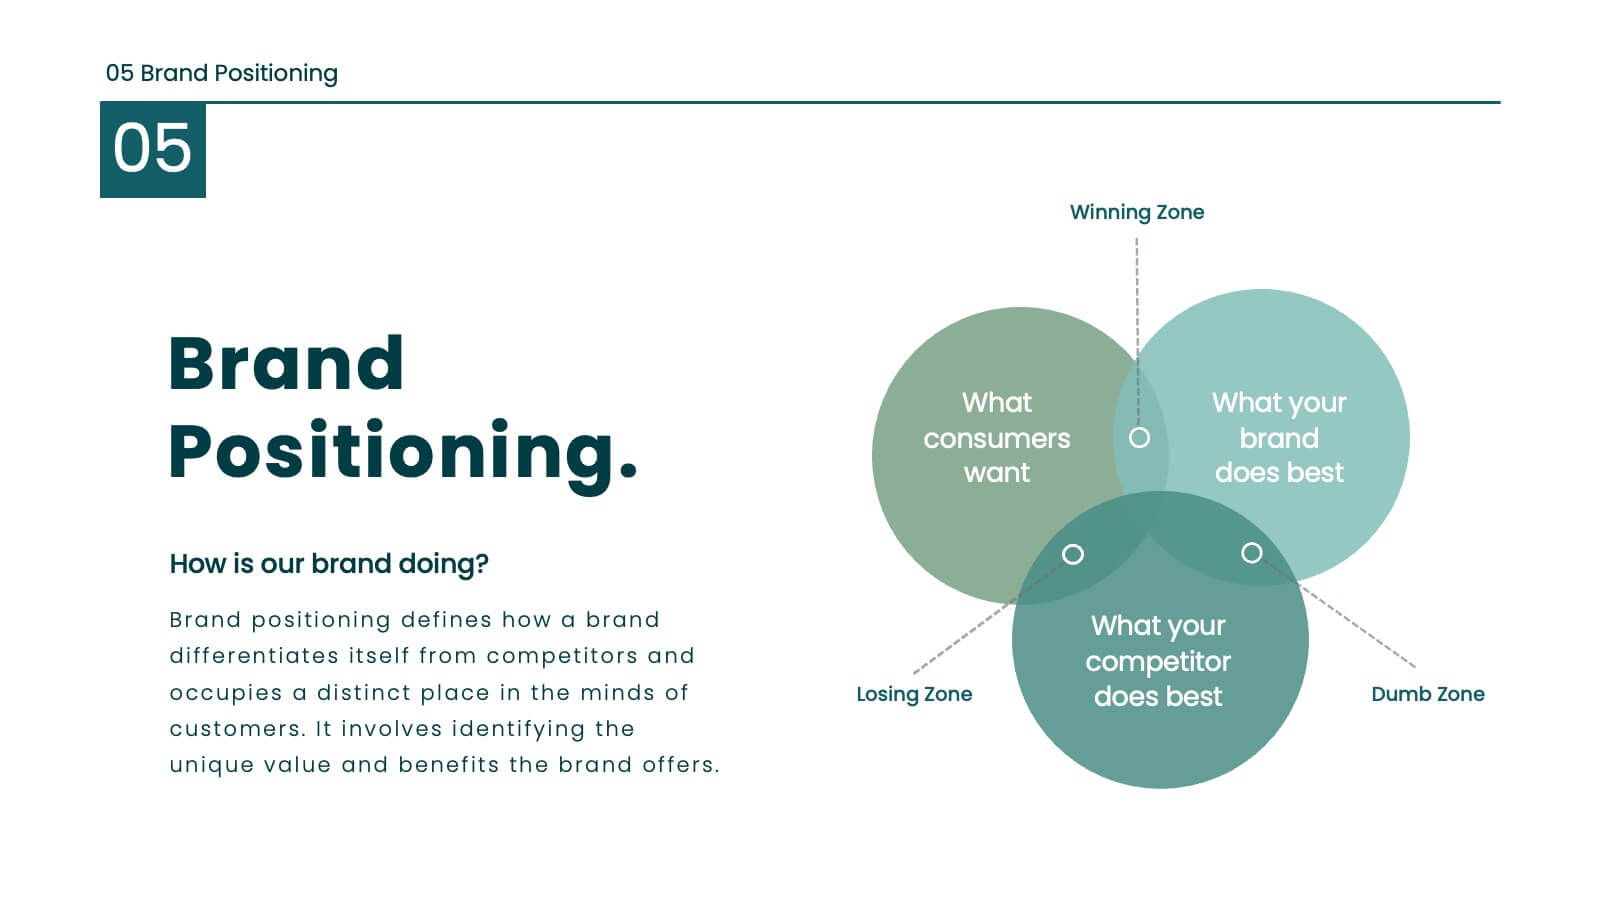
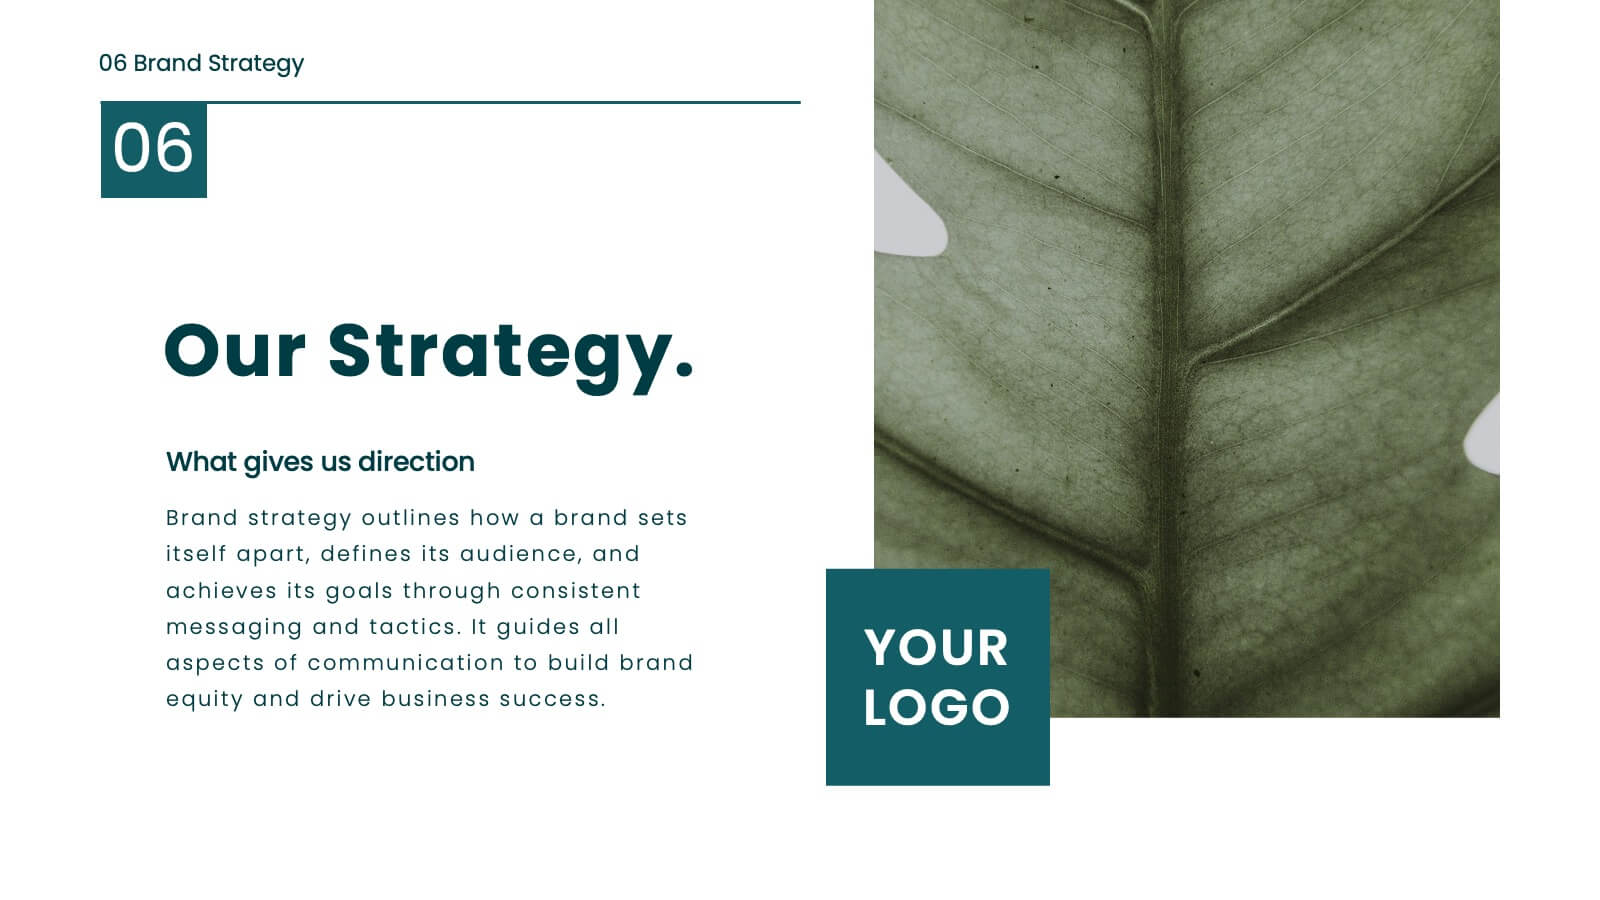
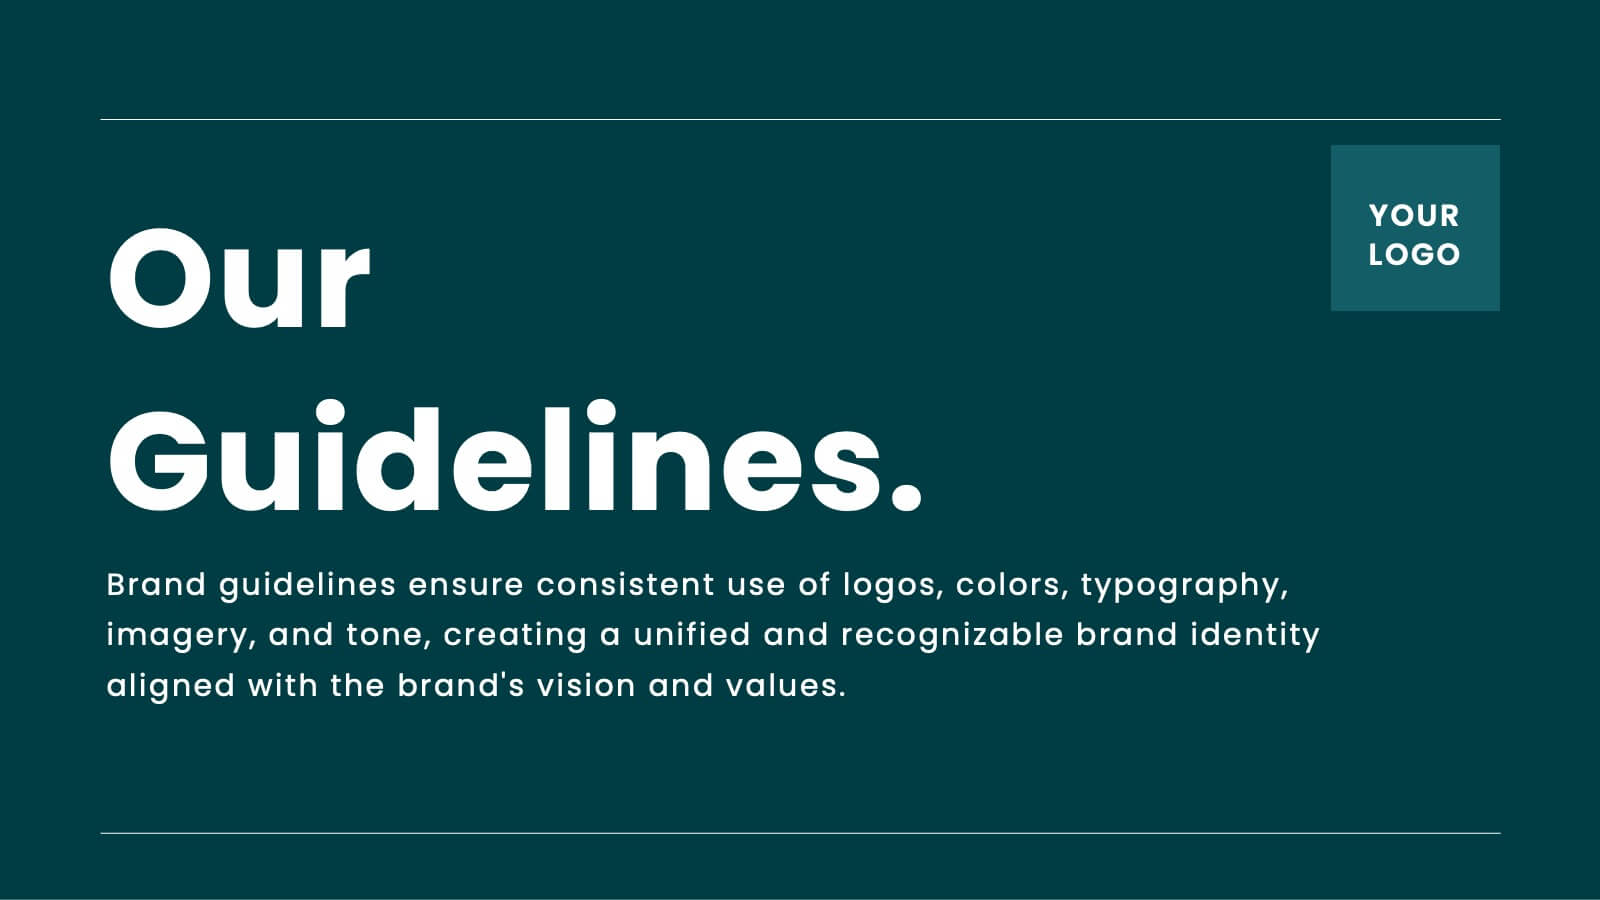
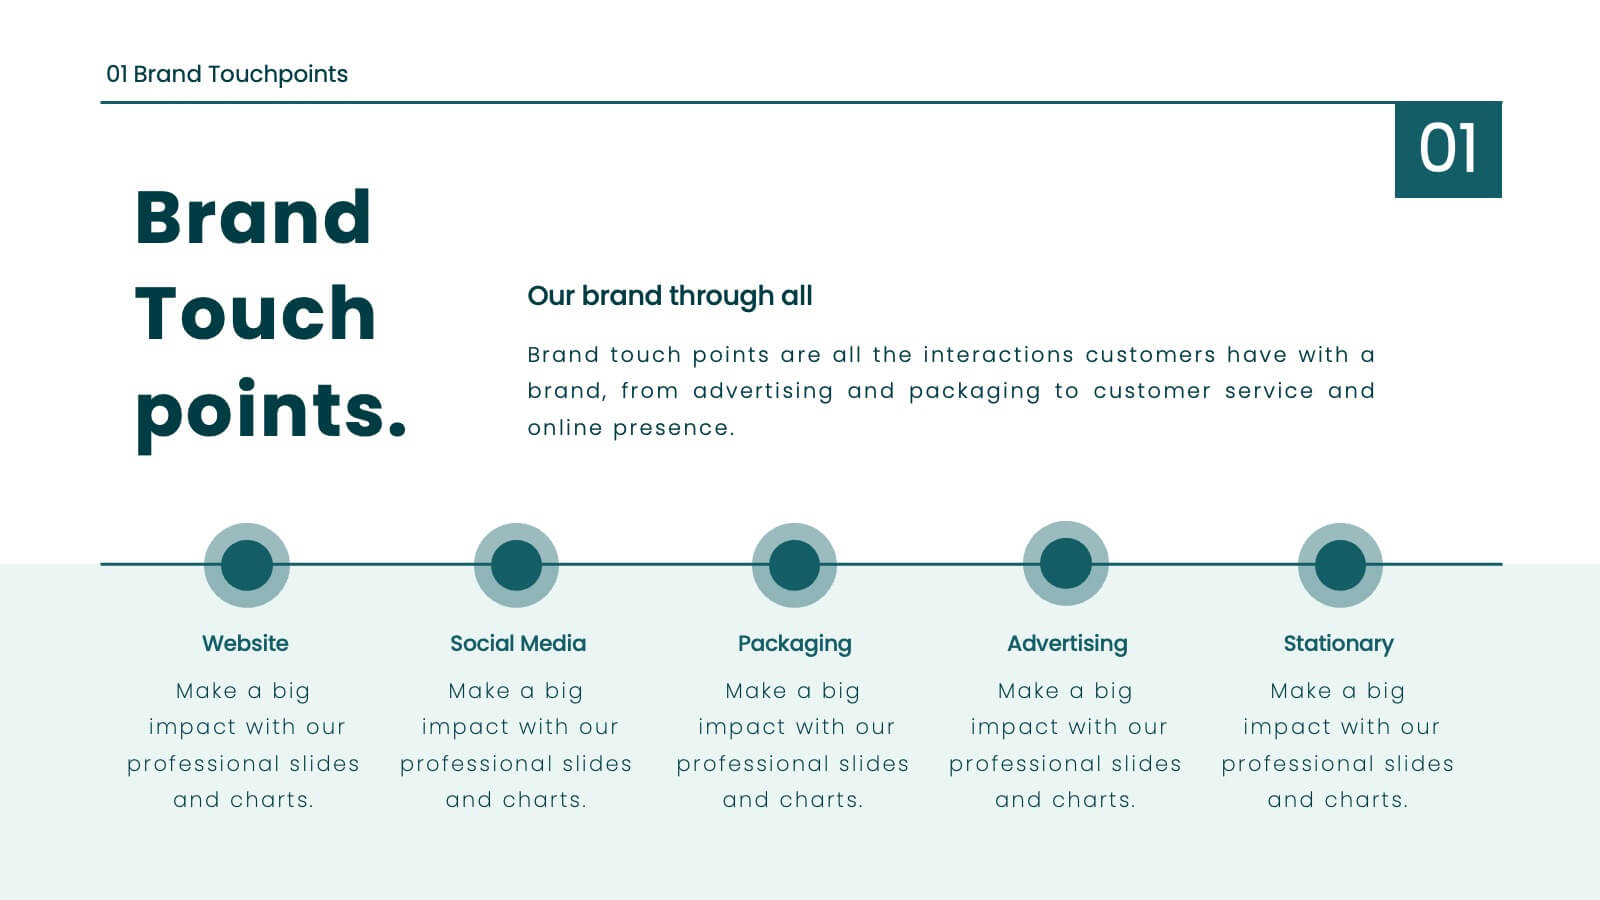
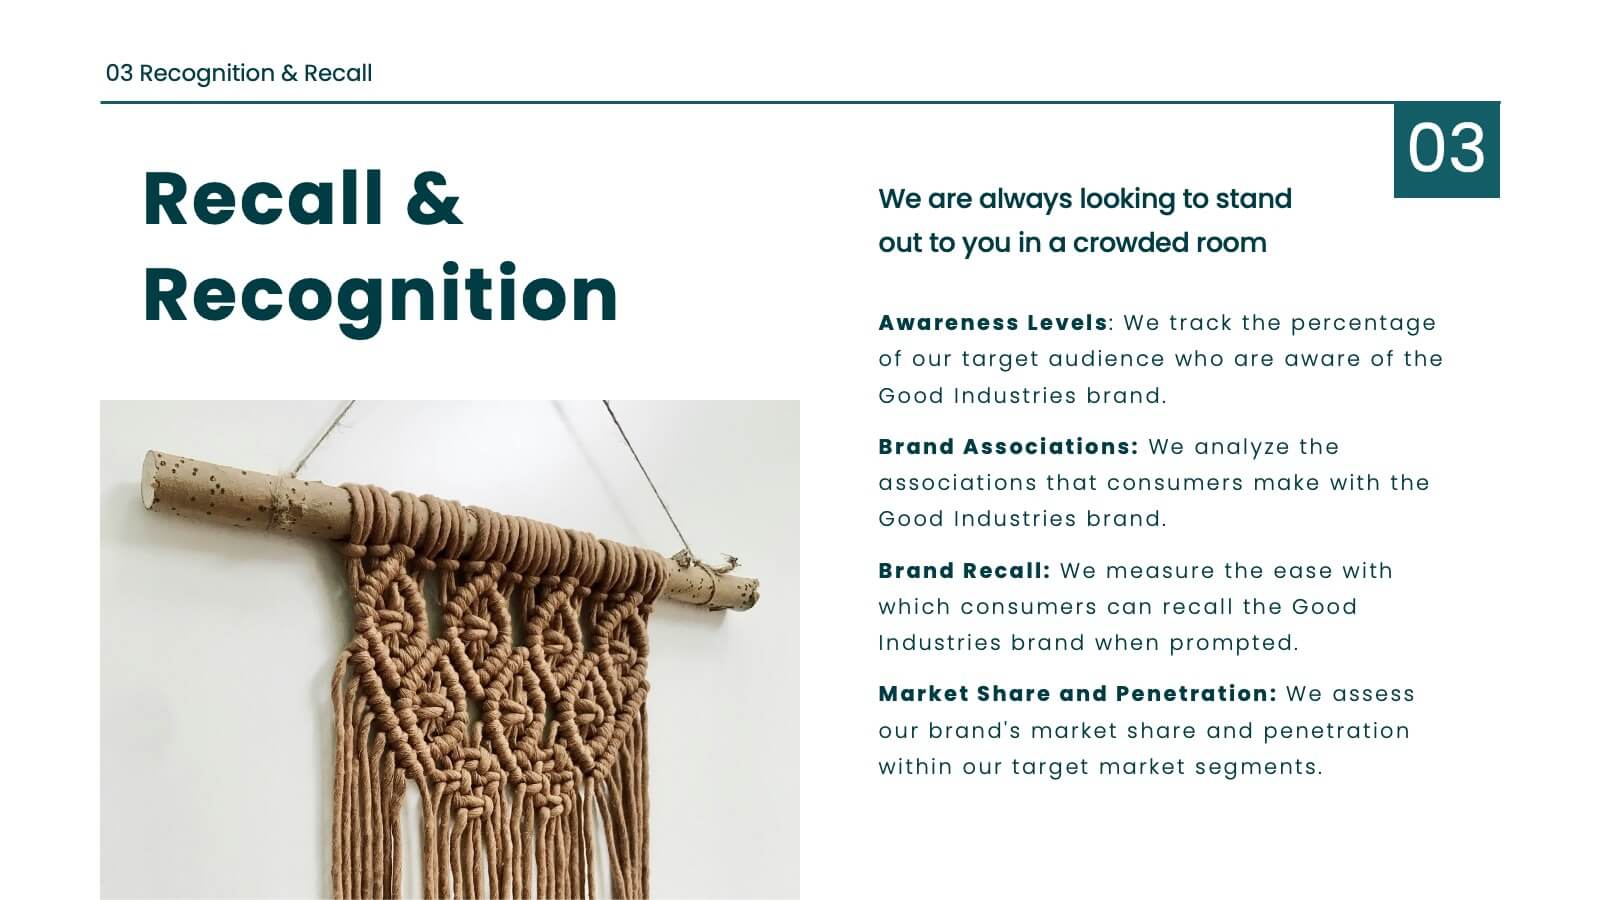
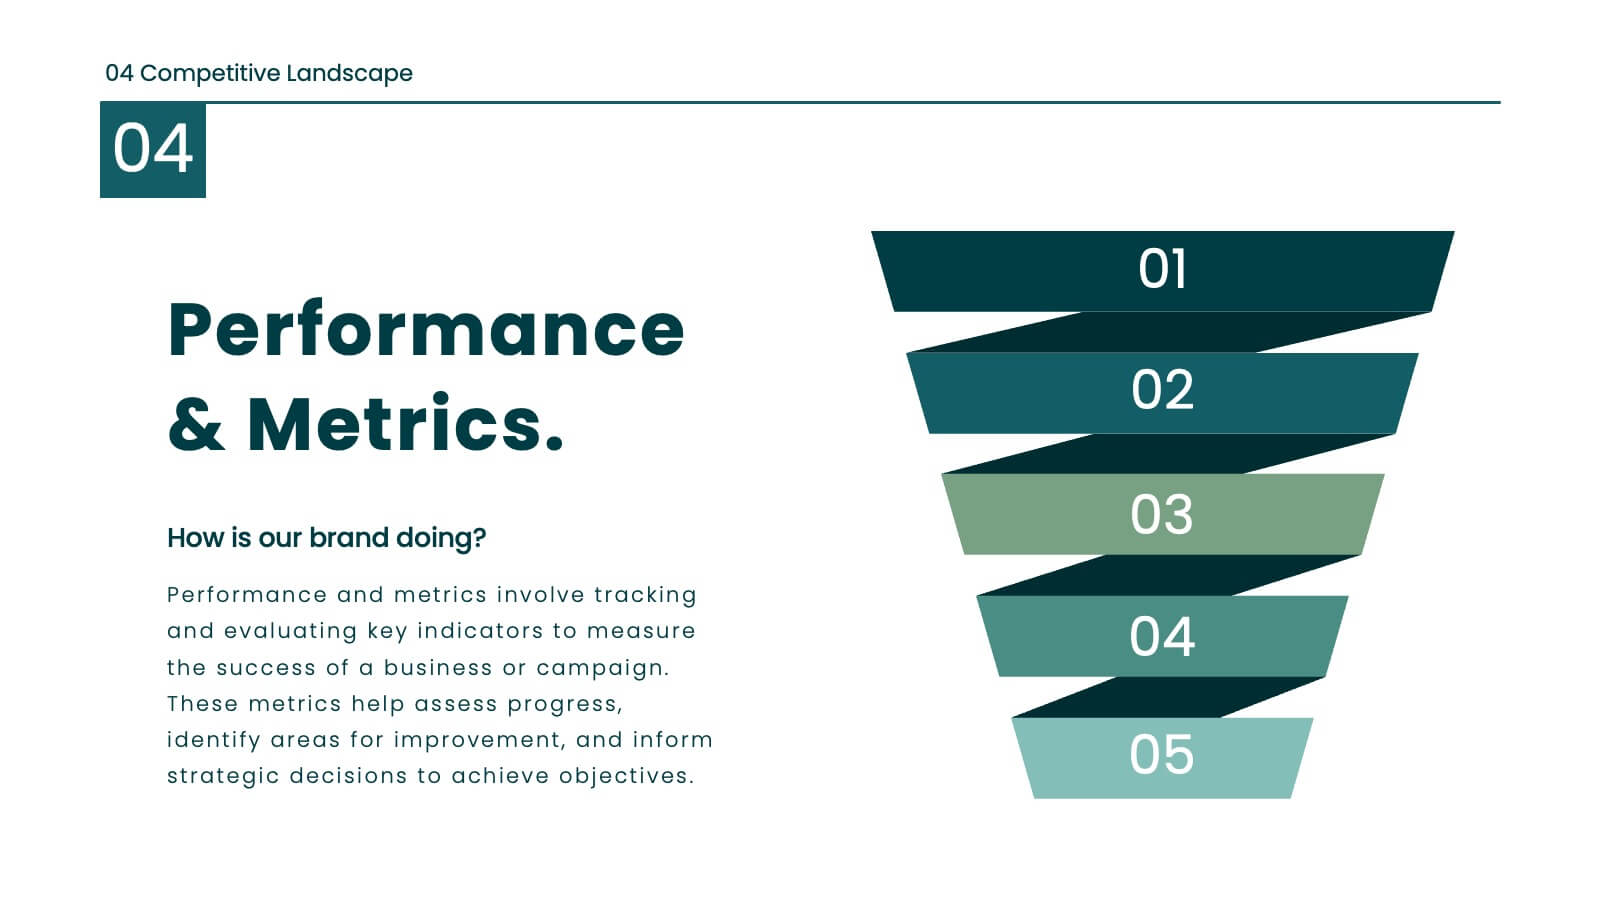
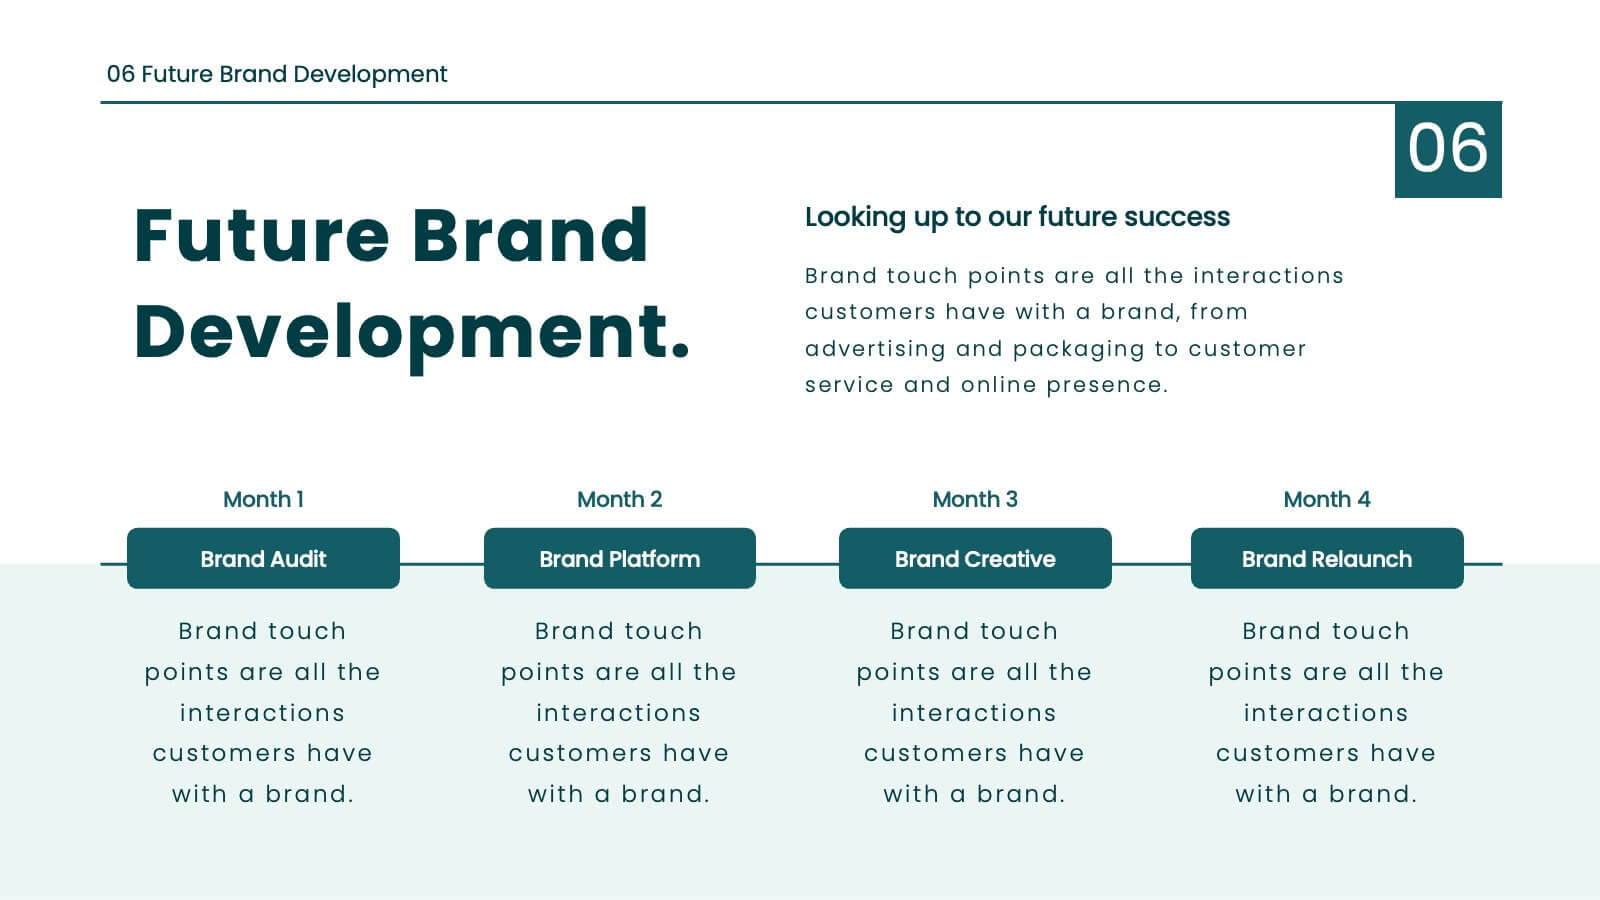
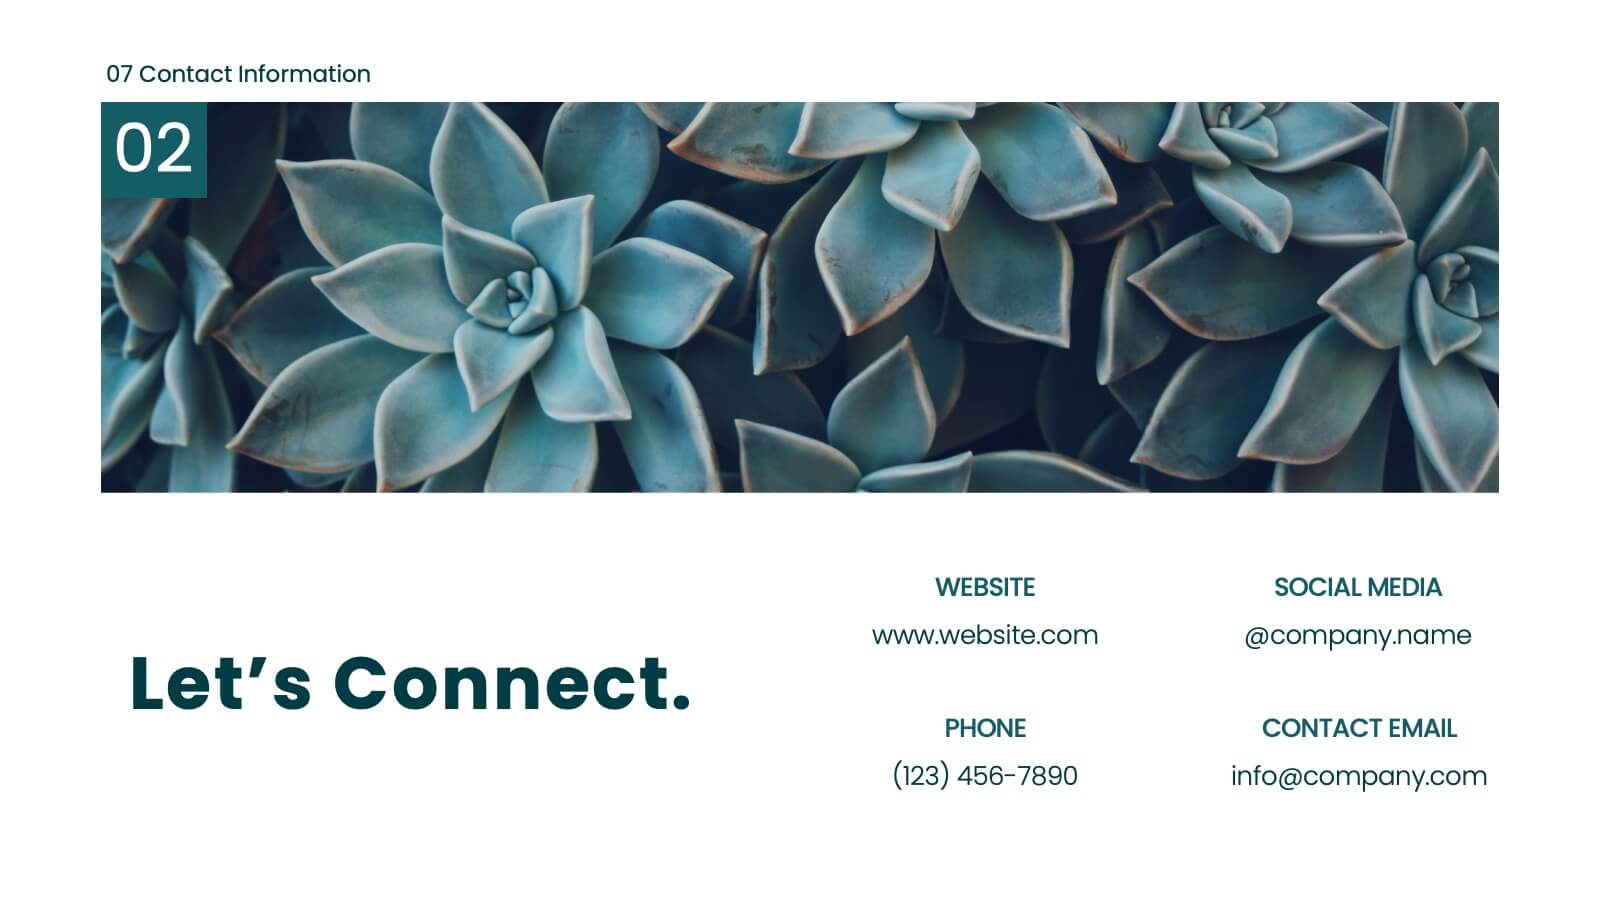
Juno Brand Guidelines Proposal Presentation
Define your brand's identity with this comprehensive, stylish presentation template. Perfect for detailing brand guidelines, vision, mission, and market analysis, it features a clean design with a professional layout. Highlight key elements like color palettes, typography, and unique selling propositions to ensure consistency and clarity. Compatible with PowerPoint, Keynote, and Google Slides, it’s ideal for any platform.


4 diapositivas
Gap Identification for Strategic Planning Presentation
Bridge the gap between where you are and where you want to be with this clean and practical layout. Ideal for outlining current challenges, action plans, and future goals, this presentation template helps visualize strategic progress with clarity. Fully compatible with PowerPoint, Keynote, and Google Slides.


4 diapositivas
Team Collaboration Strategy
Illustrate cross-functional teamwork with this visually engaging slide. Featuring color-coded team clusters, it's perfect for showcasing group dynamics, collaborative workflows, or project responsibilities. Use this diagram to break down organizational units, collaboration models, or department contributions. Fully editable in PowerPoint, Keynote, and Google Slides.


6 diapositivas
Innovation Ideas Infographics
Energize your presentations with our Innovation Ideas infographic, designed for full compatibility with Powerpoint, Keynote, and Google Slides. This vibrant and insightful infographic is the perfect addition for innovators, entrepreneurs, and educators looking to foster a culture of creativity and ideation. The infographic provides a visual exploration of the innovation process, from ideation to execution. It highlights key concepts and strategies that stimulate creative thinking and drive innovation within teams and organizations. With a focus on collaborative brainstorming and the incubation of ideas, it serves as a guide to developing groundbreaking concepts. Incorporating this infographic into your slides will help you effectively communicate the dynamics of successful innovation strategies. It’s ideal for workshops, team meetings, and academic courses that cover topics such as design thinking, innovation management, and product development. Use it to inspire your audience and to illustrate a roadmap for transforming ideas into tangible innovations.


4 diapositivas
Effective Team Management Presentation
Present your management insights with clarity using this puzzle-style Effective Team Management template. Ideal for breaking down leadership functions, collaboration elements, or role responsibilities across four segments. The modular puzzle format adds a creative visual touch while staying professional. Fully editable in PowerPoint, Keynote, and Google Slides.