


Características


¿Tienes alguna pregunta?
Recomendar


5 diapositivas
Architecture and Construction Strategy Presentation
Lay the foundation for success with this clean, construction-inspired presentation design. Ideal for showcasing project strategies, development phases, or architectural plans, it helps you communicate structure and vision with clarity. Fully customizable and compatible with PowerPoint, Keynote, and Google Slides for effortless editing and professional results.


3 diapositivas
Breakthroughs in Biology and Chemistry Presentation
Highlight your scientific discoveries with this Breakthroughs in Biology and Chemistry Presentation Template. Featuring illustrated lab elements like microscopes, DNA, and petri dishes, it's perfect for researchers and educators. Easily editable in PowerPoint, Keynote, or Google Slides, this template helps convey key insights with clarity and visual appeal.


6 diapositivas
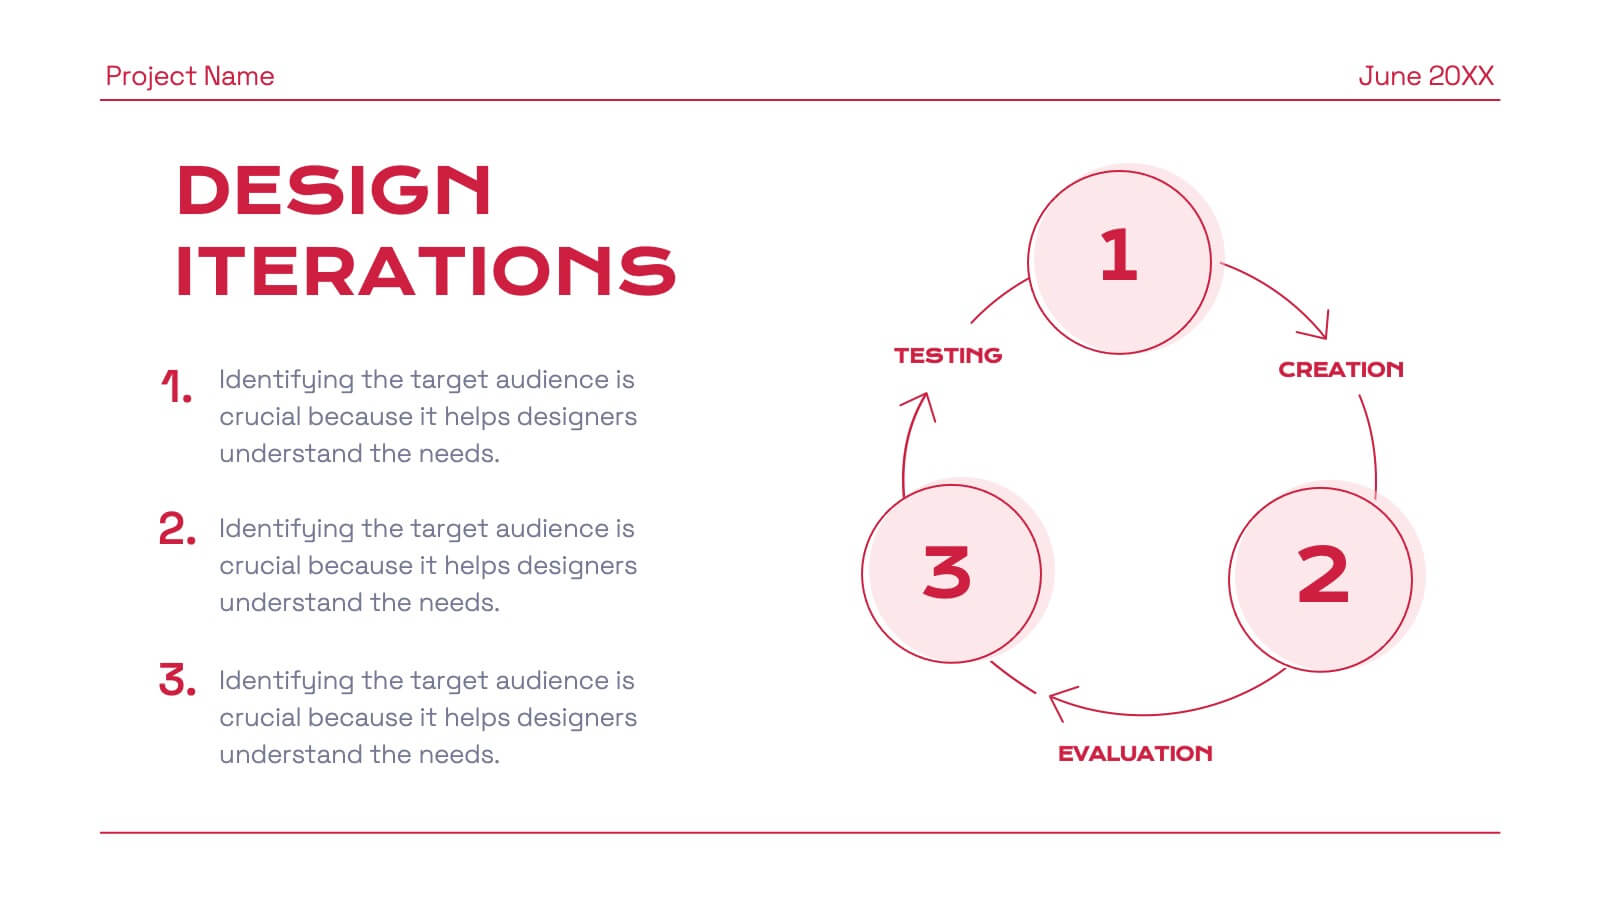
Peak Flow Chart Infographic
A flowchart is a visual representation of a process or workflow using various symbols, arrows, and connectors to show the sequence of steps and decisions involved in that process. This infographic template is a powerful tool for illustrating complex processes in a clear and easy-to-understand manner. Compatible with Powerpoint, Keynote, and Google Slides. The flowcharts featured consist of various shapes or symbols that represent different process steps or activities. The infographic depicts the sequential order of steps in a process, showing the logical progression from one step to another. Each step is connected to the next step using arrows.


5 diapositivas
United States States Outline Presentation
Make your data pop with a vibrant, easy-to-read snapshot of U.S. state insights. This presentation helps you highlight regional trends, compare performance, and showcase key information using a clean state-by-state outline. Perfect for reports, geography topics, or analytics. Fully compatible with PowerPoint, Keynote, and Google Slides.


5 diapositivas
Crypto Investment Trends and Insights Presentation
Stay ahead of the digital asset curve with the Crypto Investment Trends and Insights presentation template. This slide features a visually compelling mining cart illustration filled with cryptocurrency symbols, perfect for presenting market data, blockchain innovations, or digital asset strategies. Highlight three core insights using customizable text areas and icons. Ideal for crypto analysts, fintech professionals, and investment briefings. Fully editable in PowerPoint, Keynote, and Google Slides.


24 diapositivas
Kepler Investor Pitch Presentation
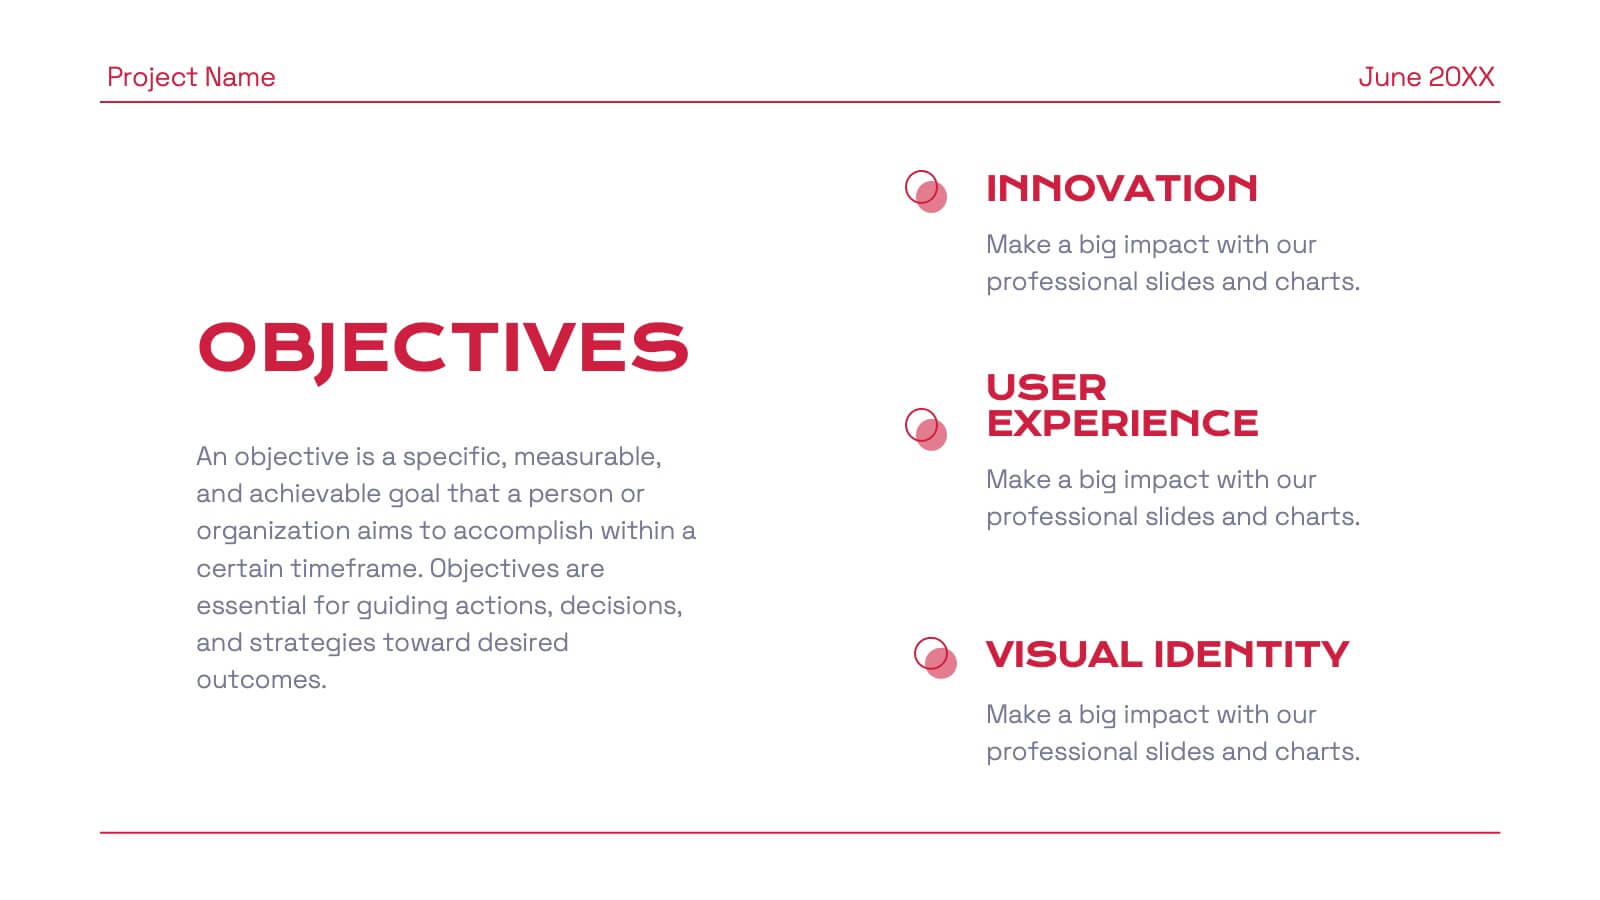
Impress potential investors with this thoughtfully crafted investor pitch presentation template. Its sleek design is tailored to captivate attention while delivering a clear and concise narrative about your business. Highlight key sections, including your company overview, problem statement, and innovative solutions, all designed to set you apart from the competition. Dive deep into your market opportunities, target audience, and revenue model, using visually engaging layouts and infographics. Showcase growth projections, financial overviews, and funding requirements with clarity and professionalism. Additionally, present your unique selling proposition, milestones, and risk analysis effectively. With dedicated slides for team introductions and a compelling close, this template is perfect for startups and established businesses alike. Fully customizable and compatible with PowerPoint, Google Slides, and Keynote, it ensures seamless branding and adaptability for any presentation. Engage your audience and secure the investment you need!


22 diapositivas
Eclipse Graphic Design Project Plan Presentation
Develop a winning marketing strategy with this dynamic template. Dive into current trends, consumer behavior, and innovative techniques. Perfect for social media, influencer marketing, and data-driven campaigns. Fully compatible with PowerPoint, Keynote, and Google Slides.


5 diapositivas
Political Campaign Result Infographics
A Political Campaign is an organized effort by an individual or group to promote or oppose a political candidate, cause, or policy. Our vertical Infographic is a graphical representation of the outcome of a political campaign presented in a vertical layout. This template includes charts, diagrams, and tables that provide an easy-to-understand analysis of election results. This can be used to showcase the distribution of votes across different regions, the percentage of votes garnered by each candidate, and other relevant information that provides a comprehensive overview of the election outcome.


4 diapositivas
Pharmaceutical Industry Overview Presentation
Get a comprehensive view of the pharmaceutical sector with the Pharmaceutical Industry Overview Presentation template. This well-structured layout is designed to present key insights, industry trends, and regulatory frameworks in a visually compelling format. Perfect for industry analysts, healthcare professionals, and business executives, this template is fully editable and compatible with PowerPoint, Keynote, and Google Slides.


4 diapositivas
Key Business Insights Executive Summary
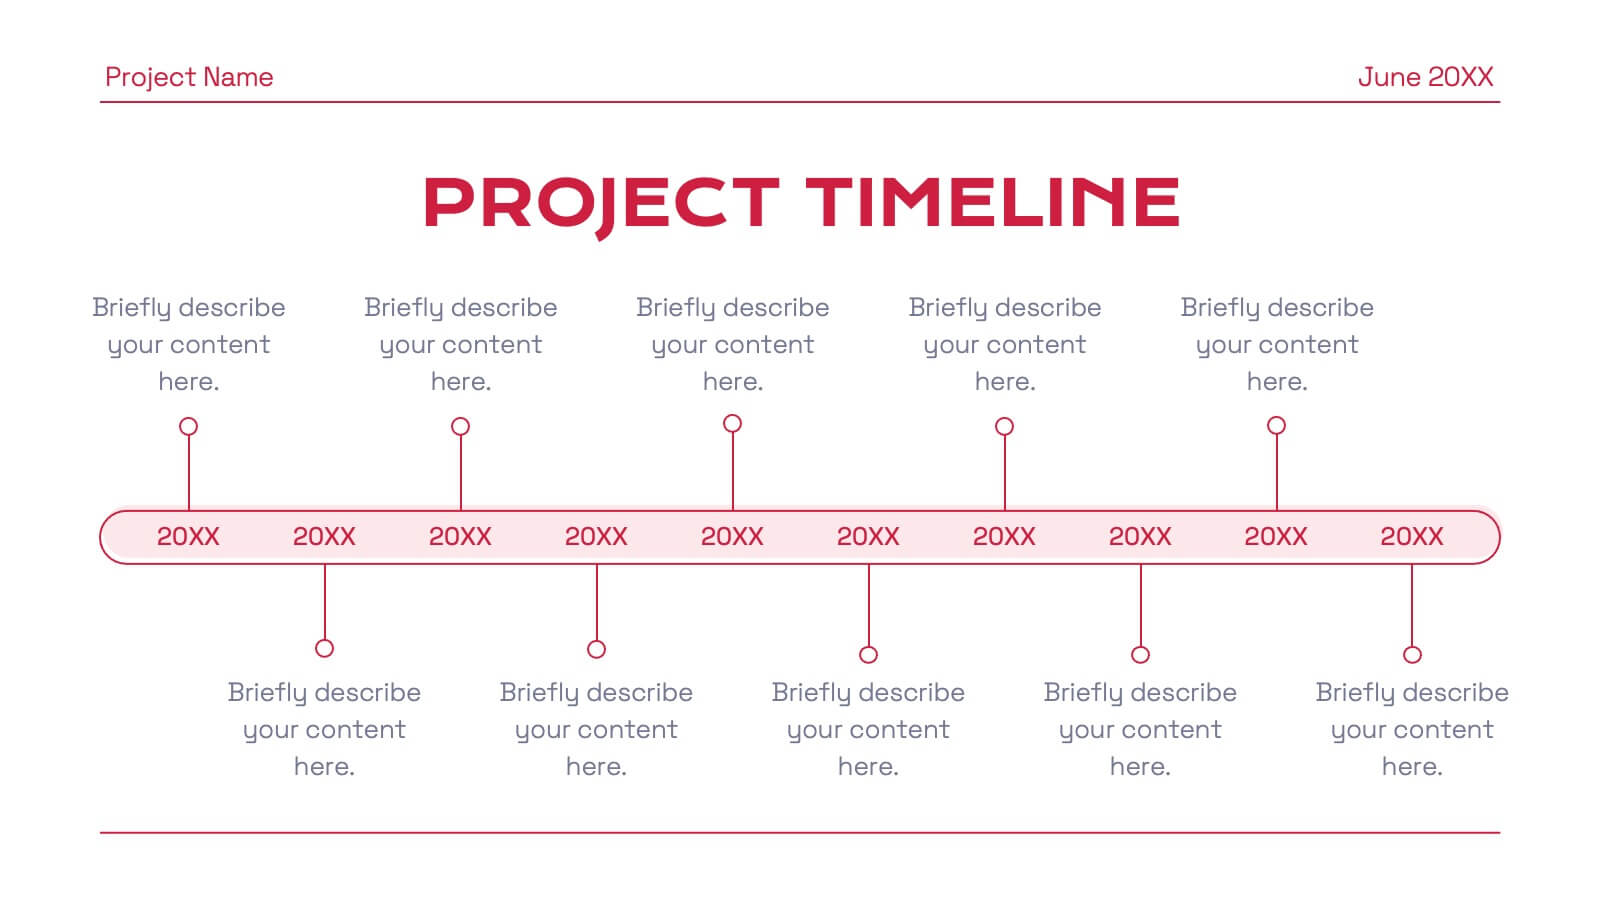
Present your insights like a pro with this dynamic, timeline-inspired slide that makes key data points easy to follow. Designed to highlight four major takeaways or milestones, this visual format is ideal for summarizing business progress, strategy updates, or operational highlights. Fully editable in PowerPoint, Keynote, and Google Slides.


20 diapositivas
Team Meeting Presentation
Streamline your team meetings with this professional presentation template, designed in striking purple tones. It covers all essential aspects from agenda setting to feedback collection, ensuring efficient and effective communication. Compatible with PowerPoint, Google Slides, and Keynote, this template is perfect for keeping your team aligned and focused.


6 diapositivas
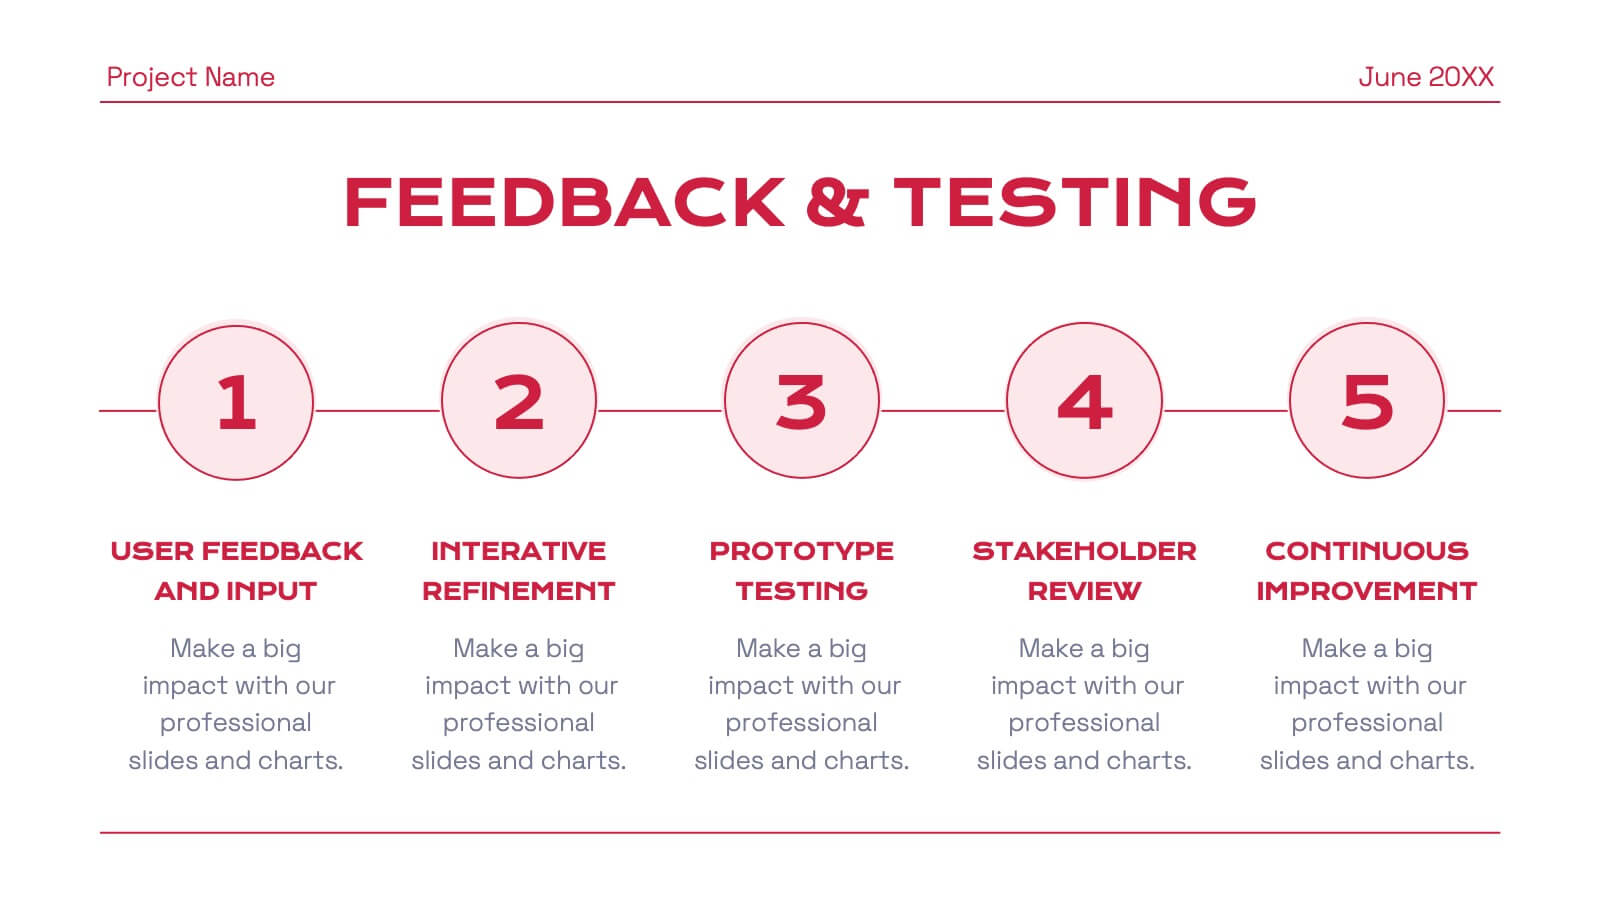
Professional Meeting Agenda Presentation
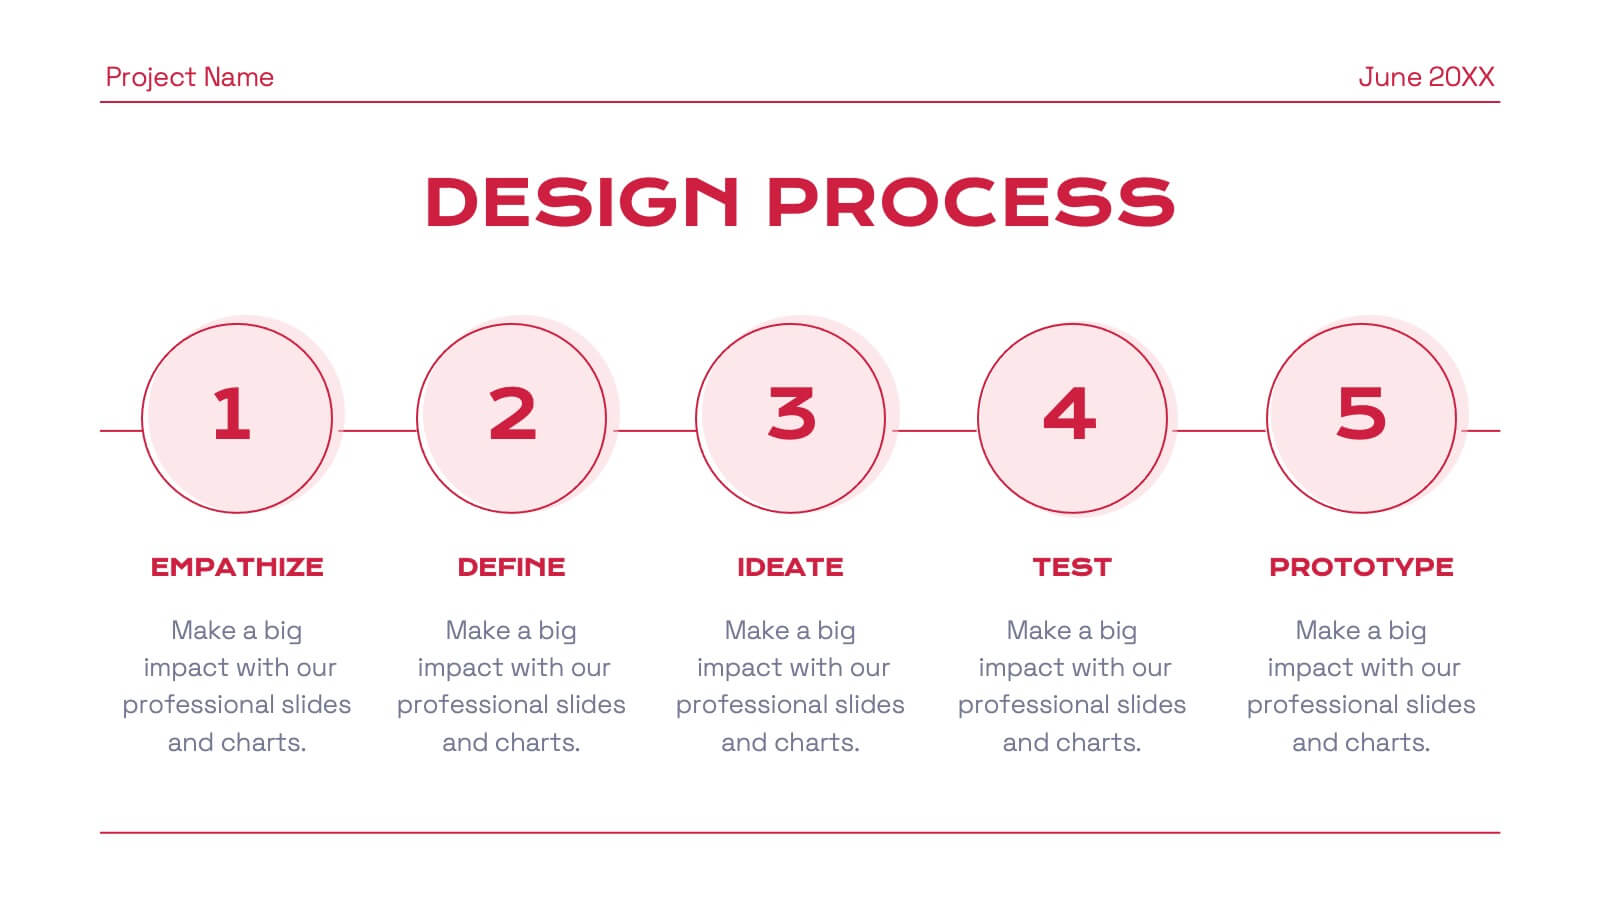
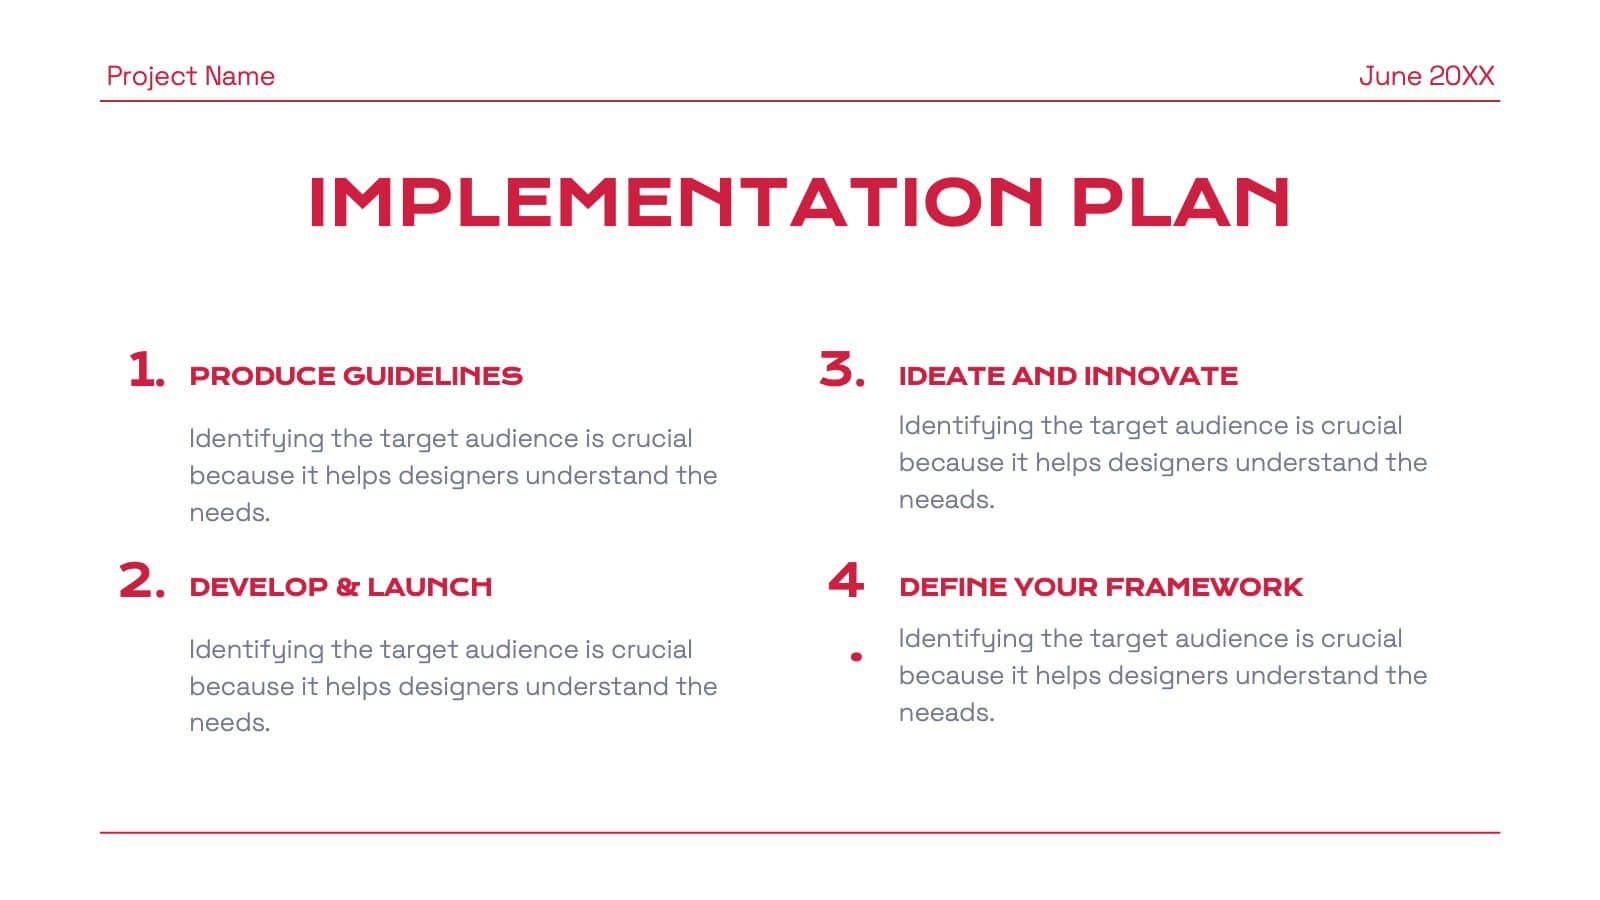
Plan your meetings with clarity and structure using the Professional Meeting Agenda Presentation. This clean, 5-step layout visually organizes agenda items alongside bold numbers and relevant icons to guide discussion. Perfect for team syncs, business reviews, or project briefings. Fully customizable in PowerPoint, Keynote, and Google Slides.


5 diapositivas
Innovative Strategic SWOT Layout
Visualize your strategic edge with the Innovative Strategic SWOT Layout Presentation. This clean, overlapping-circle design brings attention to the interconnection between Strengths, Weaknesses, Opportunities, and Threats while maintaining a minimal, modern look. Each element is paired with space for concise insights, making it perfect for leadership briefings, planning sessions, or team reviews. Fully editable in PowerPoint, Keynote, and Google Slides.


4 diapositivas
Neuroscience-Inspired Concept Mapping Presentation
Visualize abstract ideas with clarity using the Neuroscience-Inspired Concept Mapping Presentation. Featuring a head silhouette and four labeled concept nodes, this layout is perfect for connecting ideas, frameworks, or steps in a thought process. Fully editable in PowerPoint, Canva, and Google Slides for seamless customization and presentation.


4 diapositivas
Cross-Functional Role Matrix Chart Presentation
Visualize responsibilities across teams with the Cross-Functional Role Matrix Chart Presentation. This template makes it easy to map roles, tasks, or departments in a clean matrix layout. Ideal for project managers, team leaders, or operations professionals, the chart highlights role relationships and task ownership. Fully editable in Canva, PowerPoint, Keynote, and Google Slides.


23 diapositivas
Rainshadow Digital Strategy Presentation
This Digital Strategy Presentation Template is designed to provide a structured approach to planning and implementing digital initiatives. Covering essential elements such as market trends, competitive analysis, value proposition, and risk management, it offers a professional framework to align goals with actionable steps. Fully customizable and compatible with PowerPoint, Keynote, and Google Slides.


5 diapositivas
History of Vaccine Infographics
The History of Vaccines is a fascinating journey that spans centuries and has significantly impacted human health and disease prevention. With these infographic templates, you can effectively communicate the importance of vaccines, highlight their role in disease prevention, and debunk common misconceptions. It serves as an educational tool to promote understanding and appreciation for the significant advancements in vaccine development that have saved countless lives throughout history. Use these to provide a comprehensive overview of the history of vaccine and help individuals understand the importance and impact of vaccines.