


Características


¿Tienes alguna pregunta?
Recomendar


6 diapositivas
Workload Distribution and Calendar Plan Presentation
Stay on top of weekly responsibilities with the Workload Distribution and Calendar Plan Presentation. This visual planning template helps teams clearly assign tasks across days of the week, making it easy to organize schedules and boost productivity. Fully editable in PowerPoint, Keynote, and Google Slides.


5 diapositivas
Operational Workflow Process Chart Presentation
Streamline your operations with the Operational Workflow Process Chart Presentation. This template provides a clear visual layout to map out step-by-step processes, helping teams align on roles, timelines, and dependencies. Perfect for training, reporting, or system audits—fully customizable in PowerPoint, Canva, and Google Slides.


5 diapositivas
Colorful Circular Flow Chart Presentation
Bring your ideas full circle with a vibrant, energetic flow that instantly grabs attention and makes complex processes feel effortless to follow. This presentation is perfect for illustrating cycles, workflows, or interconnected stages in a clear, dynamic way. Fully compatible with PowerPoint, Keynote, and Google Slides.


4 diapositivas
Business Cycle Diagram Overview Presentation
Illustrate your business processes with this modern cycle diagram template. Designed to showcase four interconnected stages, it’s ideal for visualizing workflows, project phases, or continuous improvement models. Fully editable in Canva, PowerPoint, and Google Slides, this template helps you present complex cycles with clarity and visual impact.


5 diapositivas
Demographic and Psychographic Segments Presentation
Break down your audience with clarity using the Demographic and Psychographic Segments Presentation. This slide is ideal for showcasing four key consumer dimensions through a centered circular layout and quadrant icons. Perfect for marketing campaigns, branding strategies, and audience targeting. Fully editable in Canva, PowerPoint, Keynote, or Google Slides.


26 diapositivas
Dayne Presentation Template
This beautiful and professional Wedding Cake Template Dayne is the perfect template to boost your business with impressive wedding cake portfolio. Dayne is a great template for showing off bakers, who are sharing about wedding cakes. It also can be used for other themes, as well as personal or business. The color scheme works well with this theme. Pictures and charts are also made for easy editing as well as easy readability. The design is clean and professional looking, so clients feel comfortable and excited about their upcoming events or products. Look no further this is the one for you!


26 diapositivas
Creative Programming Presentation
The process of Developing Software involves the development of everything from a simple application or web page to complex enterprise systems. Software development is a collaborative effort between developers, designers, and other stakeholders. This Creative Template is perfect for delivering presentations about the latest projects, apps and ideas. The simple layout allows you to focus on what matters most, your idea. Make your most important presentation spectacular with this template. With high-powered visual content and a smooth flow, you’ll keep your audience engaged from beginning to end!


7 diapositivas
Abstract Business Diagrams in Geometry
Showcase your ideas with visual impact using the Abstract Business Diagrams in Geometry Presentation. This modern layout features a six-part hexagonal structure, ideal for presenting categories, segments, or processes. Each shape is numbered, icon-supported, and color-coded for clarity and emphasis. Perfect for strategy, planning, or data overviews. Fully editable in PowerPoint, Keynote, and Google Slides.


7 diapositivas
Organized Table of Content Slide Presentation
Present your topics with clarity using this Organized Table of Content Slide template. Designed for structured overviews, it features clean, modern layouts with customizable section markers and icons. Ideal for reports, proposals, and presentations. Fully editable in Canva, PowerPoint, and Google Slides to fit your brand’s style and color palette.


22 diapositivas
Quantum Scientific Research Presentation
Present your scientific research with this comprehensive and professional template! Perfect for detailing research objectives, methodology, and key findings. Ideal for researchers and academics aiming to share their work clearly and effectively. Compatible with PowerPoint, Keynote, and Google Slides, this template ensures your scientific presentations are thorough, engaging, and visually appealing.


6 diapositivas
Project Scope and Deliverables Overview Presentation
Make your project presentations flow effortlessly with a clear, structured layout that highlights goals, milestones, and deliverables. Ideal for tracking progress and aligning teams, this professional design balances clarity and style. Fully compatible with PowerPoint, Keynote, and Google Slides for smooth editing and presentation flexibility.


20 diapositivas
Lullabyne Design Portfolio Presentation
Showcase your creative work with this modern and professional design portfolio presentation. Covering essential elements like design briefs, mood boards, prototypes, and implementation plans, this template helps you present your work with clarity and style. Fully customizable and available for PowerPoint, Keynote, and Google Slides.
26 diapositivas
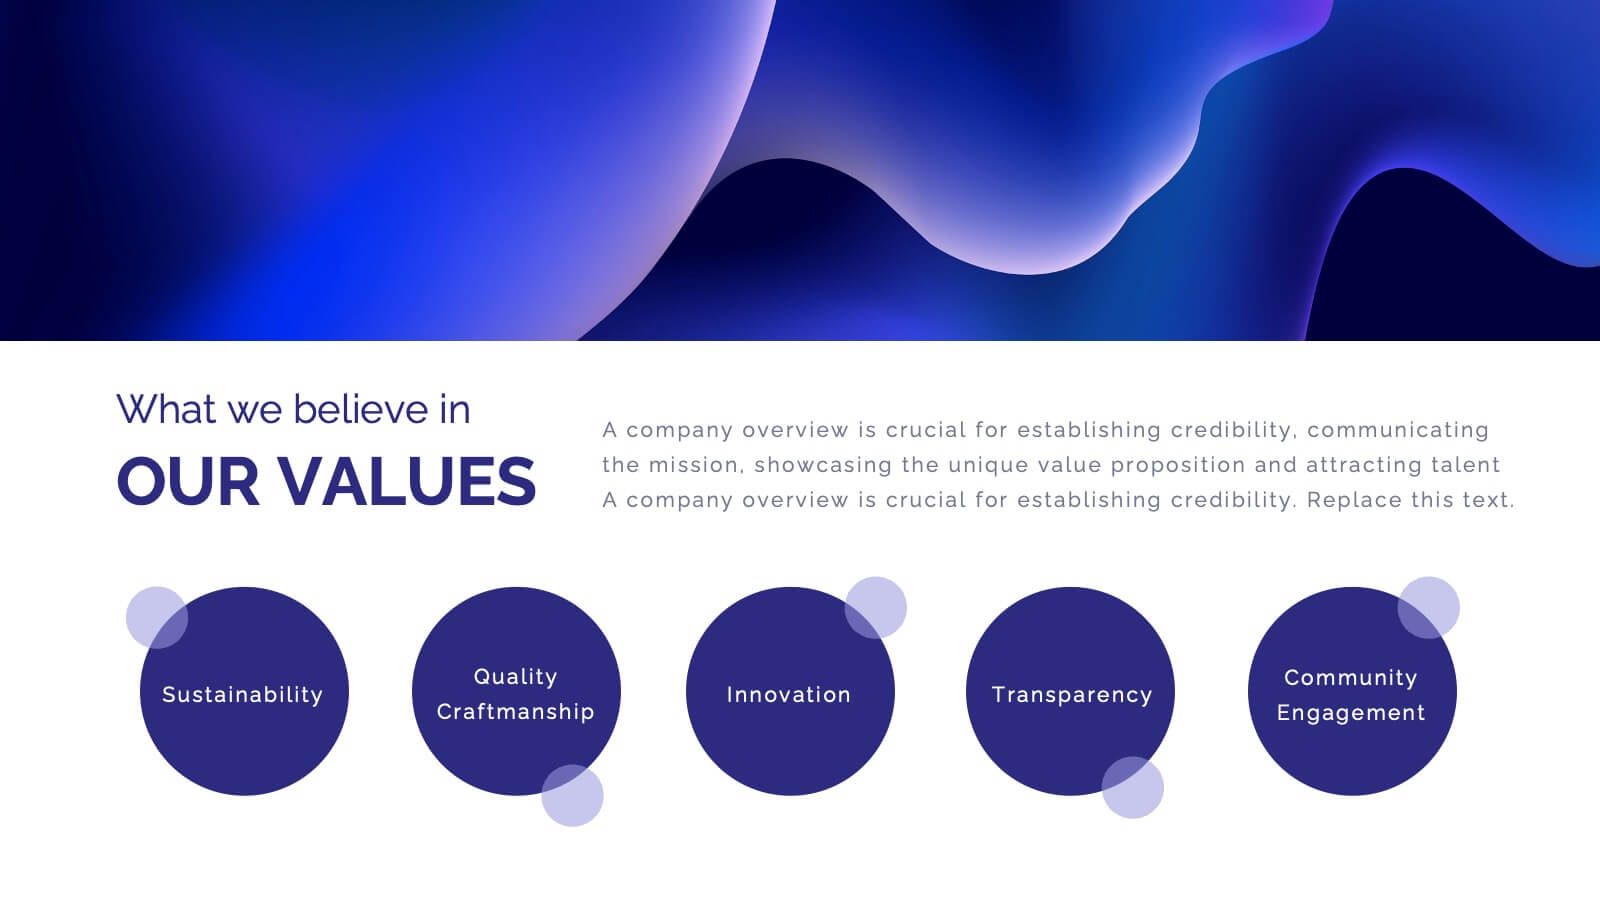
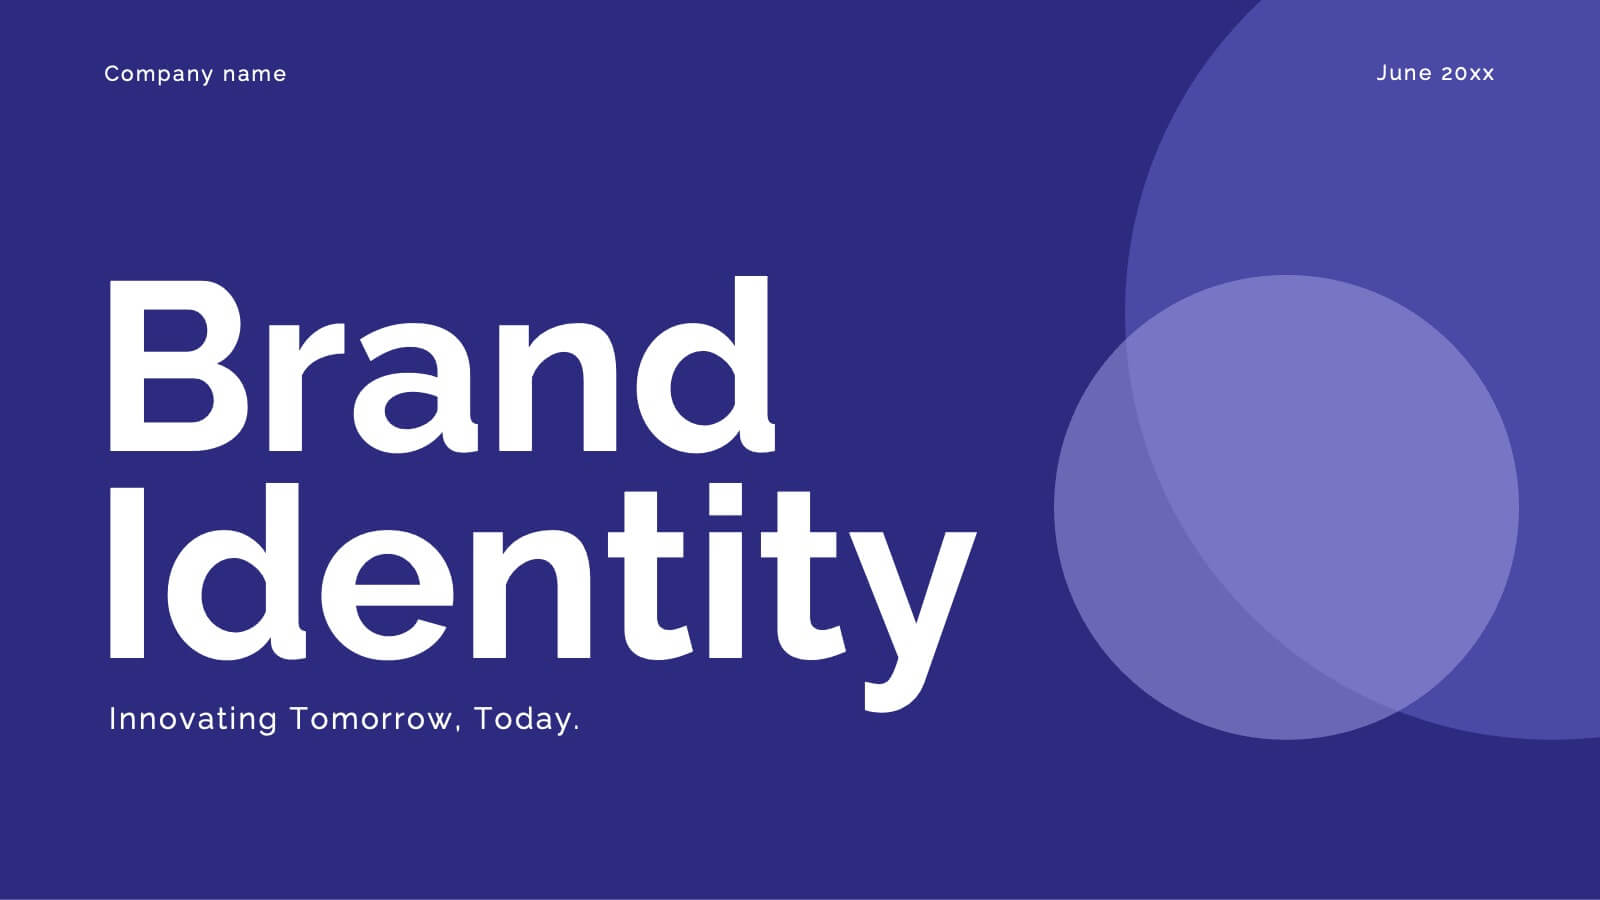
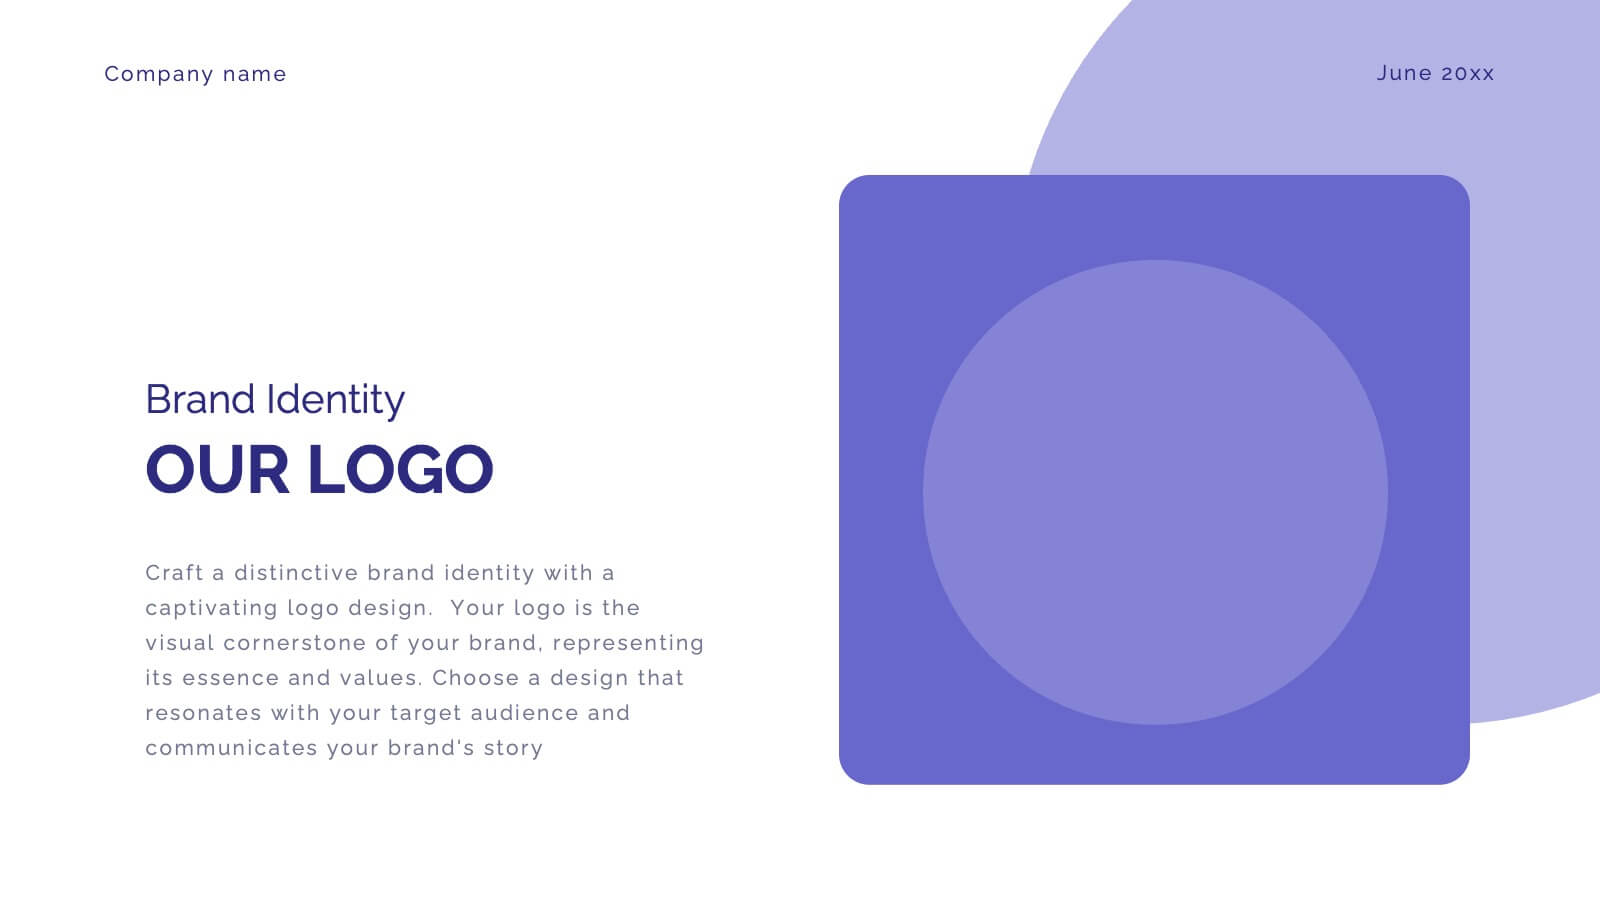
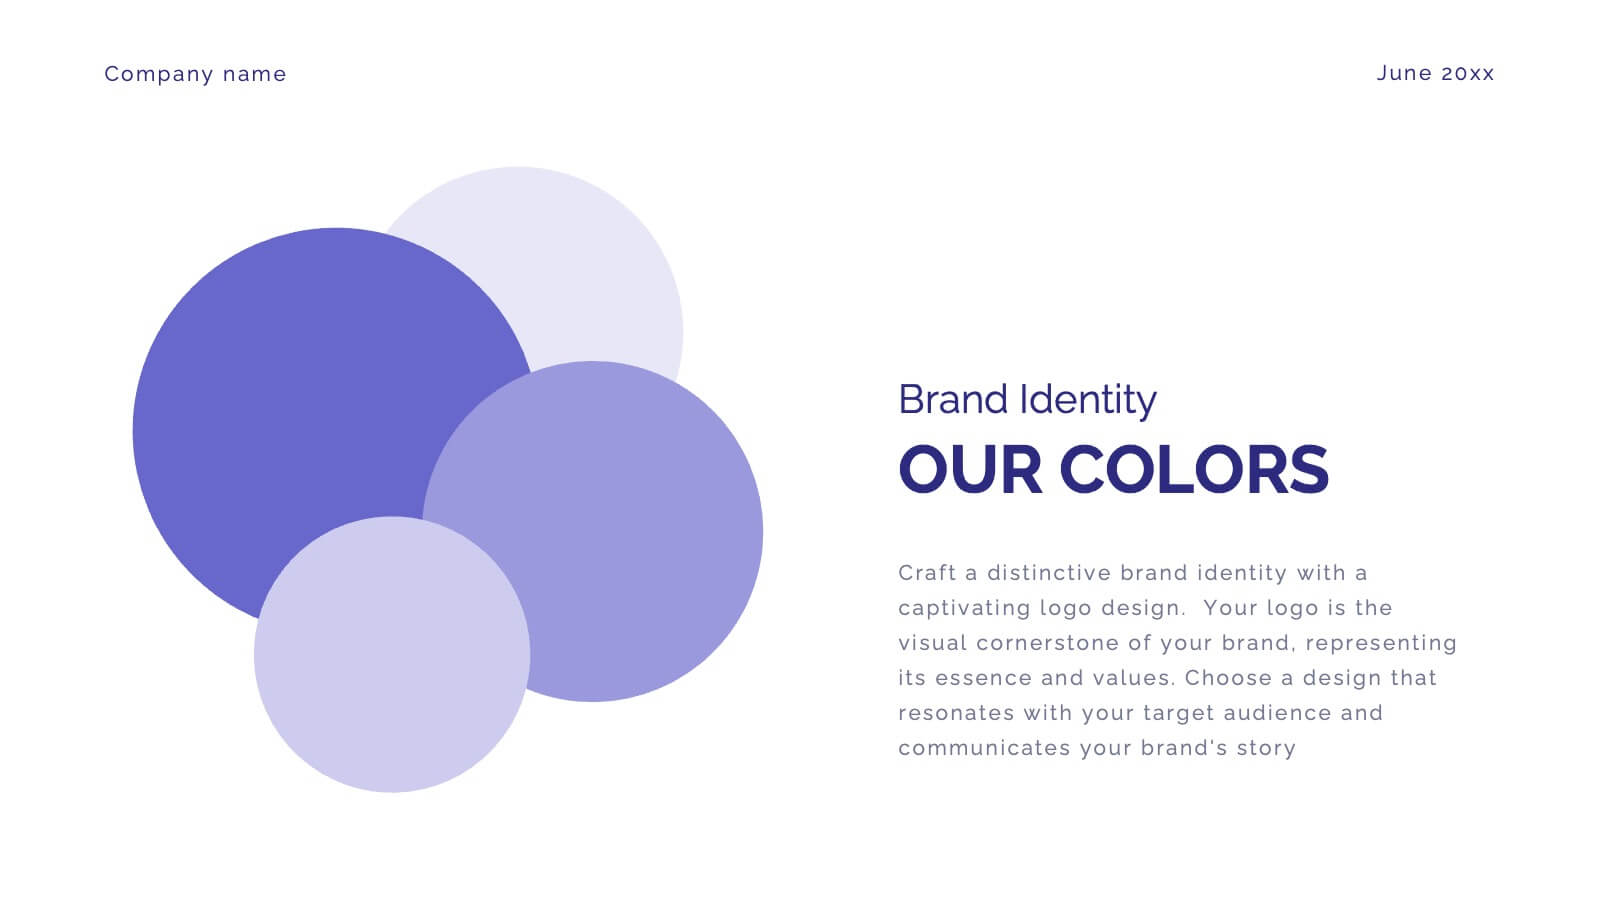
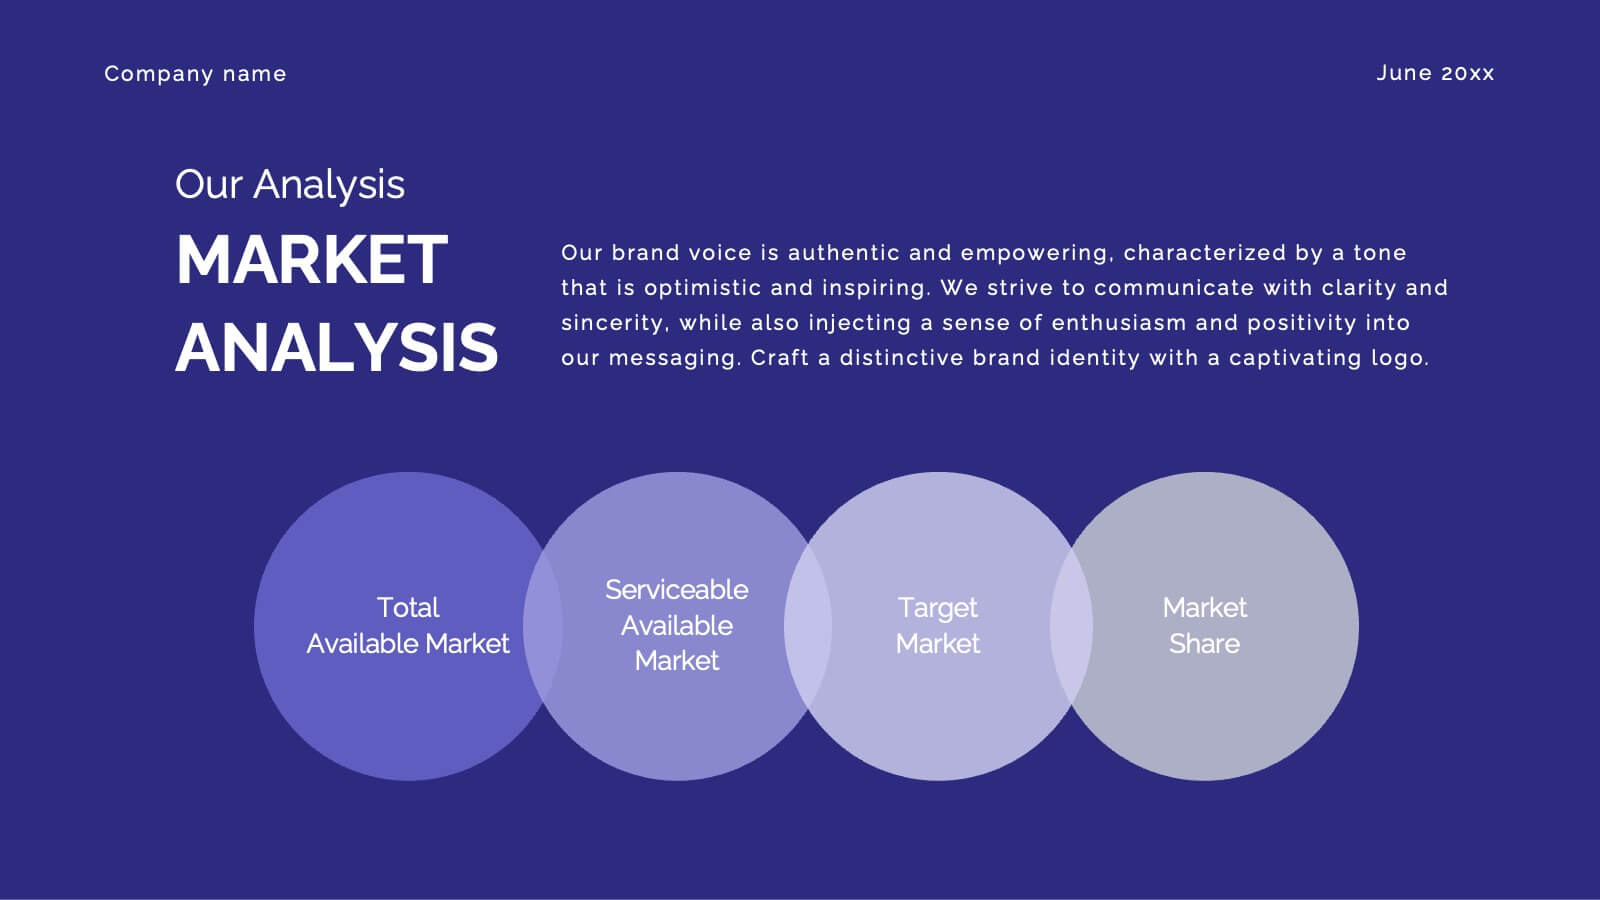
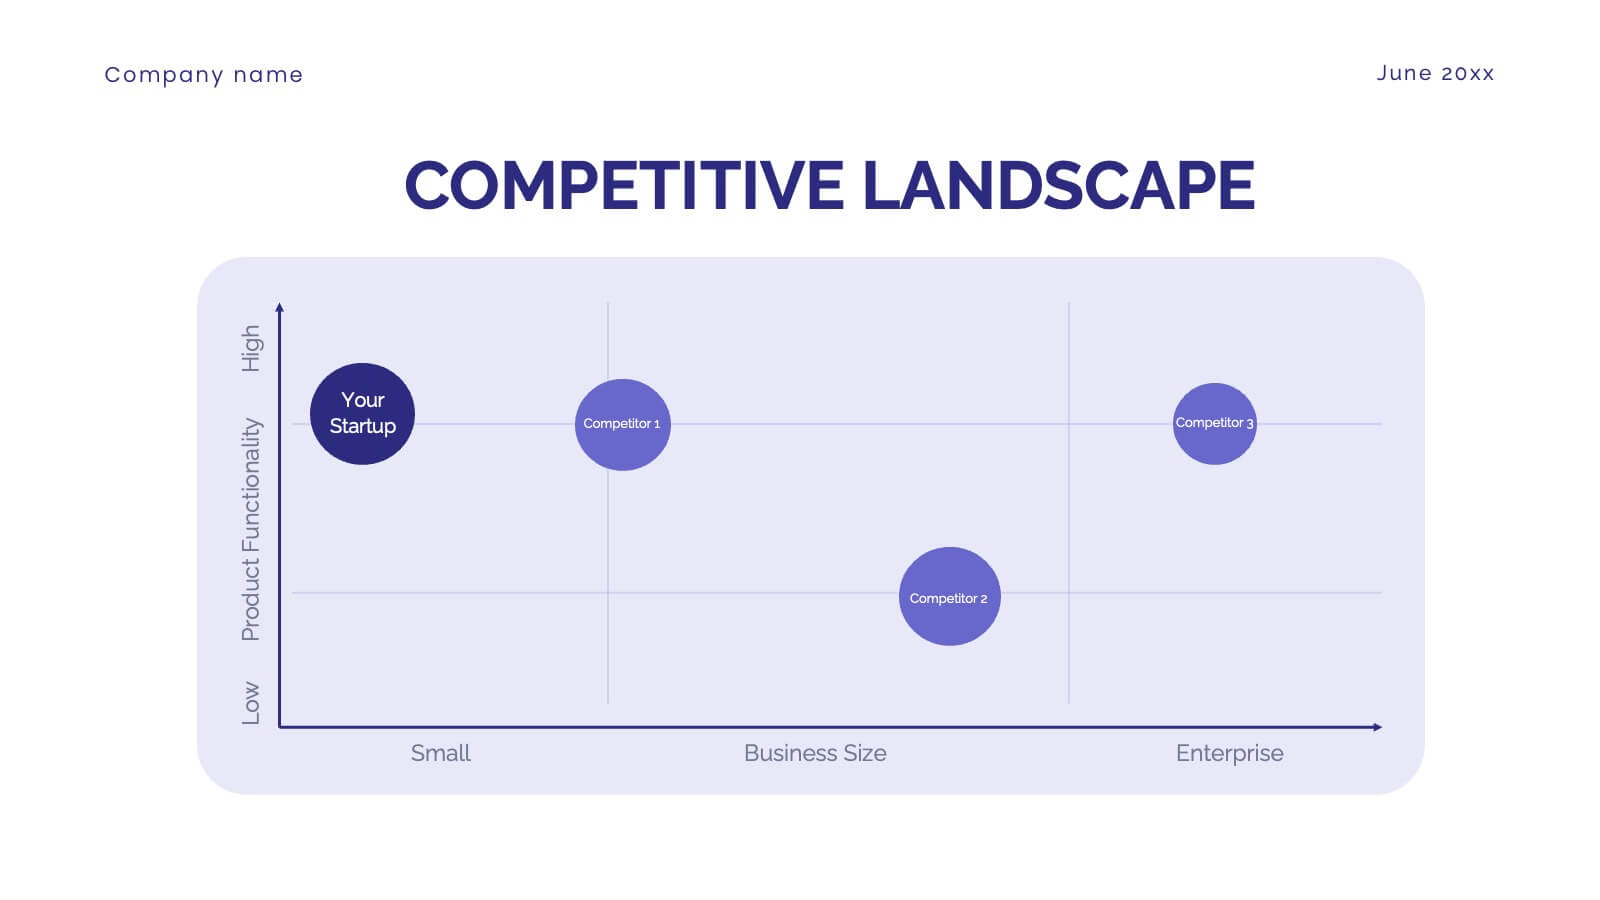
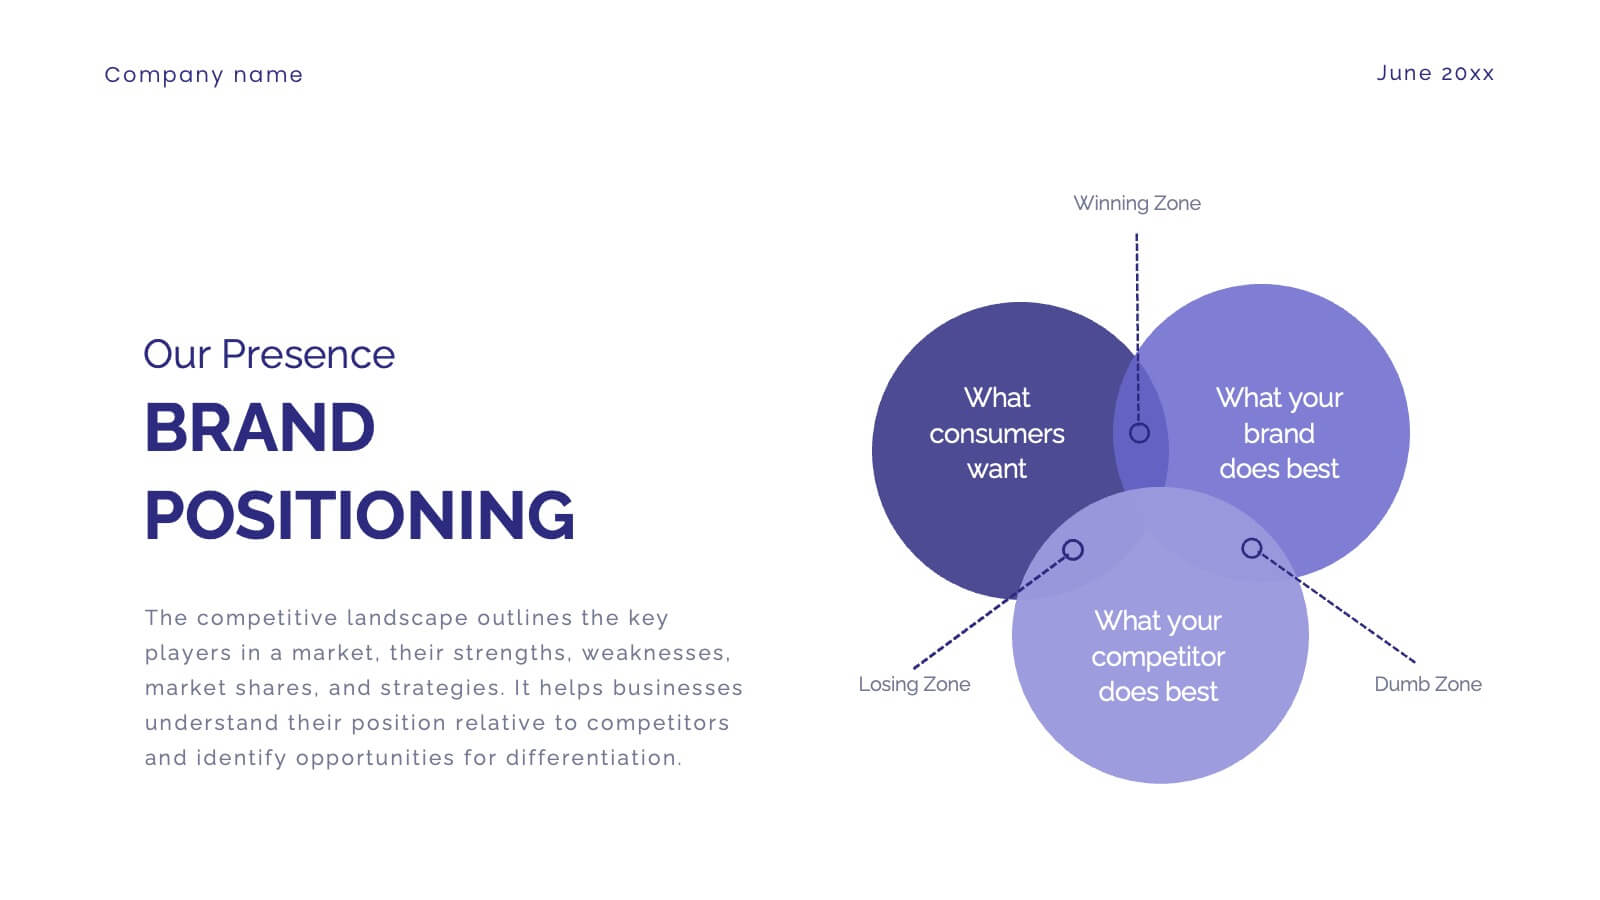
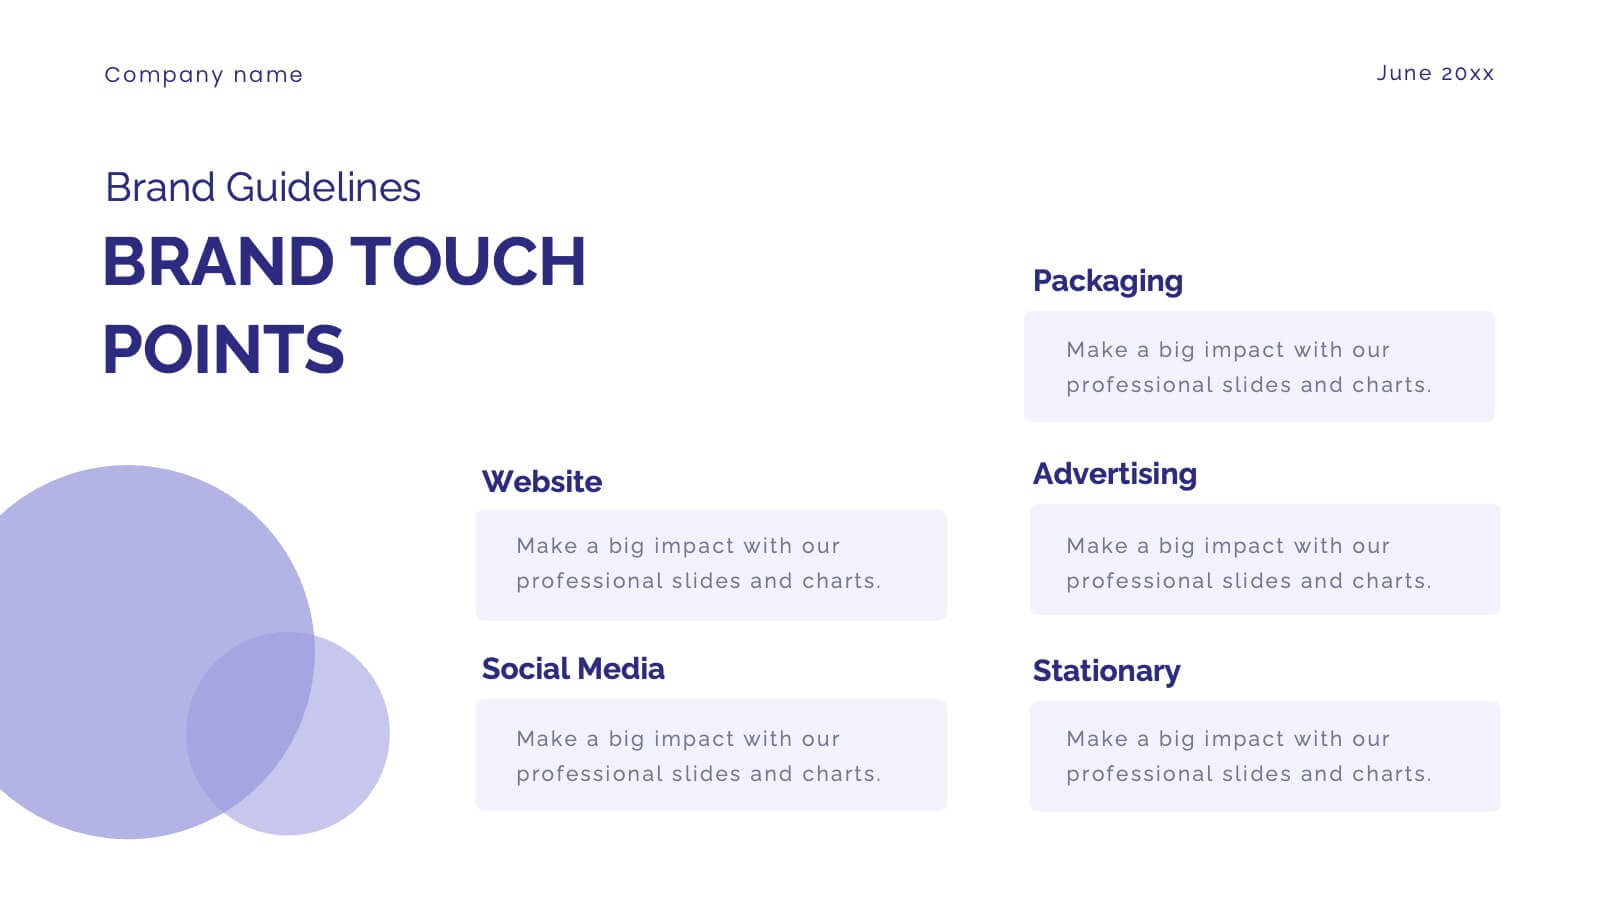
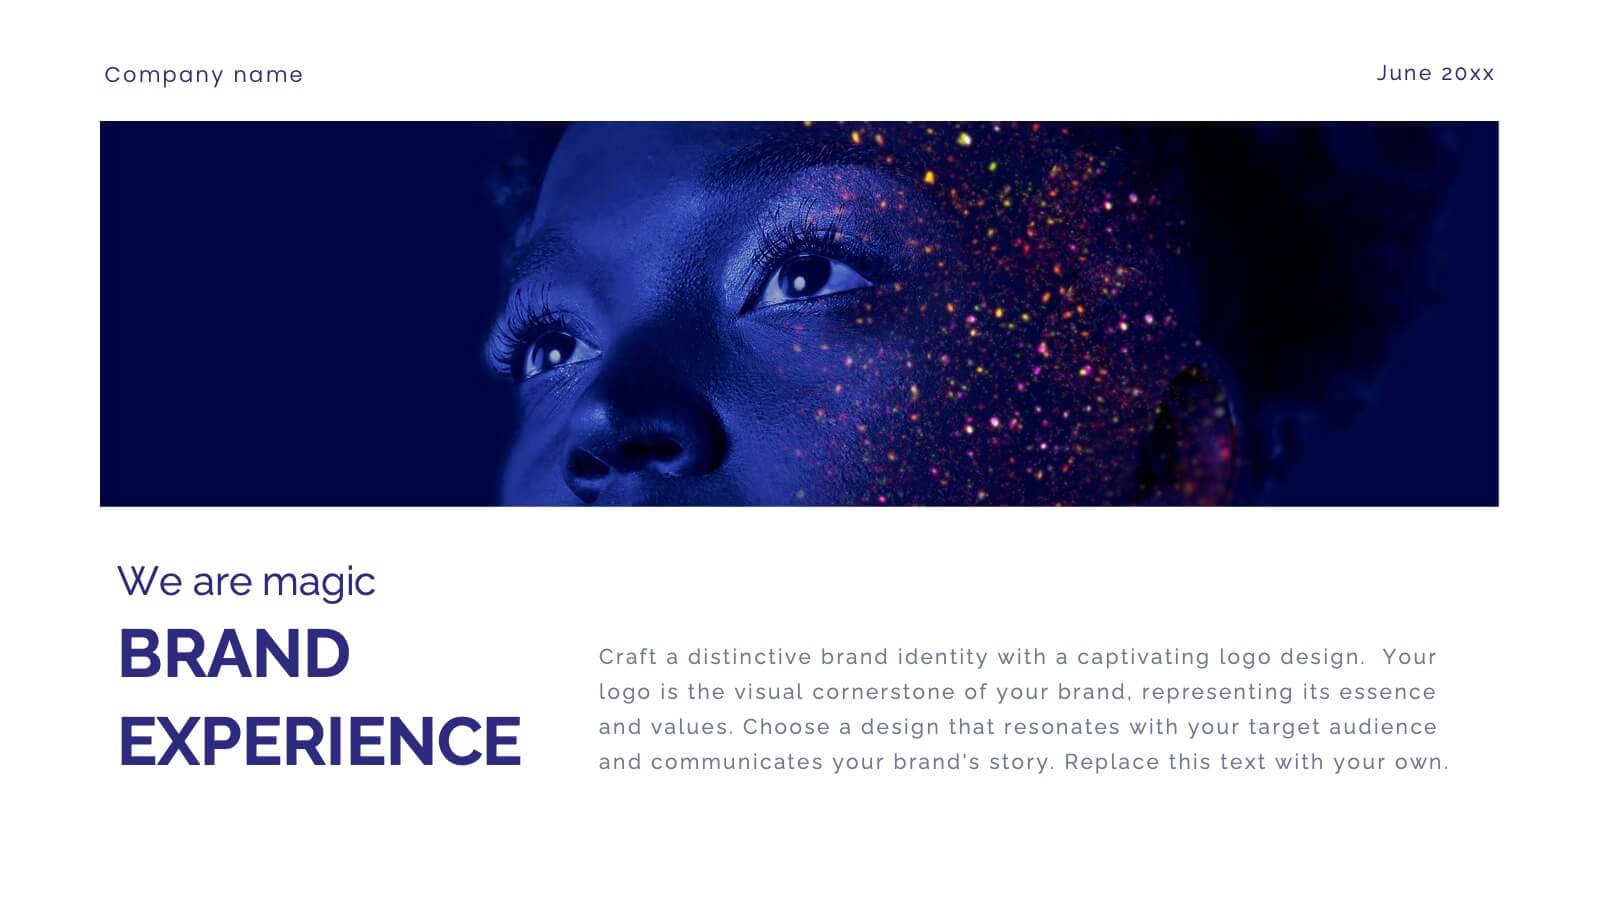
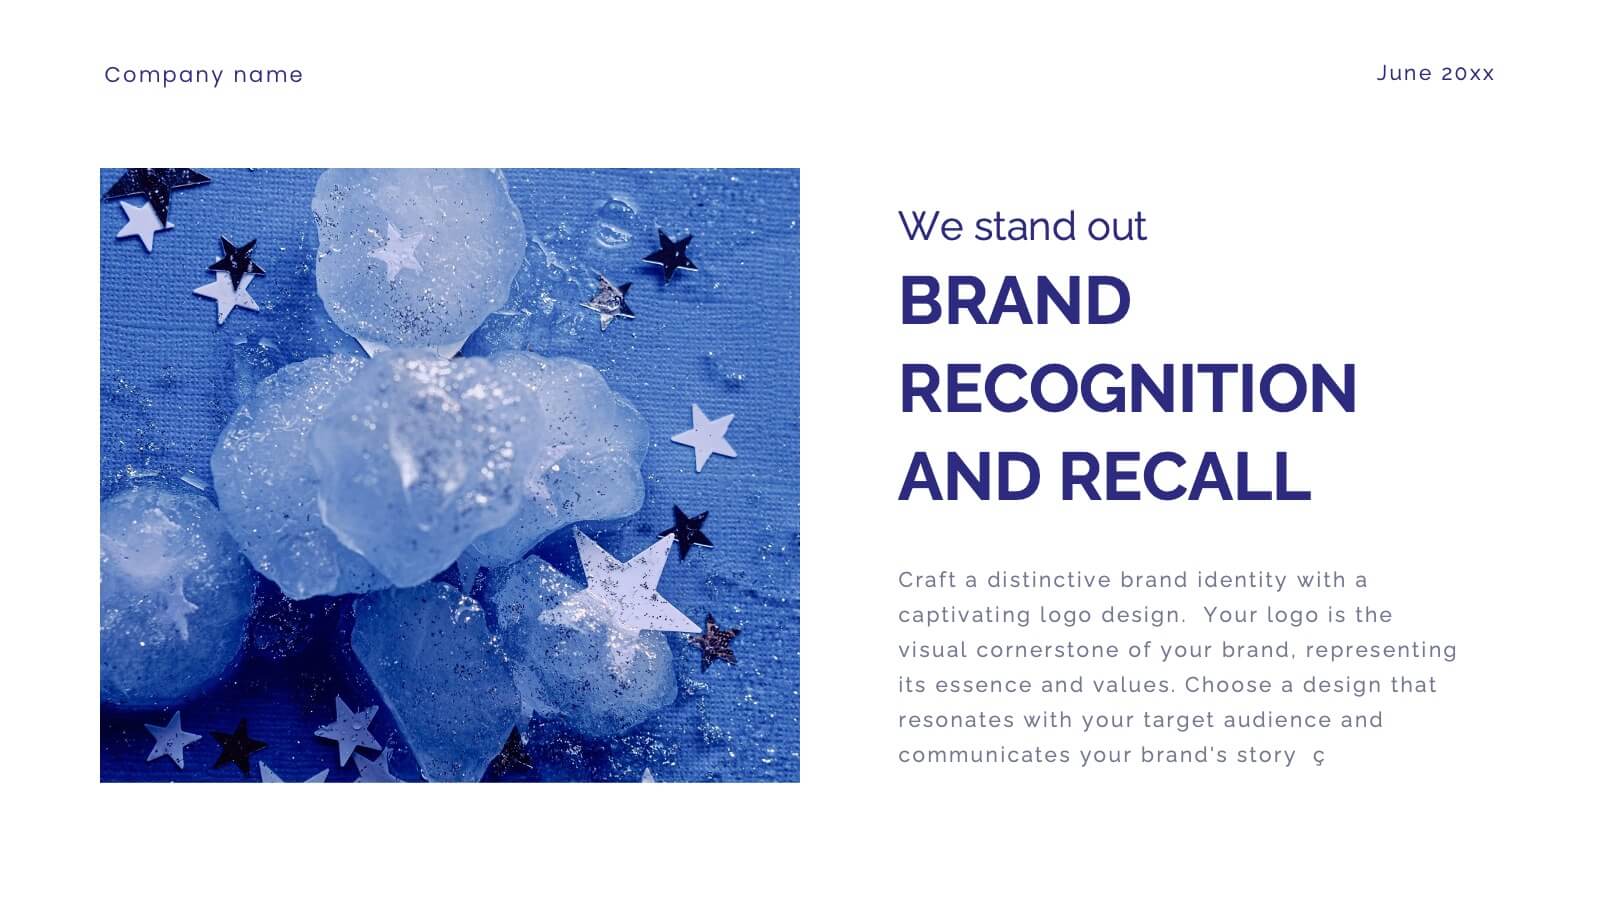
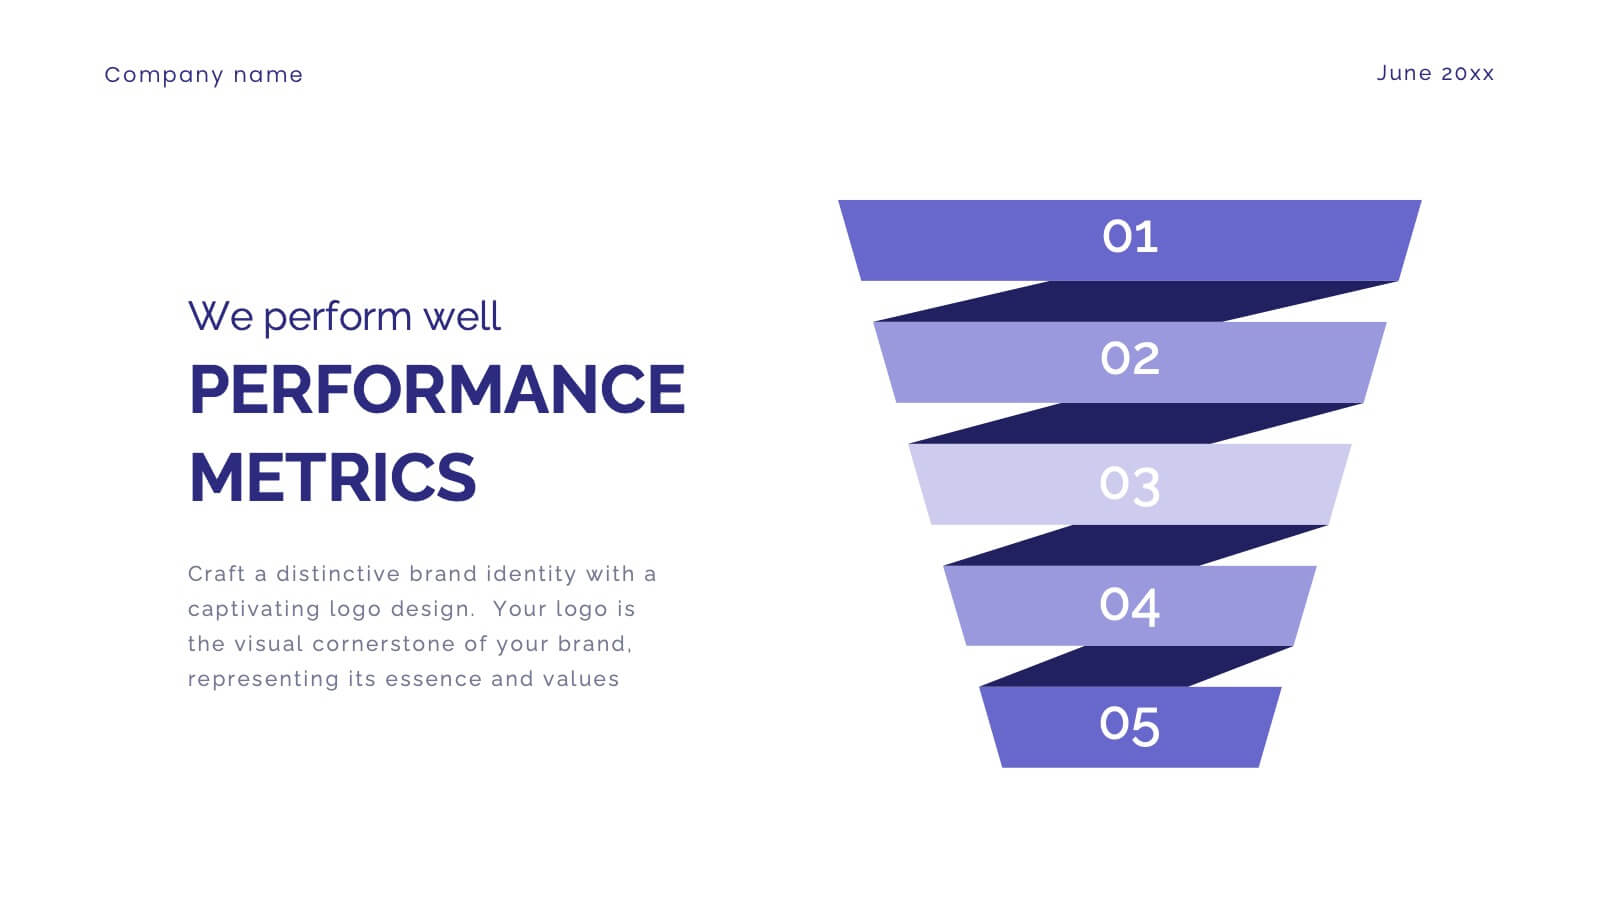
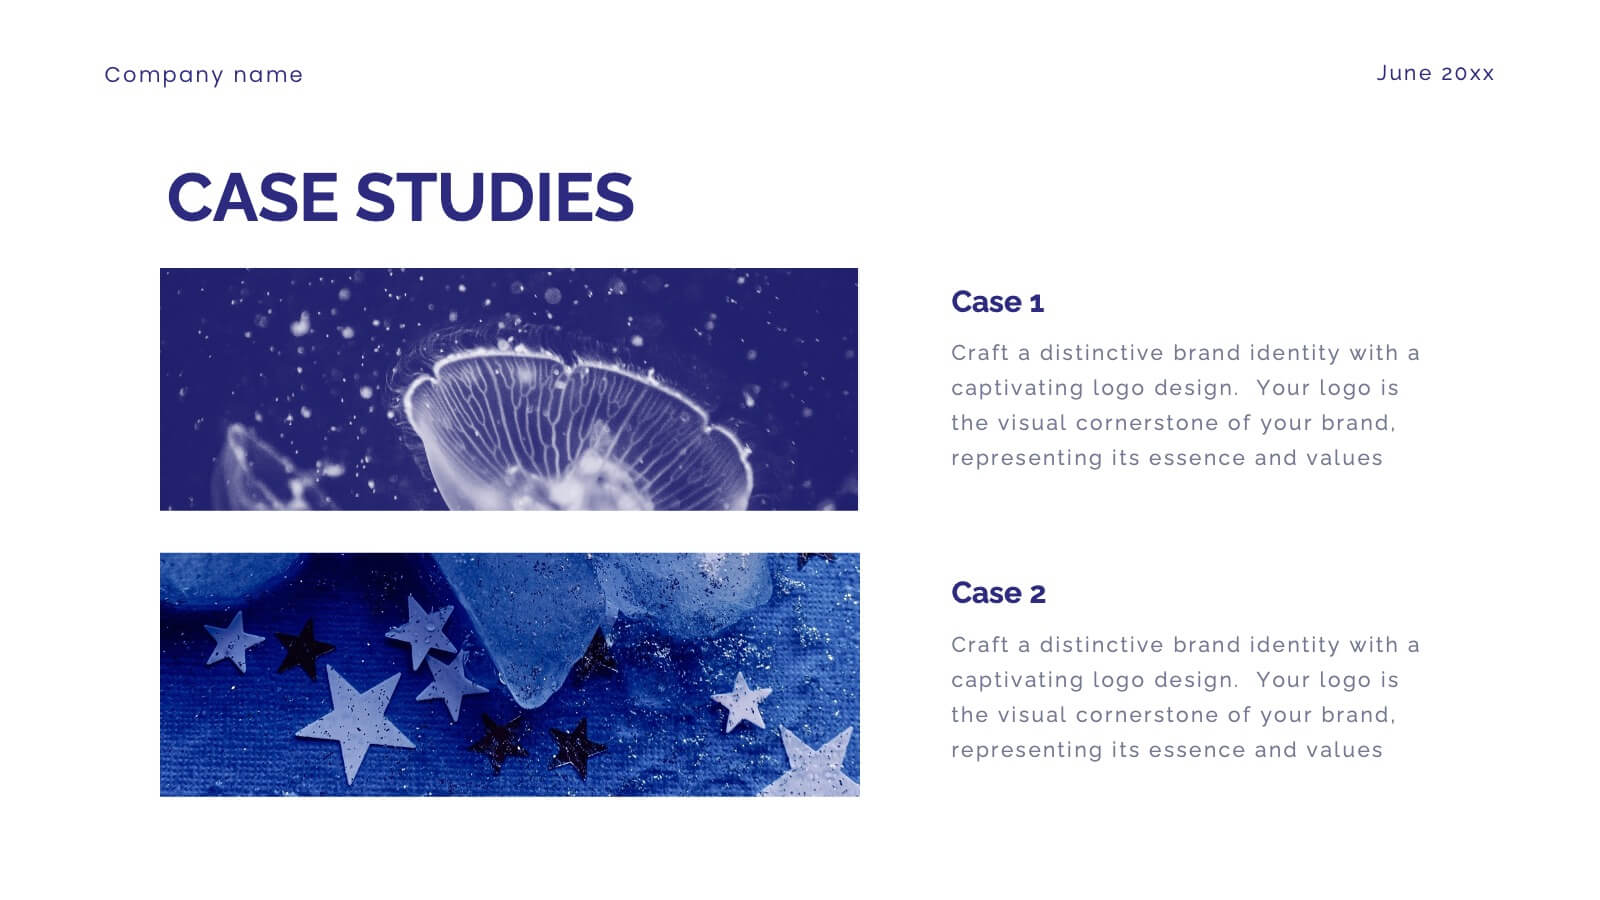
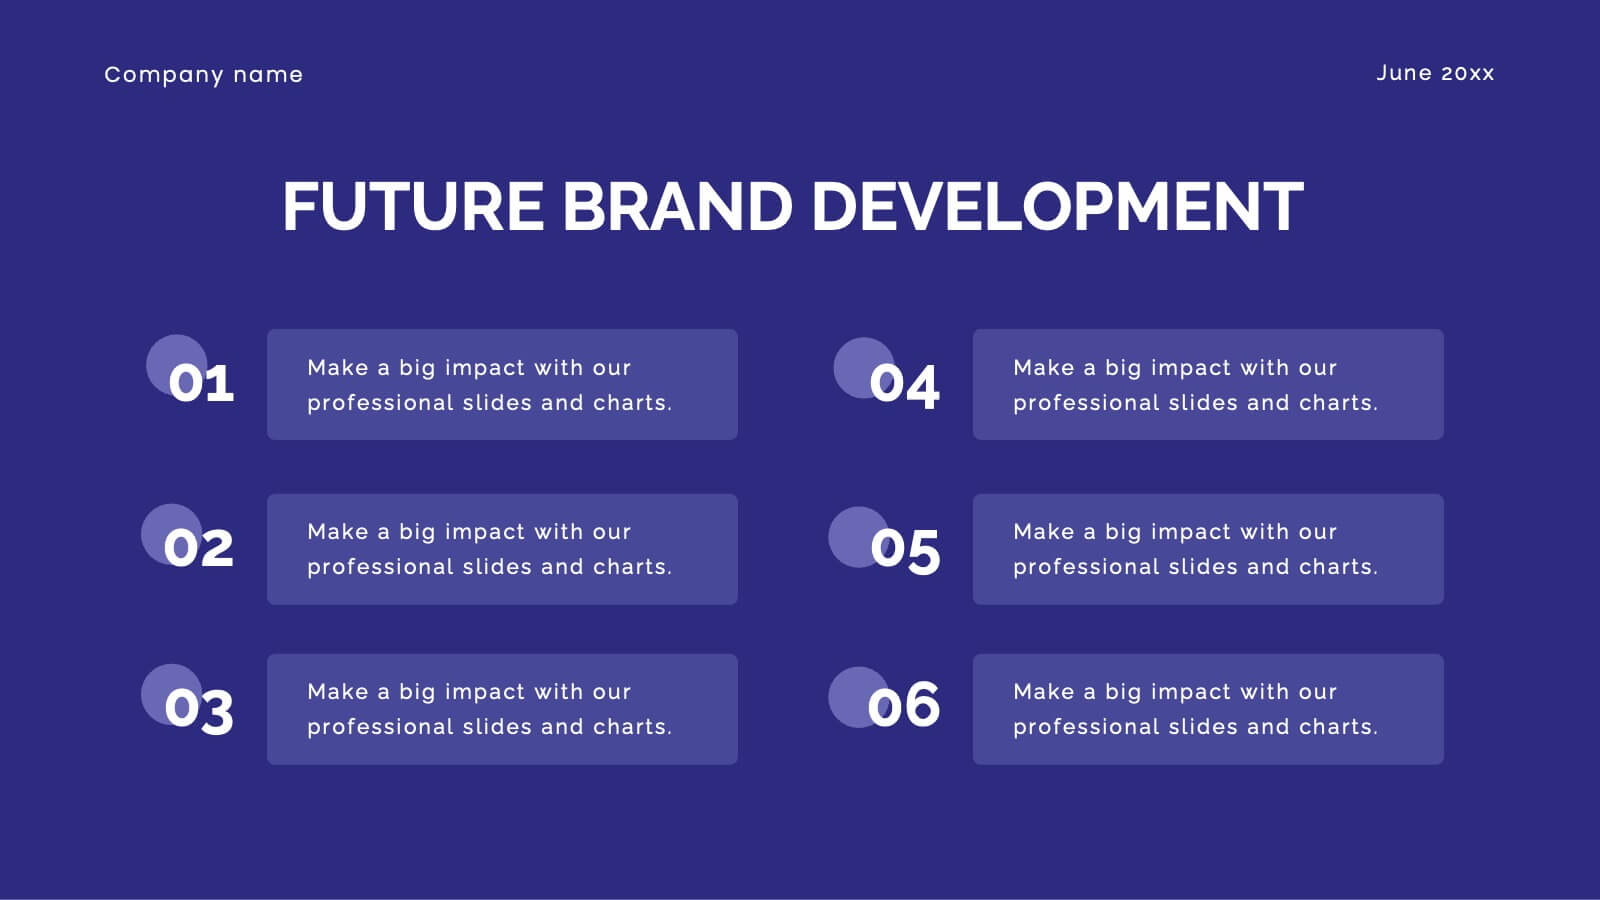
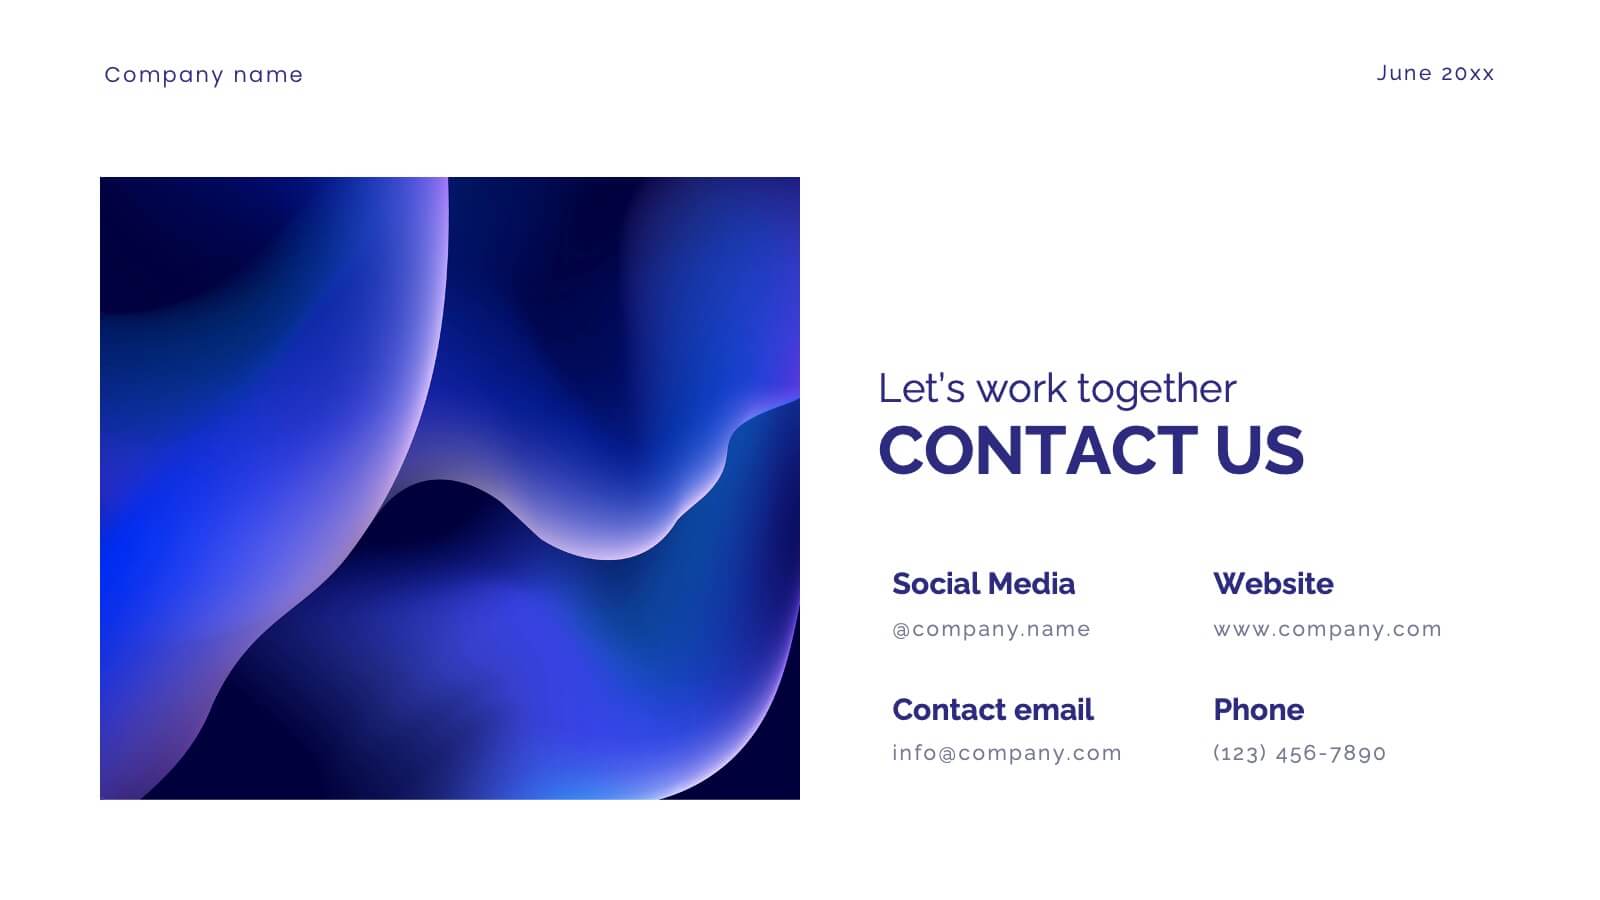
Glimmer Brand Development Pitch Deck Presentation
Elevate your brand with this comprehensive rebranding presentation template! Perfect for detailing your logo, color scheme, and market analysis, it includes slides for brand positioning, competitive landscape, and performance metrics. Engage your audience with clear visuals and structured content. Compatible with PowerPoint, Keynote, and Google Slides for seamless presentations on any platform.


4 diapositivas
Project Task Ownership with RACI Chart Presentation
Assign roles clearly with the Project Task Ownership with RACI Chart Presentation. This template simplifies responsibility mapping across tasks using the RACI framework (Responsible, Accountable, Consulted, Informed). With a clean matrix layout, it's perfect for project planning, stakeholder alignment, and workflow transparency. Fully editable in PowerPoint, Canva, and Google Slides.


10 diapositivas
Corporate Business Plan Strategy Presentation
Present your strategy with professionalism using this Corporate Business Plan slide. Designed with a handshake graphic and clean icon-labeled sections, this layout is ideal for showcasing four key pillars—such as partnerships, operations, goals, and performance. Each title is fully editable, helping you keep your message clear and concise. Compatible with PowerPoint, Keynote, and Google Slides.


6 diapositivas
Scrum Team Roles and Sprint Planning Presentation
Visualize your Agile workflow with this Scrum team diagram. Highlight roles, responsibilities, and key sprint planning phases in a clear, circular flow. Ideal for project managers, team leads, or Agile coaches. Fully editable in PowerPoint, Keynote, and Google Slides to support your software development or Agile training presentations.


6 diapositivas
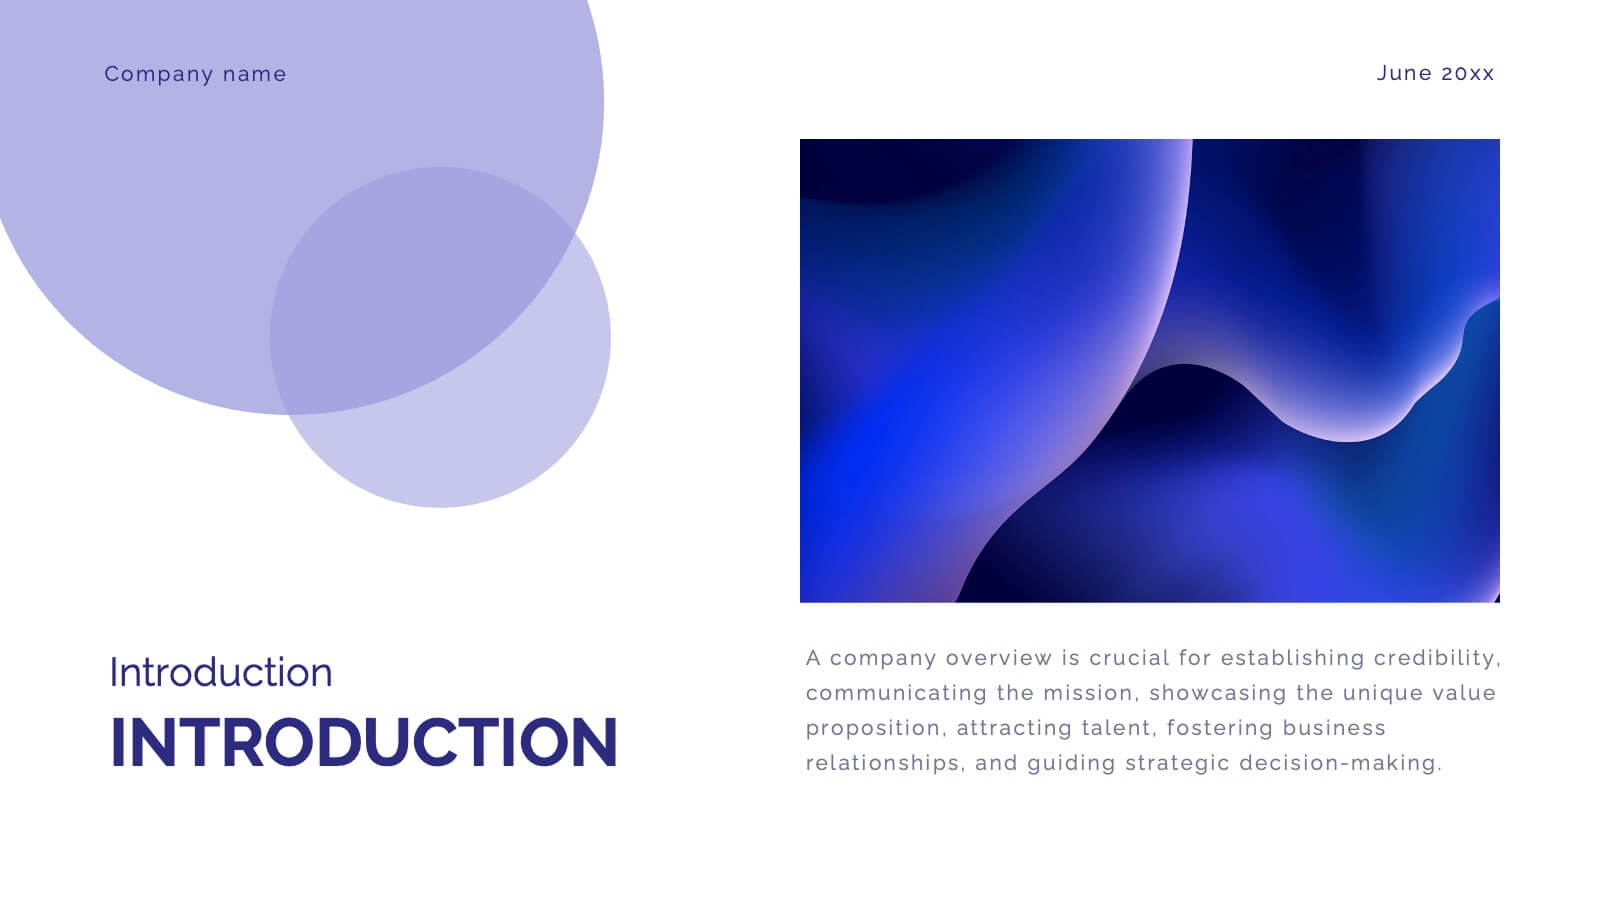
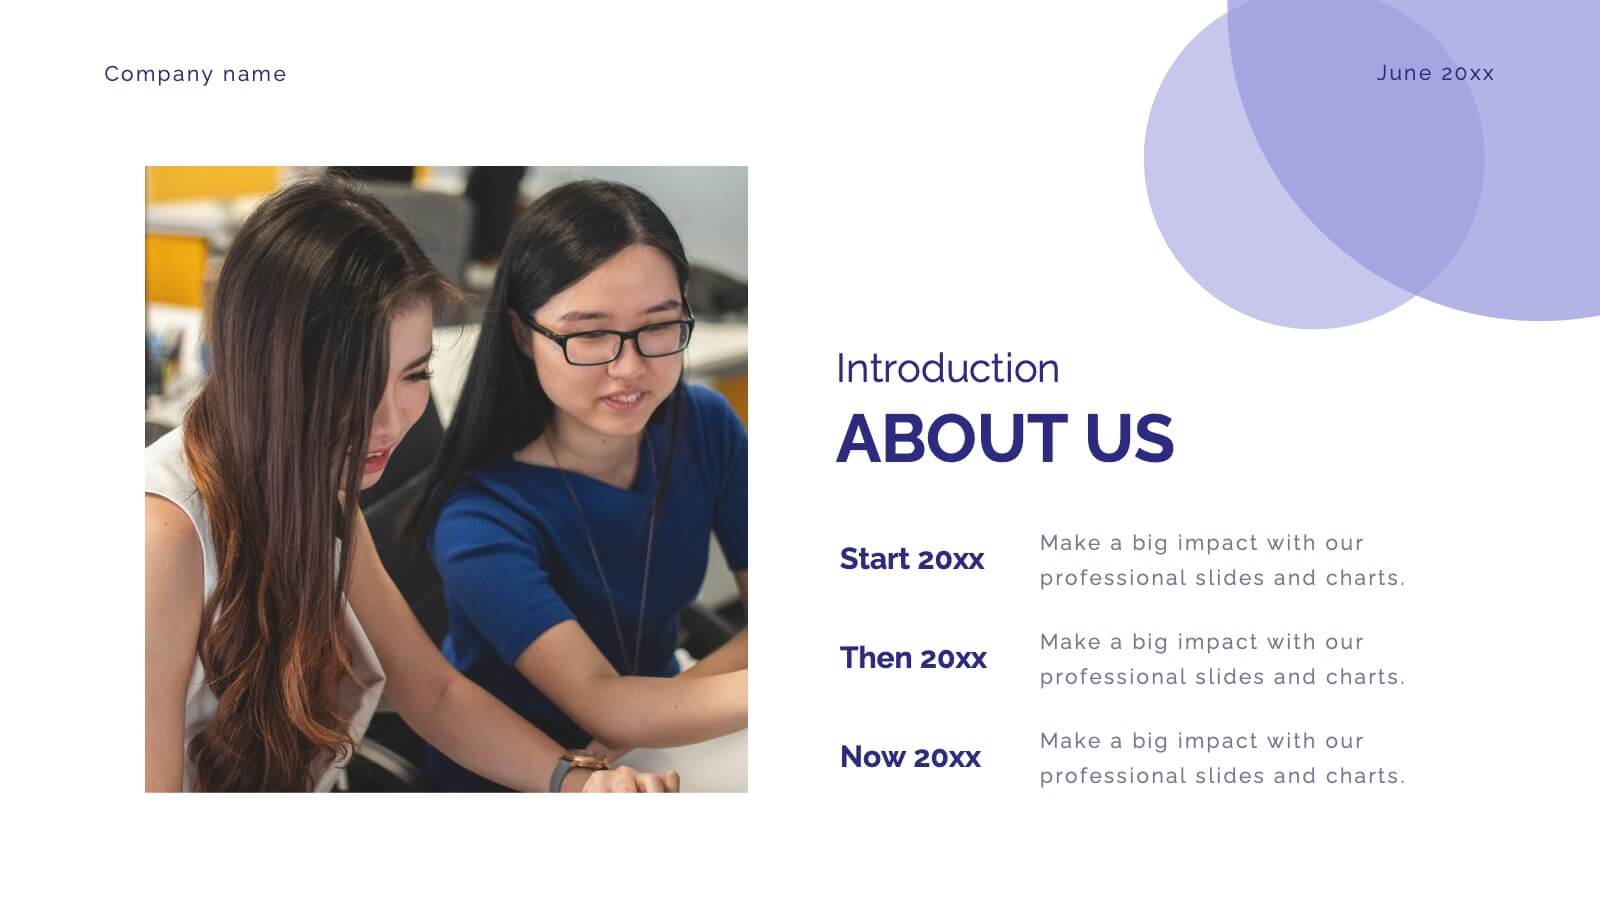
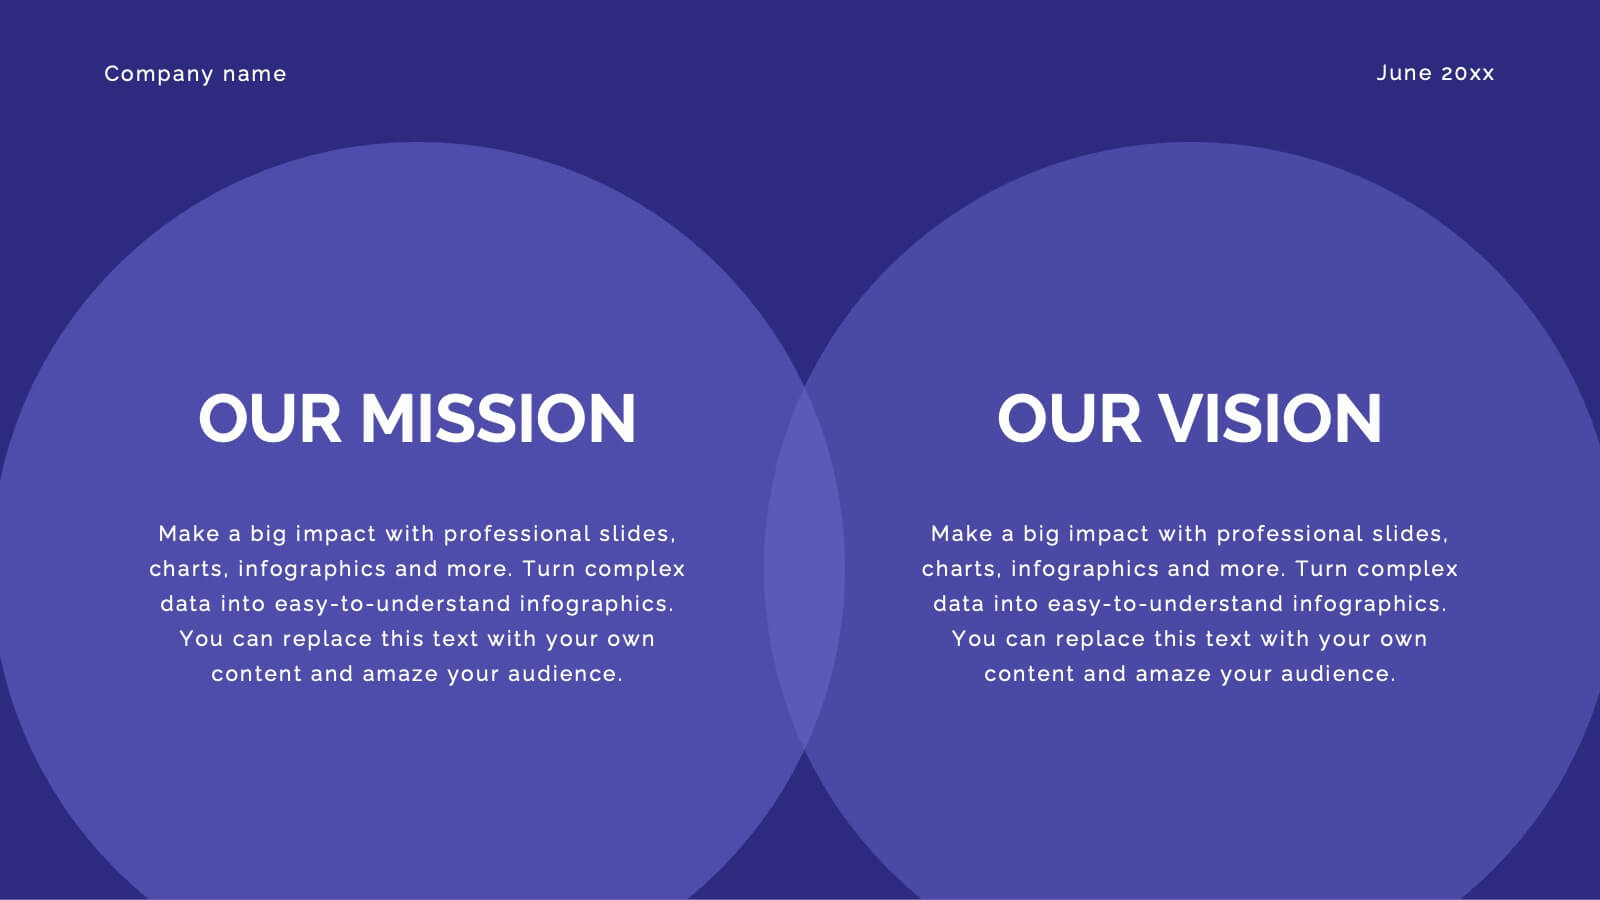
Business Funding Pitch Deck Presentation
Secure funding with confidence using this Business Funding Pitch Deck template. Designed to communicate your business model, growth potential, and financial strategy, it helps you make a strong case to investors. Engage your audience with a clear, structured layout. Fully compatible with PowerPoint, Keynote, and Google Slides for effortless customization.