


Características


¿Tienes alguna pregunta?
Recomendar


7 diapositivas
Startup Infographic Presentation Template
A Startup Infographic is a visual representation of information related to starting a new business, including important data, statistics, and information about the process of launching a startup company. The aim of our startup infographic is for you to present information in an easily digestible and visually appealing manner. Help to communicate complex concepts to an audience and the steps involved in starting a new business. Use this template to make presentations that’ll blow your audience away. This layout is flexible, adaptable and compatible with Powerpoint, Keynote, and Google Slides.


5 diapositivas
Four-Part Puzzle Business Integration
Unify complex components with the Four-Part Puzzle Business Integration Presentation. This gear-inspired design uses interlocking puzzle visuals to symbolize collaboration, systems thinking, or functional alignment. Each quadrant is paired with an icon and description area—ideal for presenting departments, initiatives, or integration steps. Fully customizable in PowerPoint, Keynote, and Google Slides.


7 diapositivas
Concentric Circles Report Infographic
Concentric circles are a set of circles that share the same center but have different radii. This infographic template offers an innovative and visually appealing way to present complex data or concepts, allowing you to peel back layers of insights like the concentric circles themselves. This showcases how concentric circles can elegantly represent complex data, breaking it down into easily digestible layers. Compatible with Powerpoint, Keynote, and Google Slides. This gives you the ability to easily include tips and insights on how to design and customize concentric circles to suit specific data and reporting needs.


4 diapositivas
Strategic Planning Spider Diagram
Visualize strategic goals with clarity using the Strategic Planning Spider Diagram Presentation. This template leverages a radial layout to assess and compare up to four focus areas, such as vision alignment, resource allocation, stakeholder engagement, and performance metrics. The spider chart structure helps you map gaps or growth across each strategic axis. Ideal for planning sessions, board reviews, or team briefings. Fully customizable in PowerPoint, Keynote, and Google Slides.


4 diapositivas
Comparison Tables Slide Presentation
Make your insights instantly comparable with a clean layout designed to highlight differences and advantages with ease. This presentation helps you break down options, features, or plans in a clear visual table your audience can understand at a glance. Fully compatible with PowerPoint, Keynote, and Google Slides.


5 diapositivas
Strategic Growth Next Steps
Highlight your business roadmap with this rocket-themed infographic tailored for strategic growth. Ideal for showcasing step-by-step initiatives or departmental alignment, it features five labeled stages with ample space for insights and icons. Fully editable in PowerPoint, Keynote, and Google Slides—perfect for growth strategy, planning, or vision-setting decks.


7 diapositivas
KPI Software Dashboard Infographic
Maximize the effectiveness of your performance analysis with our KPI Software Dashboard infographic, optimized for use in Powerpoint, Keynote, and Google Slides. This dynamic infographic is an indispensable tool for business analysts, project managers, and data-driven professionals seeking to present key performance indicators (KPIs) in an insightful and engaging manner. Our KPI Software Dashboard infographic offers a clear, visual representation of critical data points that influence business decisions. With its diverse array of charts, graphs, and meters, it provides an at-a-glance overview of company performance across various metrics. The design is tailored to enhance readability and comprehension, allowing your audience to quickly grasp complex data trends and patterns. Whether you're reviewing sales figures, monitoring customer satisfaction, or tracking project progress, this infographic is designed to streamline the presentation of your data. The compatibility with popular presentation platforms ensures a smooth integration into your slide deck, making it a breeze to communicate the insights that matter. Utilize this infographic to turn your KPI data into compelling narratives that drive strategic business actions.


6 diapositivas
Circular Business Wheel Model Presentation
Break down your strategy into dynamic segments with this Circular Business Wheel Model. This layout is ideal for showcasing interconnected business areas like sustainability, innovation, monetization, and market appeal. Perfect for strategy decks, business planning, and growth presentations. Compatible with PowerPoint, Keynote, and Google Slides—fully editable for your needs.


7 diapositivas
Home Buyer Checklist Infographic
Step into your dream home with confidence using our Home Buyer Checklist Infographic Template. This visually engaging guide is meticulously designed to streamline the home-buying process, making it transparent and manageable for first-time buyers and seasoned investors alike. This template provides a comprehensive checklist that covers every important aspect of home buying, from budgeting and financing to inspecting and closing. Its intuitive layout and vibrant design elements make complex tasks approachable and easy to understand, ensuring you don’t miss a beat on your journey to homeownership. Tailor each slide to your specific needs by customizing colors, text, and graphics to reflect your personal style or brand identity. Ideal for real estate agents, mortgage advisors, and educational workshops, this template empowers users to navigate the maze of real estate transactions with ease and assurance.


6 diapositivas
Project Scope and Deliverables Overview Presentation
Make your project presentations flow effortlessly with a clear, structured layout that highlights goals, milestones, and deliverables. Ideal for tracking progress and aligning teams, this professional design balances clarity and style. Fully compatible with PowerPoint, Keynote, and Google Slides for smooth editing and presentation flexibility.


6 diapositivas
Empathy to Prototype Framework Presentation
Transform ideas into real-world solutions with a clear, step-by-step framework that connects creativity with action. This presentation helps you visualize each stage of innovation—from understanding users to testing prototypes—in a professional, engaging way. Fully compatible with PowerPoint, Keynote, and Google Slides for effortless customization and presentation.


22 diapositivas
Arcflare Digital Agency Strategy Plan Presentation
Create a powerful strategy with this digital agency plan presentation! It features key sections like market analysis, industry trends, campaign execution, and client testimonials, helping you communicate your approach clearly. Perfect for strategy meetings or client pitches, this template is fully compatible with PowerPoint, Keynote, and Google Slides.


7 diapositivas
Ecology Infographic Presentation Template
An Ecology Infographic is a visual representation of information and data related to ecology and the environment. This template is designed in the form of charts, graphs, diagrams, illustrations, and other elements, and is made to make complex information about the environment and ecology easier to understand and more engaging. The goal of this ecology infographic template is to provide clear, concise, and visually appealing information about various environmental issues, such as climate change, pollution, habitat destruction, and other topics related to the health of our planet.

23 diapositivas
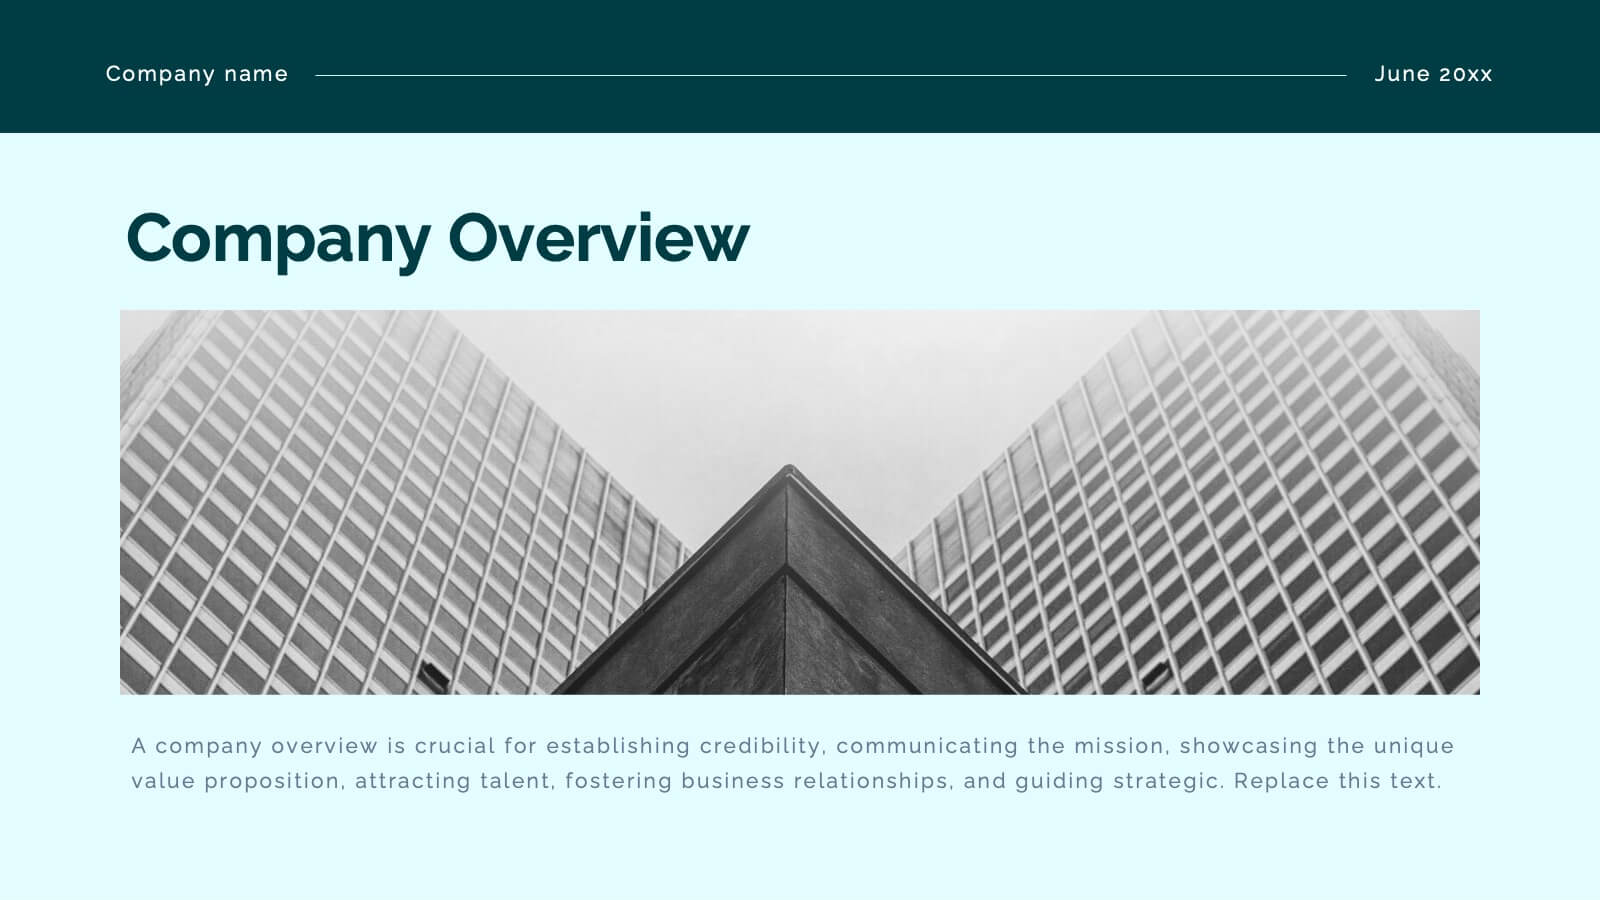
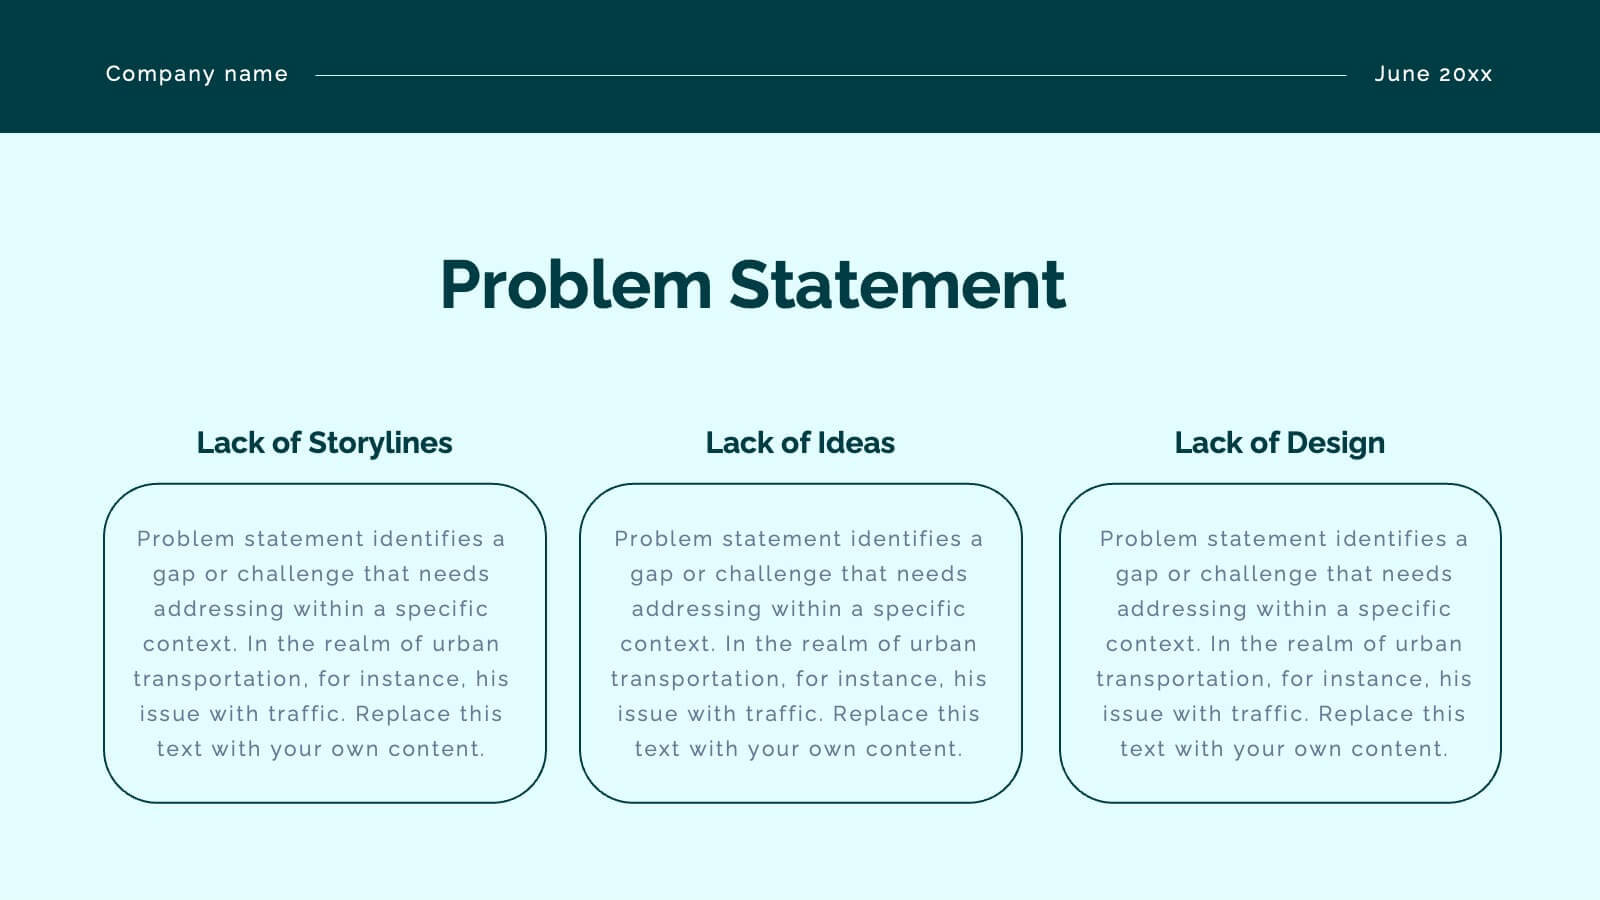
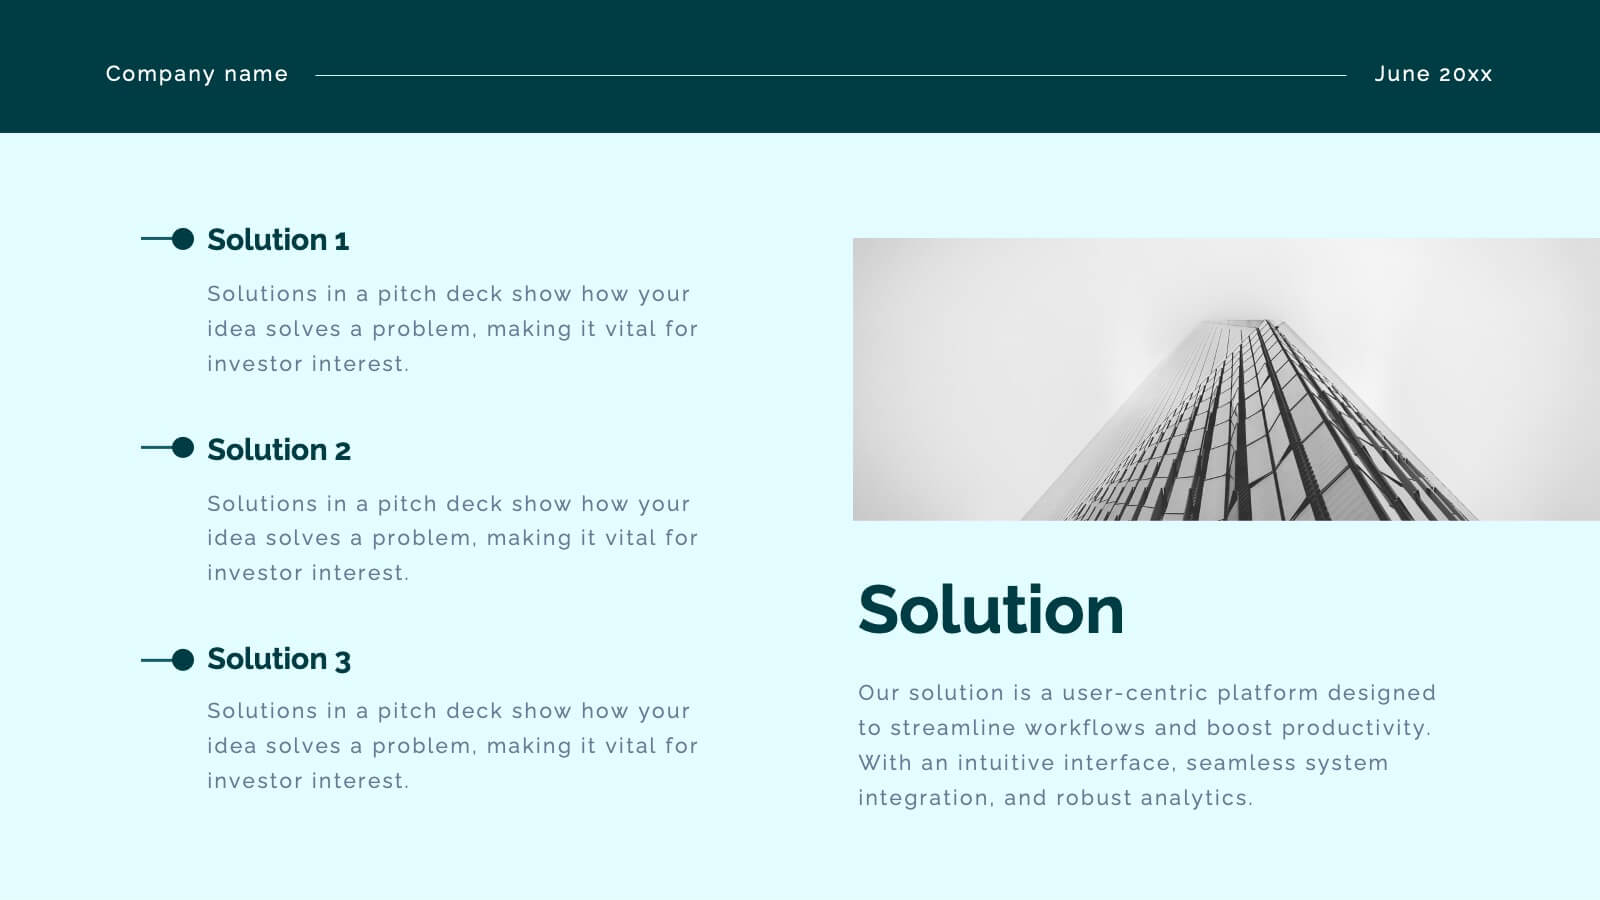
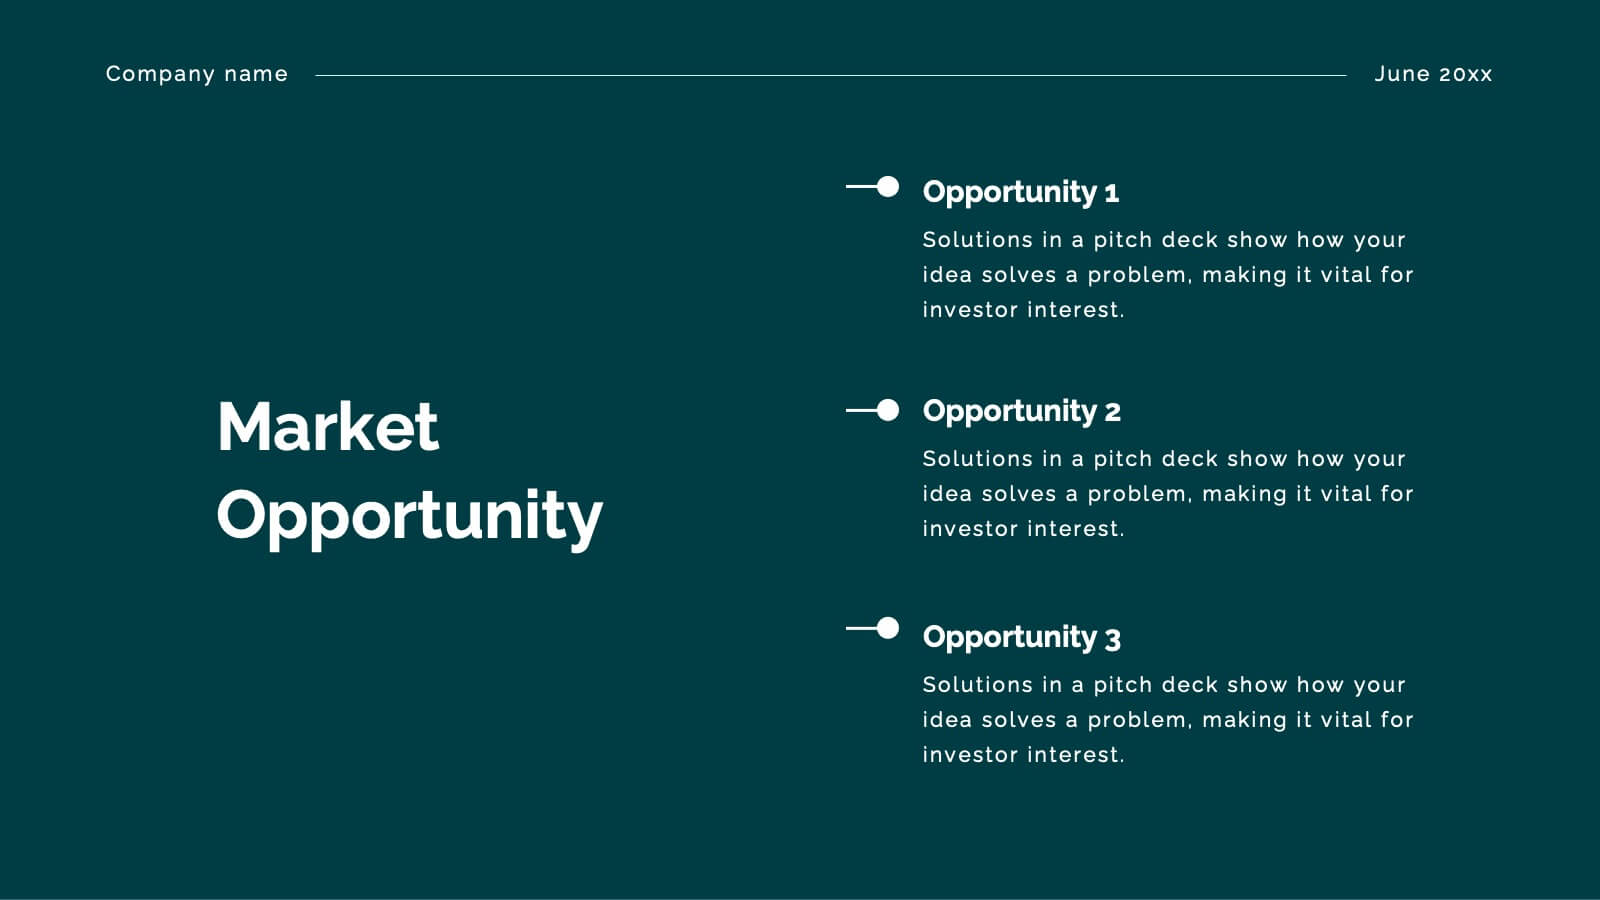
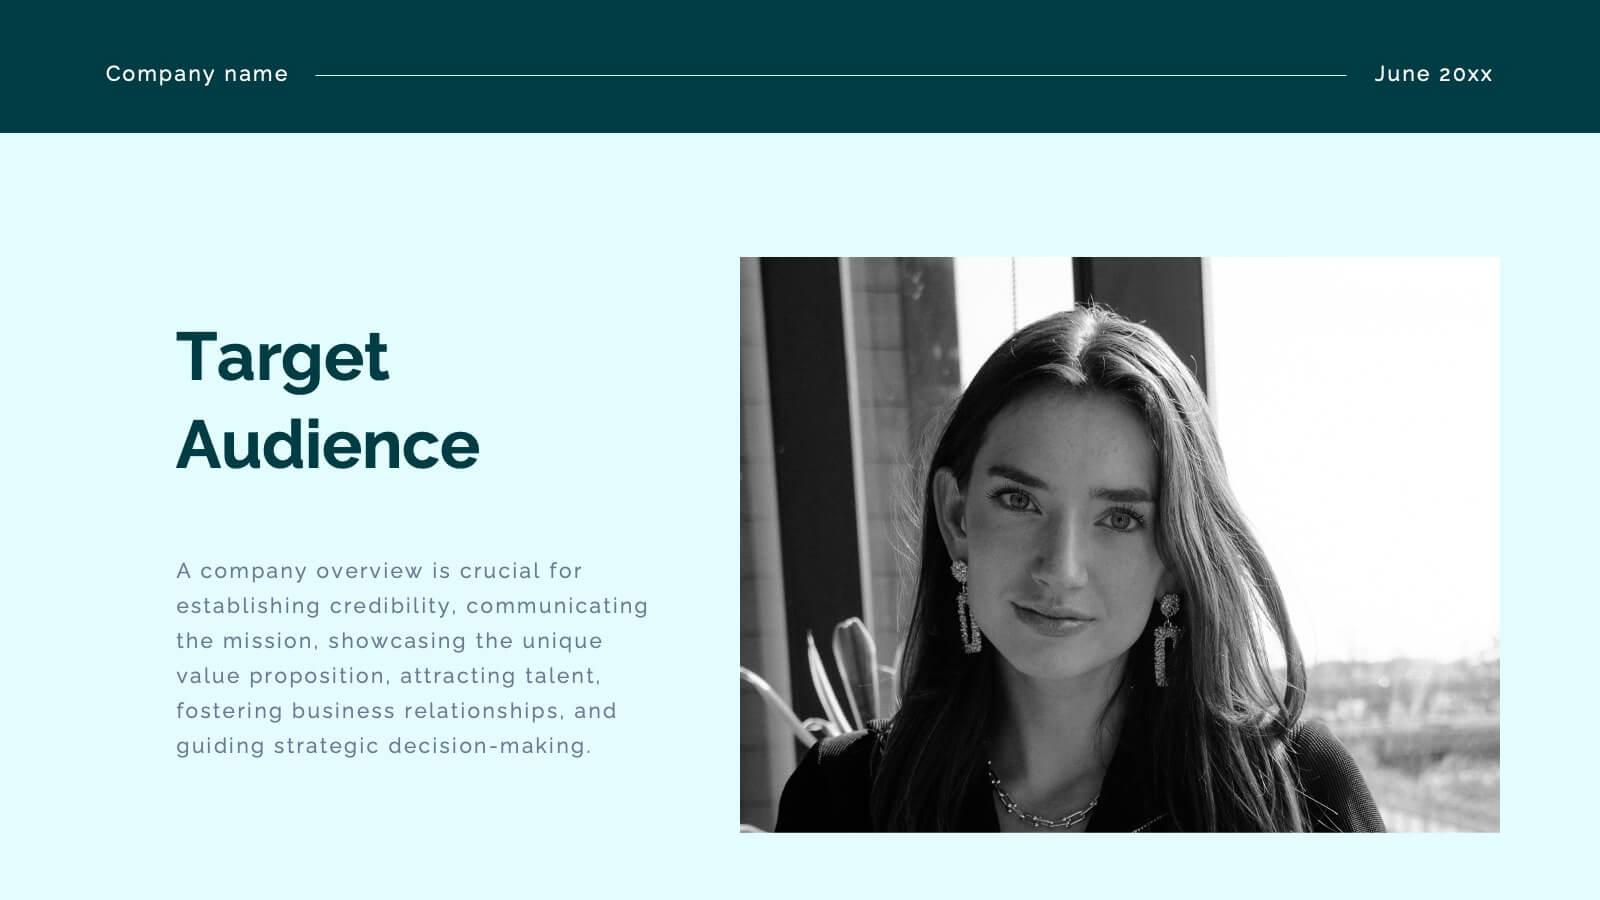
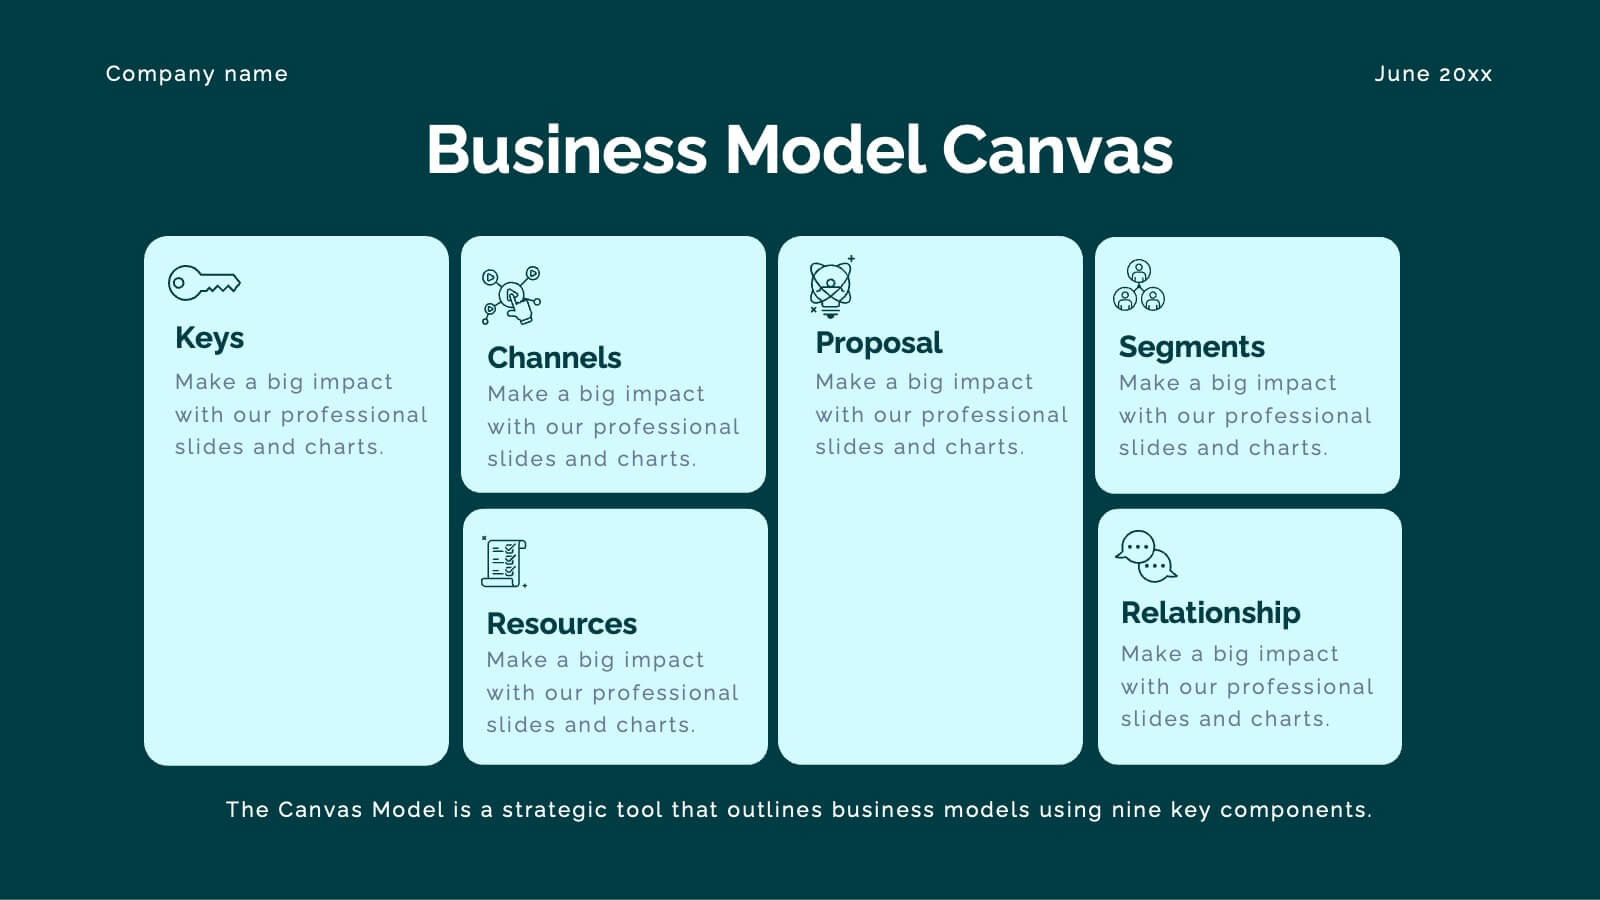
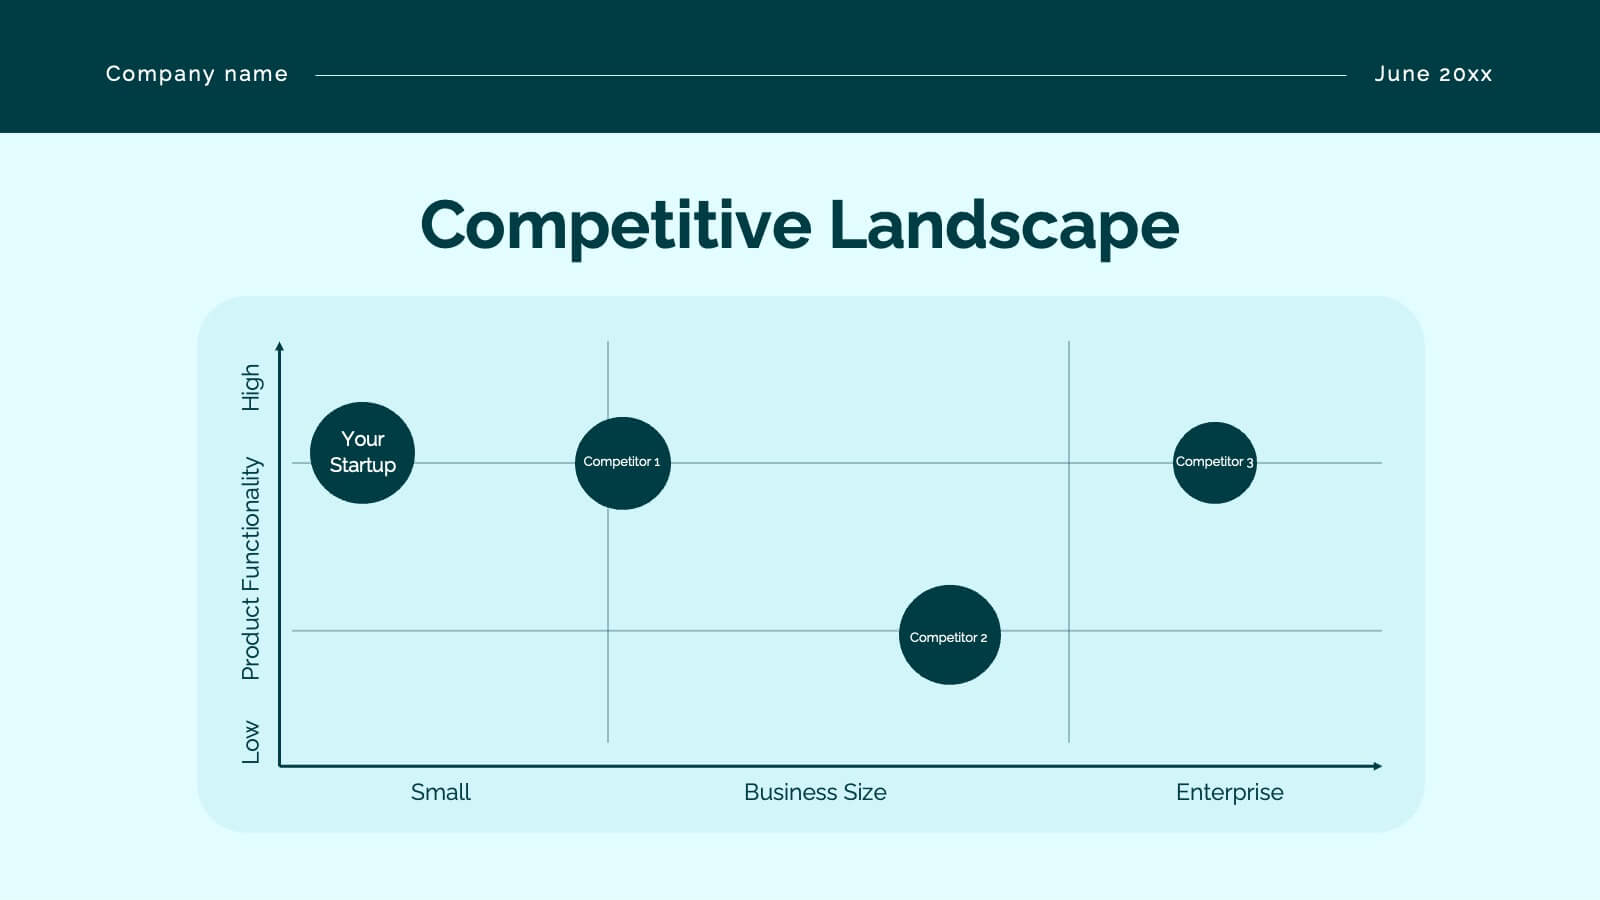
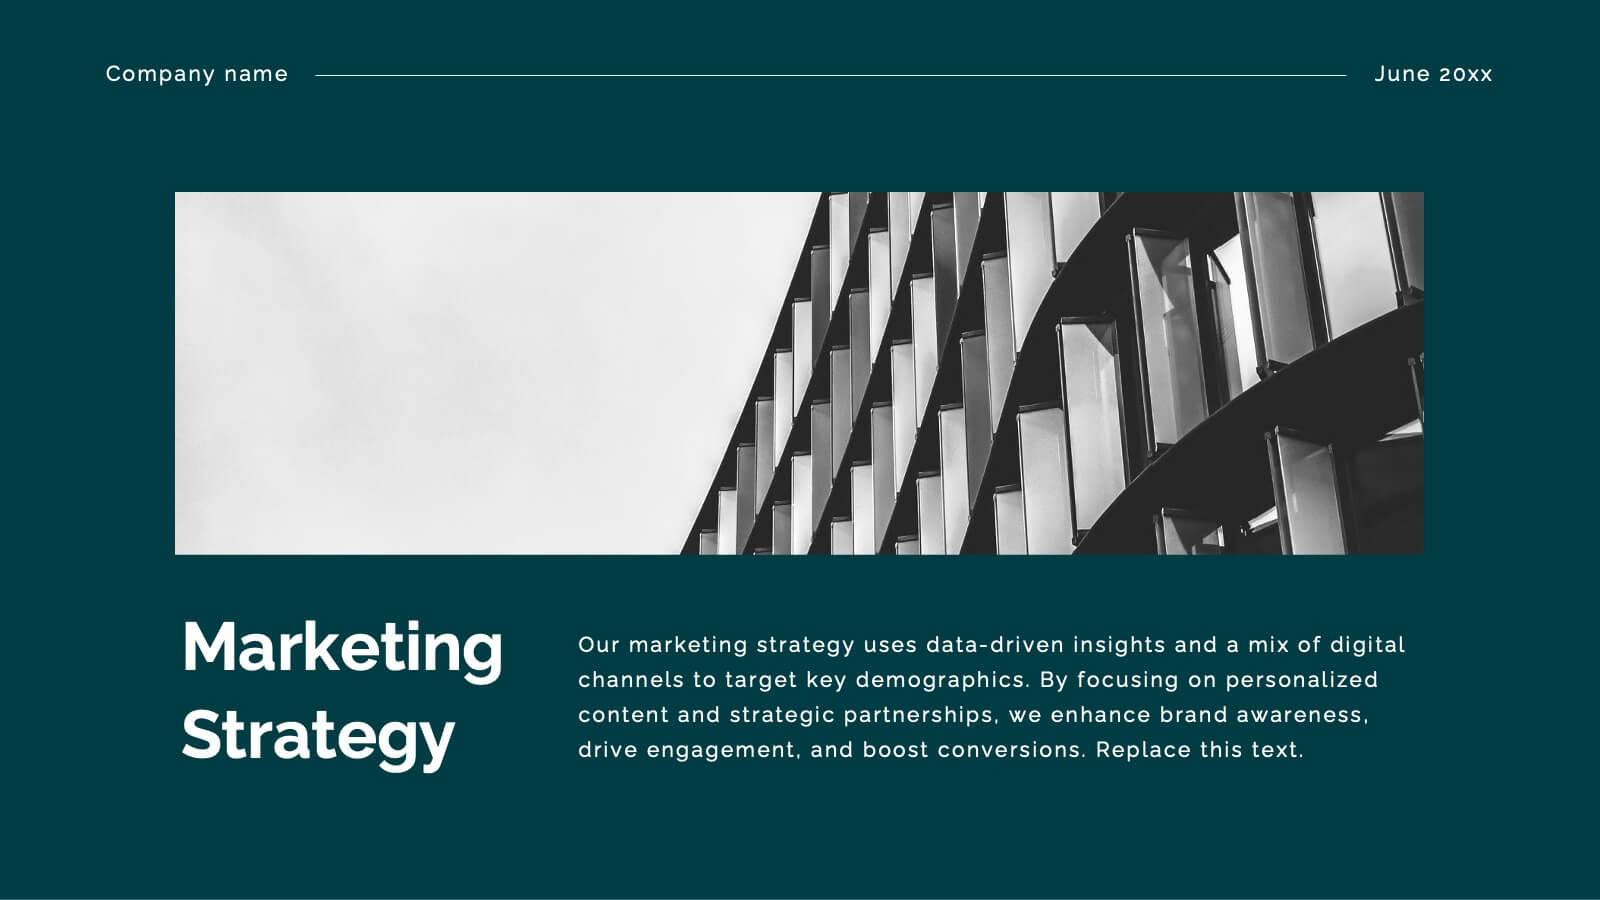
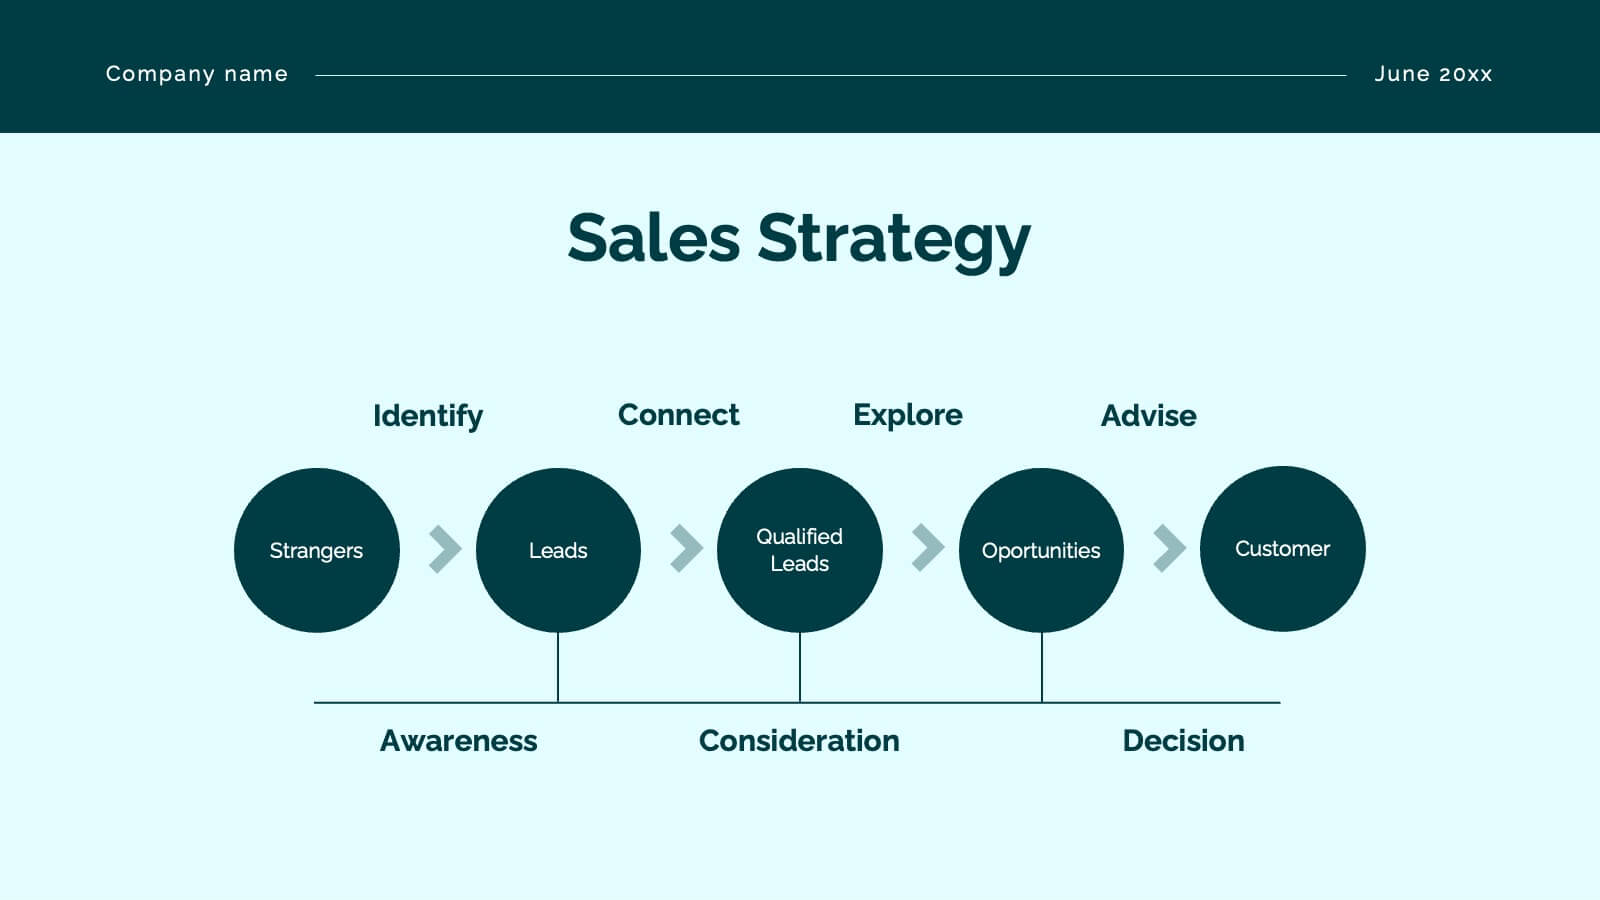
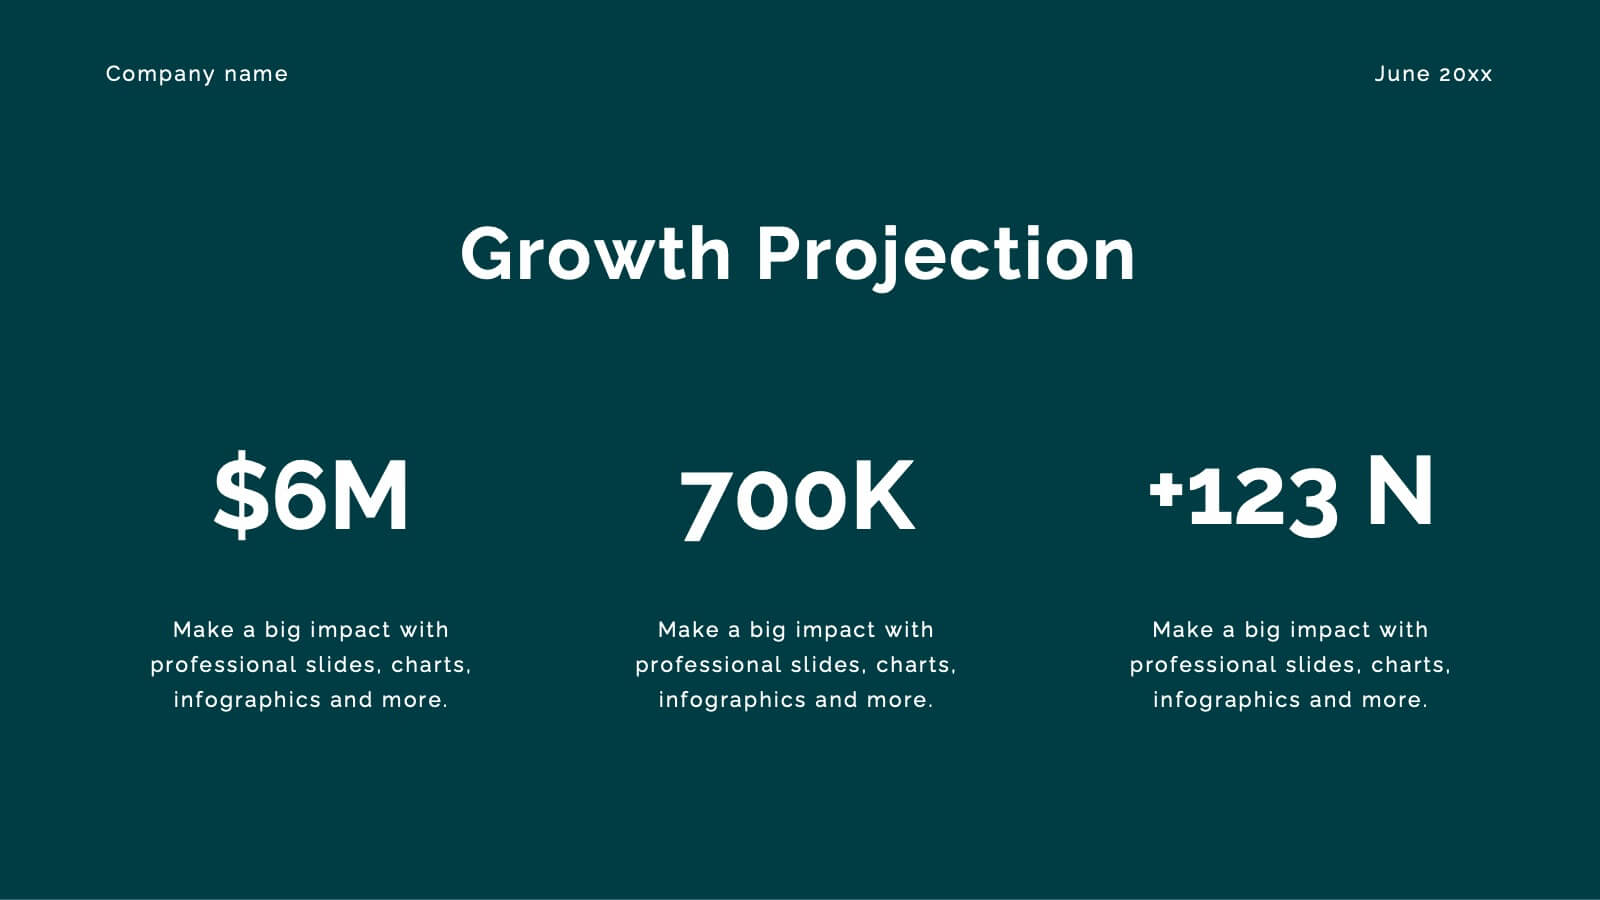
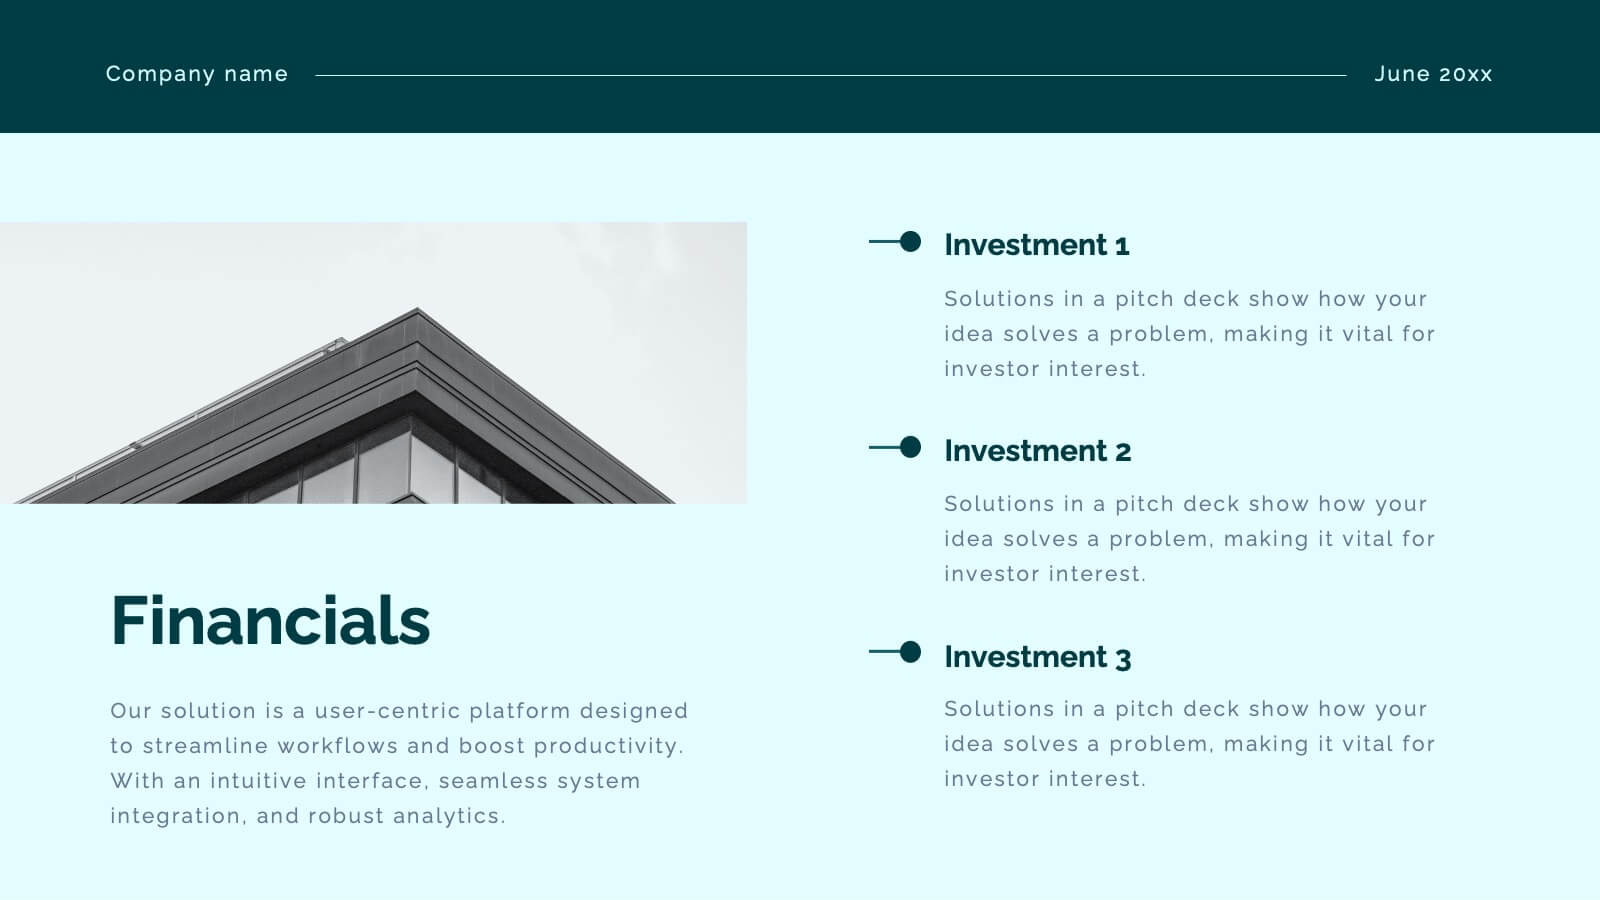
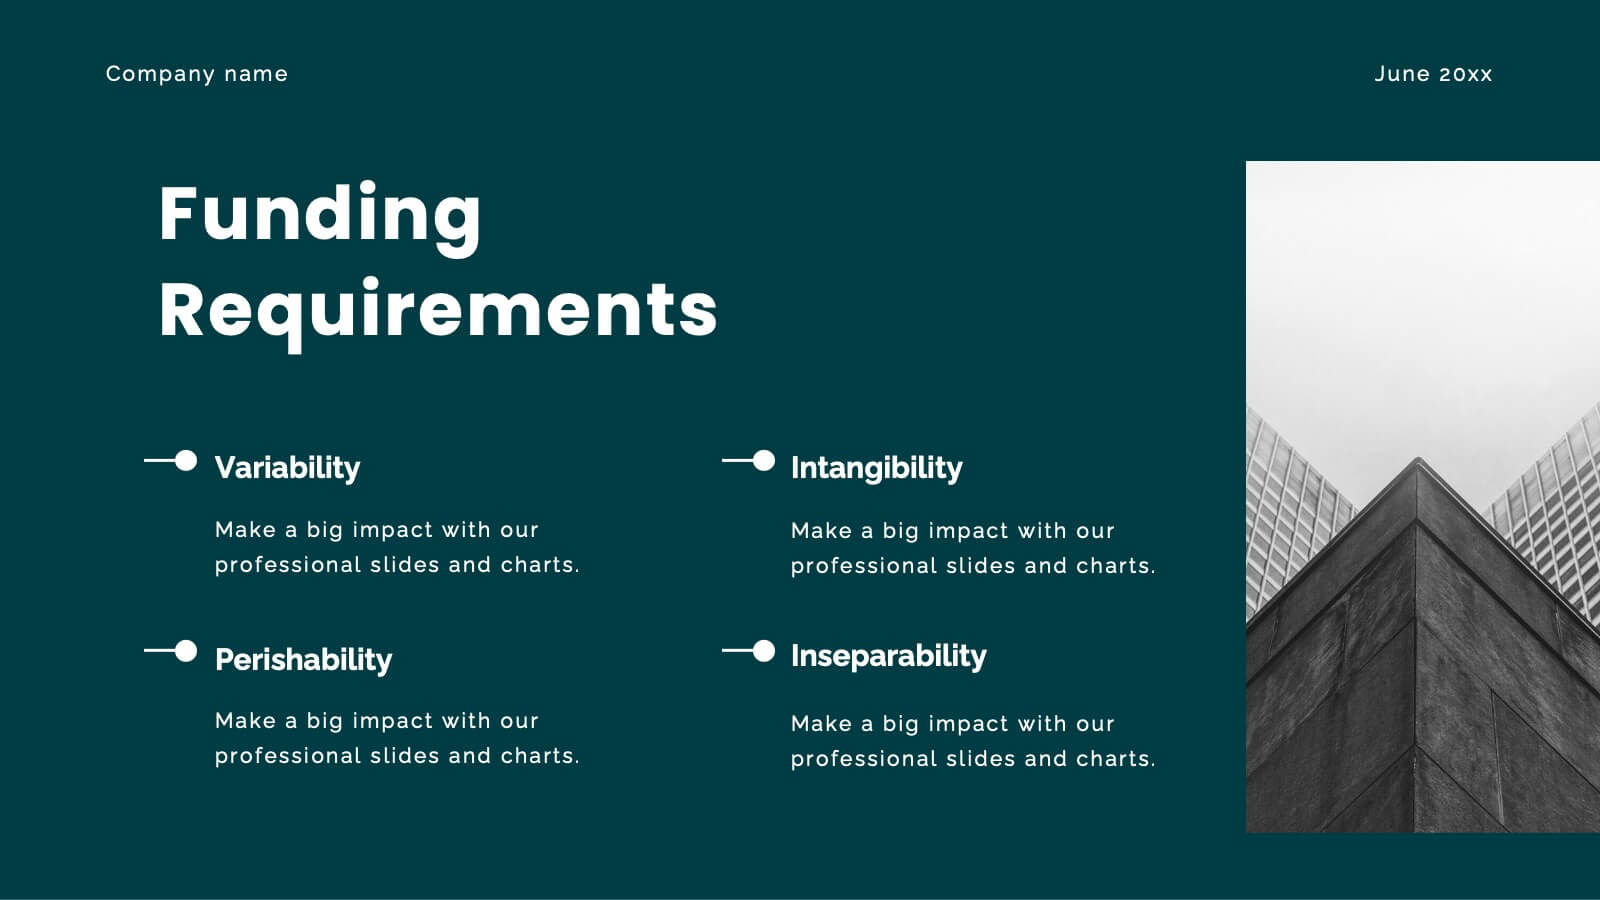
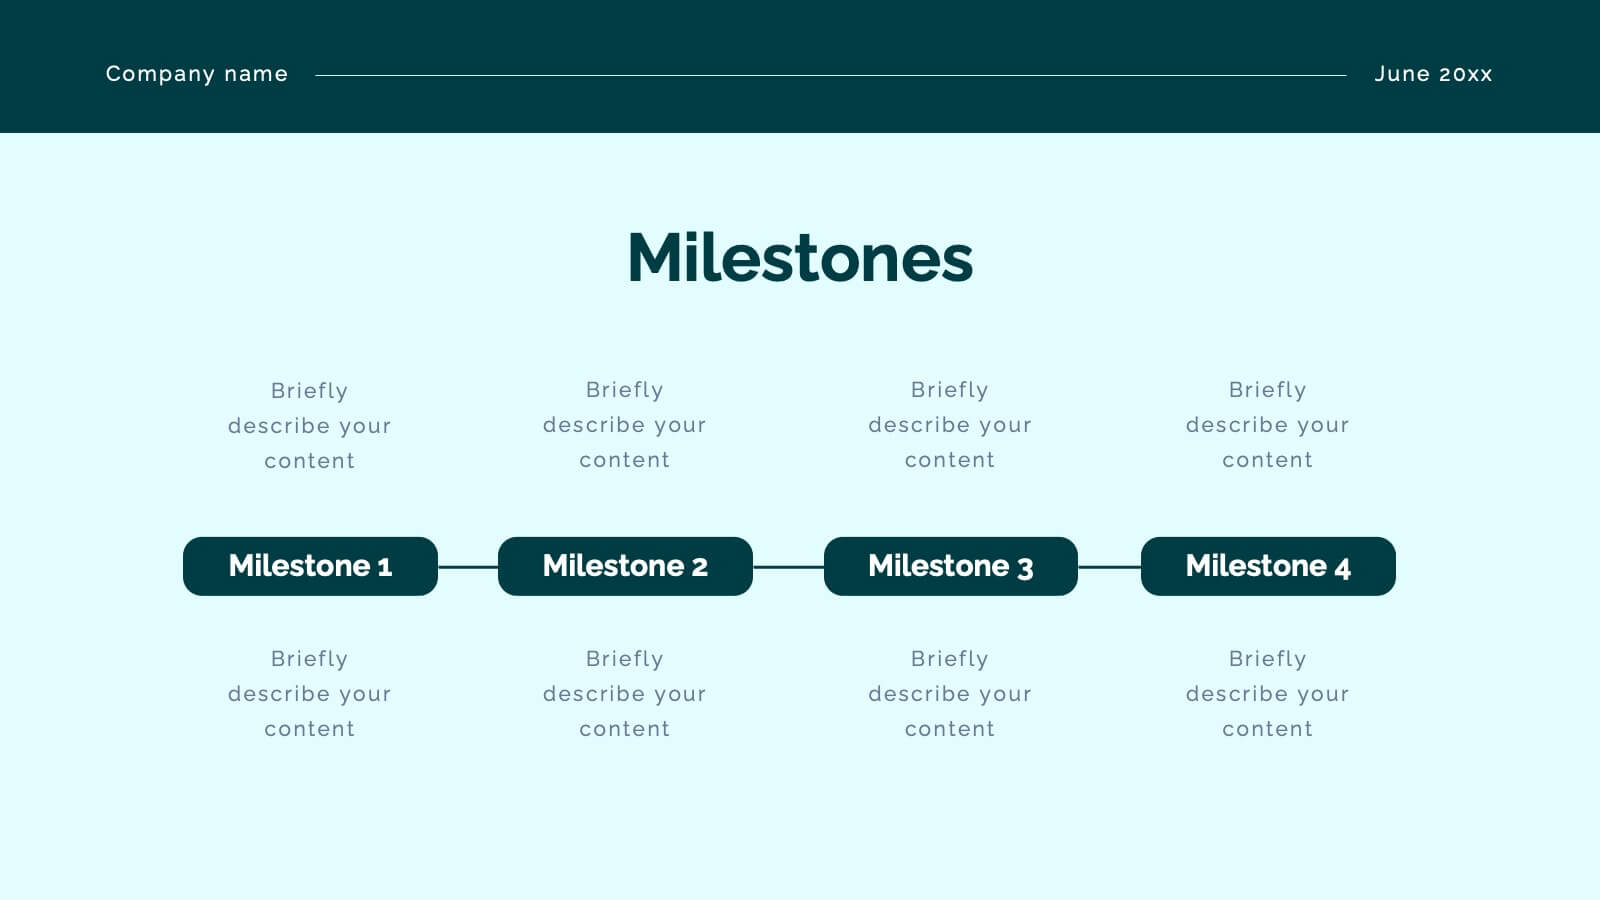
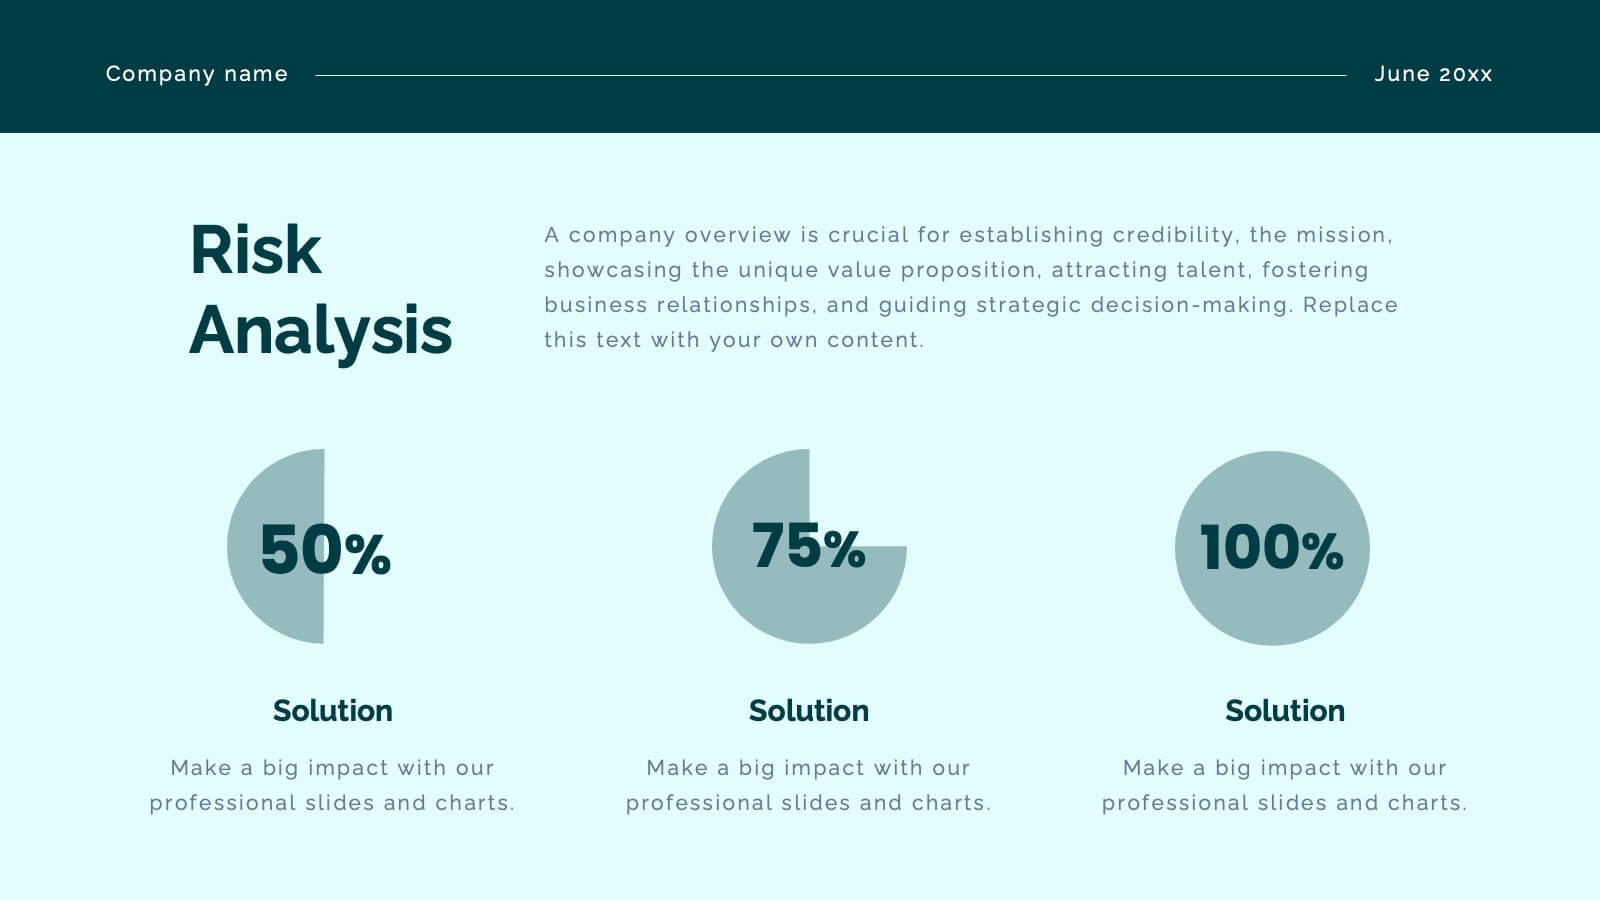
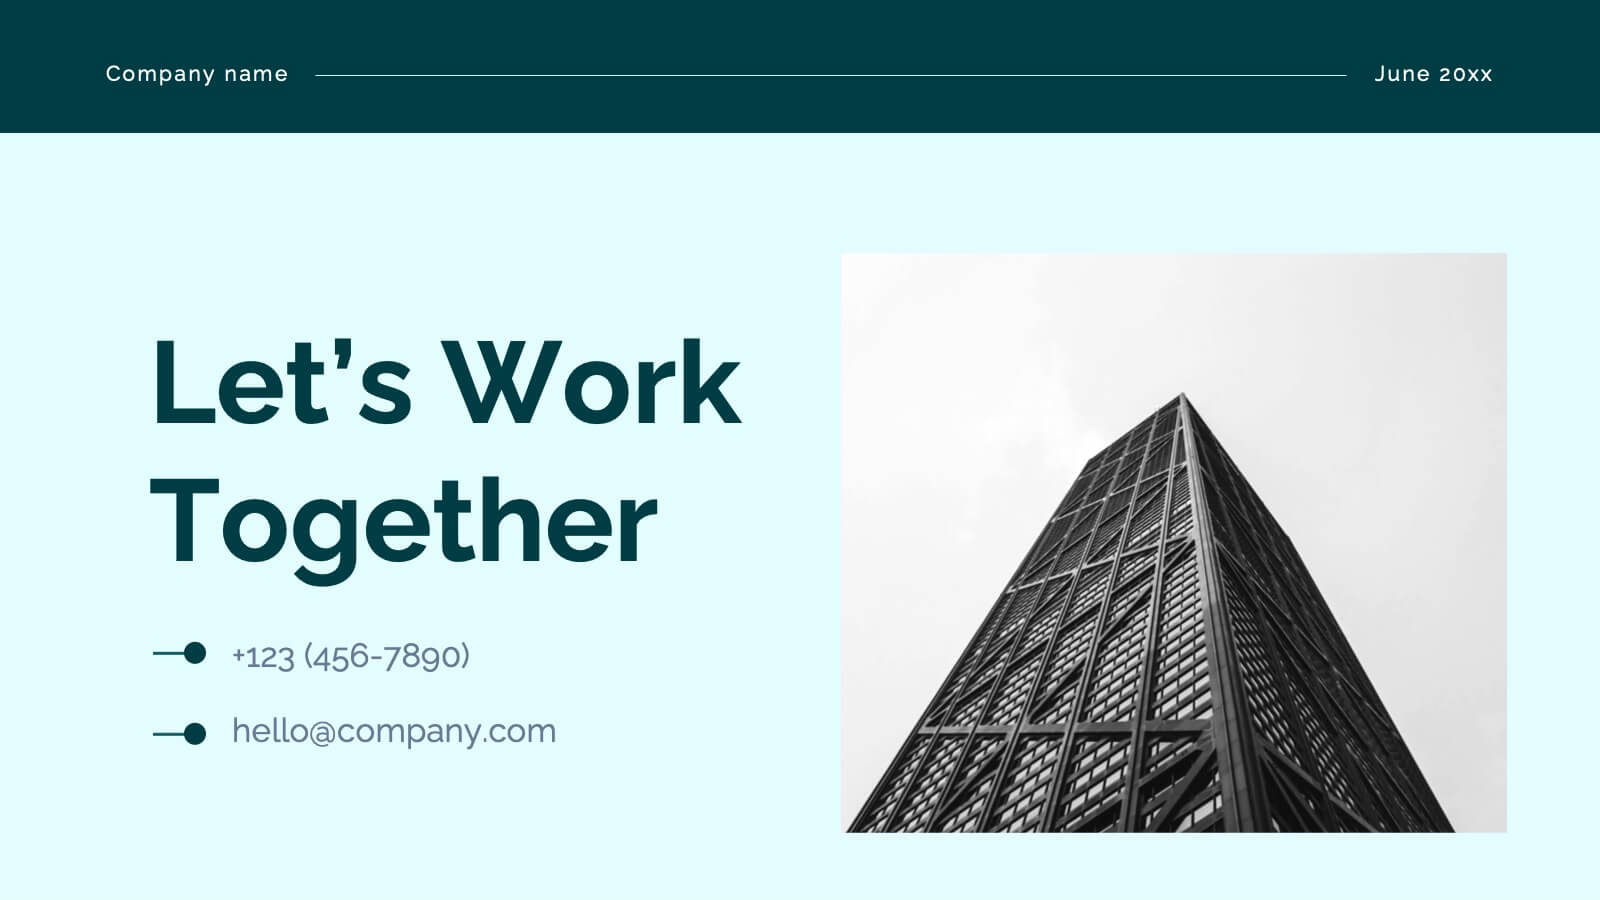
Crest Investor Pitch Presentation Presentation
Unleash your potential with this powerful pitch deck template! Tailored for presenting innovative business ideas, it features slides for company overview, market opportunity, competitive landscape, and financial projections. Clearly communicate your value proposition and impress investors with professional design and concise content. Compatible with PowerPoint, Keynote, and Google Slides for seamless presentations on any platform.


7 diapositivas
Phonetic Alphabet Infographic Presentation
An Alphabet Infographic is a type of visual representation that uses the letters of the alphabet to convey information or ideas in a creative way. This Alphabet Template is a perfect choice for your pre-school, high school and college to create visually appealing presentations. It helps you take ideas from your head and bring them alive with graphics and photos. This template design gives you an insight into the alphabet and includes the letters, as well as icons, some symbols, and a few numbers. The template also includes slides where you can include your facts, color options and much more.


26 diapositivas
Business Ethics and Compliance Presentation
Navigate the crucial topics of business ethics and compliance with this professionally designed presentation template. The clean, corporate aesthetic, dominated by a palette of cool blues and grays, underscores the importance of transparency and integrity in the business world. Ideal for corporate trainers, compliance officers, or business consultants, the template offers a structured approach to discussing ethical practices and regulatory standards. With a mix of charts, diagrams, and bullet points, it allows for detailed explanations of policies, case studies of ethical dilemmas, and the benefits of compliance. Each slide is a step towards building a culture of trust and accountability within an organization, making it a key resource for any business-focused presentation. Adapted for use across PowerPoint, Keynote, and Google Slides, it's crafted to facilitate a clear and impactful delivery of essential business principles.


4 diapositivas
Survey Response Data Visuals Presentation
Present your survey data clearly with this radial icon-based layout. Show response percentages alongside descriptive titles and modern visuals. Ideal for feedback analysis or research summaries. Fully editable in Canva, PowerPoint, or Google Slides, this template offers a clean, professional look to highlight key insights with ease.