


Características


¿Tienes alguna pregunta?
Recomendar
22 diapositivas
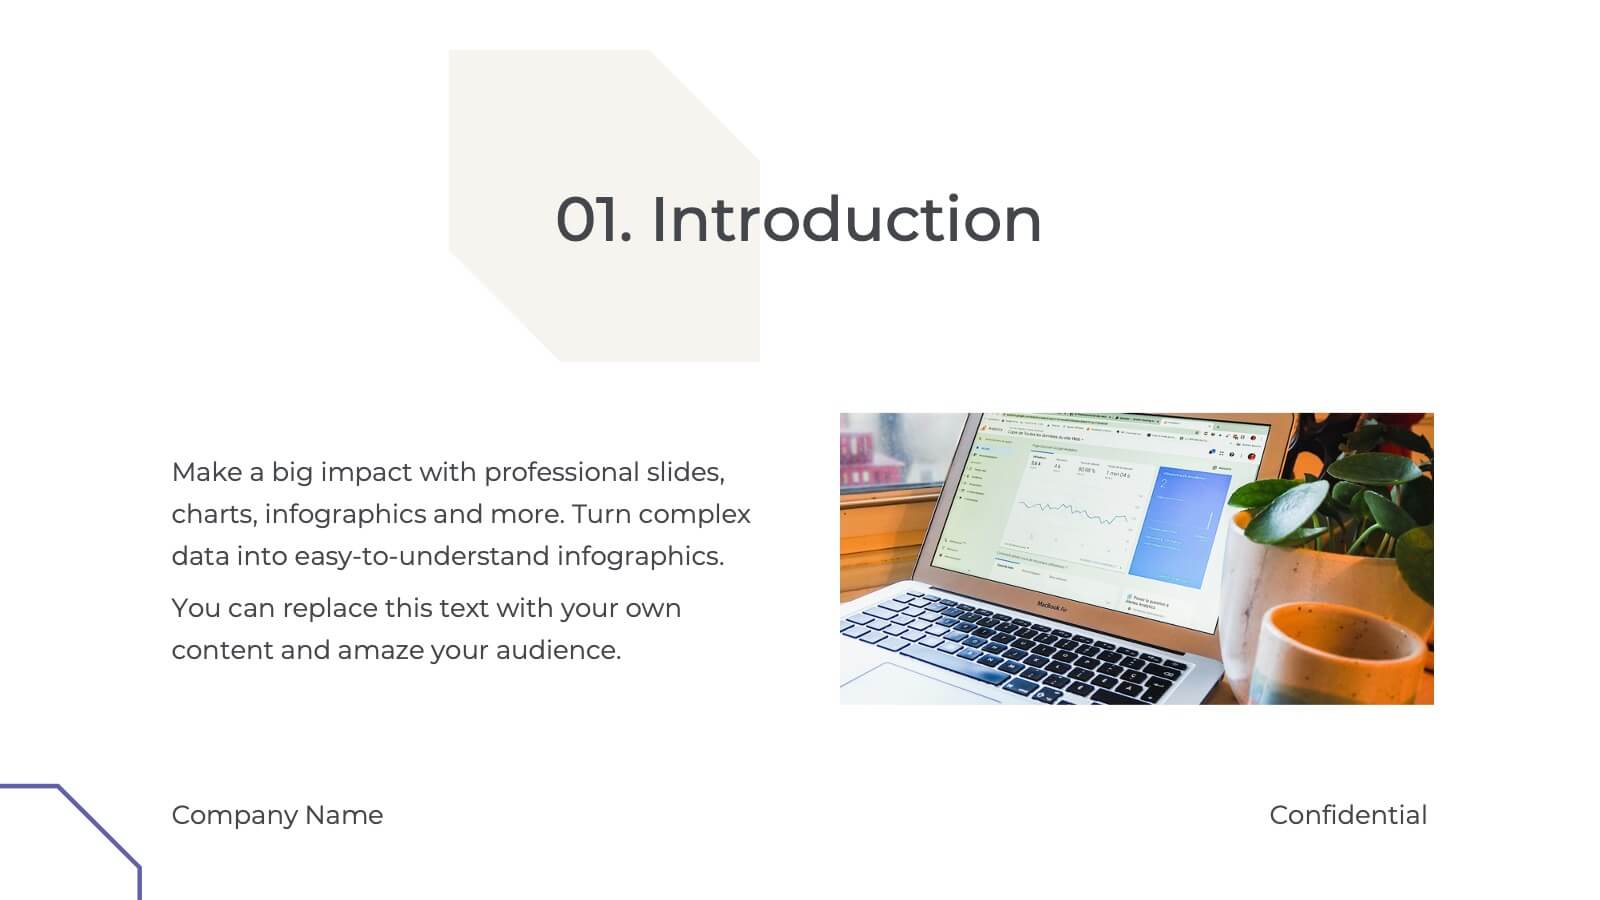
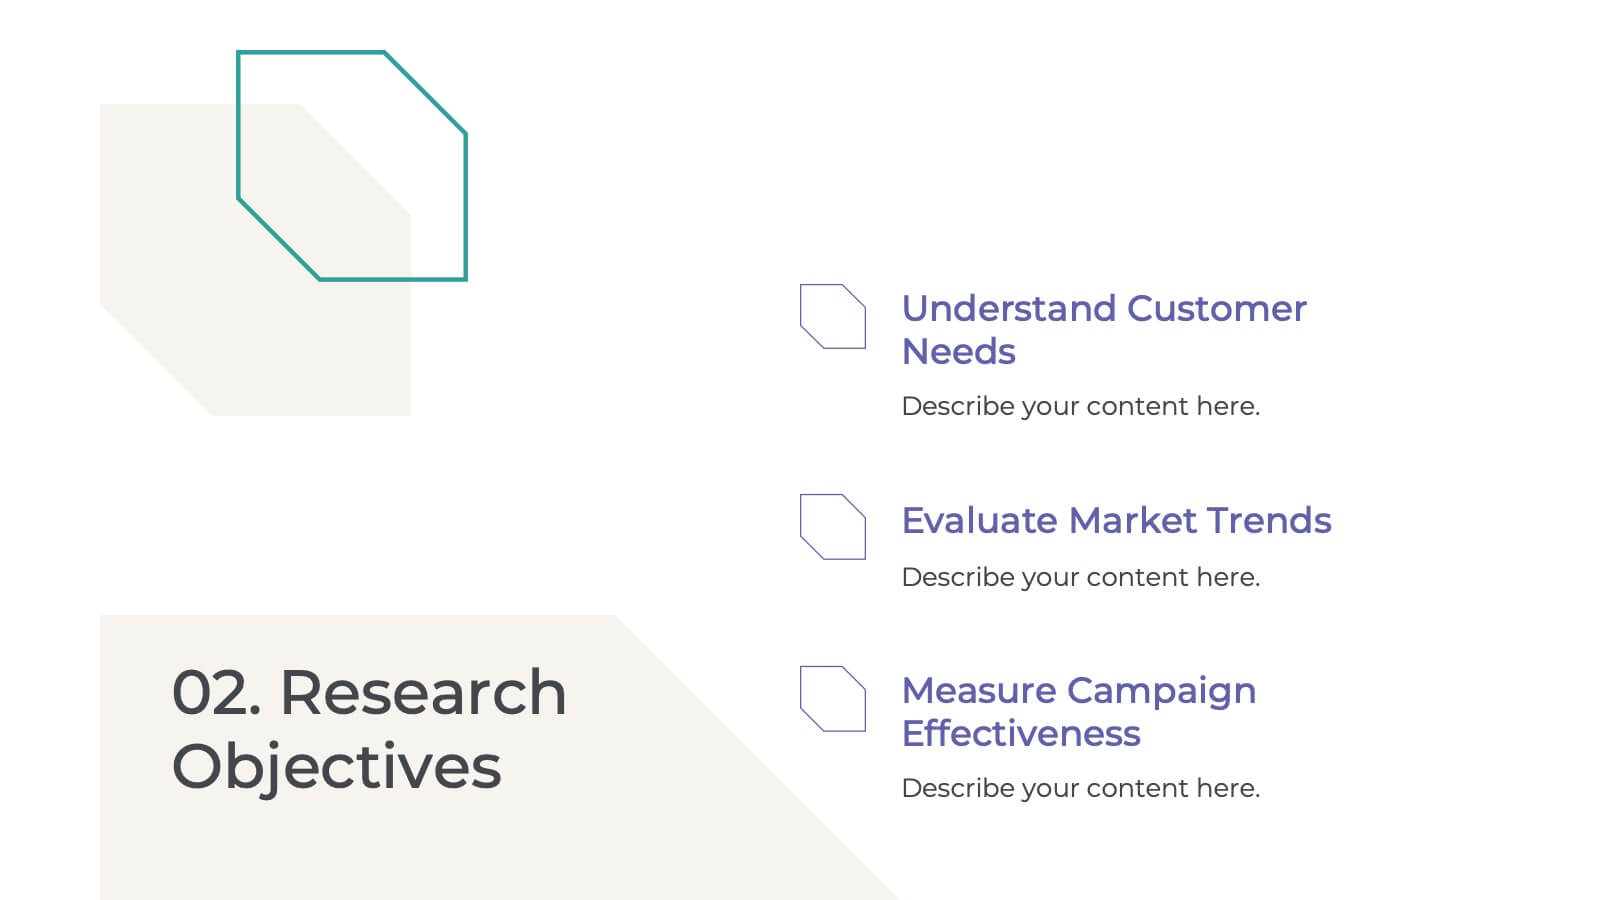
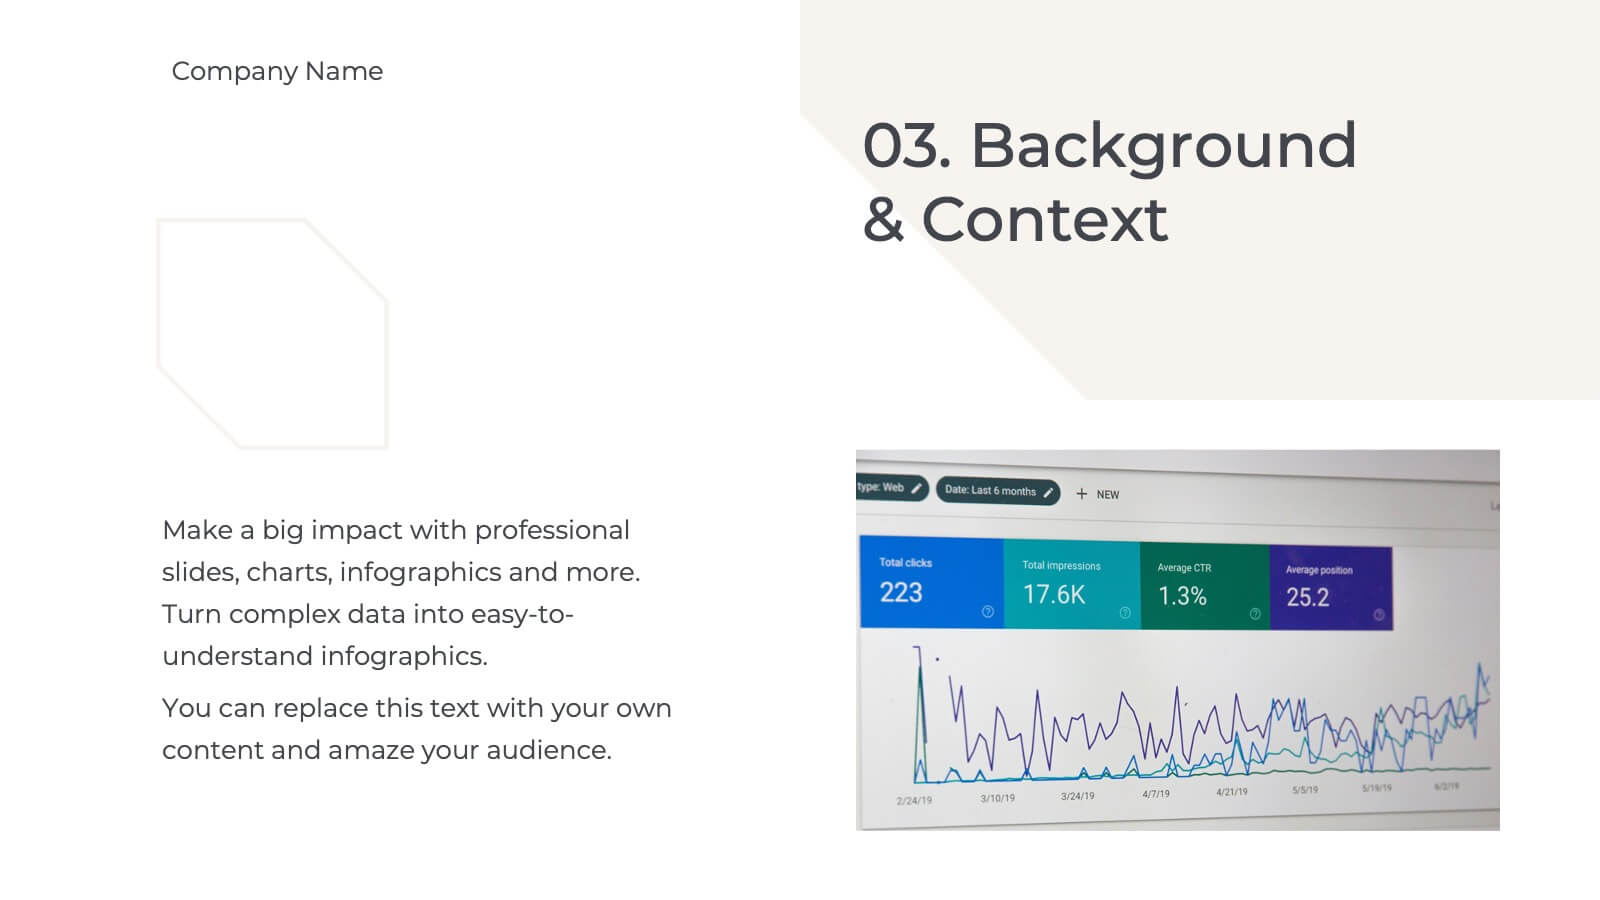
Palladium Qualitative Research Findings Presentation
Present your qualitative research findings effectively with this sleek, professional template. It includes sections for objectives, data analysis, key findings, and recommendations. Ideal for organizing research insights clearly, it's customizable and compatible with PowerPoint, Keynote, and Google Slides, ensuring smooth collaboration and impactful presentations for your audience.


22 diapositivas
Garnet Qualitative Research Findings Presentation
This qualitative research findings presentation template provides a structured layout for sharing in-depth insights from your study. It includes sections for objectives, methodology, data analysis, key findings, and future directions, offering a clear flow for presenting research in a professional format. Perfect for researchers, it’s fully customizable in PowerPoint, Keynote, and Google Slides.


3 diapositivas
Clear Navigation Table of Content Presentation
Streamline your presentation flow with this Clear Navigation Table of Content layout. Featuring labeled sections, visual cues, and photo placeholders, this slide helps guide your audience through key topics. Perfect for reports, proposals, or training decks. Fully customizable in PowerPoint, Keynote, and Google Slides for seamless integration and personalization.


26 diapositivas
Digital Art Tools and Techniques Presentation
Unleash your creativity with this vibrant presentation on digital art tools and techniques. Covering essential topics like graphic design software, digital brushes, layering methods, and creative workflows, this template helps artists and designers enhance their skills. Fully customizable and compatible with PowerPoint, Keynote, and Google Slides for a seamless and visually stunning presentation experience.


6 diapositivas
5-Step SEO Marketing Funnel Presentation
Ignite your marketing story with a bold, flowing visual that makes every step feel purposeful and easy to follow. This presentation breaks down each stage of the SEO funnel, helping you explain strategy, performance, and conversion paths with clarity. Fully compatible with PowerPoint, Keynote, and Google Slides.


8 diapositivas
Value Chain Optimization and Analysis Presentation
Streamline Your Business for Maximum Efficiency with this Value Chain Optimization and Analysis presentation template. This visually engaging template is designed to map, analyze, and enhance the key activities in your value chain, helping businesses identify opportunities for cost reduction, performance improvements, and strategic advantages. Featuring a clean flowchart layout, intuitive color-coded sections, and editable placeholders, this template is ideal for business analysts, consultants, and executives. Fully compatible with PowerPoint, Keynote, and Google Slides, ensuring seamless customization and professional delivery.


10 diapositivas
Success Stories and Case Findings Presentation
Celebrate achievements with clarity using the Success Stories and Case Findings Presentation. Featuring a vertical trophy infographic layout, this template allows you to present up to 5 milestones, results, or insights in a visually rewarding format. Ideal for showcasing progress, case highlights, or performance wins. Fully editable in PowerPoint, Keynote, and Google Slides.


5 diapositivas
Startup Business Pitch Deck Presentation
Impress investors with this clean and modern pitch deck slide, designed to showcase business growth and funding stages. Featuring a sleek stacked ring graphic with a rocket icon for visual impact, this layout is perfect for presenting milestones, KPIs, or financial progress. Fully editable in PowerPoint, Keynote, and Google Slides.
5 diapositivas
Feedback Rating Smile Icons Presentation
Light up your presentation with a playful visual that turns audience feedback into clear, colorful insights. This slide helps you compare ratings, highlight sentiment patterns, and present review data in a friendly, memorable way. Perfect for surveys, reports, and performance reviews. Fully compatible with PowerPoint, Keynote, and Google Slides.


6 diapositivas
Business Law and Compliance
Simplify complex legal processes with this business law and compliance slide. Featuring a dynamic hexagon cycle diagram, it’s ideal for showcasing policies, regulatory frameworks, and compliance workflows. Designed for corporate, legal, and risk management presentations. Fully editable and compatible with PowerPoint, Keynote, and Google Slides.


6 diapositivas
Value Delivery Framework Presentation
Turn your strategy into action with a clear, layered design that highlights how value flows through every stage of your process. Perfect for explaining organizational efficiency, performance models, or delivery systems. Fully editable and compatible with PowerPoint, Keynote, and Google Slides for easy, professional customization.


21 diapositivas
Design Creative Concept Presentation
Enhance your creative presentations with this Creative Concept template. It features slides for objectives, color palettes, typography options, and prototyping steps. Ideal for designers and creative teams, this template supports PowerPoint, Keynote, and Google Slides, facilitating a comprehensive and engaging presentation of creative projects.


12 diapositivas
Corporate Case Study Analysis
Break down your business case into clear, actionable sections with this five-step analysis layout. Each stage—from point A to E—is designed for highlighting core components such as challenges, processes, and insights. Ideal for consultants, executives, and analysts. Compatible with PowerPoint, Keynote, and Google Slides.


5 diapositivas
European Countries Editable Map Presentation
Bring your data to life with a detailed and modern map layout that showcases insights across Europe. Perfect for visualizing country comparisons, regional statistics, or business expansion plans, this clean design ensures clarity and impact. Fully compatible with PowerPoint, Keynote, and Google Slides for easy editing and presentation.


5 diapositivas
Multi-Step Procedure and Execution Flow Presentation
Visualize complex processes with clarity using the Multi-Step Procedure and Execution Flow Presentation. Ideal for SOPs, task breakdowns, or team workflows, this layout helps you present sequential actions, decision points, and outcomes with a clean, structured flow. Fully editable in PowerPoint, Canva, and Google Slides.


20 diapositivas
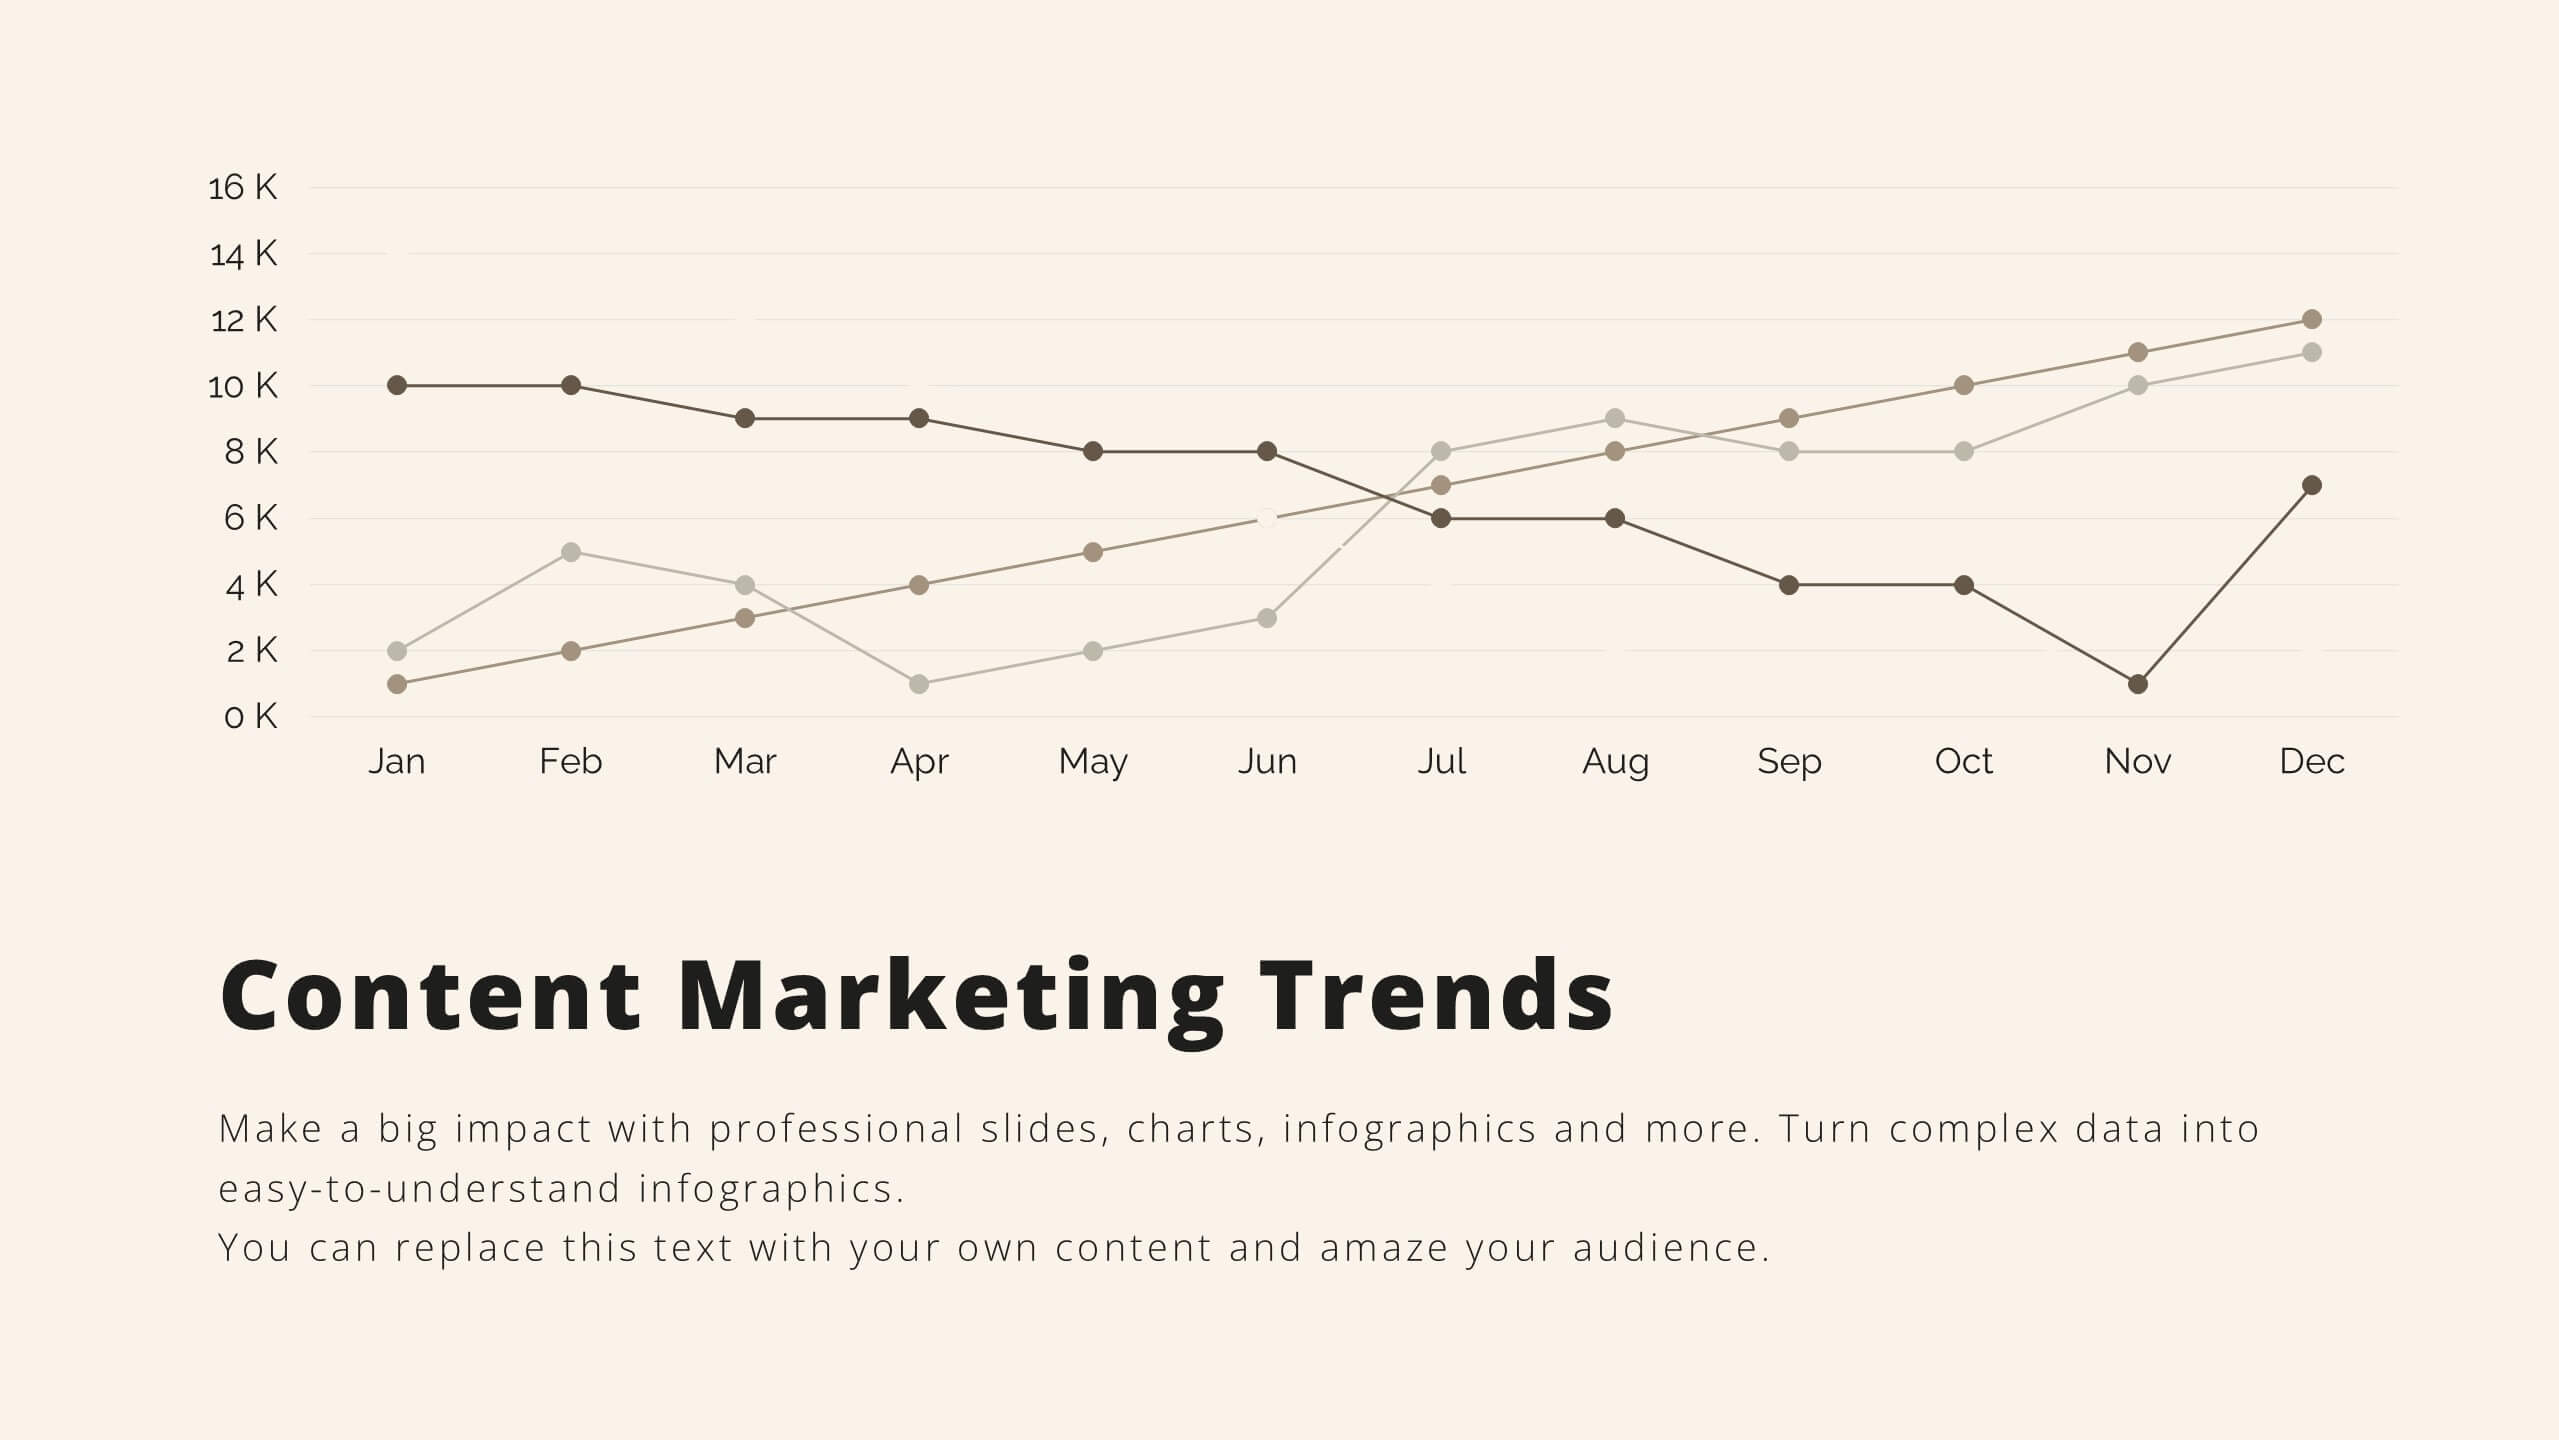
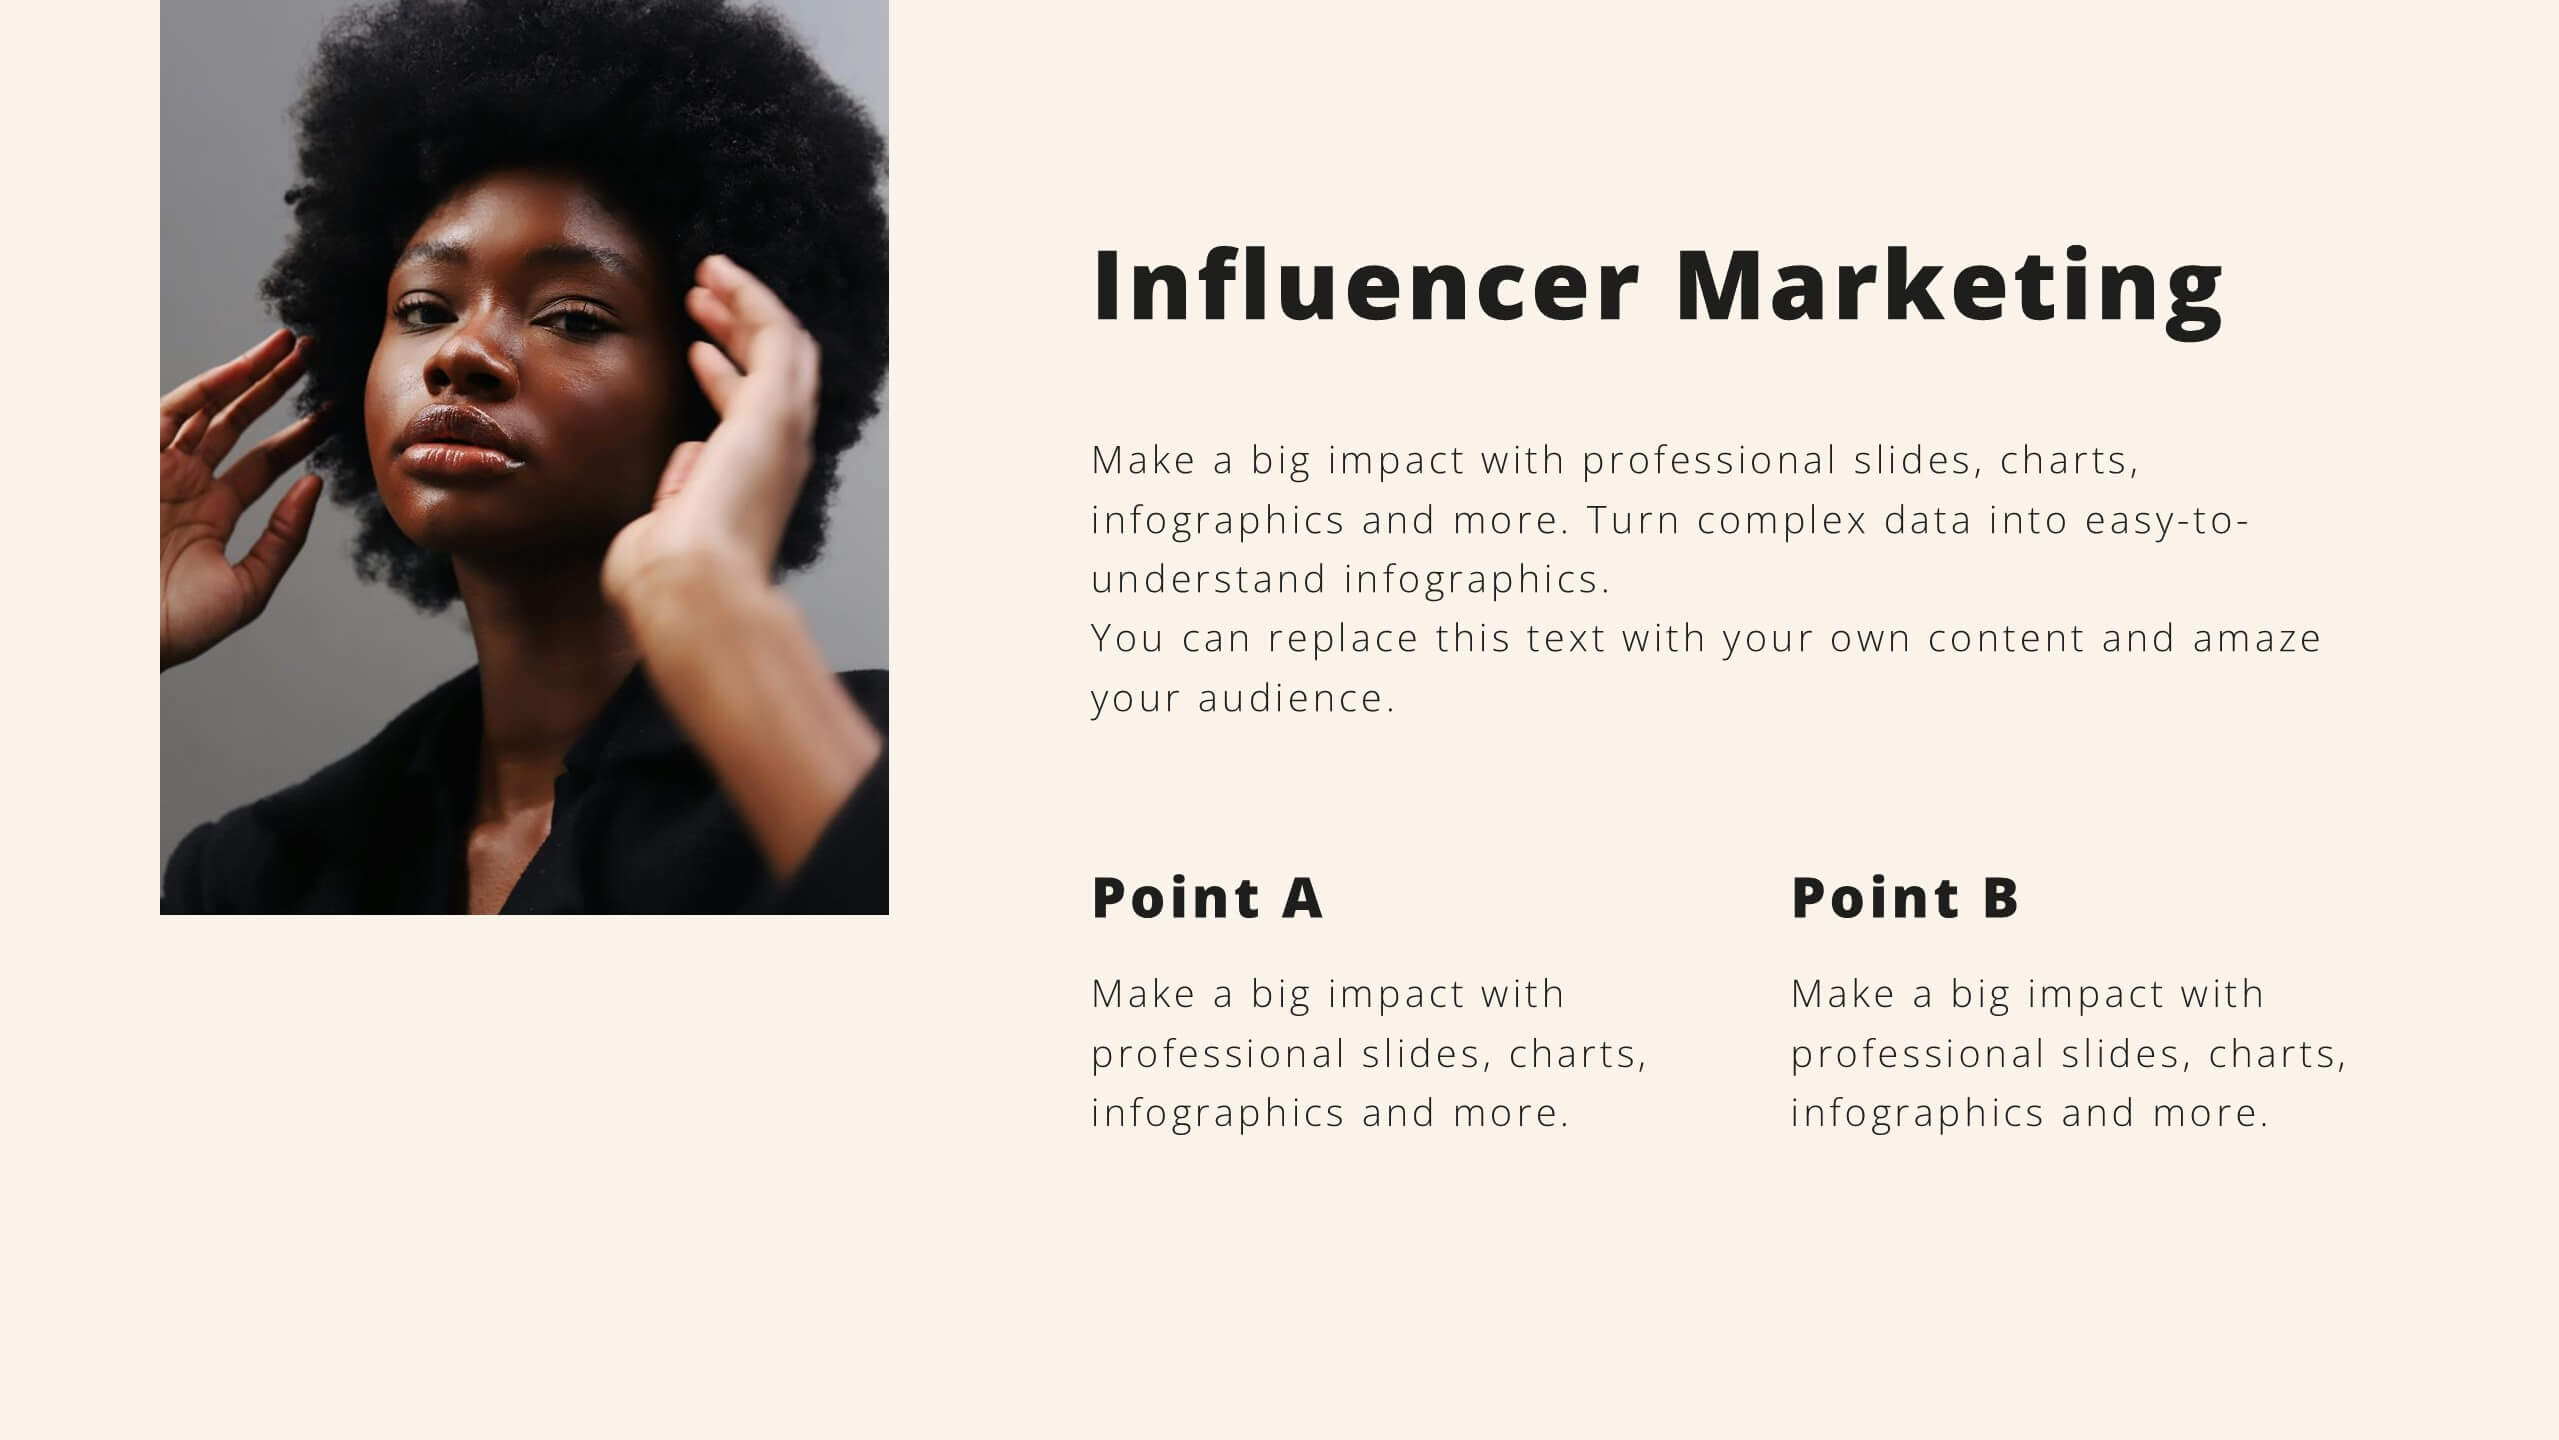
Amethyst Marketing Proposal Template Presentation
Bring your marketing ideas to life with this eye-catching amethyst-themed presentation! Tailored for presenting your marketing proposals, this template helps you outline key strategies, campaigns, and target audiences in a sleek, professional design. Its bold layout ensures your message shines through. Compatible with PowerPoint, Keynote, and Google Slides.


6 diapositivas
Step-by-Step Onboarding Program Presentation
Turn your onboarding process into a seamless experience with a clean, structured layout that walks viewers through each stage of the journey. Ideal for HR teams, training sessions, or corporate orientations, this presentation ensures clarity and engagement. Fully compatible with PowerPoint, Keynote, and Google Slides for easy customization and delivery.