


Características


¿Tienes alguna pregunta?
Recomendar


4 diapositivas
Cloud Computing IT Architecture Presentation
Enhance your Cloud Computing IT Architecture presentations with this dynamic layered cloud infographic. Perfect for visualizing cloud storage and security frameworks, this template is fully customizable and compatible with PowerPoint, Keynote, and Google Slides.


5 diapositivas
Business Growths Strategy Presentation
Grow your ideas with a dynamic visual layout that makes every milestone feel achievable and clear. This presentation helps you explain key stages, strategic actions, and long-term growth goals with confidence and simplicity. Fully customizable and compatible with PowerPoint, Keynote, and Google Slides.


4 diapositivas
Team Relationship Structure Presentation
Show your organization’s hierarchy with clarity and style using this modern visual layout. Ideal for illustrating team dynamics, reporting lines, or company roles, it helps simplify complex structures into easy-to-follow visuals. Fully customizable and compatible with PowerPoint, Keynote, and Google Slides for seamless editing and professional presentation design.


6 diapositivas
Advanced Project Timeline with Gantt Layout
Keep complex projects on track with the Advanced Project Timeline with Gantt Layout Presentation. This slide makes it easy to outline task durations over multiple weeks, providing a clear visual of overlaps, dependencies, and pacing. Ideal for managers, teams, and stakeholders needing a structured view of multi-week initiatives. Compatible with PowerPoint, Keynote, and Google Slides for seamless updates.


7 diapositivas
Consulting Business Strategy Infographic Presentation
A company’s business strategy is a plan that helps it achieve its goals and meet long-term objectives. A business strategy should be designed to fulfill the company’s mission, vision, and values. This template is designed to make your business or company plan, easy to understand and present in a professional way with the best design. This template can be used to present your company's strategic vision, long-term goals, and key initiatives. With its colorful and dynamic design, this can attract your audience’s attention, while also providing them with useful information about your strategy.


6 diapositivas
Customer Loyalty Rewards Structure Presentation
Illustrate your brand’s customer retention strategy with the Customer Loyalty Rewards Structure presentation. This visually engaging template highlights reward tiers, perks, and loyalty card systems—perfect for showcasing how customers earn incentives over time. Ideal for marketing teams, retail businesses, and loyalty program proposals. Fully editable in PowerPoint, Keynote, and Google Slides.


6 diapositivas
Project Milestone Progress Presentation
Track project progress effortlessly with this Project Milestone Progress template. This structured, color-coded milestone tracker is perfect for monitoring timelines, identifying key deliverables, and keeping stakeholders informed. Fully editable—adjust dates, tasks, and colors to match your project requirements. Compatible with PowerPoint, Keynote, and Google Slides, ensuring seamless integration into your workflow.


7 diapositivas
Competitive Analysis Using Strategy Wheel
Highlight your competitive edge with this dynamic strategy wheel diagram. Designed to visually compare up to six business components, this slide is ideal for showcasing strengths, weaknesses, or market positioning. Perfect for strategic planning sessions, it’s fully editable in PowerPoint, Keynote, and Google Slides.


7 diapositivas
Six Sigma Project Infographic
Six Sigma is a data-driven methodology and quality improvement approach that aims to eliminate defects and reduce variation in processes. This infographic template is a visual representation of the Six Sigma methodology, which is a data-driven approach used by organizations to improve their processes and reduce defects. The infographic aims to explain the key concepts and steps involved in the Six Sigma process in a clear and concise manner. It is designed to help individuals understand the methodology and its benefits, and can be used as a reference tool for Six Sigma practitioners and those interested in process improvement.


5 diapositivas
Core to Outer Ring Concentric Planning Presentation
Present your strategy from the inside out with the Core to Outer Ring Concentric Planning Presentation. This layered, radial design guides viewers through a central concept outward into supporting elements—ideal for planning, process modeling, or decision frameworks. Fully customizable in PowerPoint, Keynote, and Google Slides.


8 diapositivas
Airline Business Strategy Presentation
Leverage key insights into the aviation sector with the "Aviation Industry Market Analysis" presentation template. This design allows professionals in the aviation industry to effectively communicate market trends and forecasts. Its compatibility with PowerPoint, Keynote, and Google Slides ensures a versatile use across different platforms, making it ideal for industry analyses, investor meetings, or internal strategy discussions.


4 diapositivas
Team and Department Setup Structure Presentation
Organize your team with clarity using the Team and Department Setup Structure Presentation. This template is perfect for showcasing internal team hierarchies, departmental layouts, or functional groupings in a clean and professional layout. Each slide is fully customizable, allowing you to edit icons, titles, and structure to suit your organization. Compatible with Canva, PowerPoint, Keynote, and Google Slides.


5 diapositivas
Scalability Metrics for Business Growth Presentation
Visualize business growth stages with this tiered pyramid-style slide. Each layer highlights key performance metrics with editable percentage labels, perfect for scaling strategies or KPI reports. Simple, structured, and impactful—ideal for business planning, team briefings, or investor updates. Fully customizable in PowerPoint, Keynote, and Google Slides for seamless editing.


7 diapositivas
30 60 90 Day Plan Diagram Presentation
The 30-60-90 day plan is a document that outlines an individual's goals and objectives for the first 90 days of a new job. This template allows you the ability to set goals, review progress and analyze the results of your work. This infographic template is a multipurpose design that can be used for business, personal, and educational projects. It includes descriptive text and images to help you put together your presentation plan. It's easy to use and has been designed to be compatible with Powerpoint, Keynote, and Google Slides just add your own information and start presenting!


4 diapositivas
Top Priorities and Checklist Format Presentation
Stay focused and aligned with the Top Priorities and Checklist Format Presentation. This clear, checklist-based design is ideal for highlighting action items, goals, or key project deliverables. Visually guide your team with structured sections and a checklist illustration that reinforces accountability. Fully editable in PowerPoint, Keynote, and Google Slides.
5 diapositivas
PM Milestone Planning and Tracking Layout Presentation
Track your project progress with clarity using the PM Milestone Planning and Tracking Layout Presentation. This curved arrow timeline visually guides stakeholders through five key stages of your project plan, highlighting each milestone with clear labels. Fully editable in Canva, PowerPoint, Keynote, and Google Slides for flexible use.


26 diapositivas
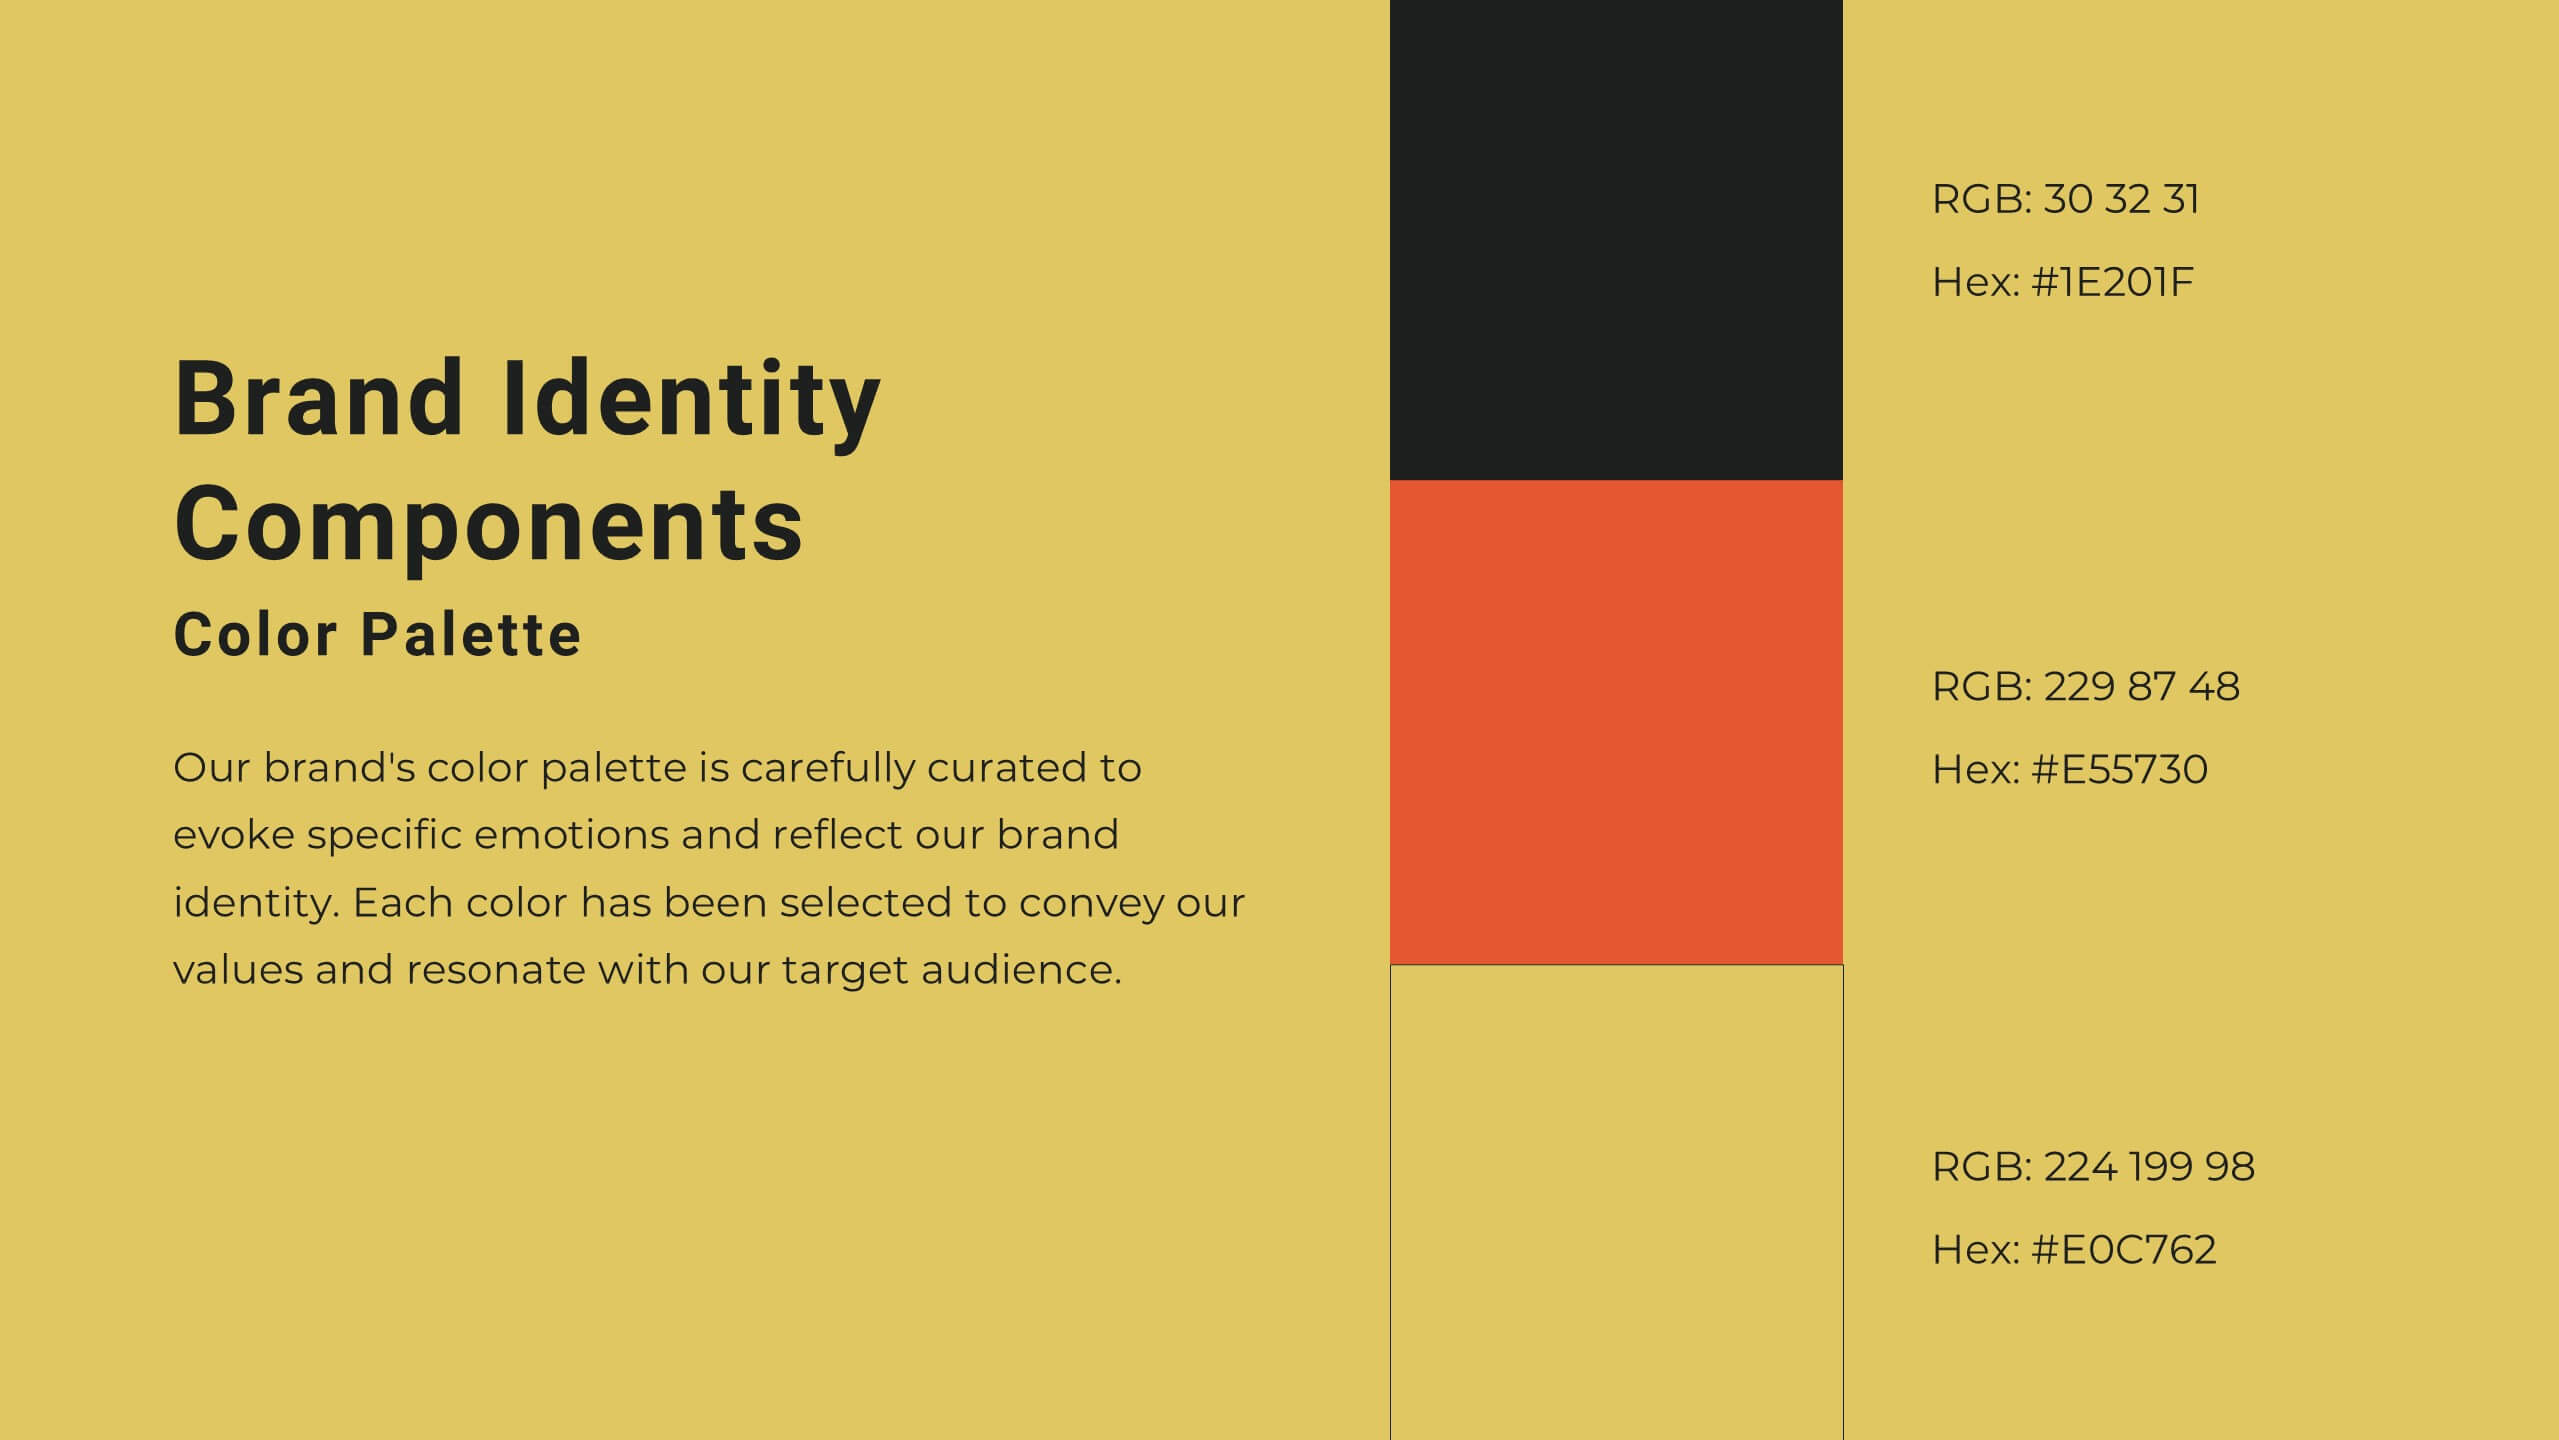
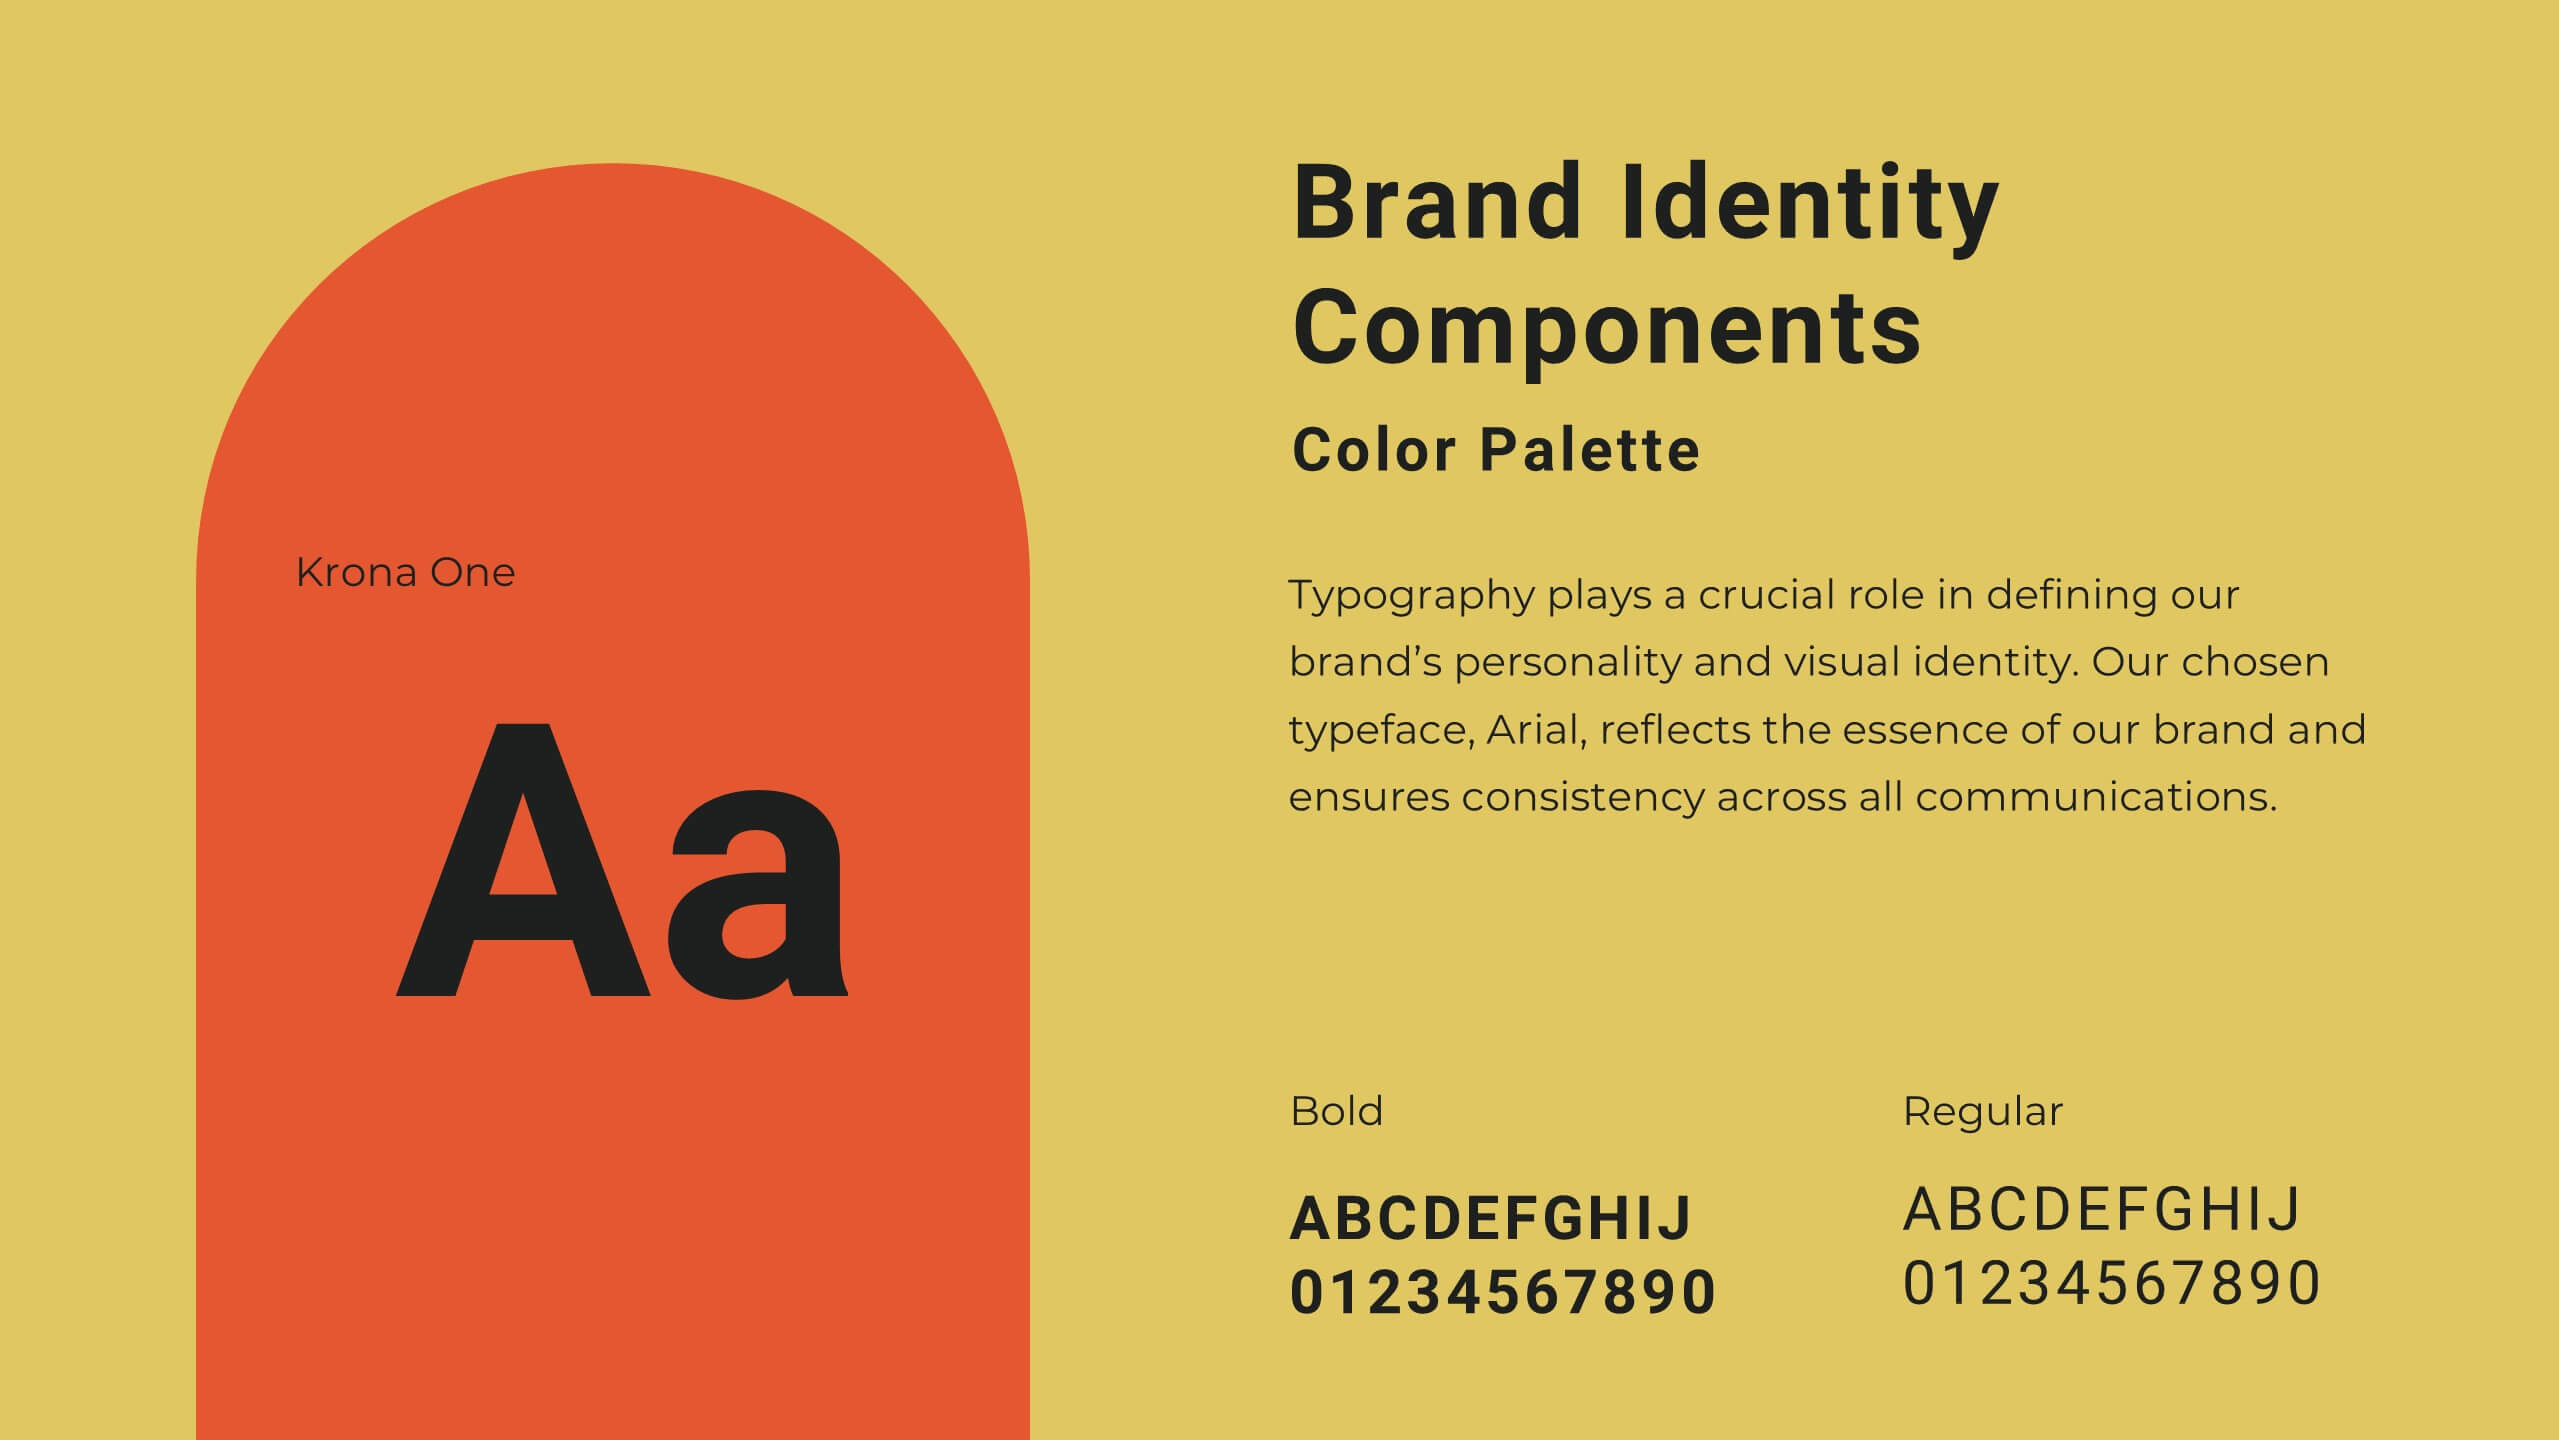
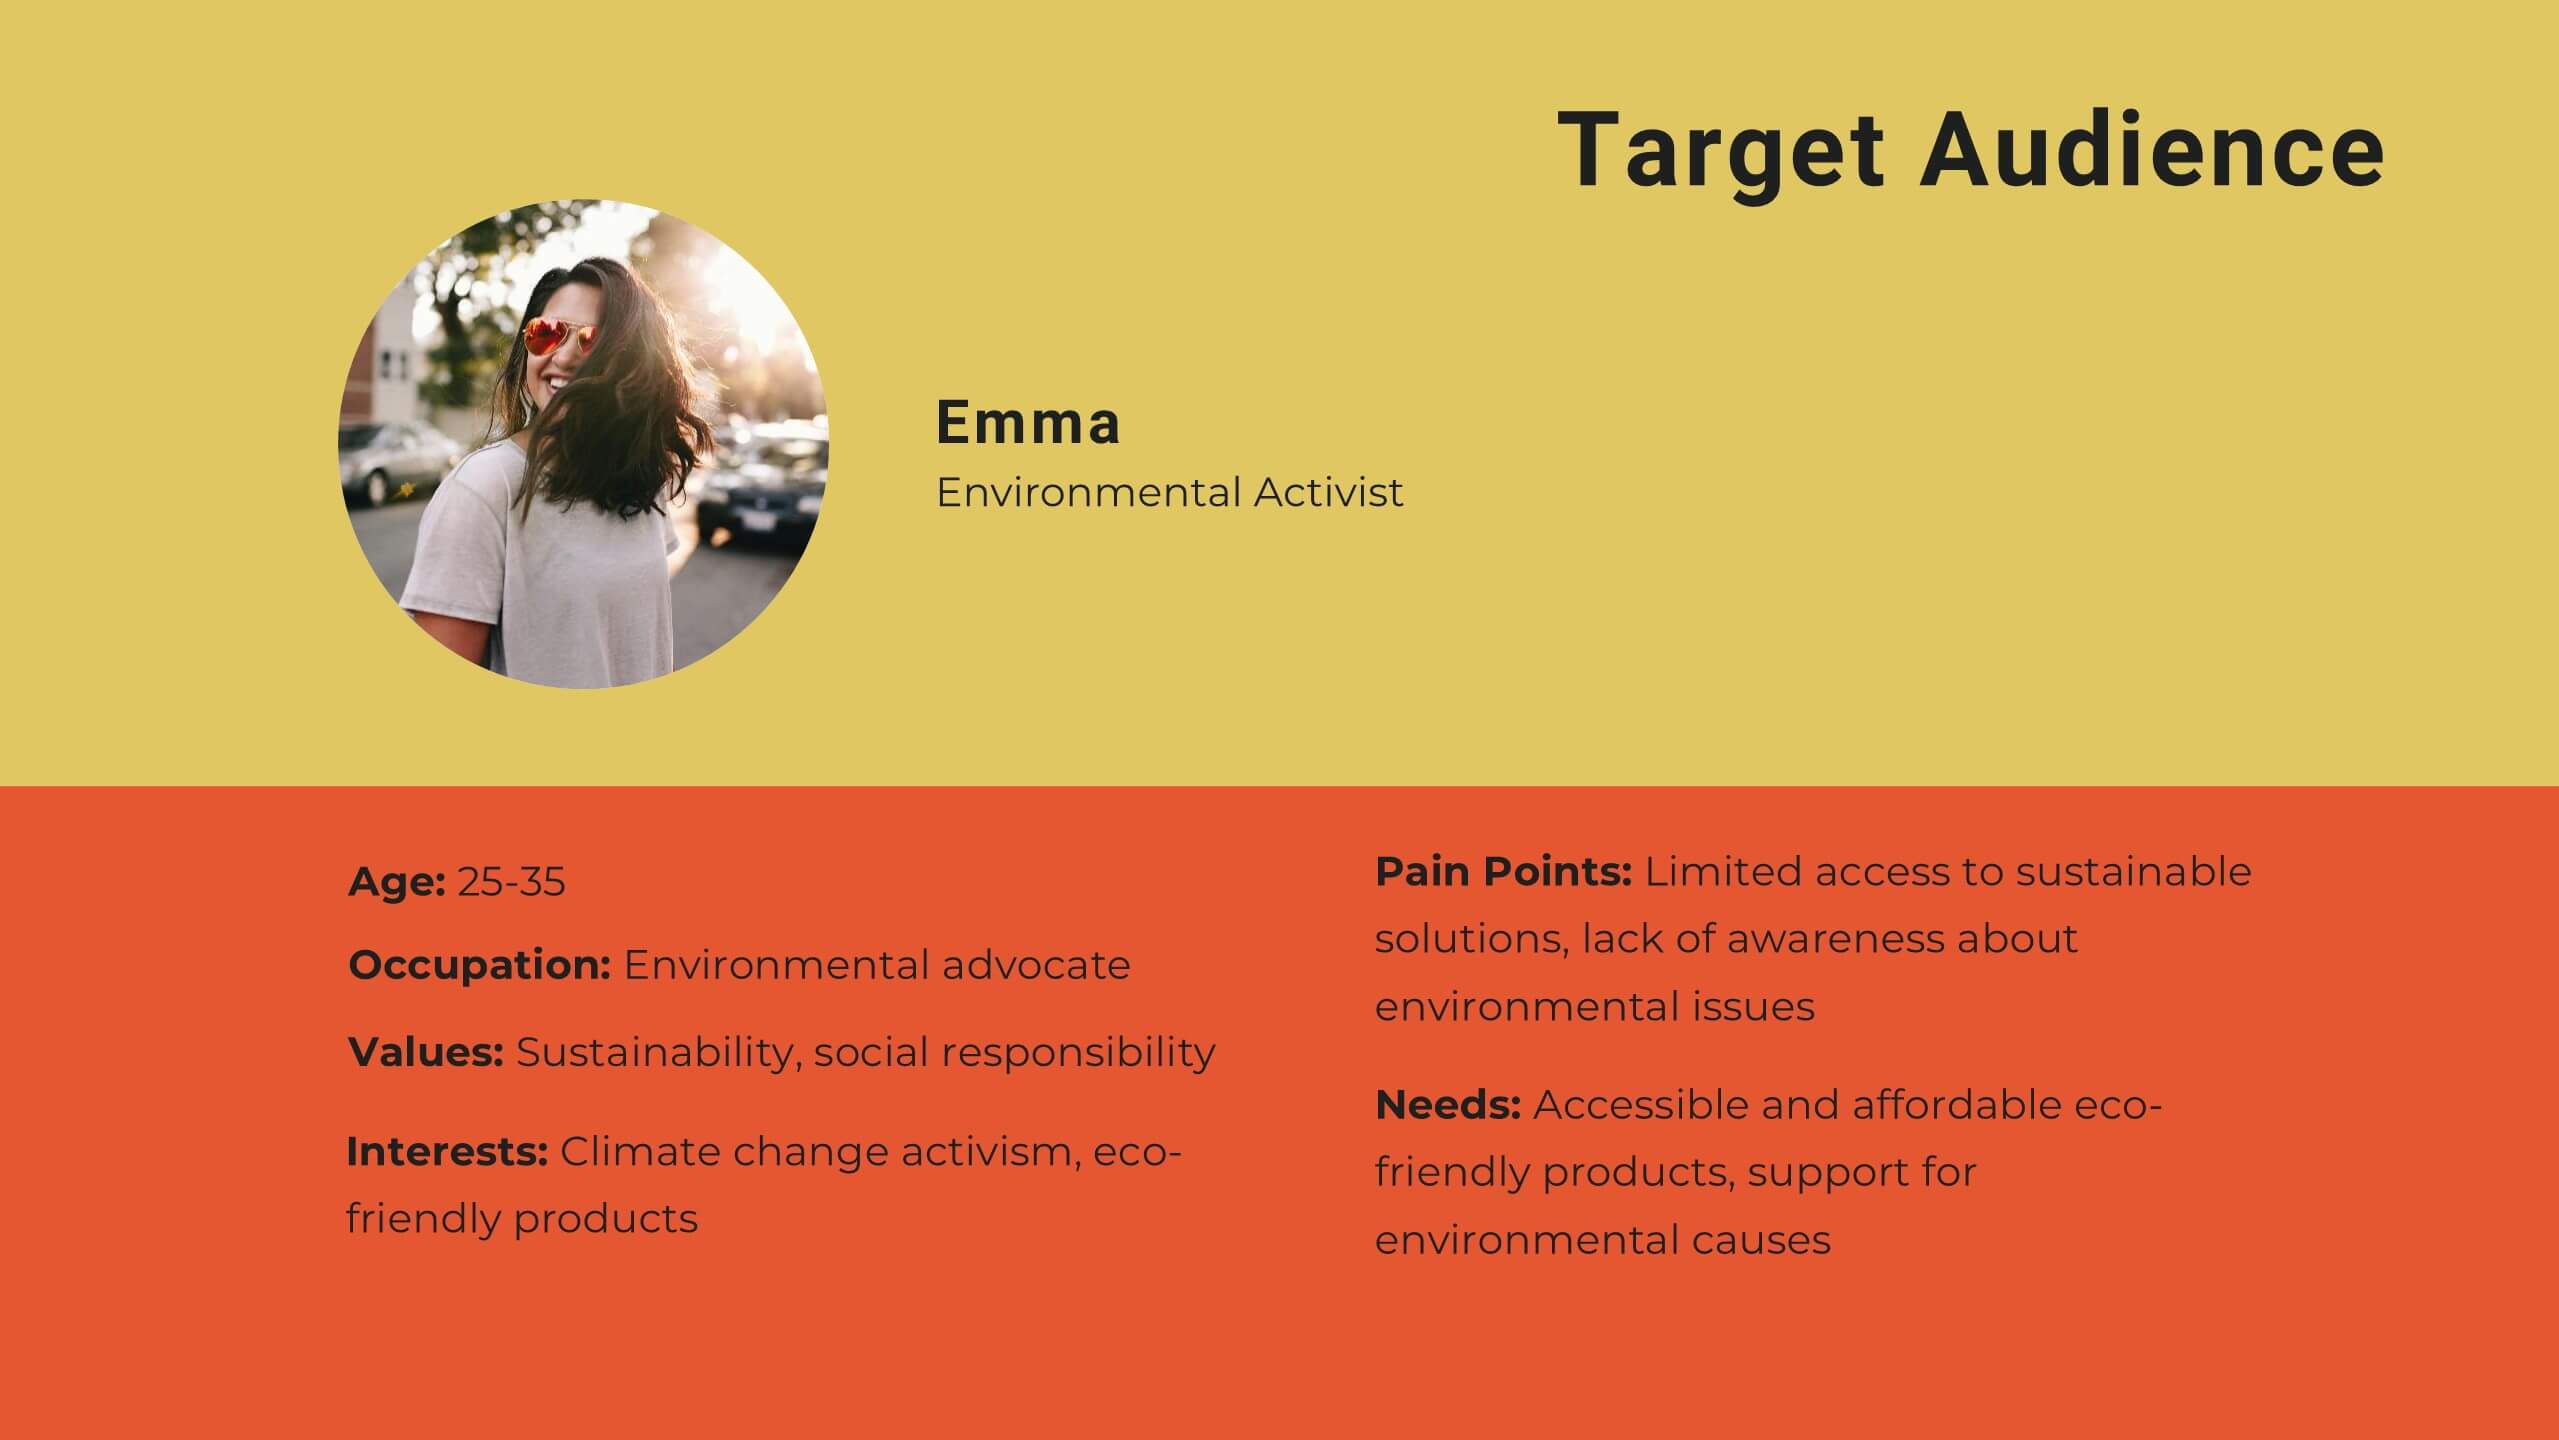
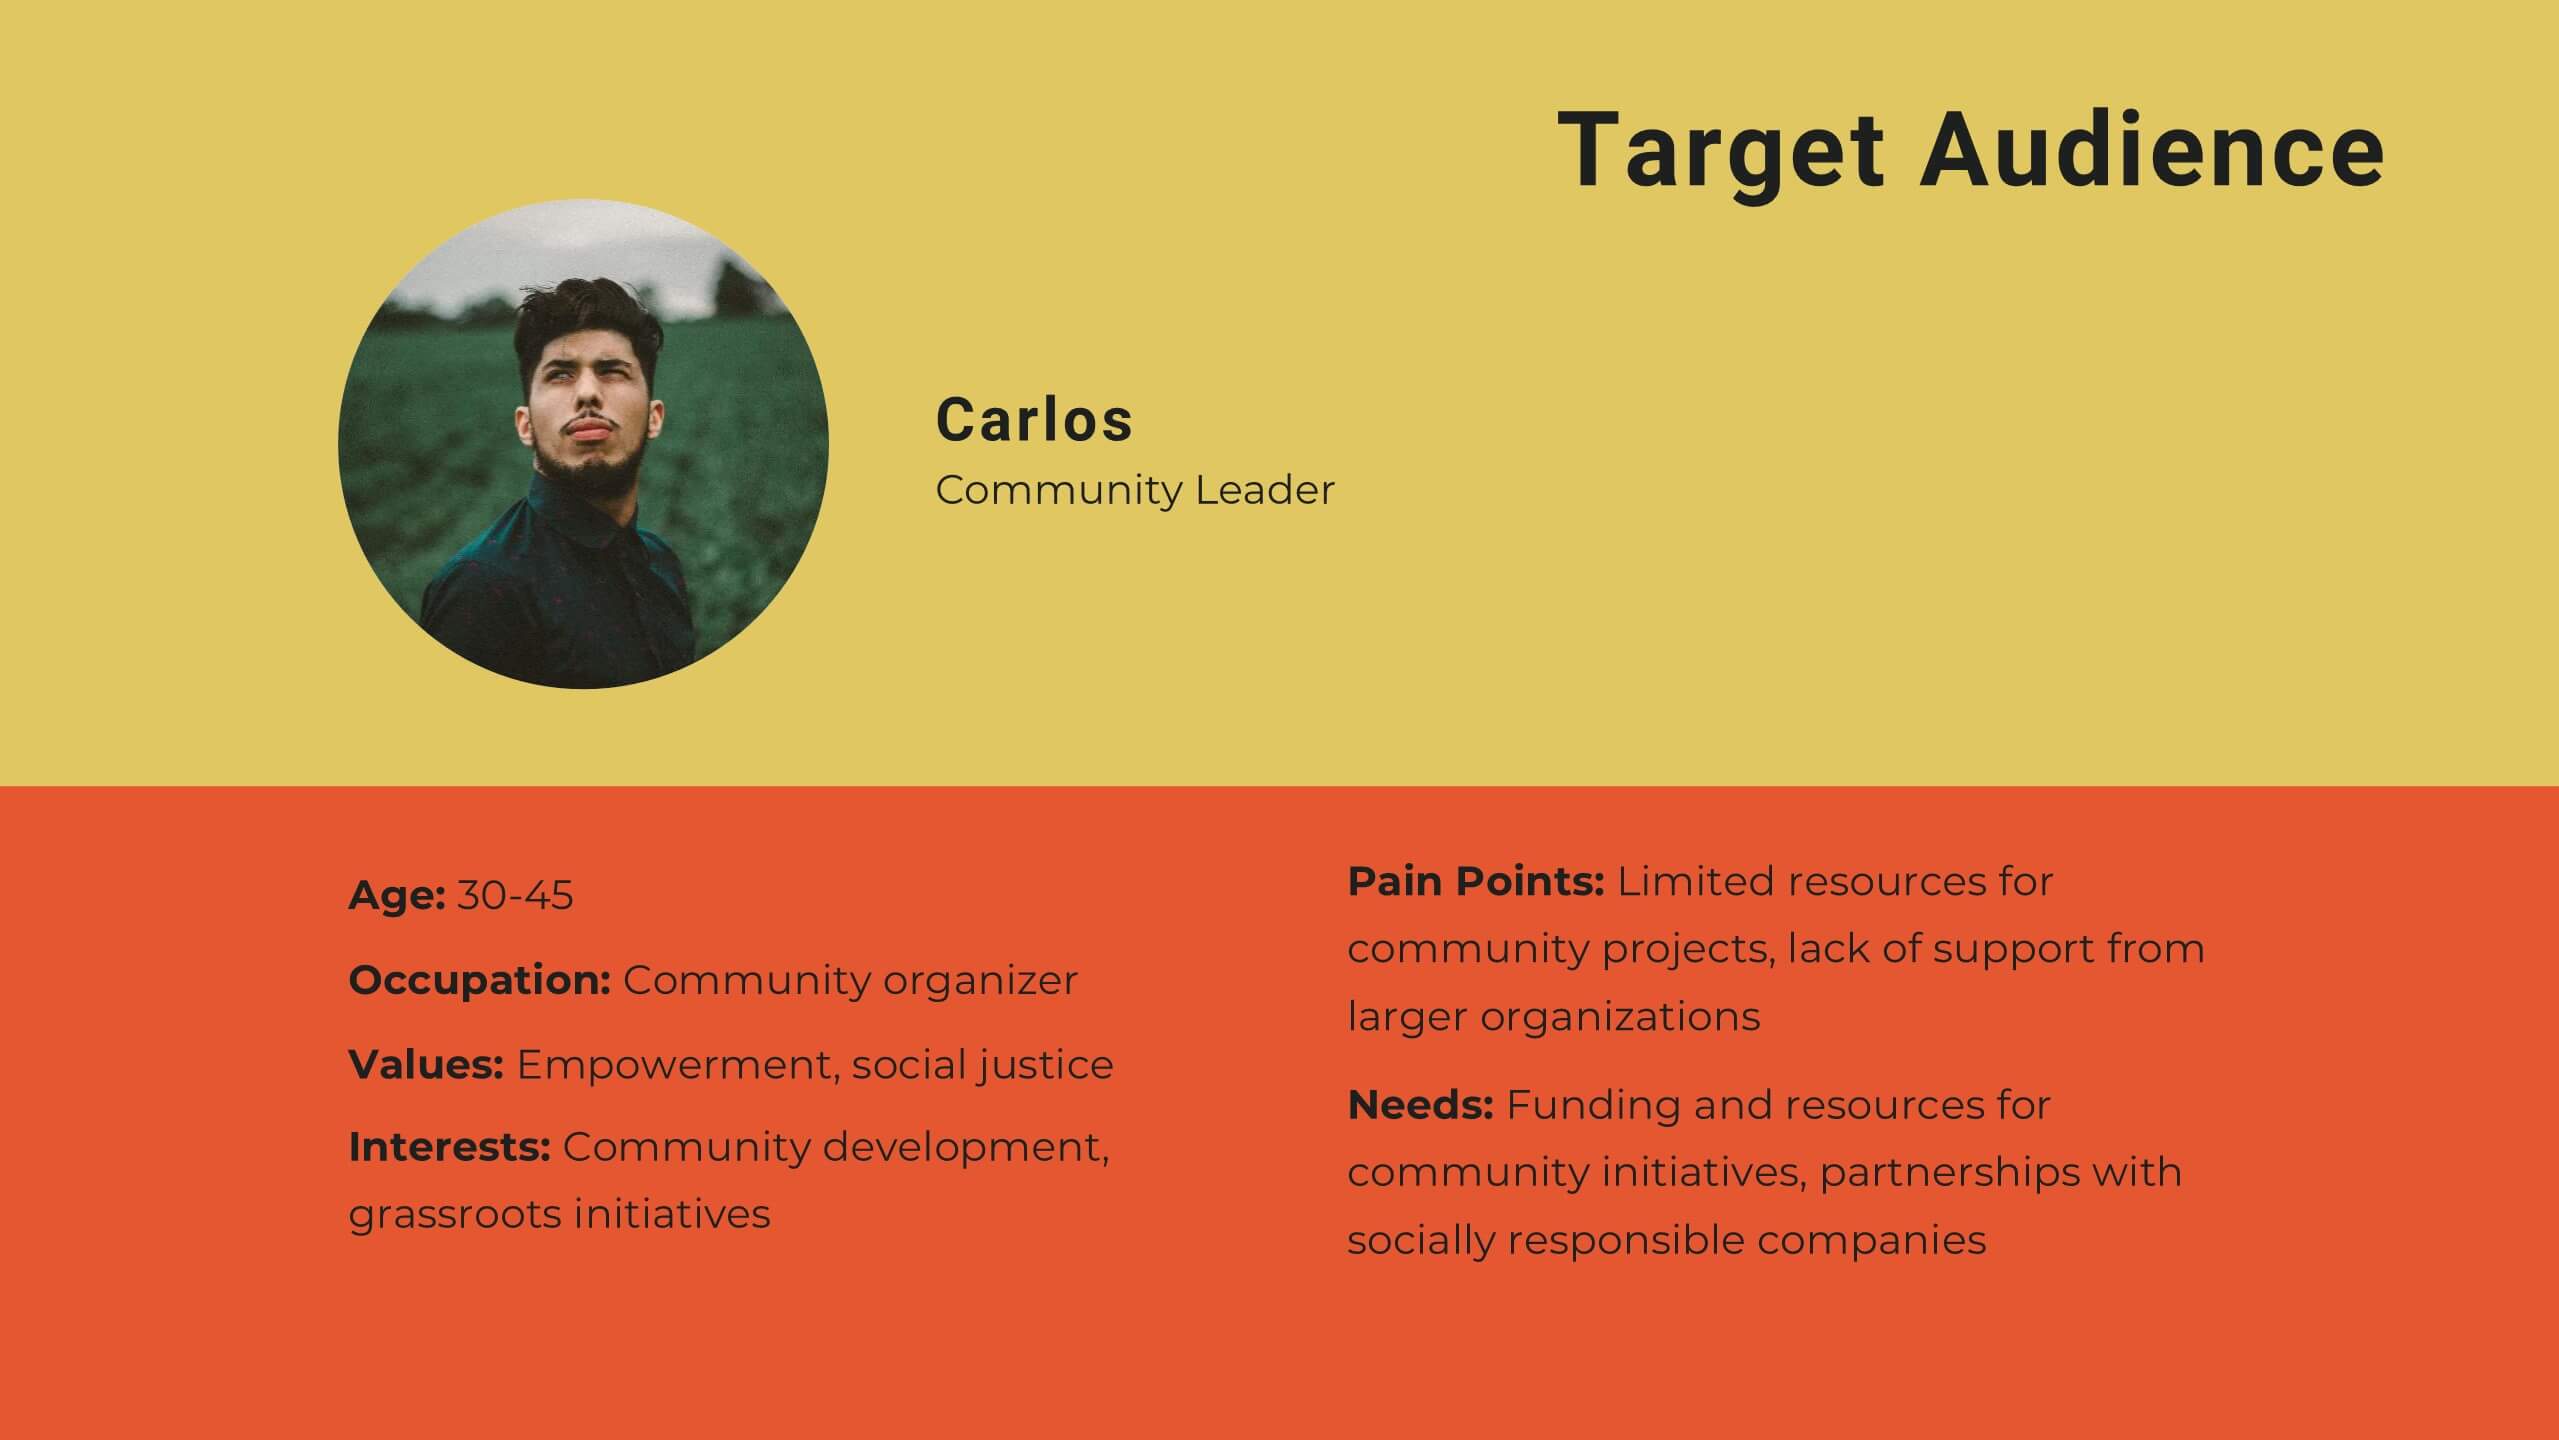
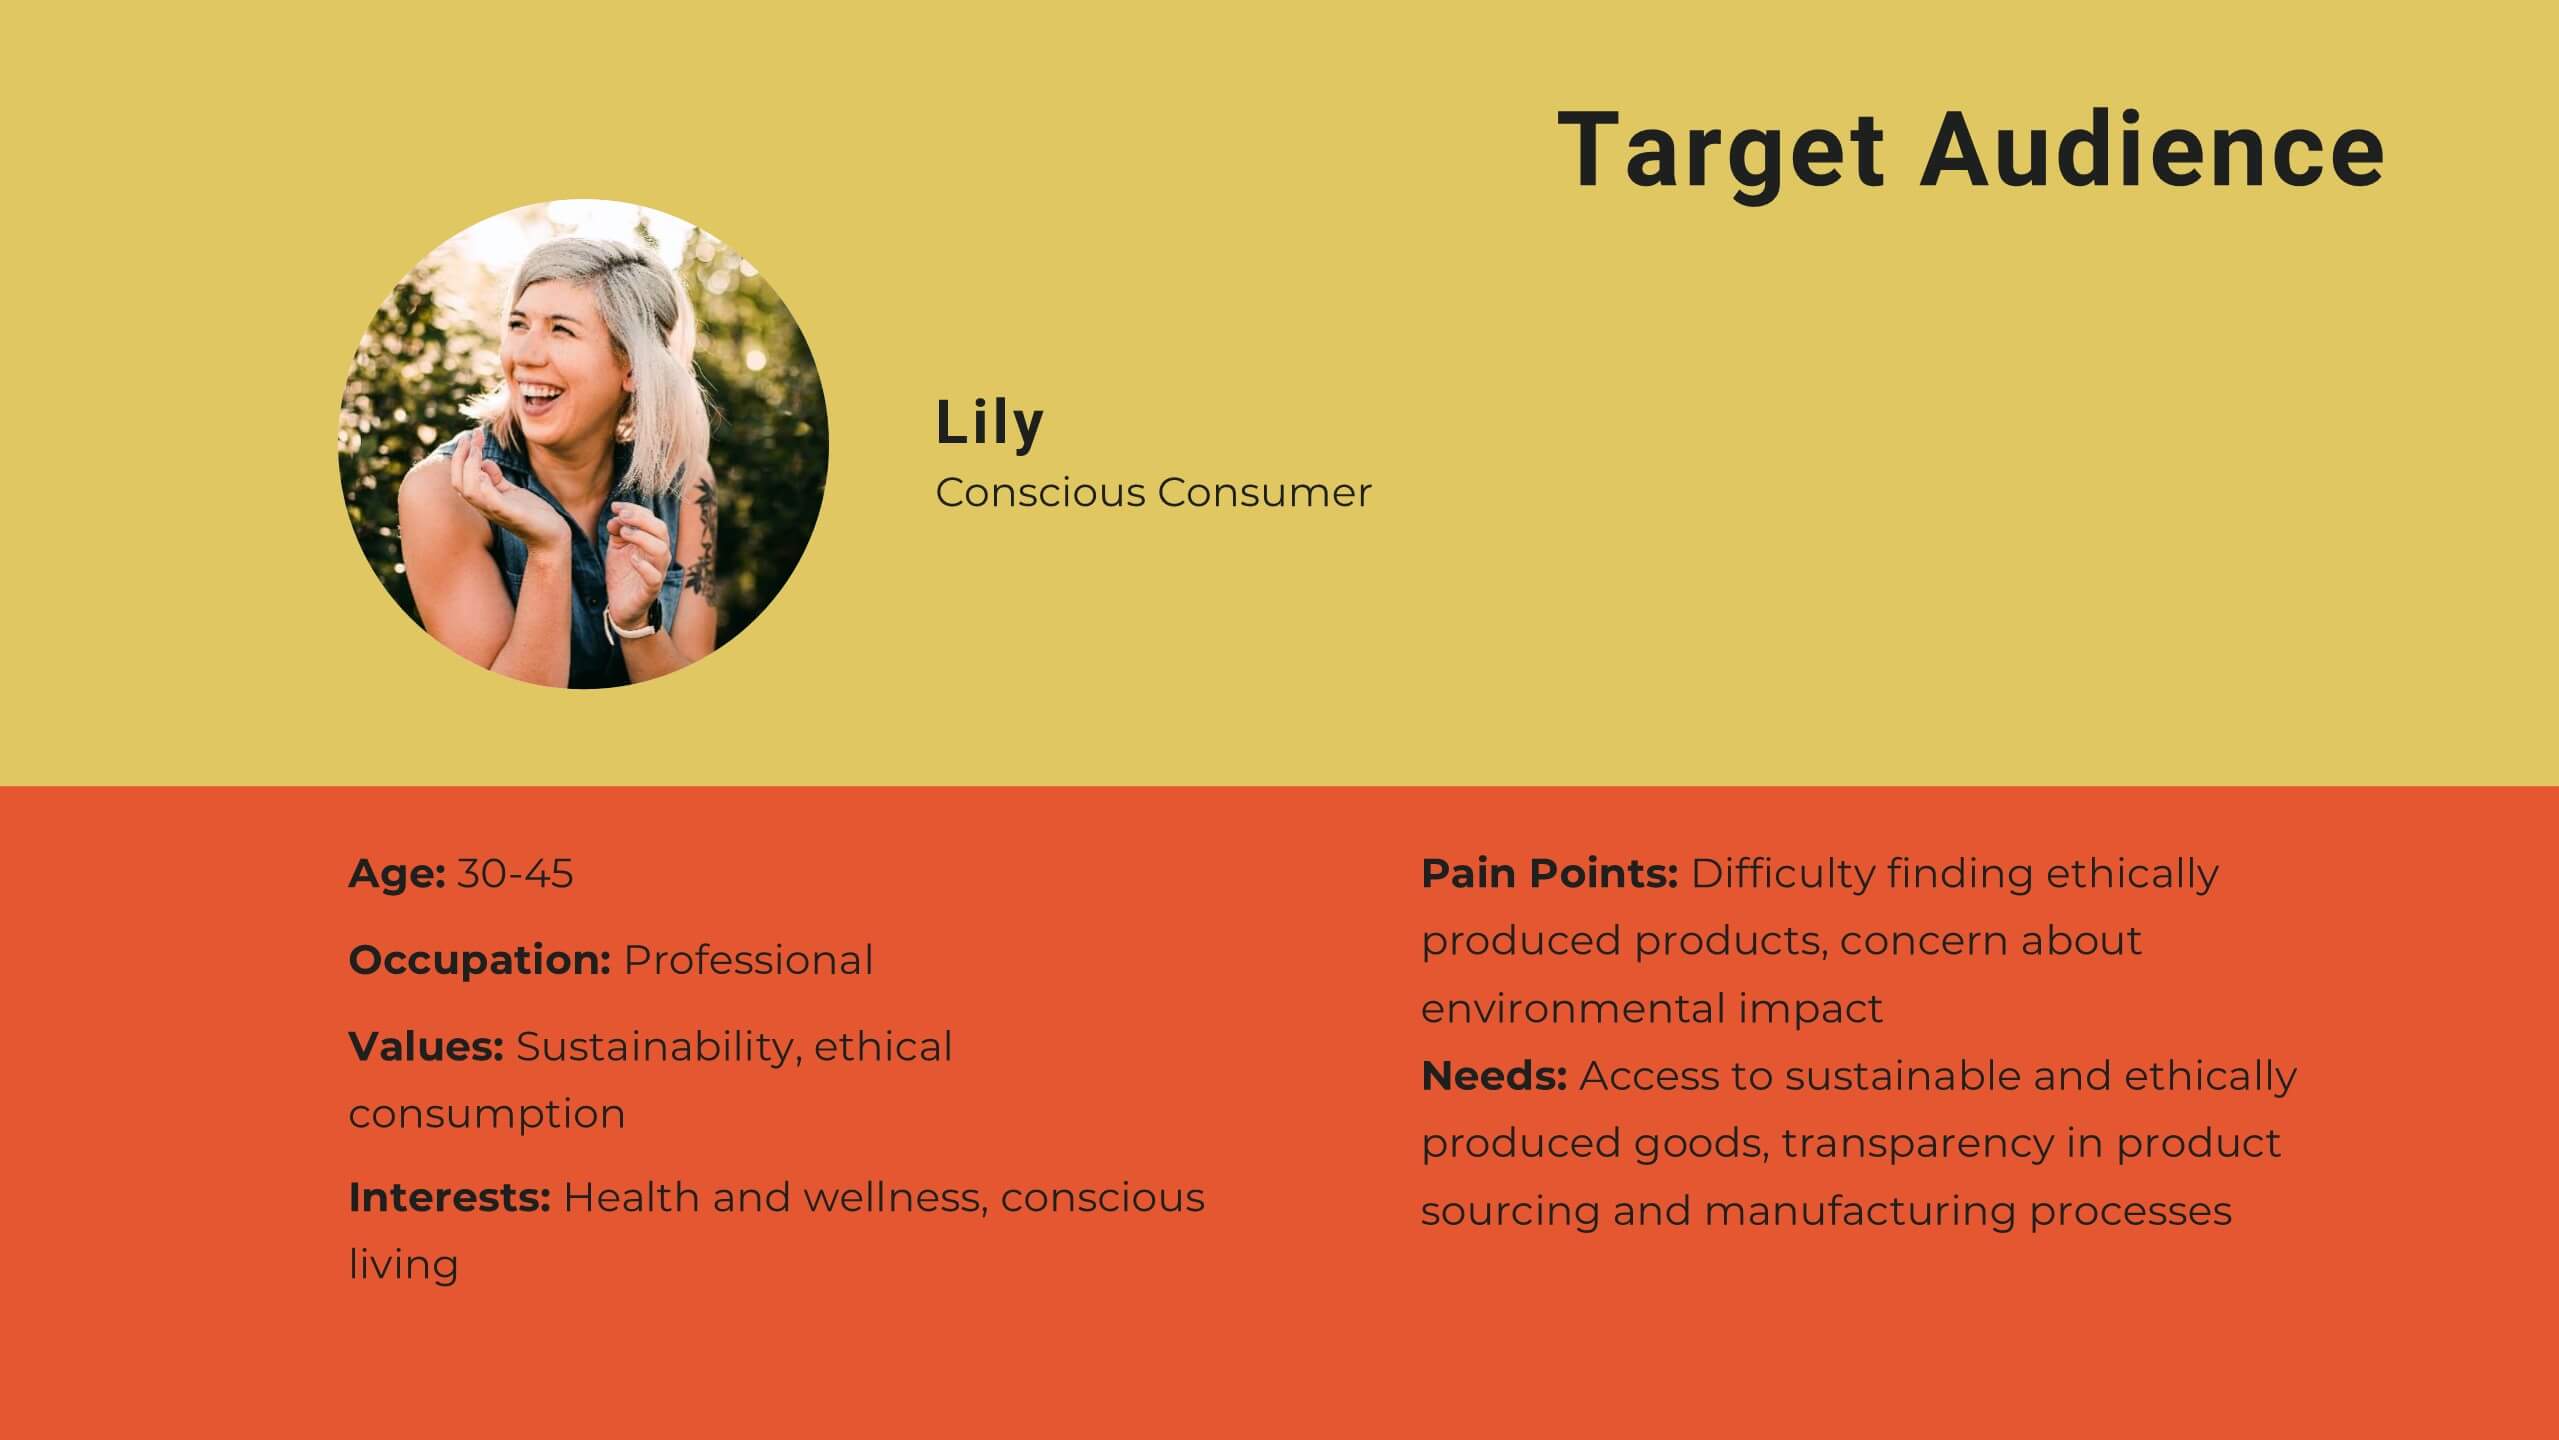
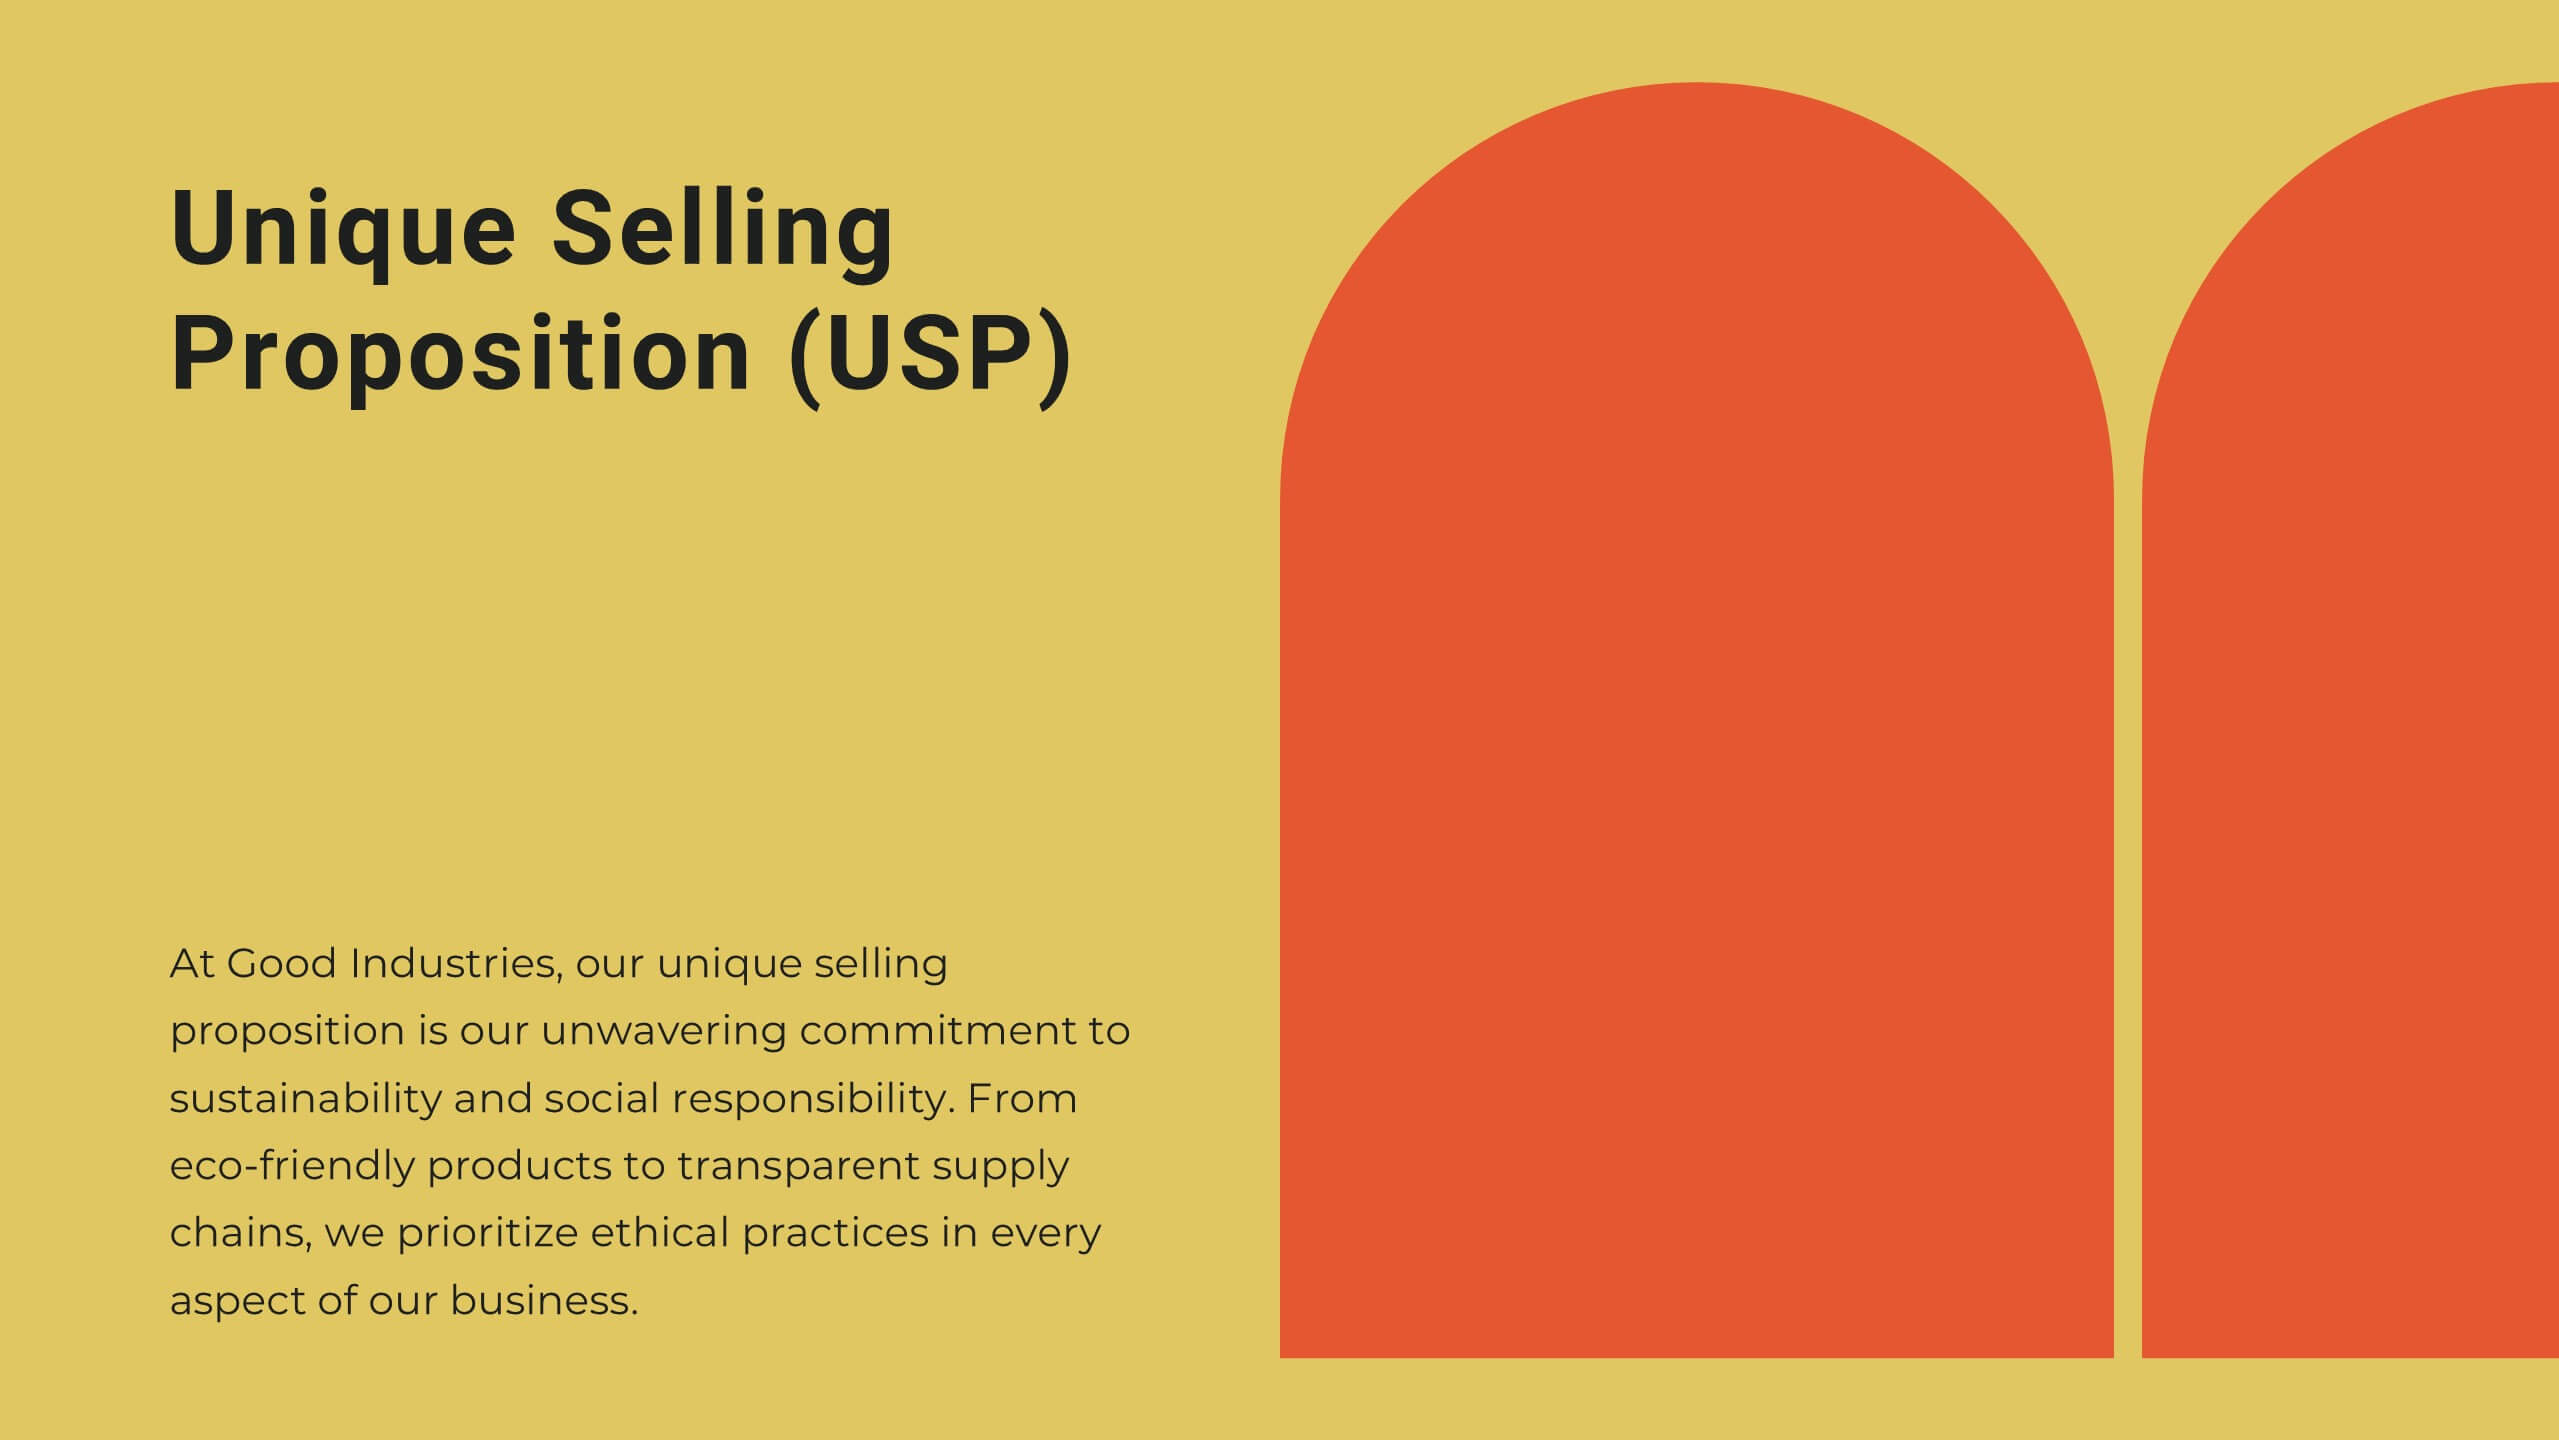
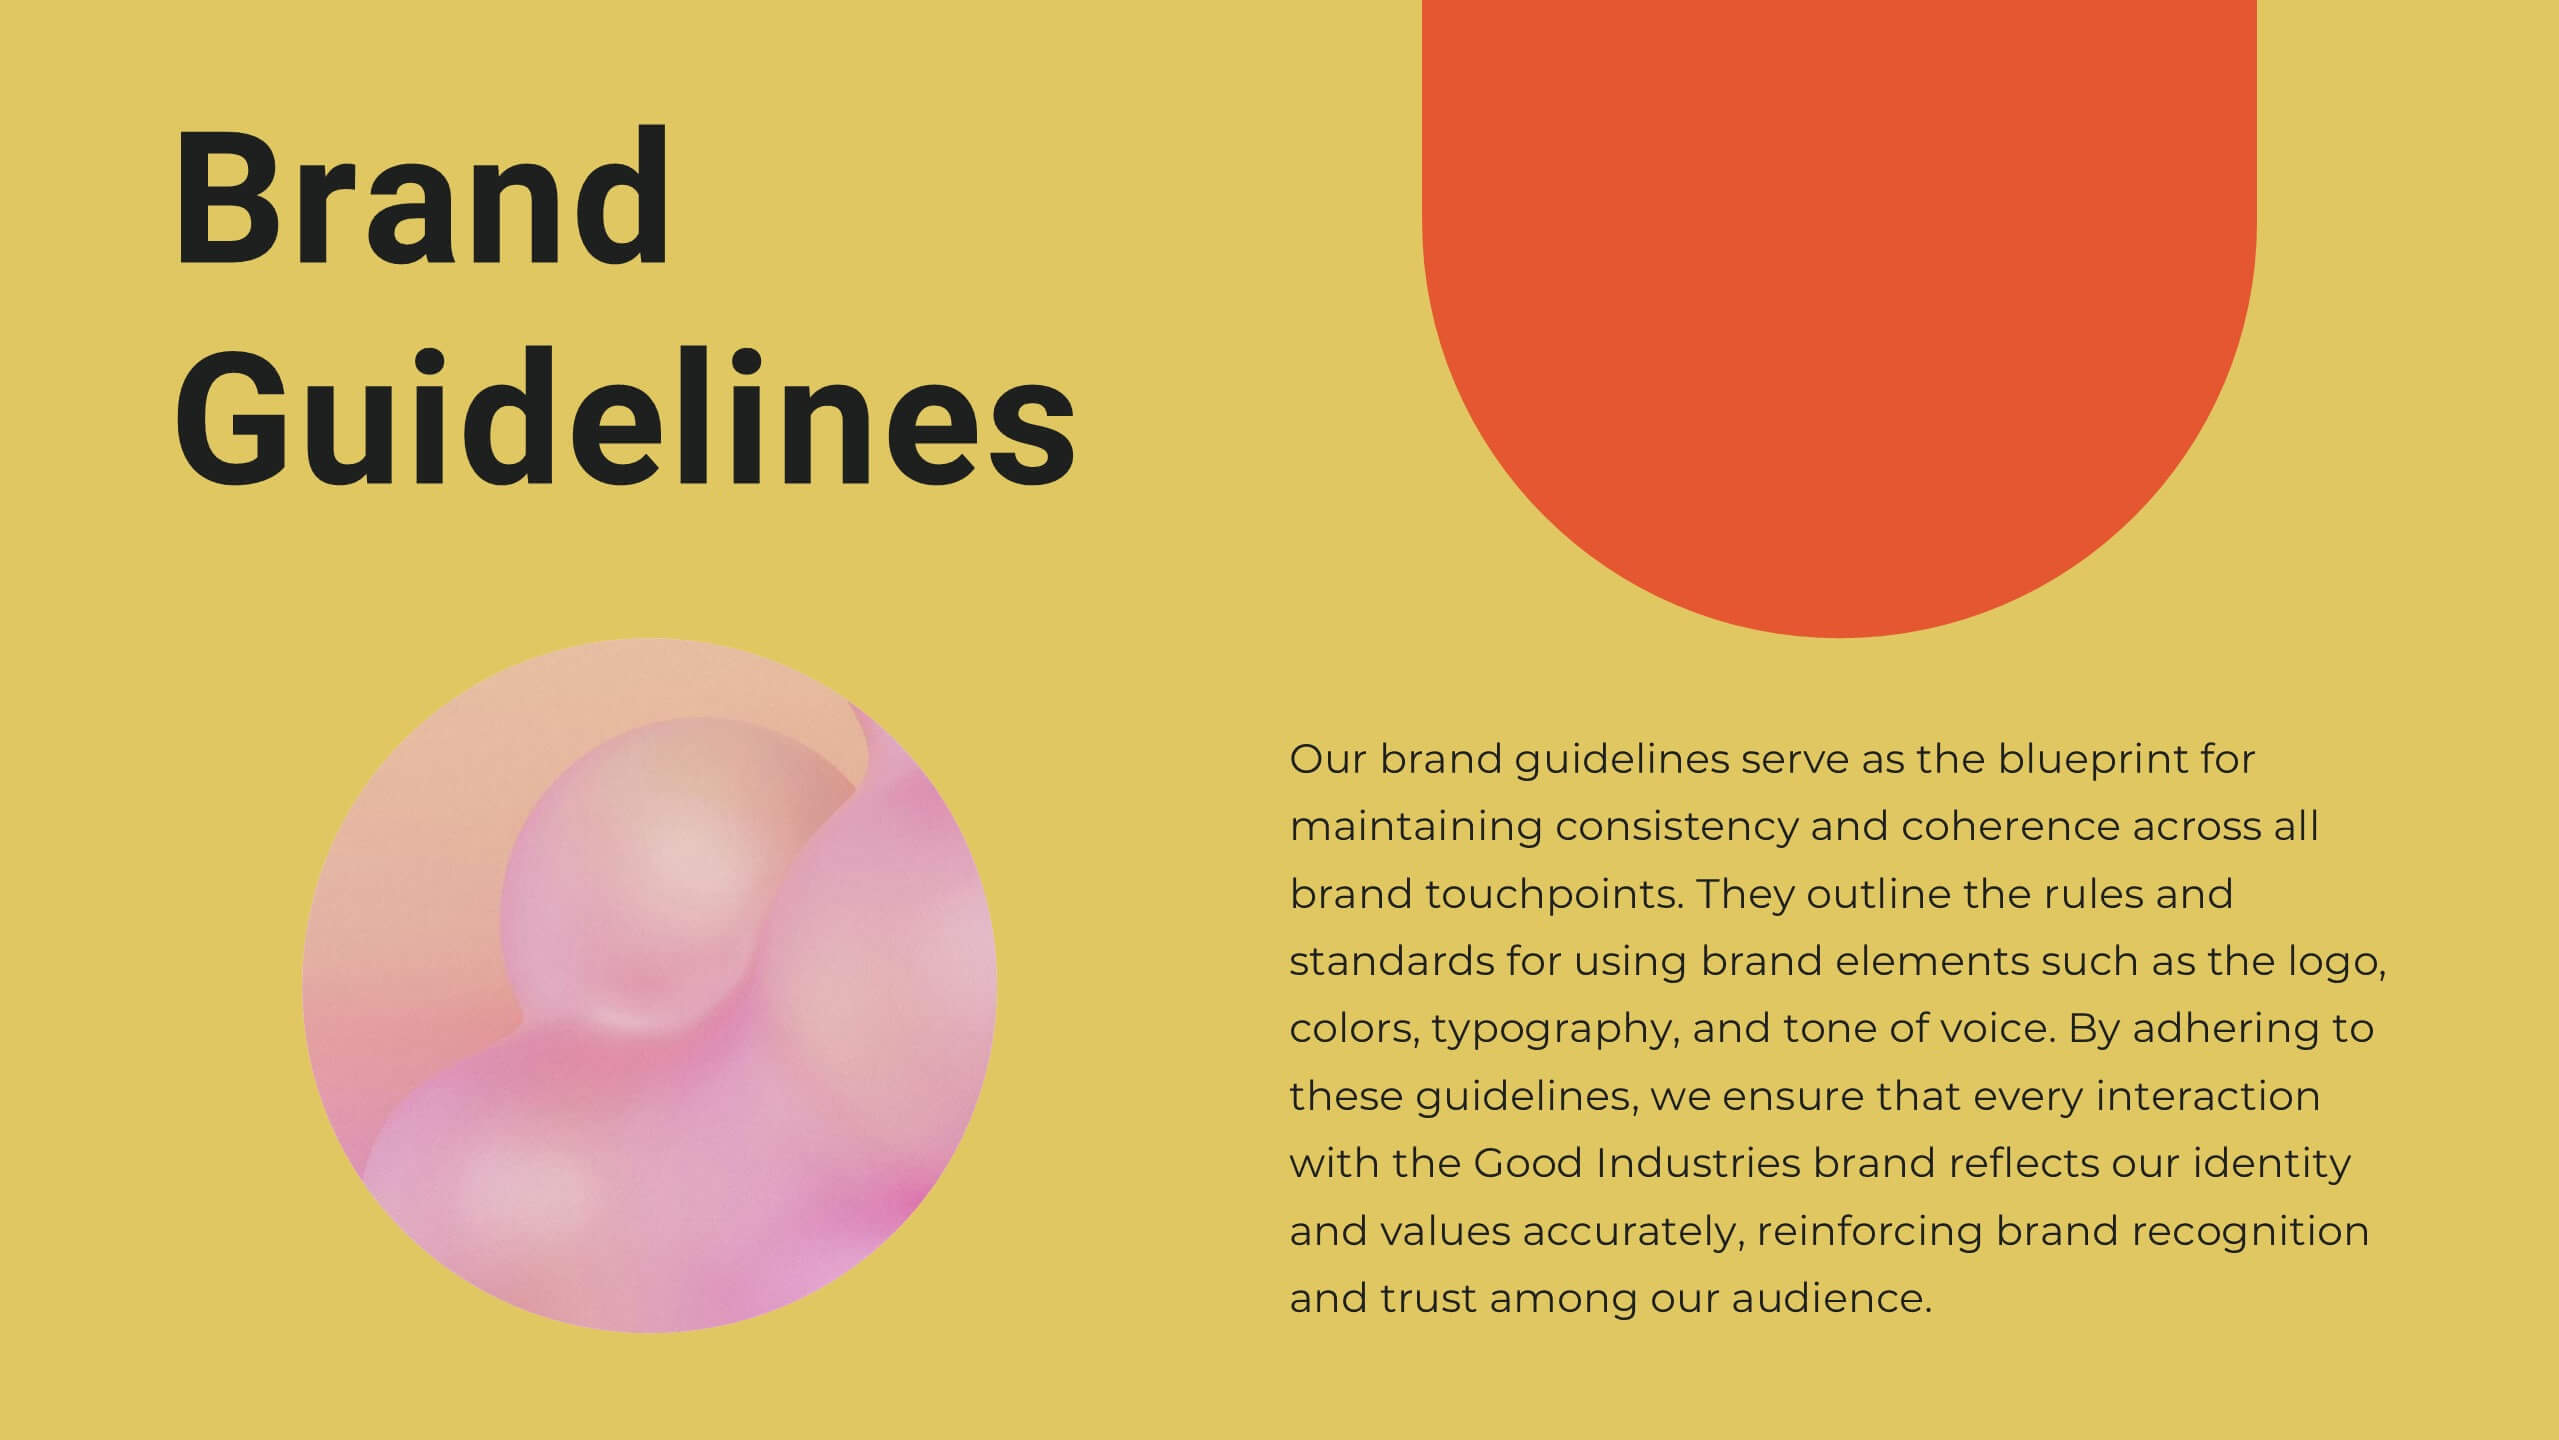
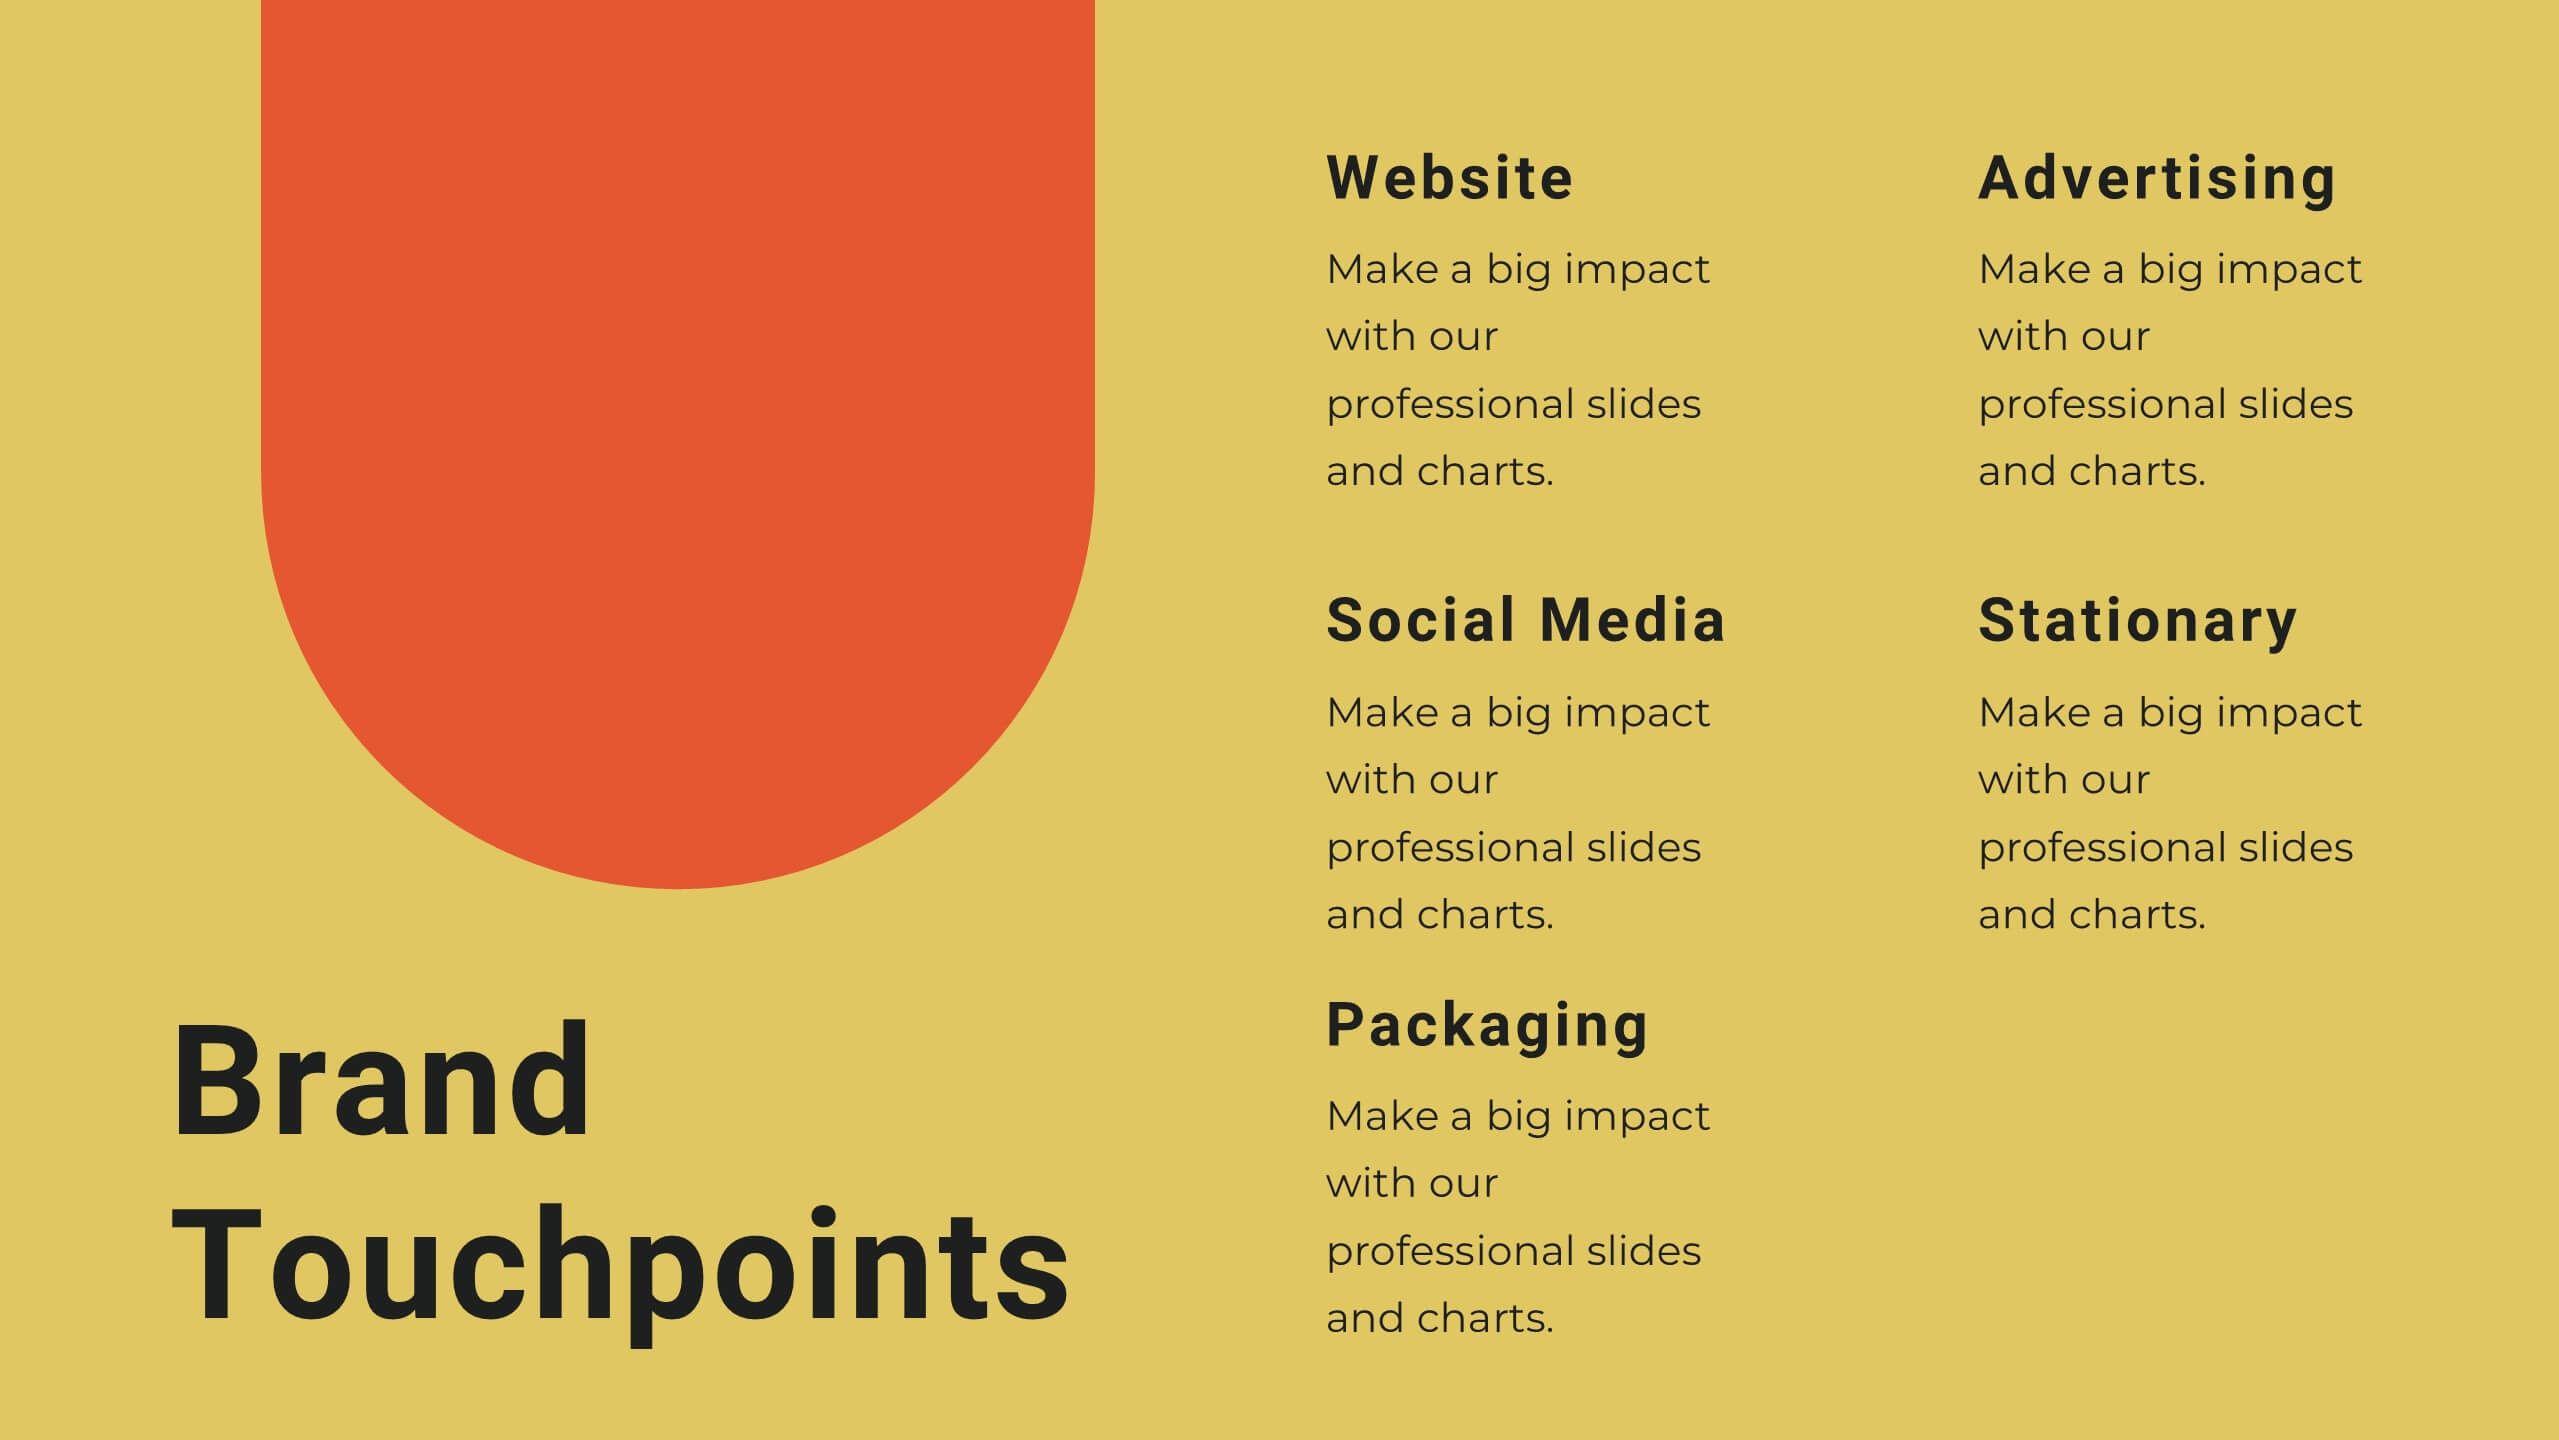
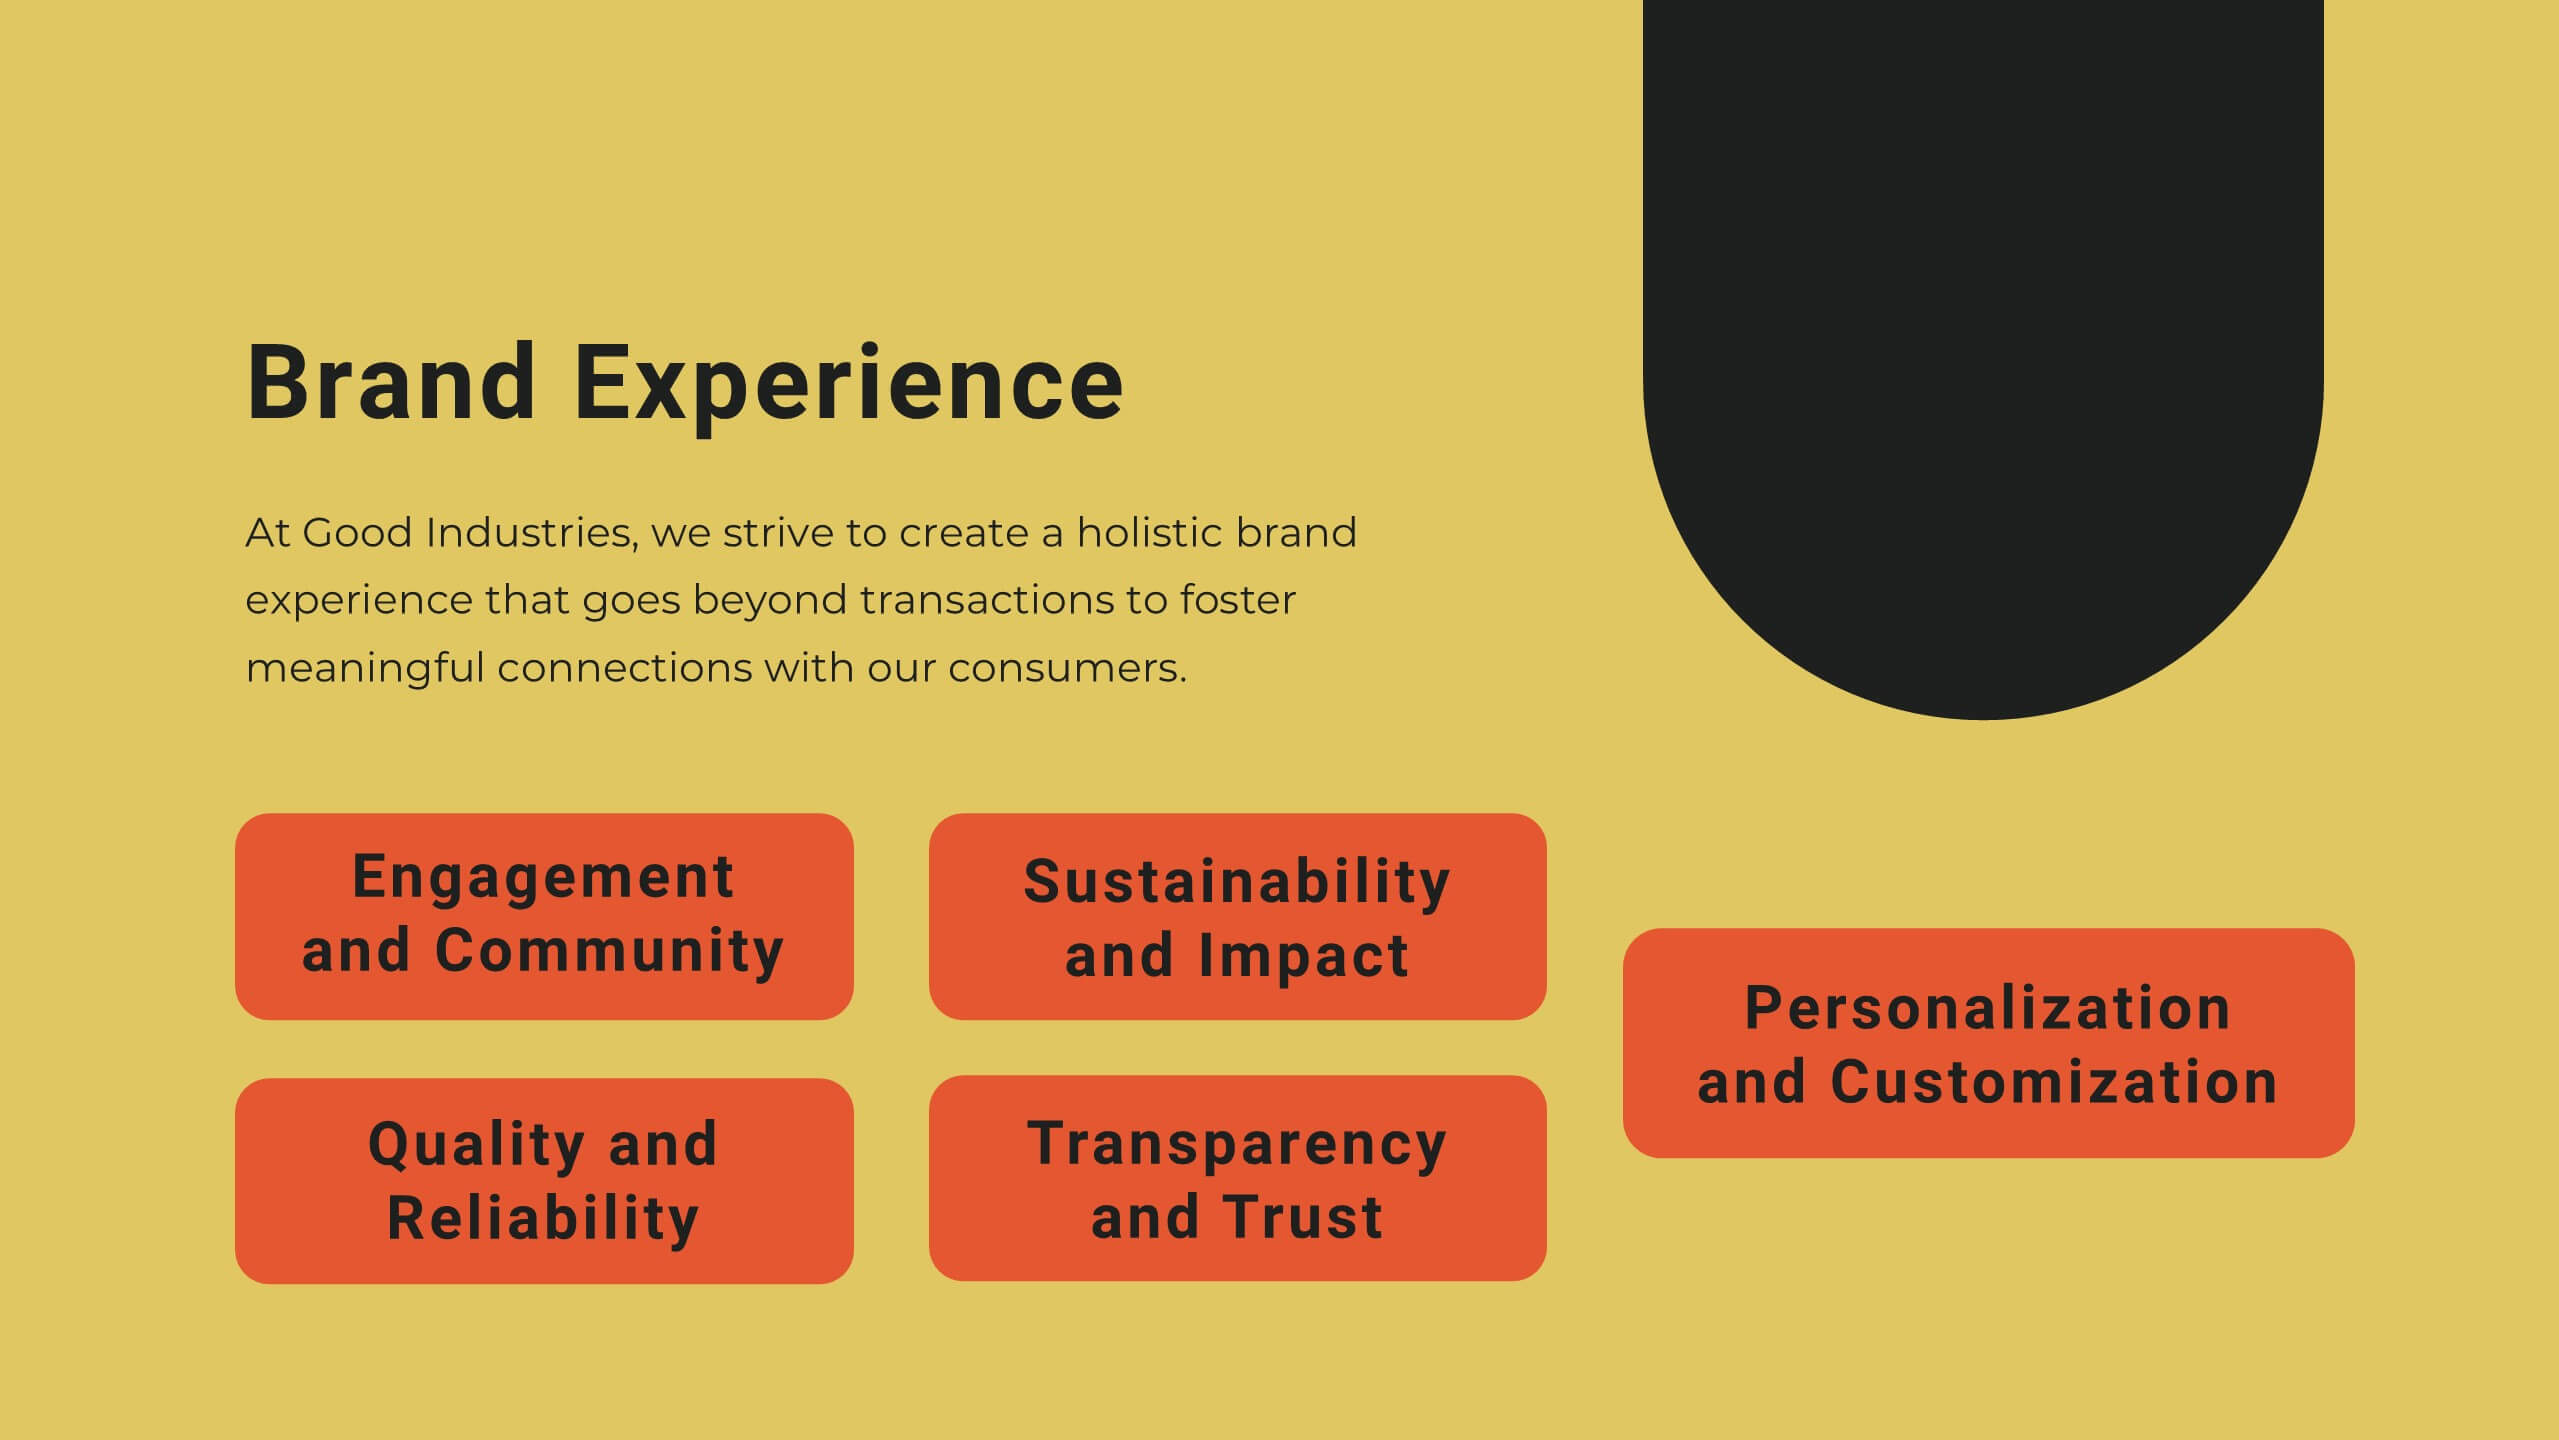
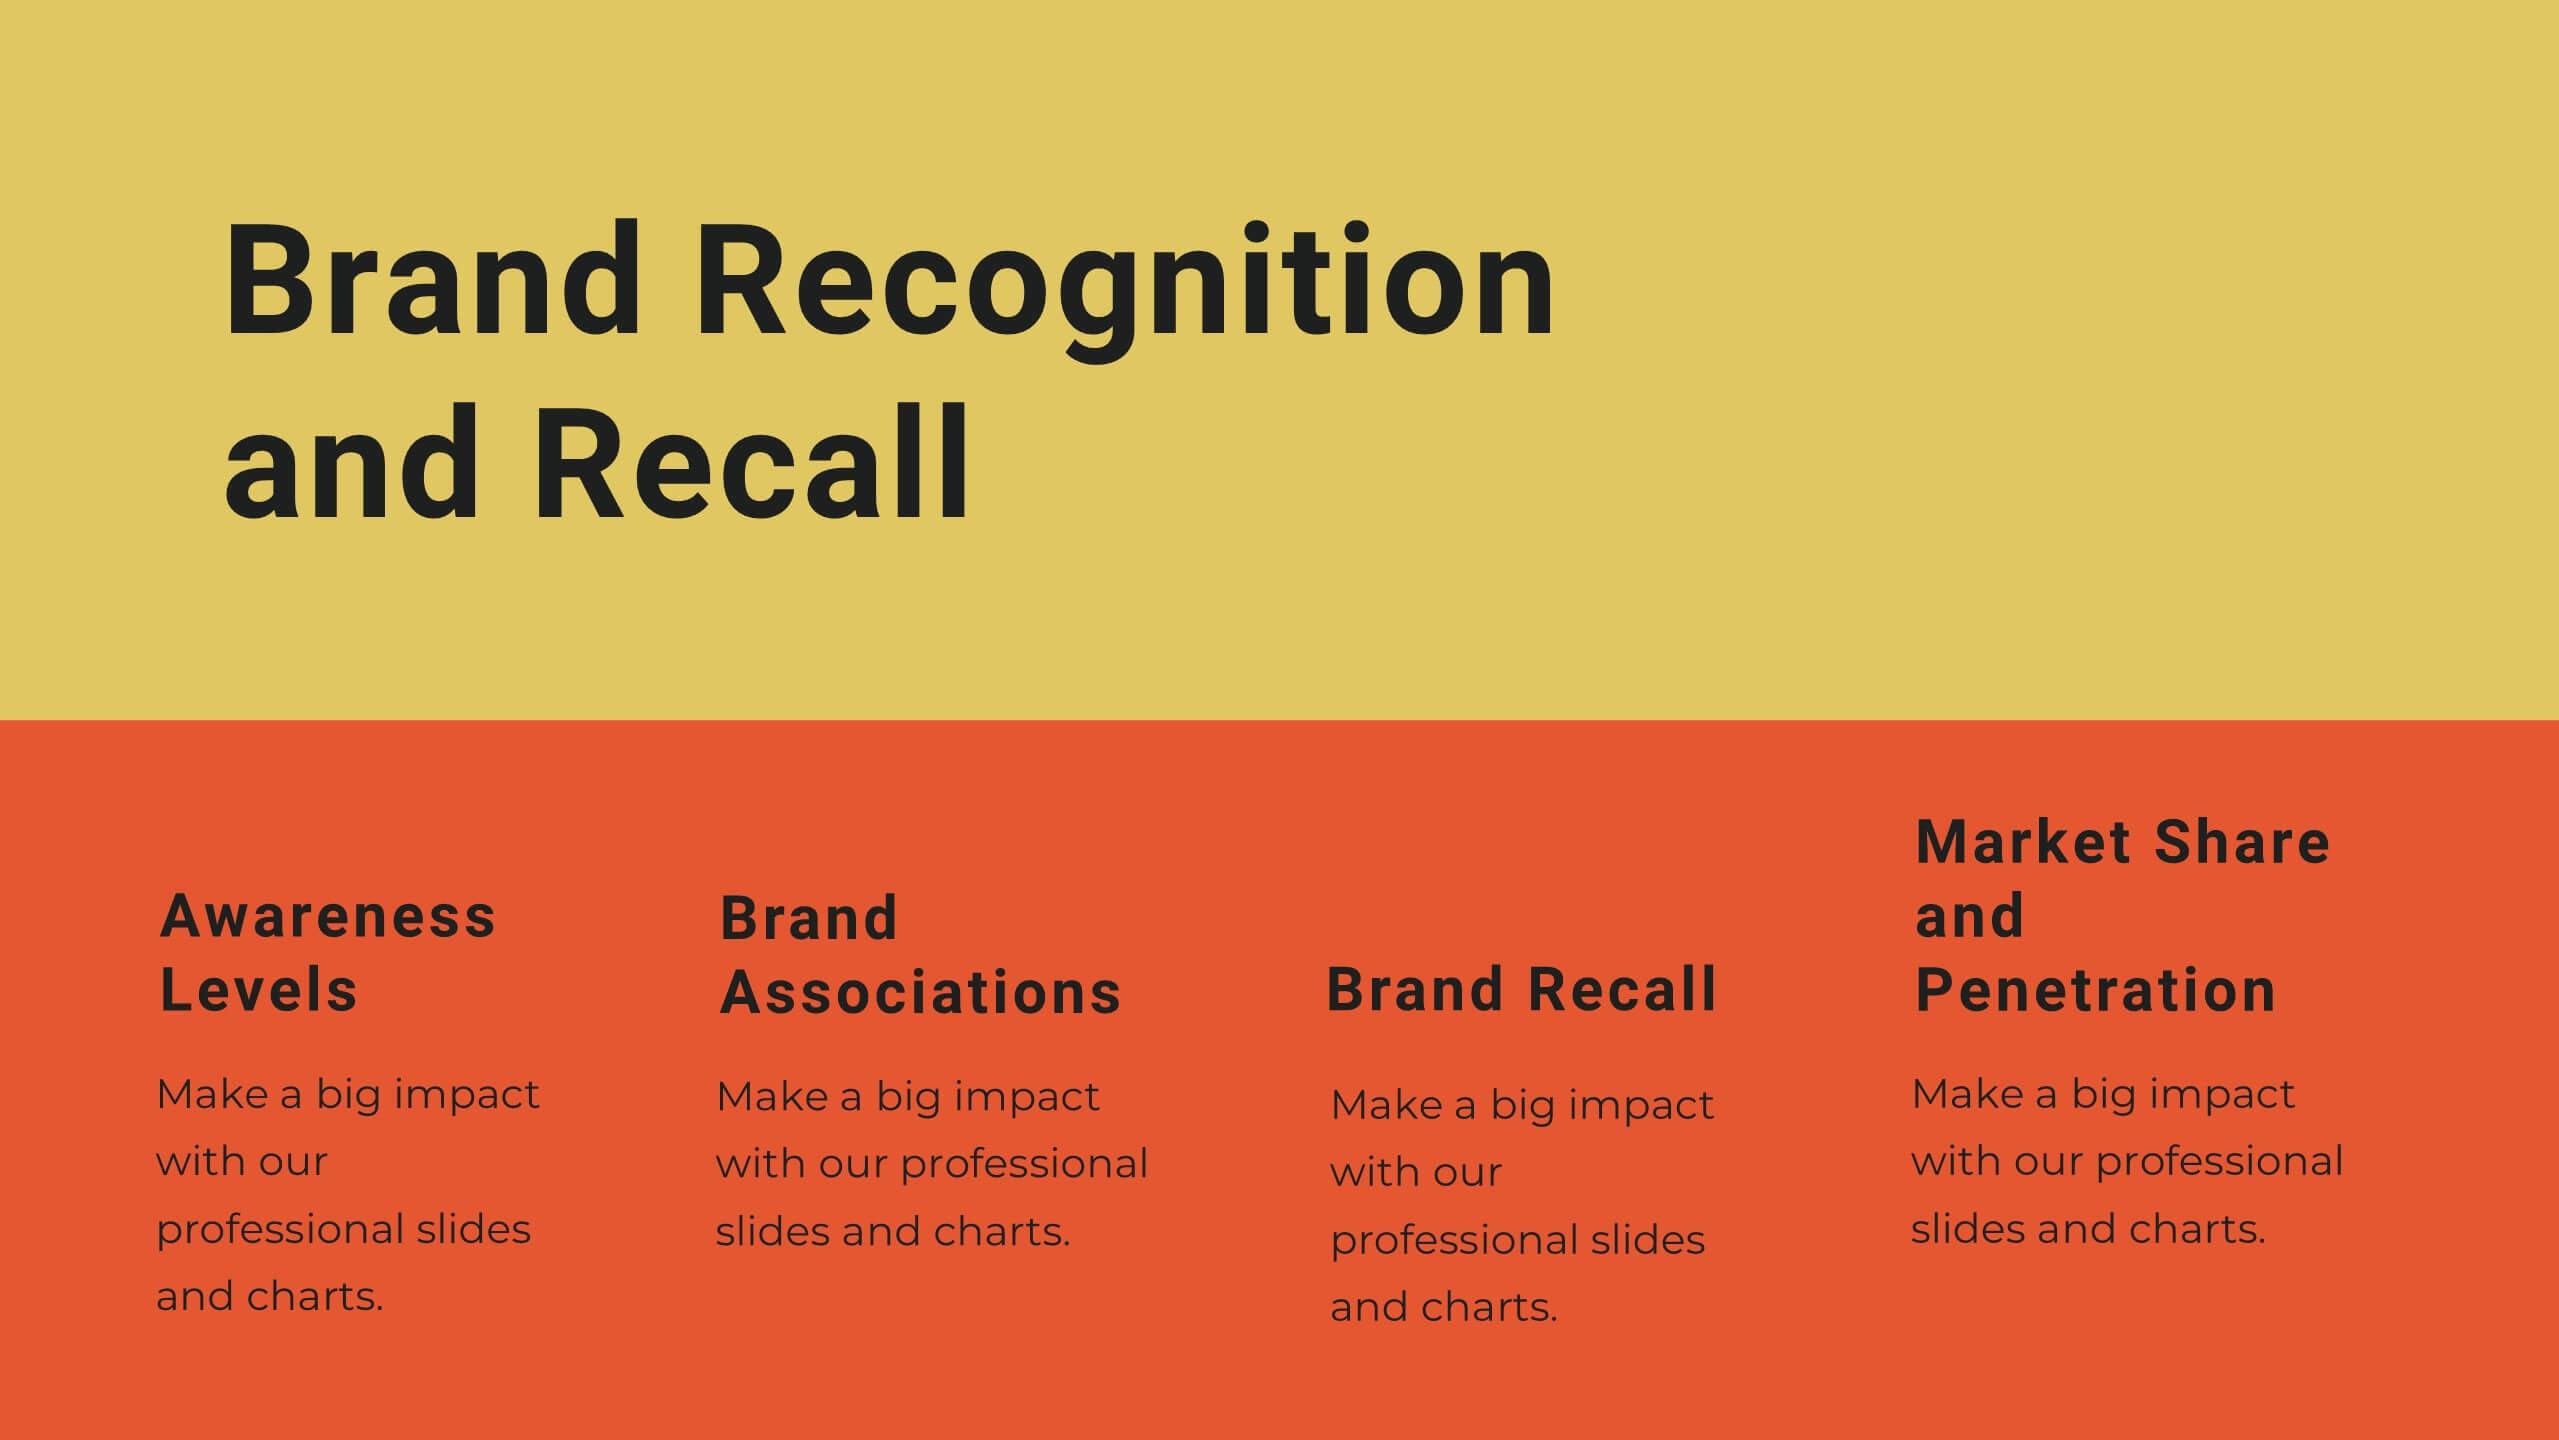
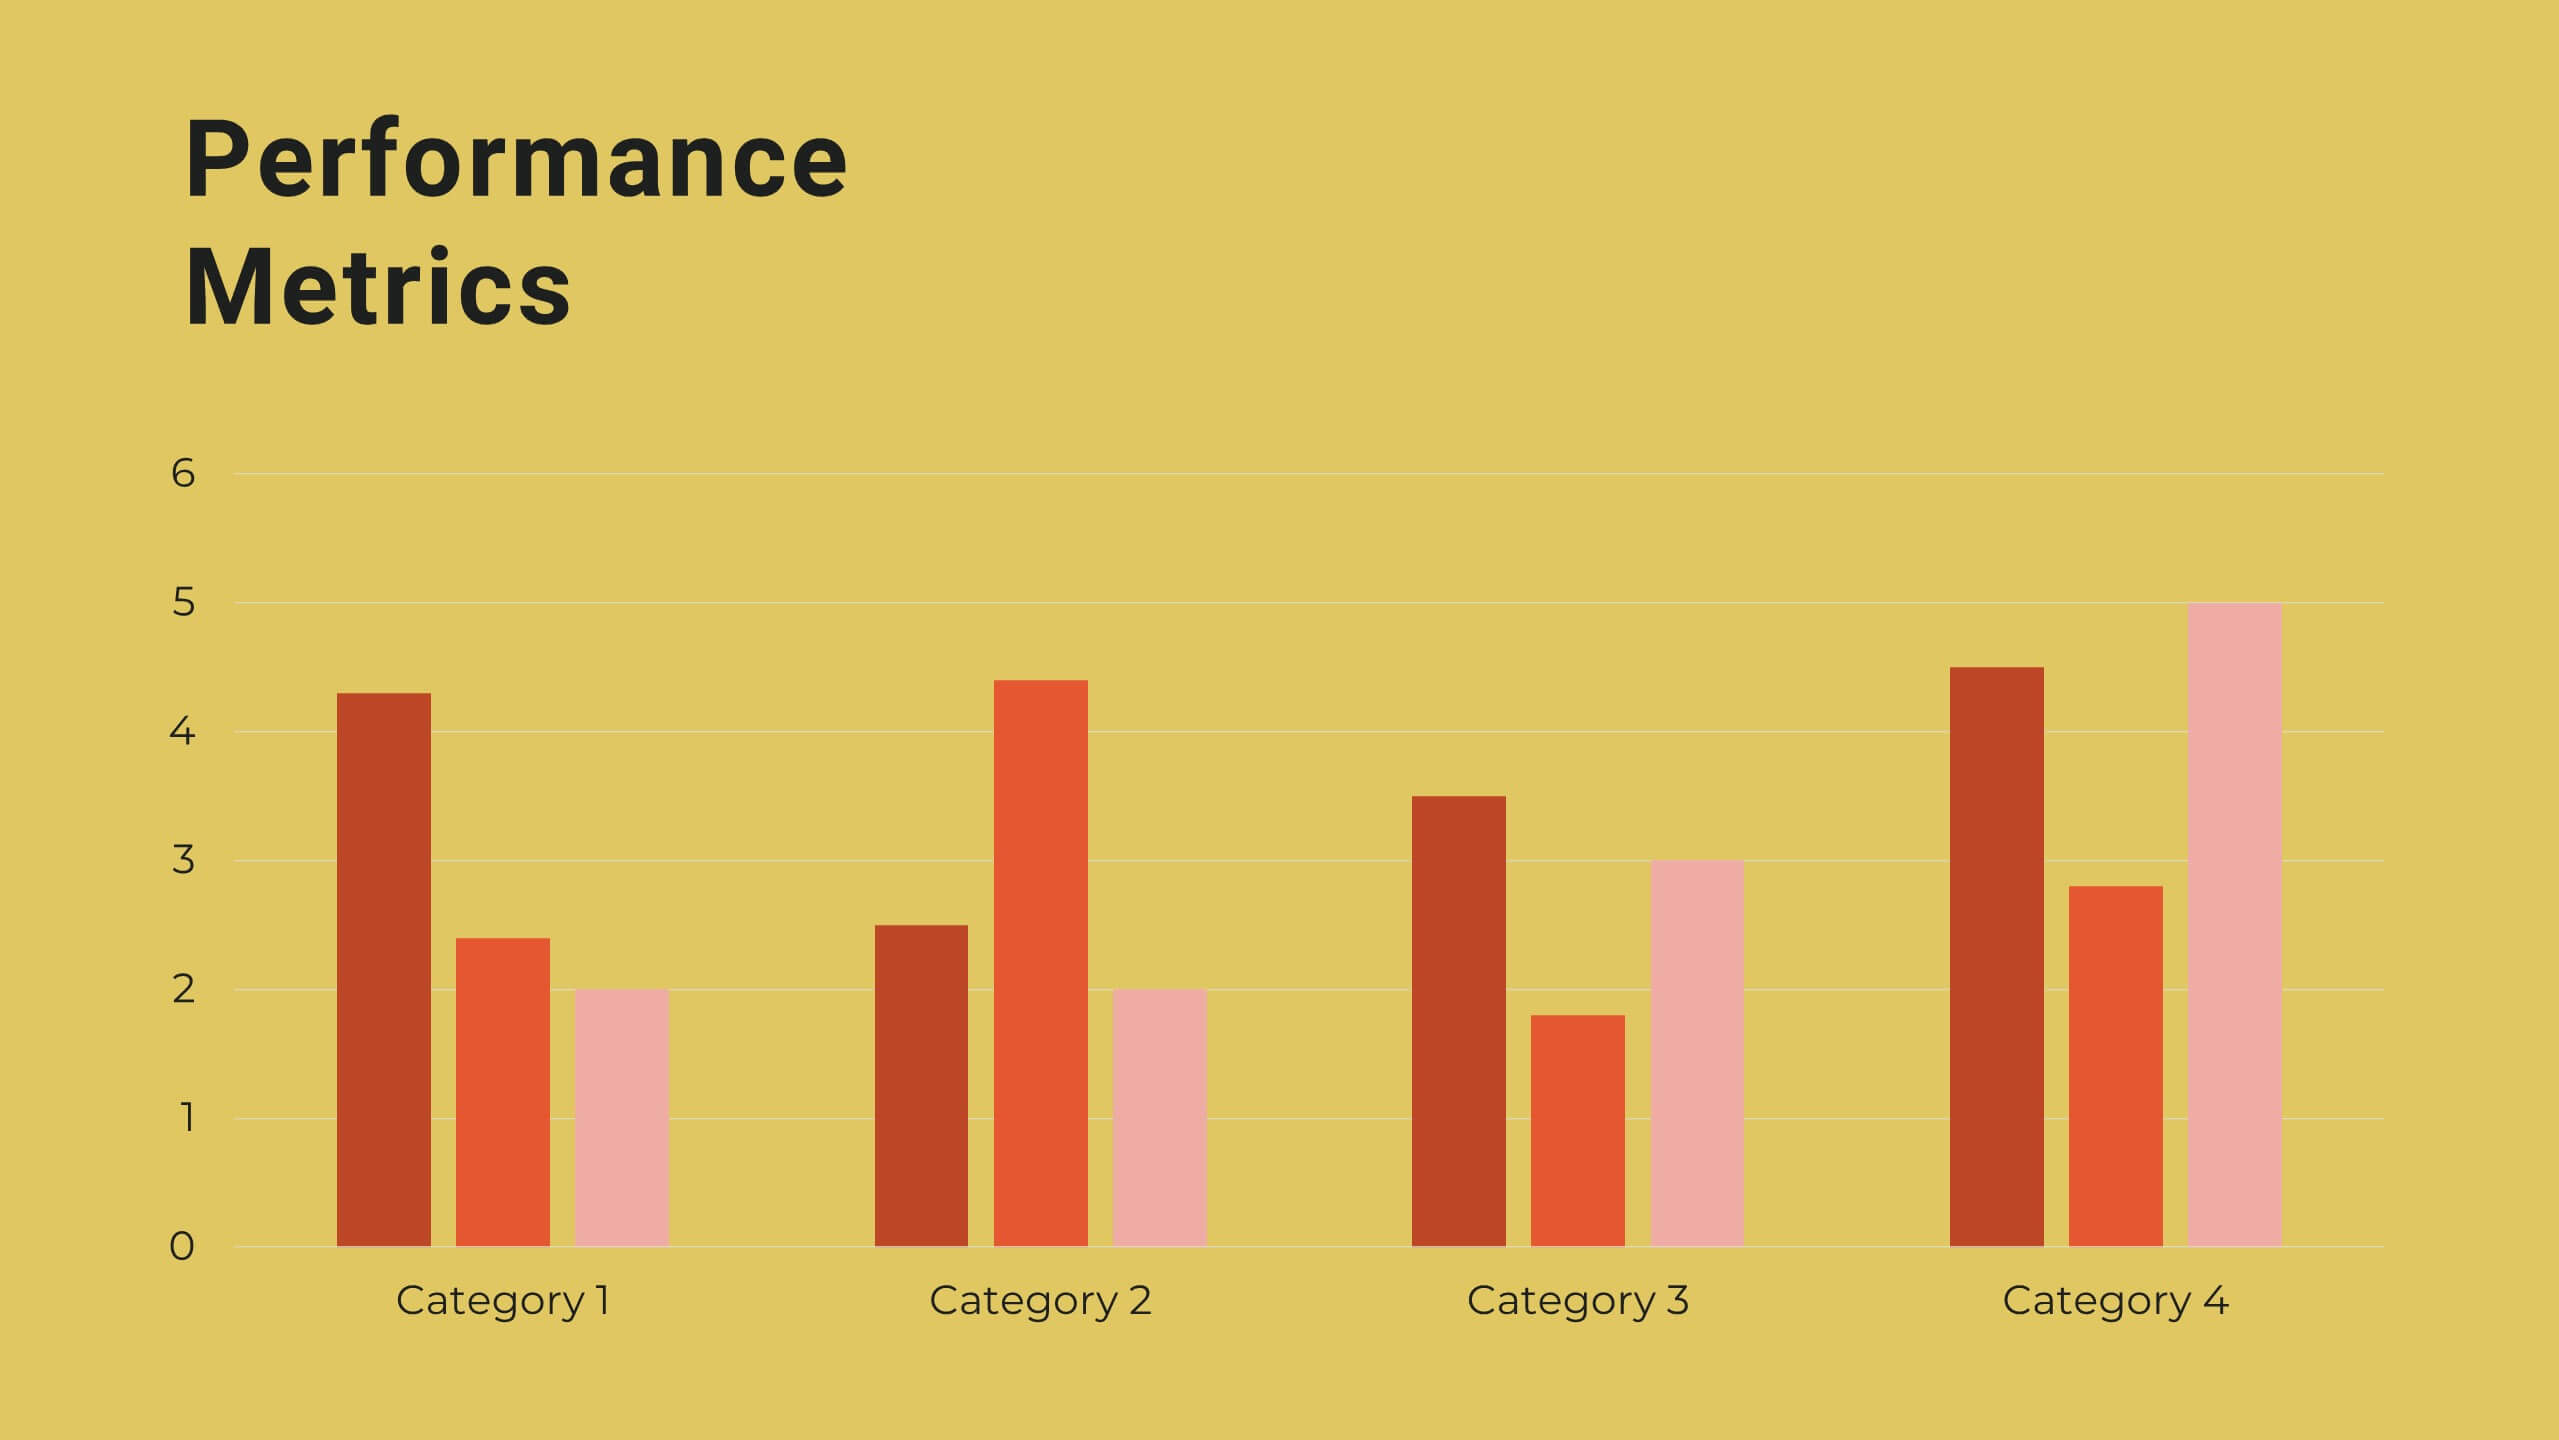
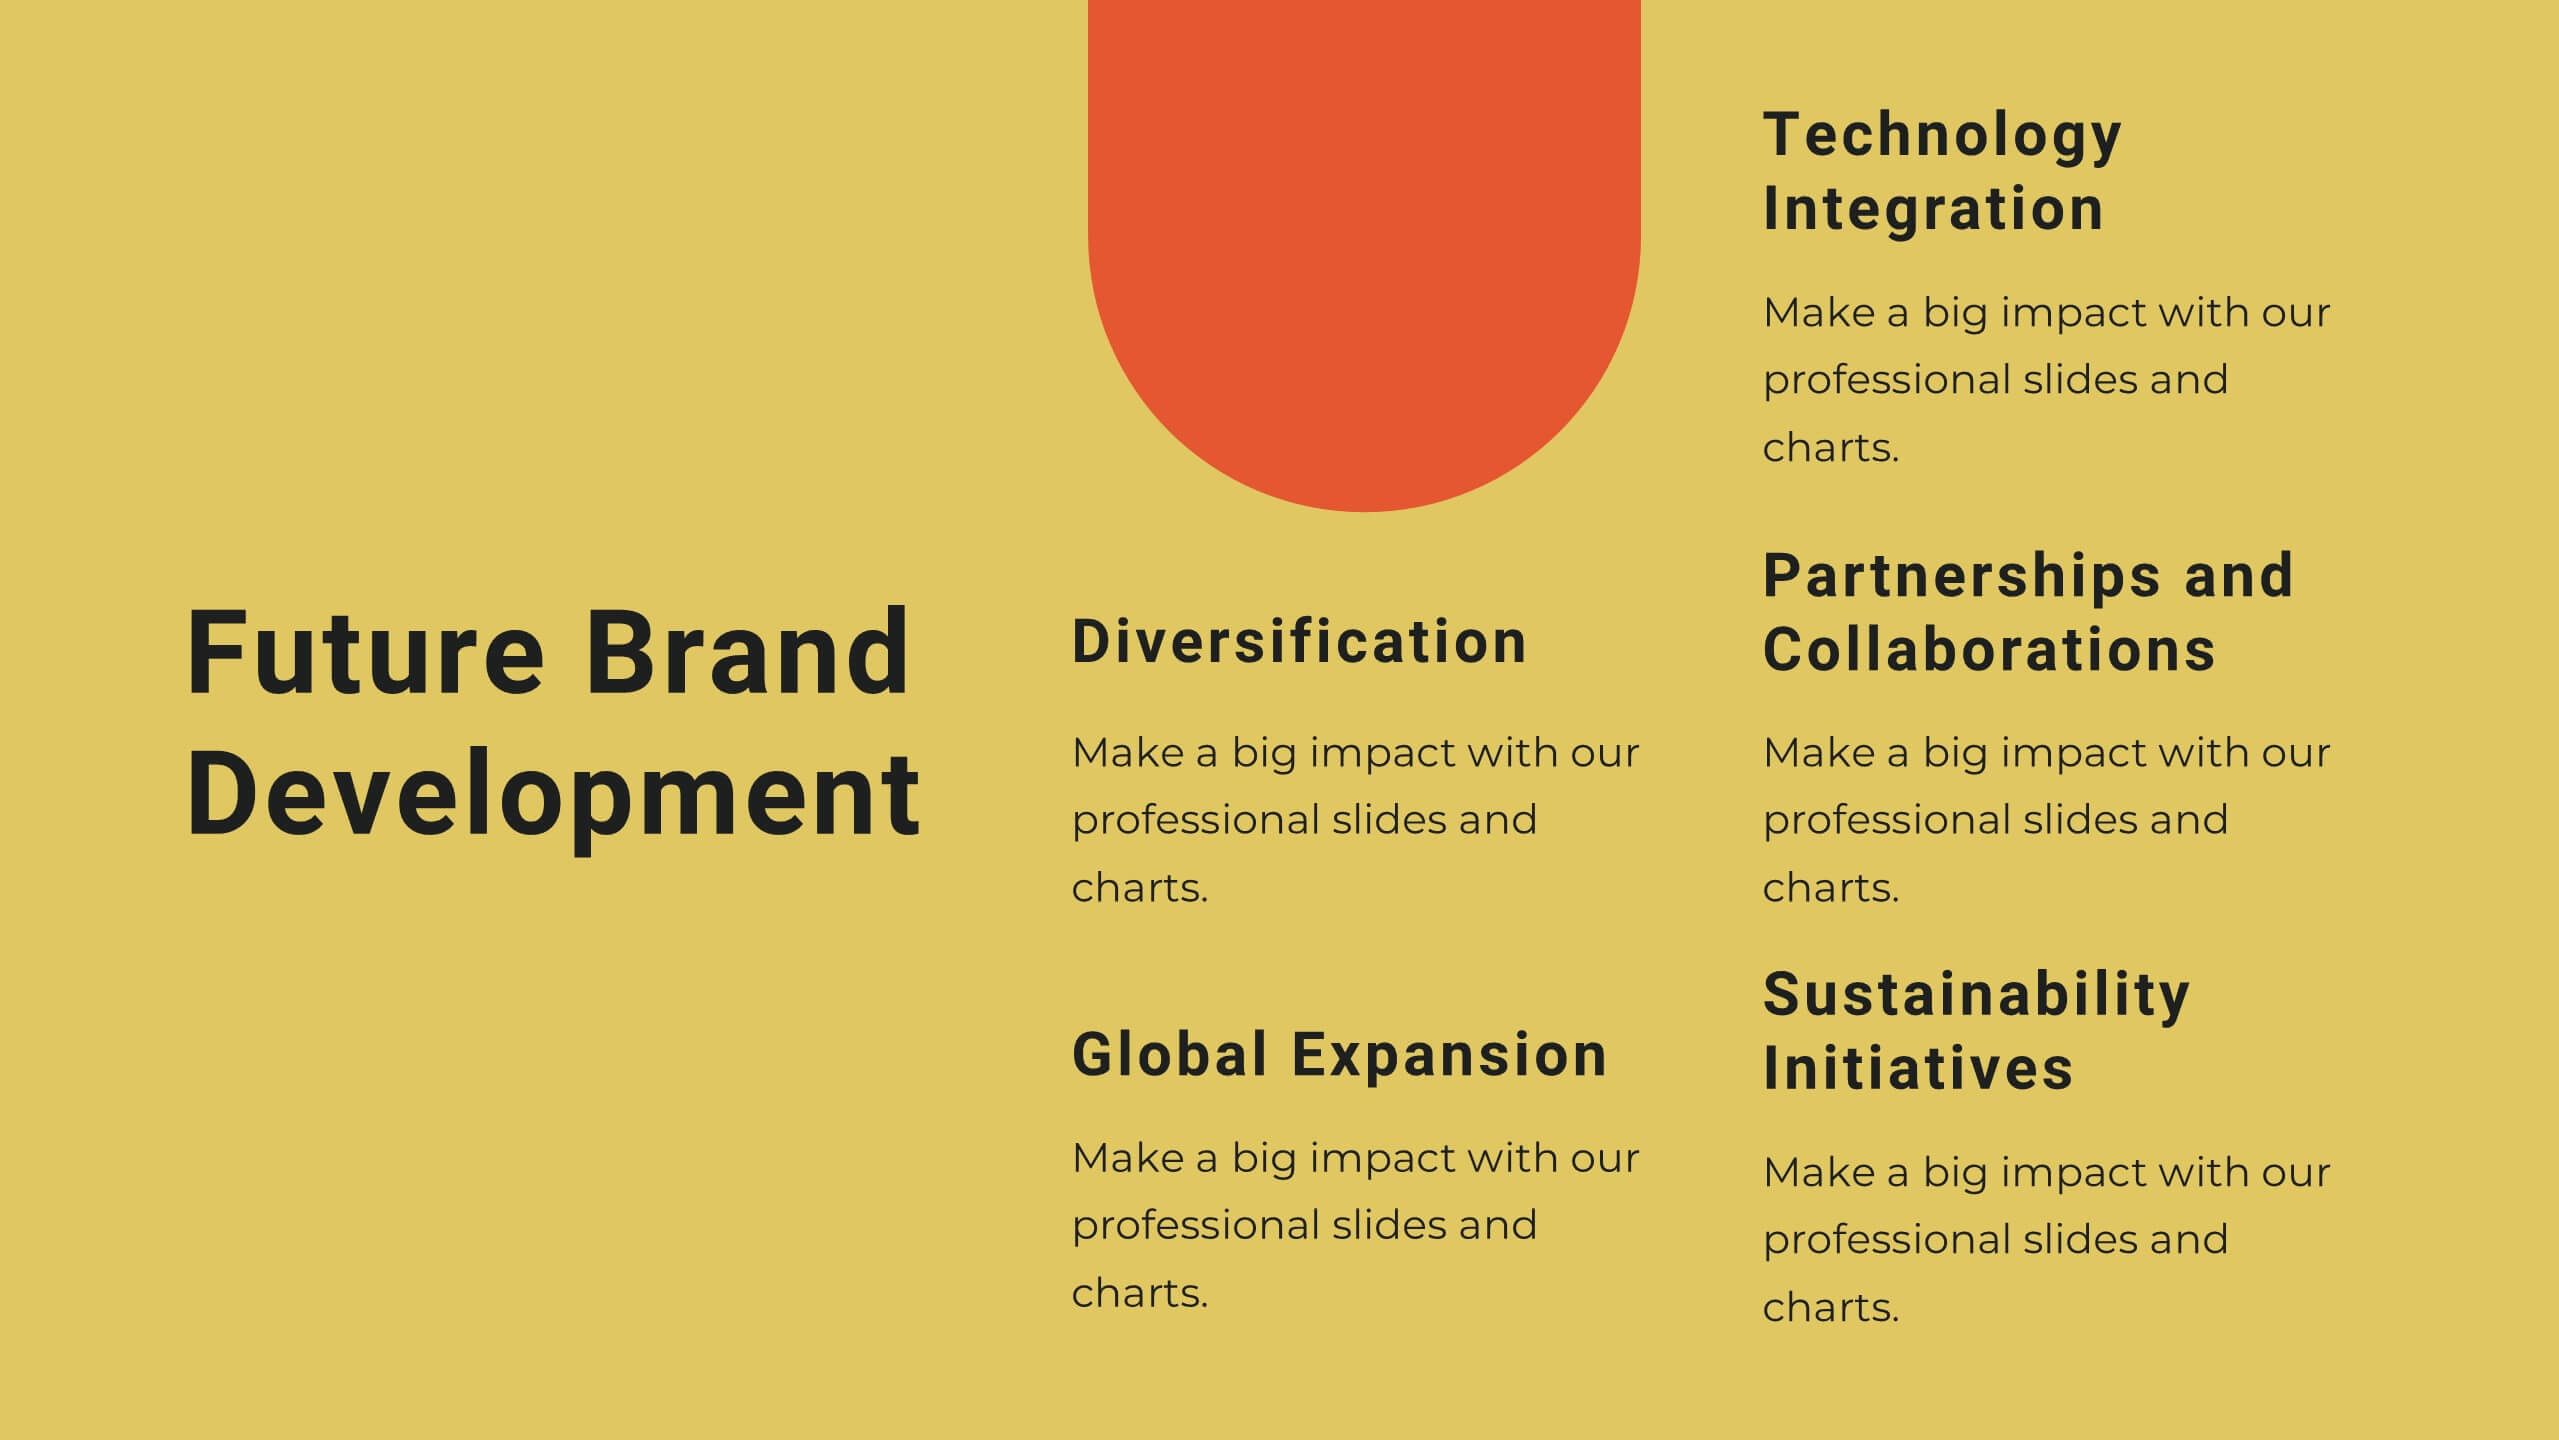
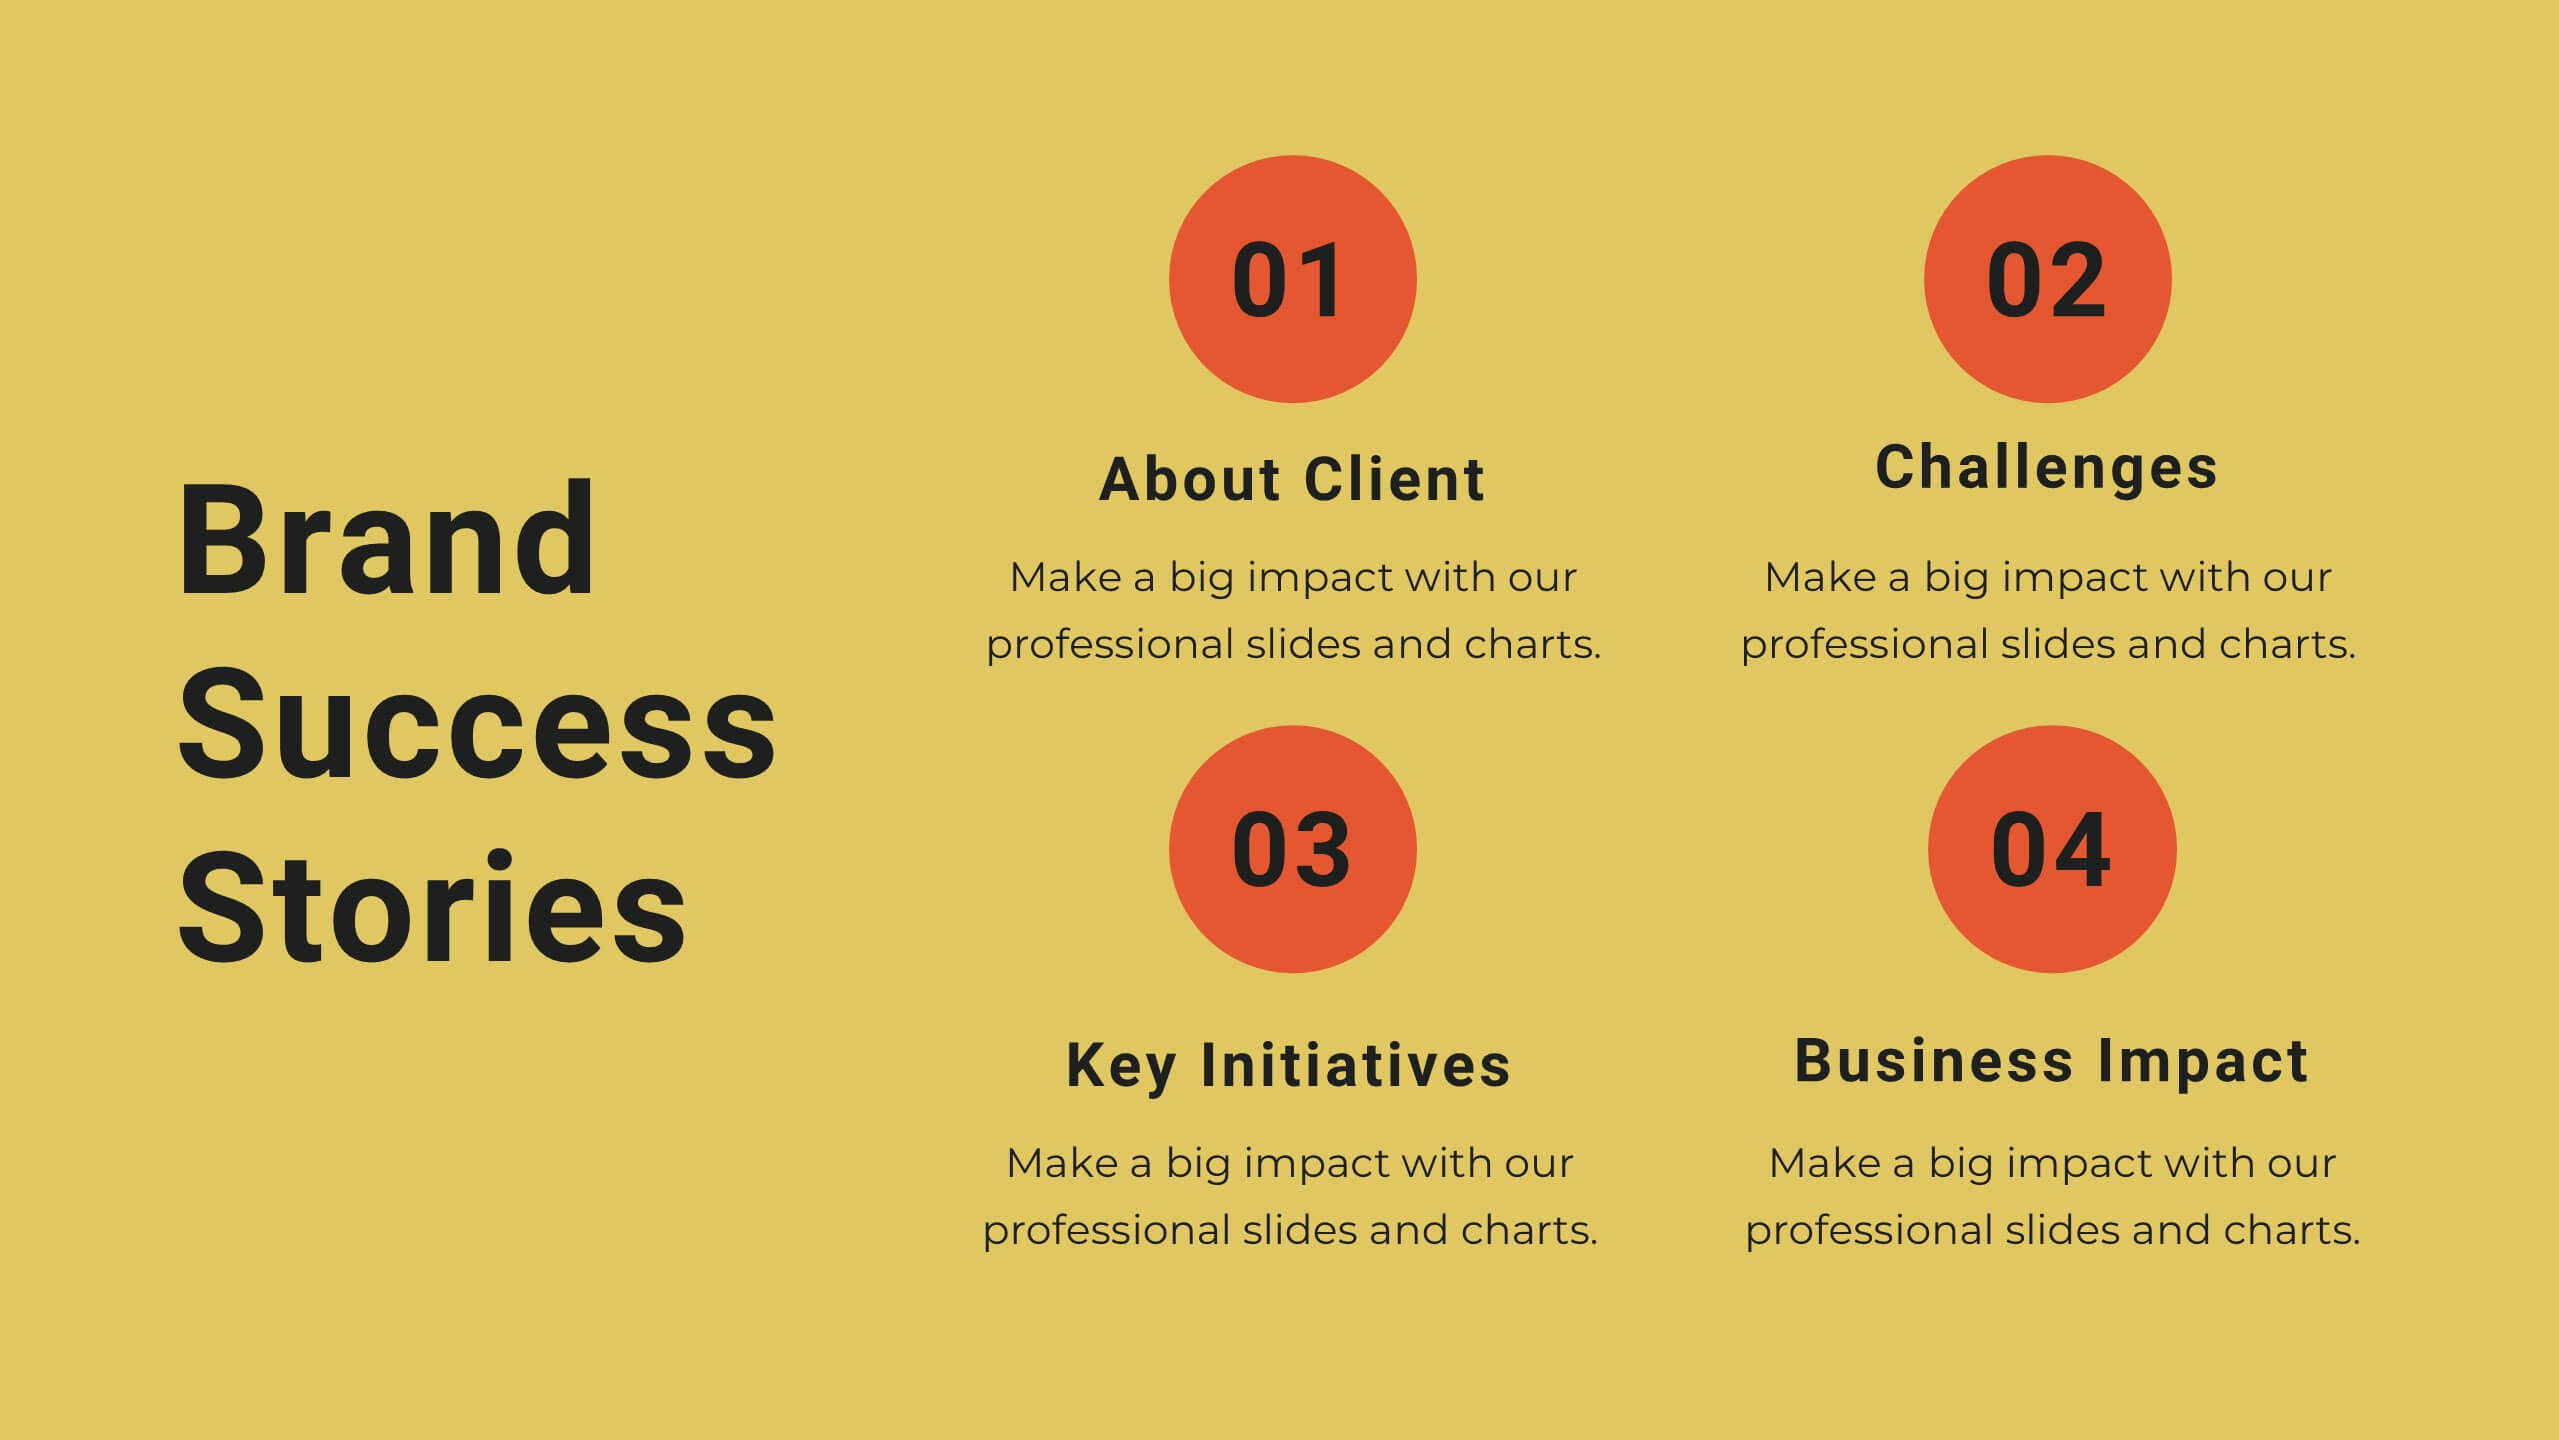
Yttrium Brand Strategy Report Presentation
Present your brand strategy with confidence using this vibrant, structured template! Covering brand identity, values, audience personas, and positioning, this template is perfect for crafting a compelling brand narrative. Fully customizable, it’s designed for seamless use in PowerPoint, Keynote, and Google Slides, making it an ideal tool for branding presentations.