


Características


¿Tienes alguna pregunta?
Recomendar


12 diapositivas
Investment Strategy Presentation
The "Investment Strategy Presentation" template is designed for effectively mapping out and displaying various investment strategies. It uses a multi-colored light bulb graphic, which symbolizes ideas and innovation in investment planning, making it visually appealing and easy to understand. Each segment of the light bulb is labeled with letters A through F, representing different aspects or phases of an investment strategy that can be tailored to specific objectives or points of discussion. This format helps in presenting complex financial data or strategies in a straightforward manner that can be easily grasped by audiences, making it an ideal choice for financial analysts, investors, or corporate strategy meetings.


21 diapositivas
Thistledown Marketing Campaign Presentation
Elevate your marketing campaigns with this polished and professional presentation template. Perfectly tailored to showcase key components such as campaign objectives, target audience, and competitive landscape, it provides a cohesive structure for presenting your strategies effectively. The slides also include sections for financial highlights, unique selling proposition, and growth planning, ensuring your goals are communicated with clarity. Whether you're discussing market presence, service offerings, or team leadership, this template helps streamline your content. Fully editable in PowerPoint, Google Slides, and Keynote, it offers flexibility to align with your branding and deliver a compelling campaign presentation.


22 diapositivas
Prism Project Status Report Presentation
Deliver impactful updates with this comprehensive project status report template! Perfect for presenting key highlights, performance metrics, and strategic initiatives. Ideal for project managers aiming to keep stakeholders informed and aligned. Compatible with PowerPoint, Keynote, and Google Slides, this template ensures your reports are clear, professional, and engaging. Keep projects on track!


5 diapositivas
Supply Chain Process Infographics
Unravel the complexities of logistics with supply chain process infographics. This vibrant template, splashed with energetic shades of orange, purple, and green, is designed to streamline the convolutions of supply chain management into an easily digestible format. Ideal for business analysts and logistics professionals, these vertical infographics offer a visually engaging narrative. The template features innovative graphics, intuitive icons, and versatile image placeholders, meticulously crafted to aid in visualizing the intricate processes within supply chain dynamics. These infographics are the tool you need to bring clarity to your audience.


5 diapositivas
Global Warming Activism Infographics
Dive into environmental advocacy with the global warming activism infographics template, steeped in earthy tones of green and brown, reflecting our planet's natural palette. This vertical collection, abundant with nature and animal-themed elements, is a tool for activists, and NGOs driving change. It melds visuals with stark realities, using striking graphics, icons, and adaptable image placeholders to spotlight climate change's impacts and the urgent strides needed for ecological preservation. Compatible with Powerpoint, Keynote, and Google Slides. By simplifying complex information, it empowers community engagement and fosters a united front for global healing efforts.


6 diapositivas
Product Development Lifecycle Presentation
Visualize each stage of your product’s journey with this sleek infinity loop diagram template. Perfect for outlining development processes, continuous improvement cycles, or iterative workflows. Fully editable in Canva, PowerPoint, and Google Slides, it delivers a clear, modern design to communicate lifecycle stages with impact and professional appeal.


4 diapositivas
Multi-Stage Process Hexagon Infographic Presentation
Showcase your workflows clearly with the Multi-Stage Process Hexagon Infographic Presentation. This template features a sleek chain of hexagons, ideal for visualizing linear steps, sequential planning, or project phases. Each stage is editable, color-coded, and easy to customize in PowerPoint, Keynote, or Google Slides—perfect for teams, educators, or project managers.


26 diapositivas
Melo Presentation Template
Are you looking for a presentation to make your product stand out? Melo is a beautifully elegant presentation with modern elements and light neutral color palette. Perfect for furniture brands, or any one looking for a modern presentation. These slides include world maps, company slides, mockups and charts perfect for businesses, this template has everything you'll need. It's simple yet chic design makes it stand out and at the same time keep your audience engaged. This is the perfect choice for businesses, brands or anyone who needs to make a great looking template on their next presentation


5 diapositivas
3-Level Concentric Diagram Presentation
Bring clarity and structure to your ideas with a clean, layered diagram design that simplifies complex concepts. Perfect for showcasing stages, hierarchies, or interconnected systems, it keeps your audience engaged with visual balance and flow. Fully compatible with PowerPoint, Keynote, and Google Slides for effortless customization and presentation flexibility.


20 diapositivas
Alchemy Sales Forecast Presentation
Elevate your sales strategy with this sleek and modern sales forecast presentation template. Featuring sections for sales objectives, pricing strategies, performance metrics, and future opportunities, it’s perfect for teams aiming to analyze and plan effectively. Fully compatible with PowerPoint, Keynote, and Google Slides for seamless professional presentations.


5 diapositivas
Breast Cancer Month Awareness Infographics
Embrace the cause with our breast cancer month awareness infographics, a vital tool in disseminating crucial information during this significant period. Crafted with a harmonious blend of pink and white, this template serves not just as a visual aid but as a beacon of knowledge and support. It's designed for healthcare professionals, advocates, and educators looking to spread awareness and facts about breast cancer. The style is distinctly informative yet tenderly crafted, keeping the sensitivity of the topic in mind. It incorporates purposeful graphics and icons. This template is an asset for those aiming to inspire action, educate audiences, and offer hope through information.


3 diapositivas
Ishikawa Diagram Template Presentation
Bring clarity to complex challenges with a clean, structured visual that helps teams trace issues back to their true causes. This presentation outlines key factors, organizes insights, and supports decision-making with an intuitive, step-by-step layout. Ideal for problem-solving sessions and strategy workshops. Fully compatible with PowerPoint, Keynote, and Google Slides.


7 diapositivas
Environmental Specialist Infographic
An Environmental Specialist, is a professional who focuses on environmental issues and challenges, aiming to develop solutions and strategies to address them. This engaging infographic template is designed to shed light on the critical role of environmental specialists, presenting data, facts, and strategies to inspire and educate on the path towards a sustainable and eco-friendly world. Fully customizable and compatible with Powerpoint, Keynote, and Google Slides. This infographic is your guide to understanding and appreciating the invaluable work of environmental specialists.


8 diapositivas
Quarterly Sales Report Presentation
Streamline your quarterly sales review with our "Quarterly Sales Report Presentation" template. This infographic is expertly designed to display sales data across various categories, using a series of shopping cart icons that represent different products or services. Each cart is labeled with a title and associated with a percentage, clearly illustrating sales performance metrics. The color-coded elements help distinguish between different data points, making complex information easily digestible. Ideal for sales managers and teams, this template aids in analyzing trends, identifying growth opportunities, and planning future sales strategies. Compatible with PowerPoint, Keynote, and Google Slides, it's a vital tool for effective sales presentations.


7 diapositivas
Empathy Map Tools Infographic
Navigate the intricate landscapes of human emotions with our empathy map infographic. Bathed in the reflective tones of blue, the clarity of white, and the insightful hints of yellow, our template offers a deep dive into understanding and capturing user experiences. Equipped with purpose-driven infographics, intuitive icons, and relevant image placeholders, it visualizes the nuances of empathy in a tangible manner. Meticulously tailored for Powerpoint, Keynote, or Google Slides. An invaluable tool for UX designers, psychologists, researchers, or any professional keen on enhancing user experiences. Delve deeper; let every slide amplify understanding.


4 diapositivas
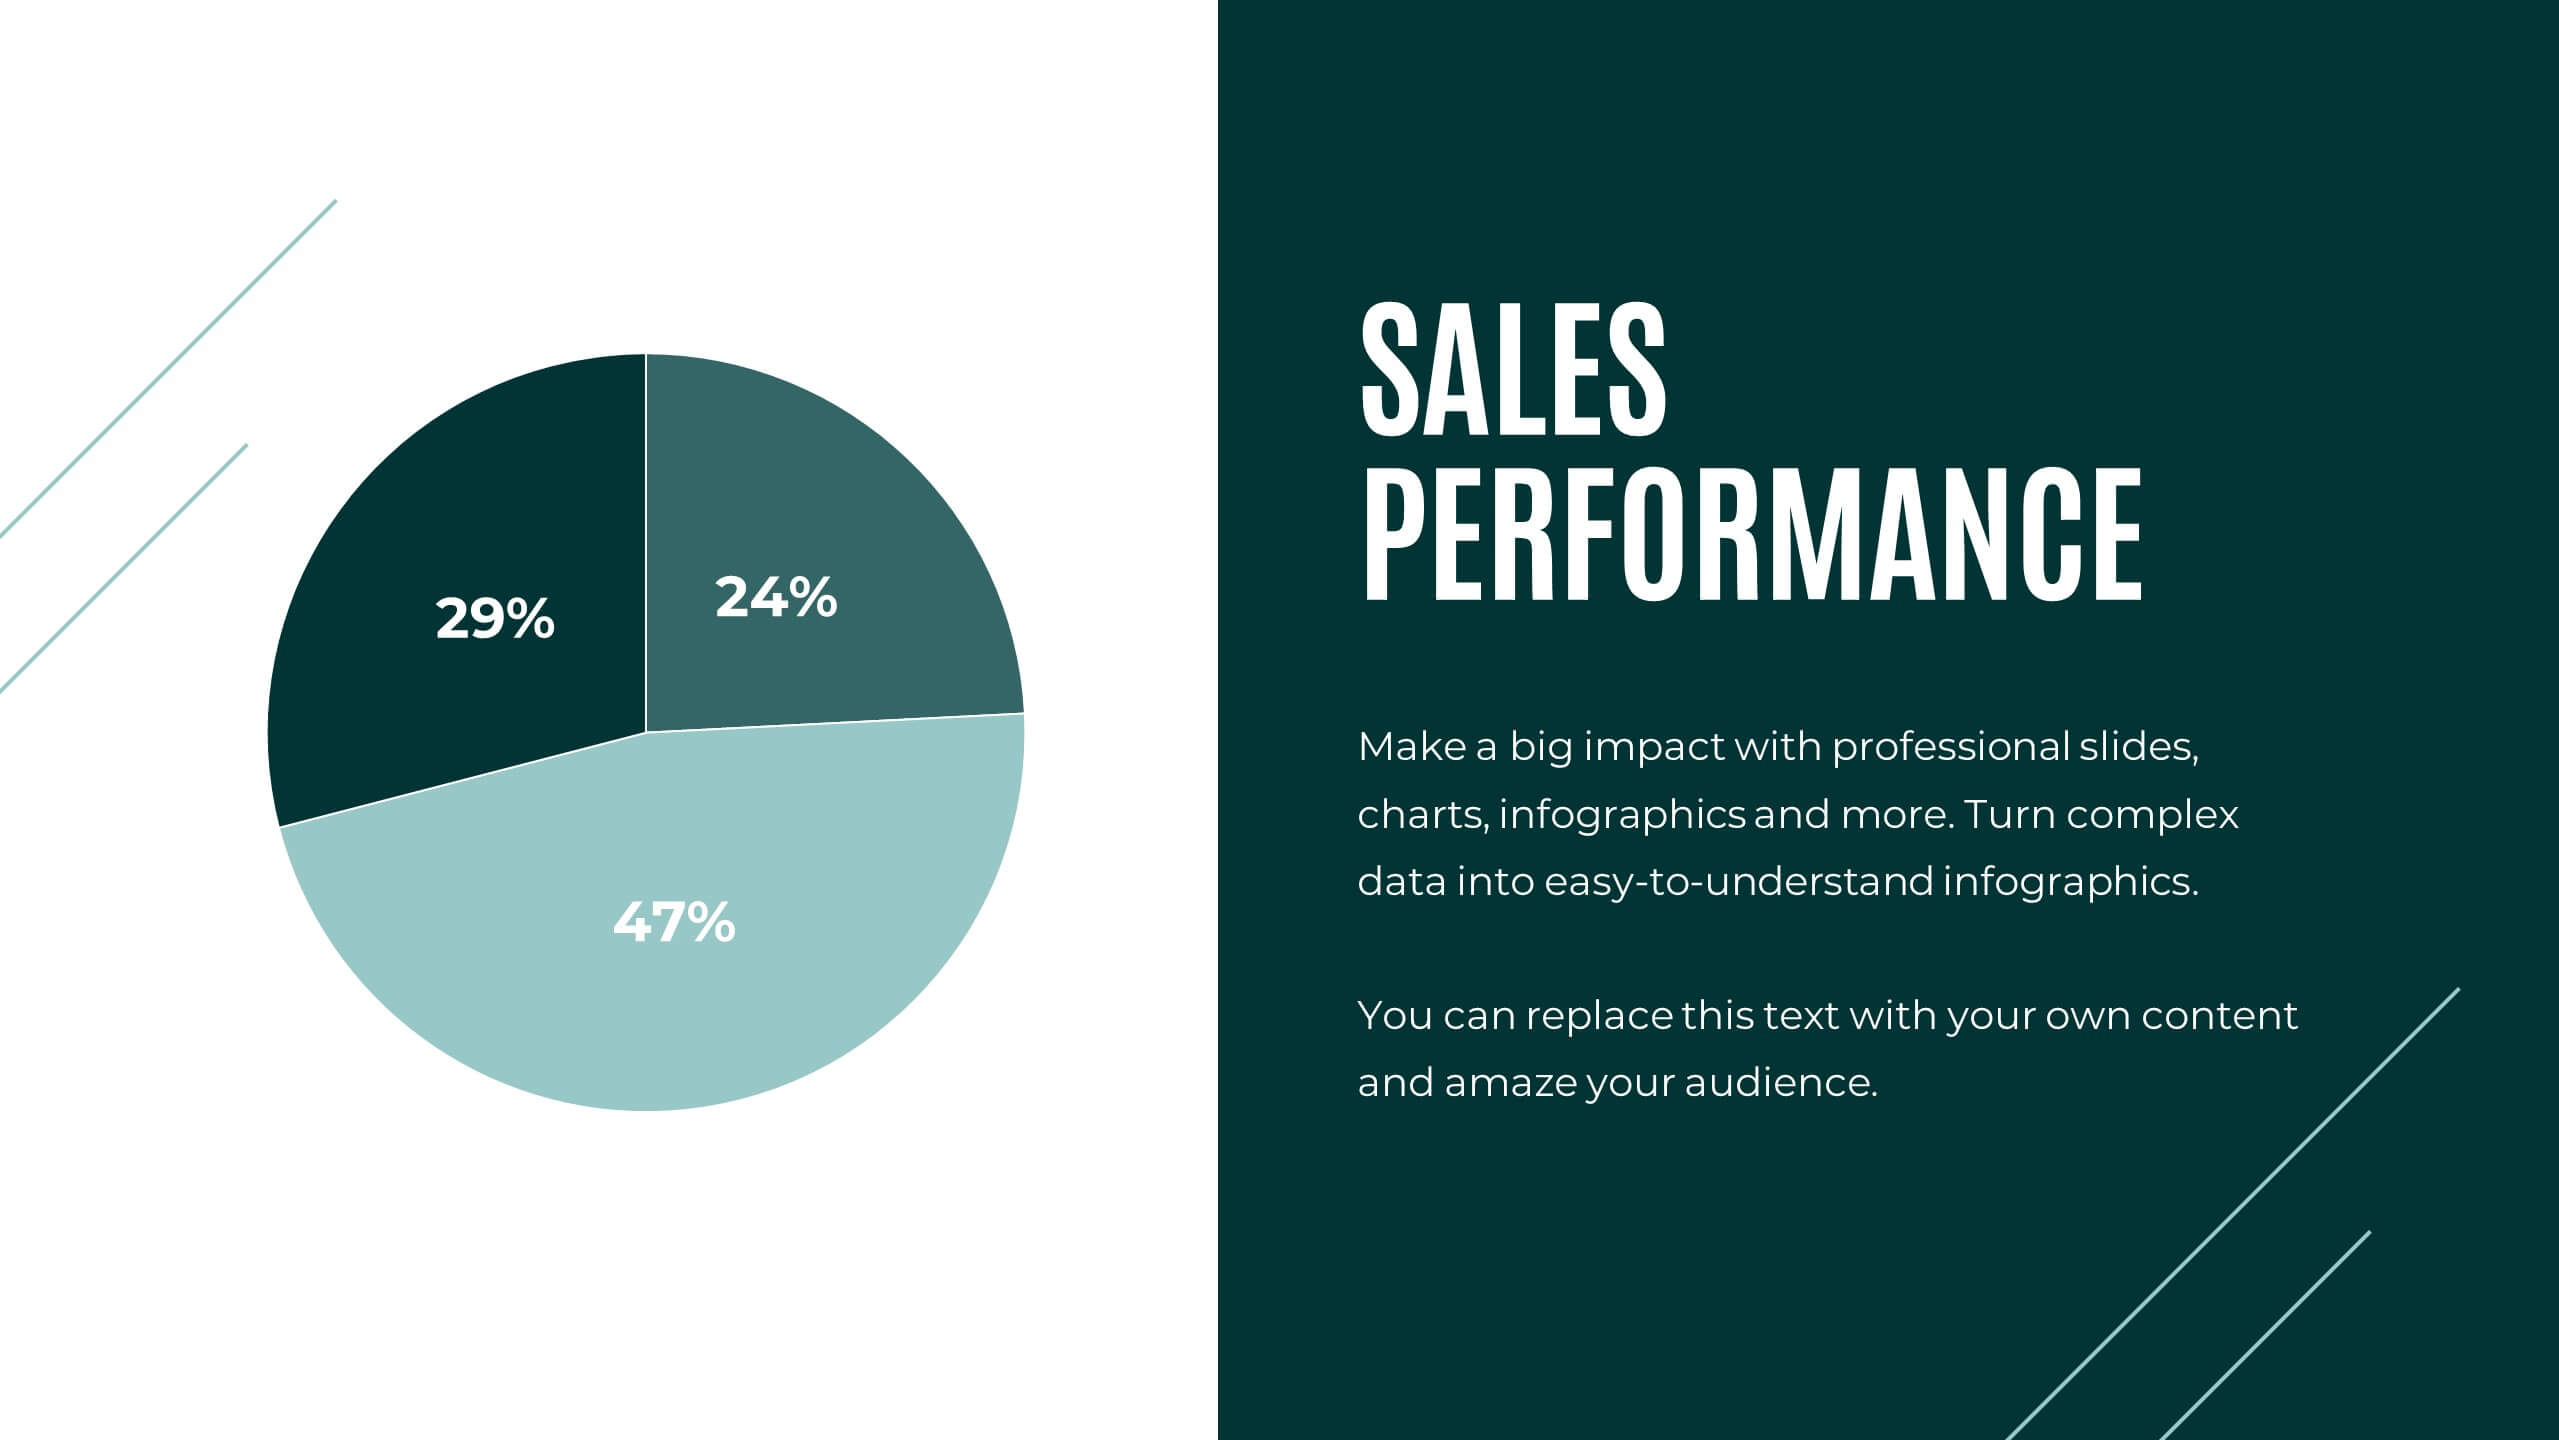
Sales Performance Heat Map Overview Presentation
Get a quick visual pulse on your data with the Sales Performance Heat Map Overview Presentation. Ideal for showing activity levels or trends across time, this slide uses a gradient color scale to help teams identify high and low performance instantly. Fully editable in Canva, PowerPoint, Keynote, and Google Slides—great for sales managers, team leads, and marketing analysts.


10 diapositivas
SEO and Content Marketing Plan
Highlight your SEO and content strategy with a modern magnifying glass-themed design. This slide makes it easy to break down key phases like keyword research, content creation, optimization, and analytics. Fully customizable and compatible with PowerPoint, Keynote, and Google Slides.