


Características


¿Tienes alguna pregunta?
Recomendar


26 diapositivas
Coffee Shop Warm Company Profile Presentation
Coffee shops have become an important part of modern culture, especially in urban areas, and they come in various styles and themes. This presentation template is designed to bring the essence of your coffee haven to life. From the first sip to the last drop, let this presentation showcase the soul-warming experience your coffee shop provides. Fully customizable and compatible with Powerpoint, Keynote, and Google Slides. Utilize warm colors like browns, oranges, and yellows to evoke a cozy, comforting atmosphere. The template integrates coffee cup icons, latte art, and coffee bean graphics for a coffee-centric theme.


4 diapositivas
Design and Project Work Samples Presentation
Showcase your creative projects with this visually structured layout. Featuring a bold title area and three image slots for key works, it’s perfect for portfolios, proposals, or pitch decks. Fully editable in PowerPoint, Keynote, and Google Slides to suit your brand and project presentation needs.


5 diapositivas
North America Business Landscape Map Presentation
Explore the business terrain with the "North America Business Landscape Map" template, which delivers a comprehensive visualization of business data across various regions. Designed for strategic presentations, it enables clear communication of market insights and data points, crucial for decision-making. This template is compatible with PowerPoint, Keynote, and Google Slides, enhancing its utility for professionals in diverse fields.
21 diapositivas
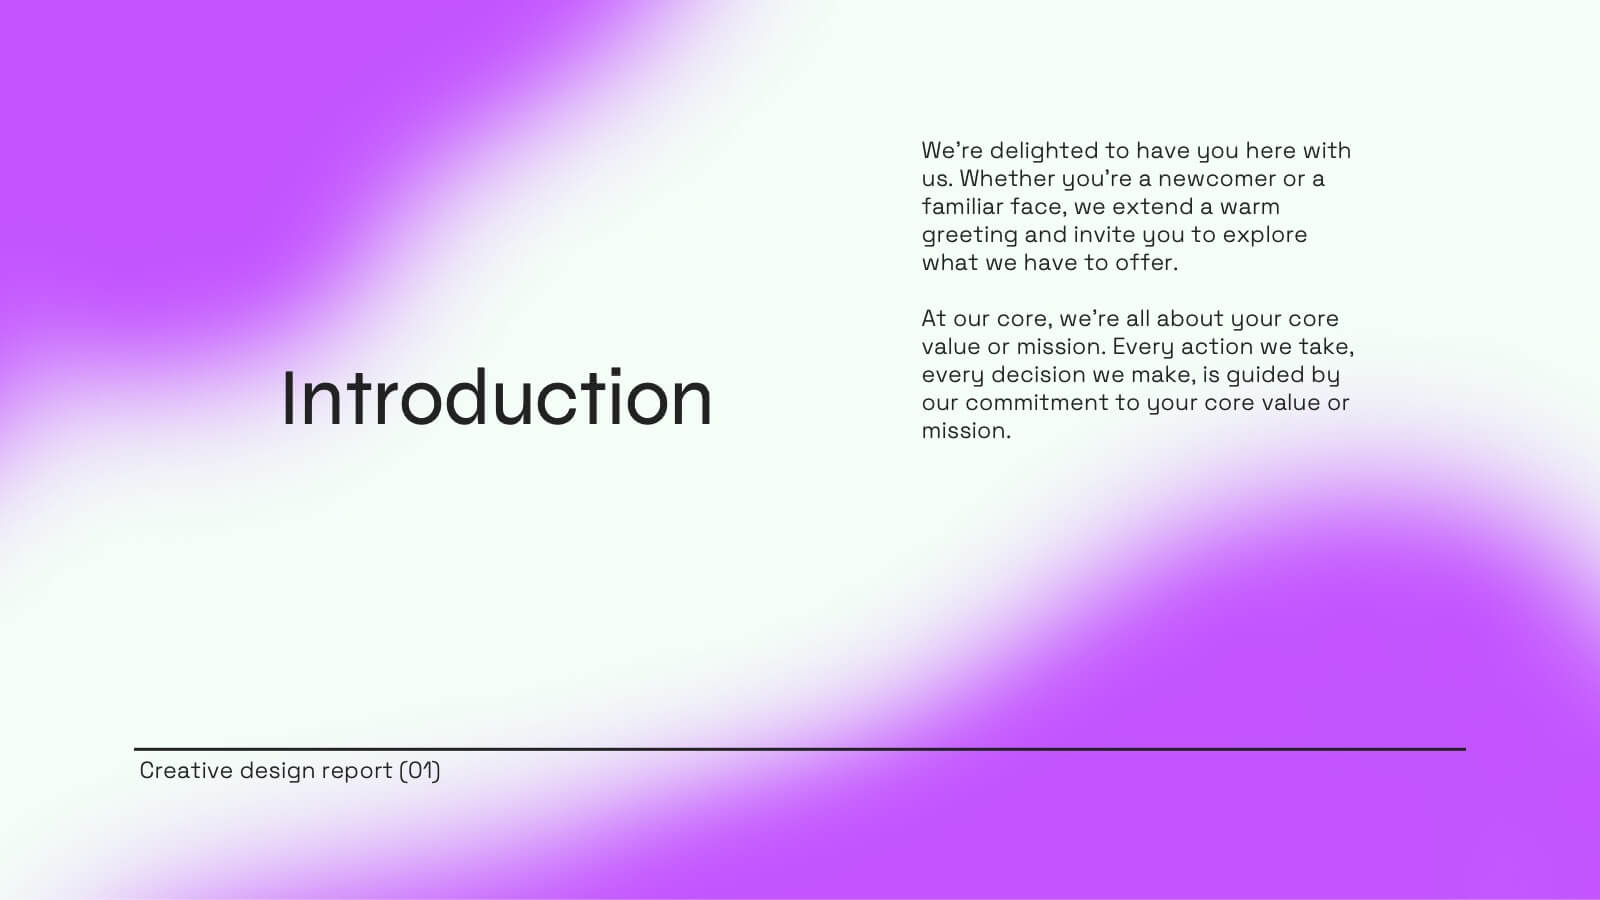
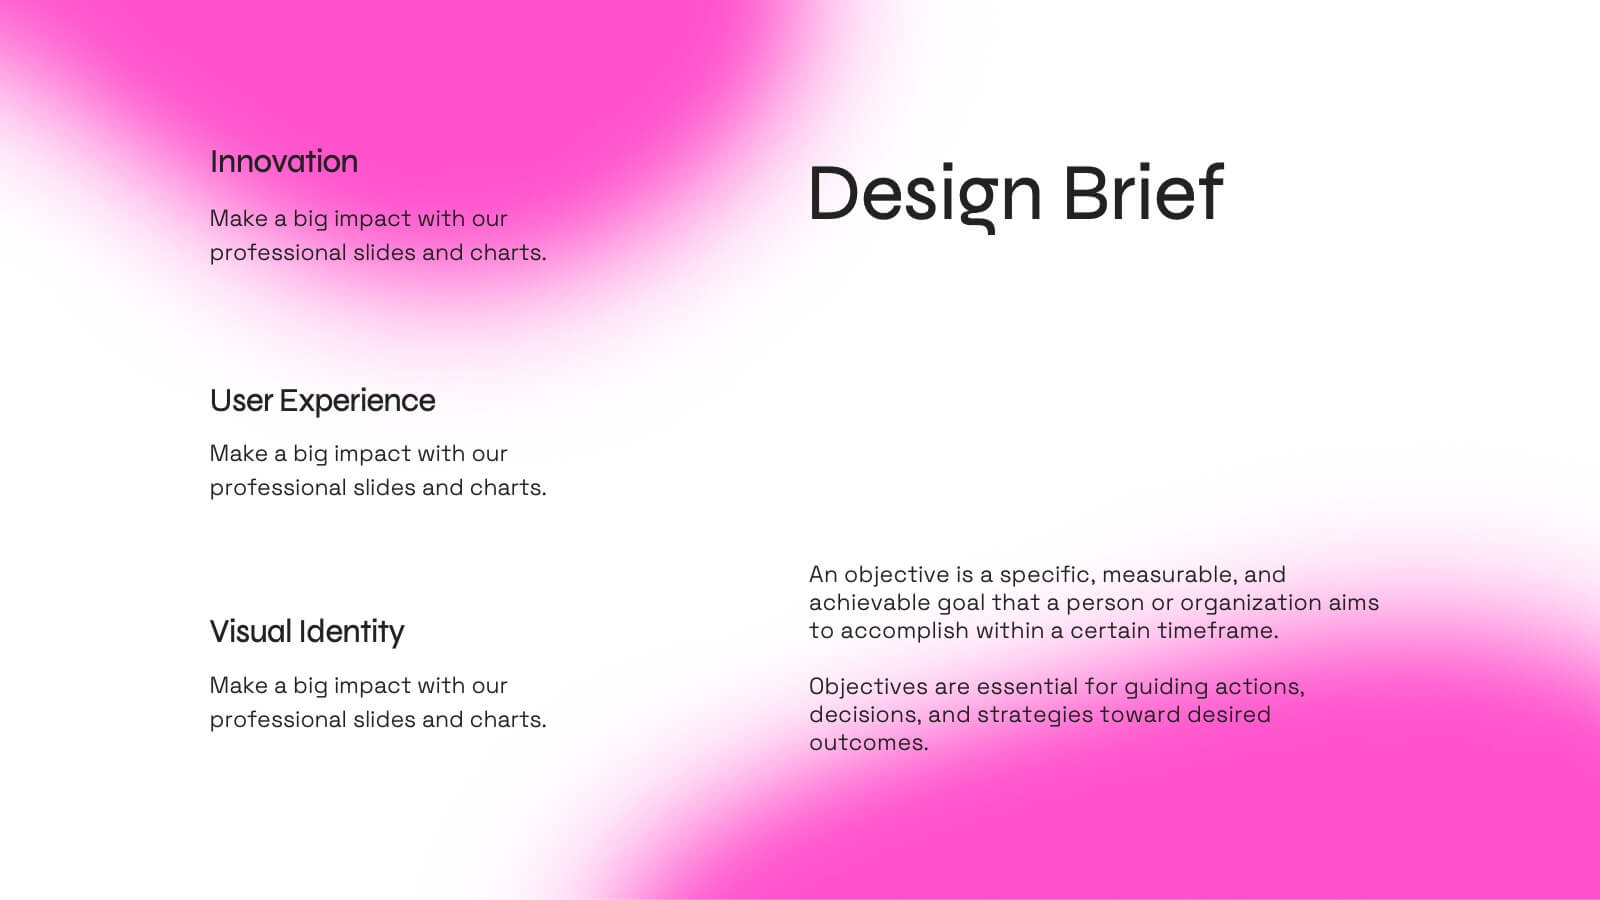
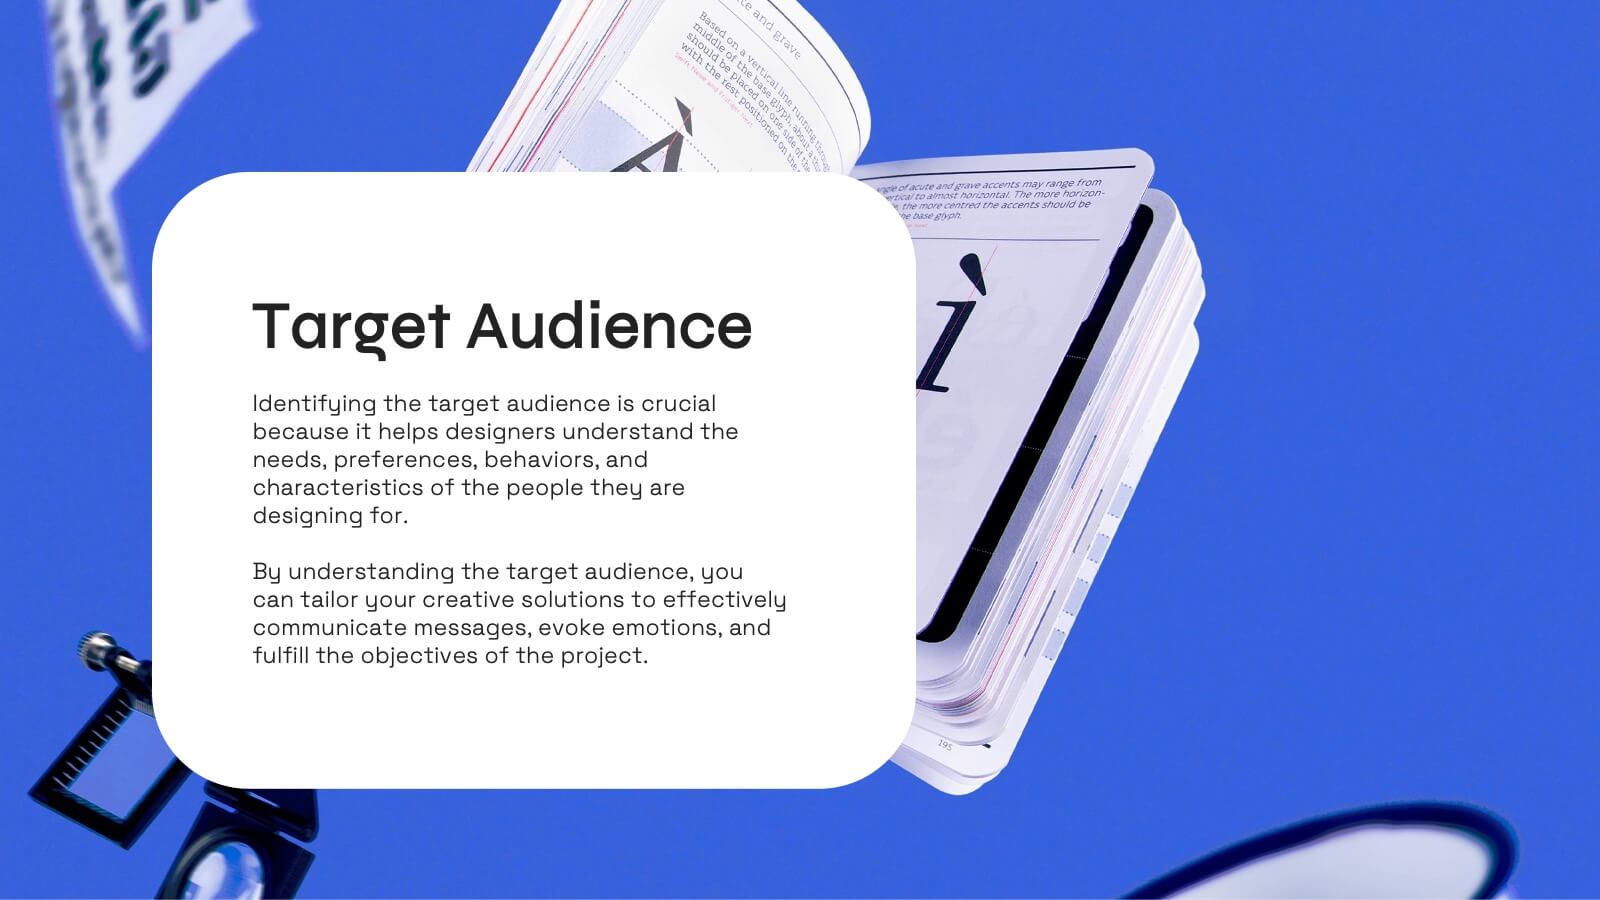
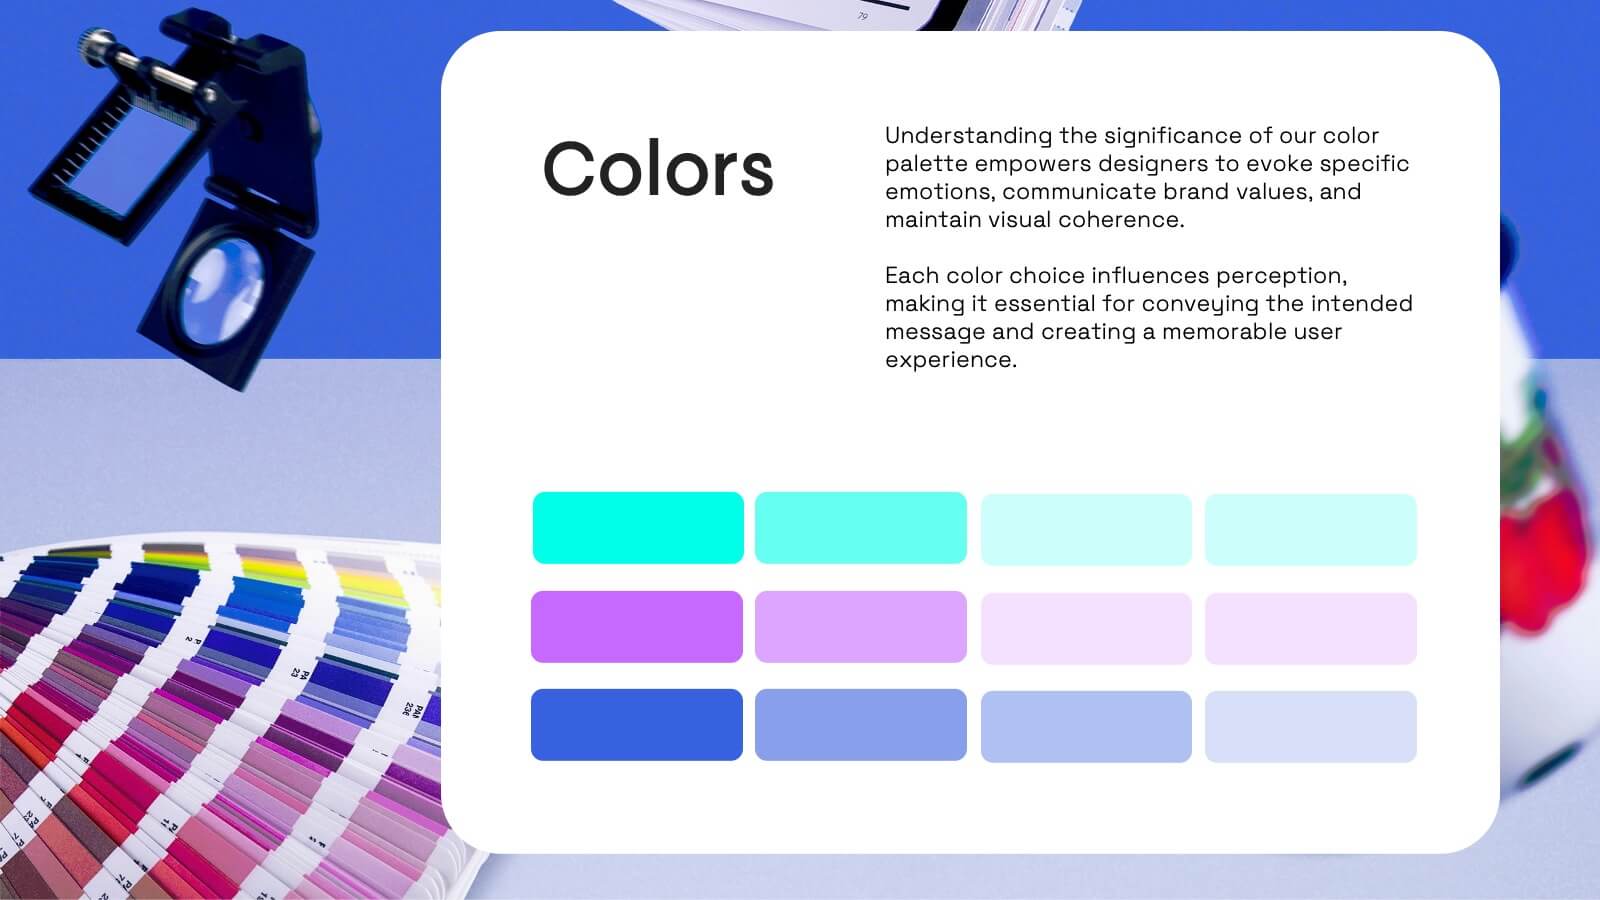
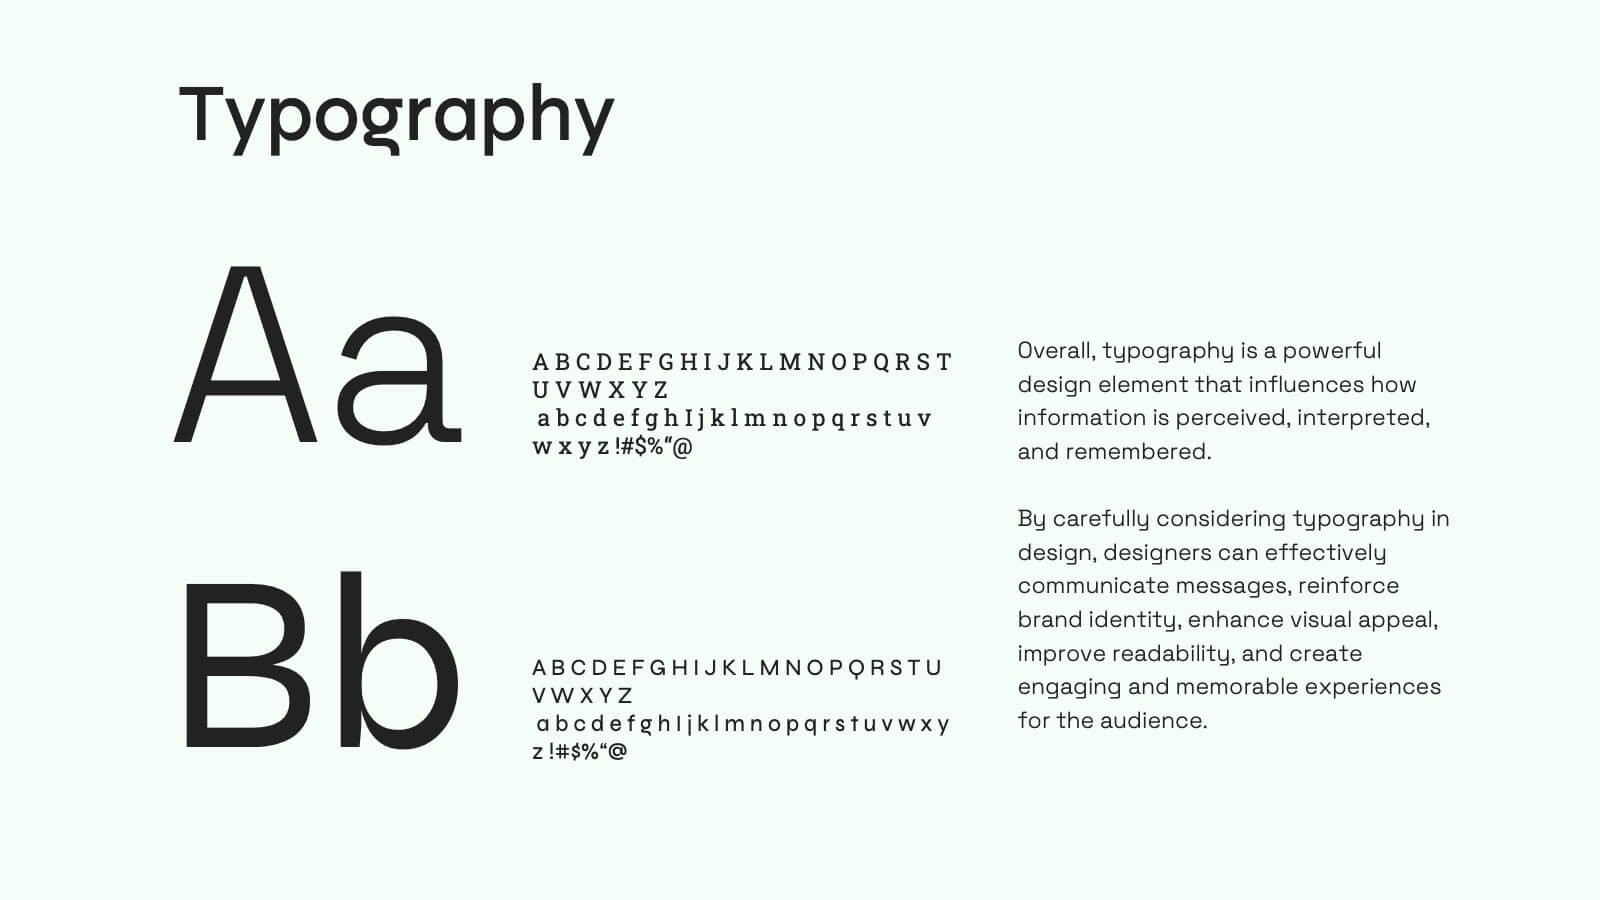
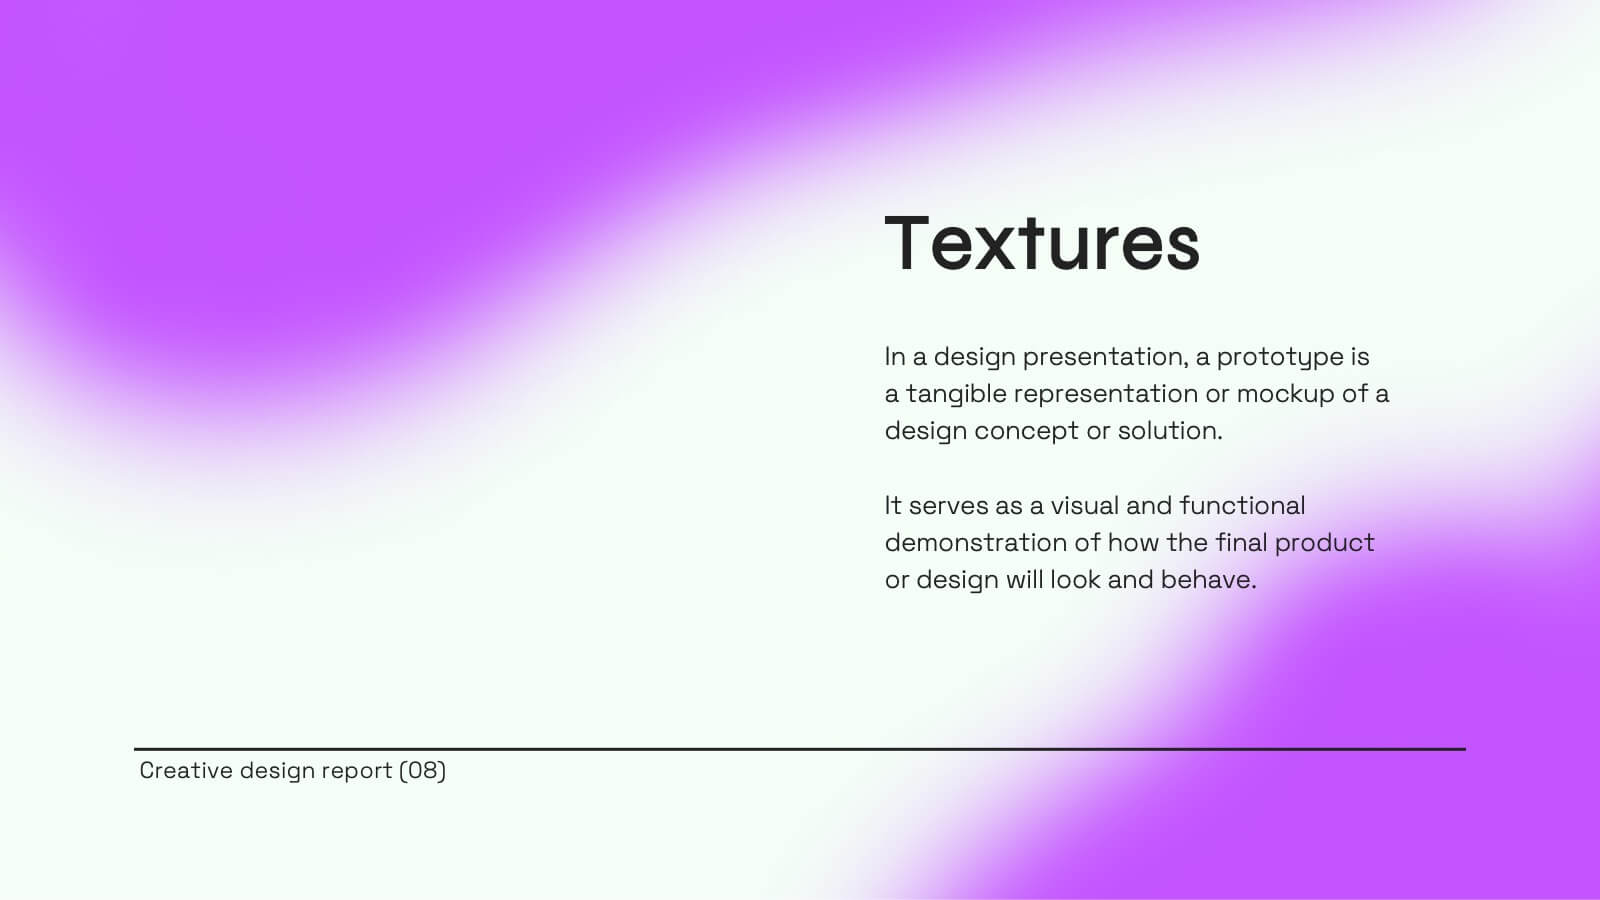
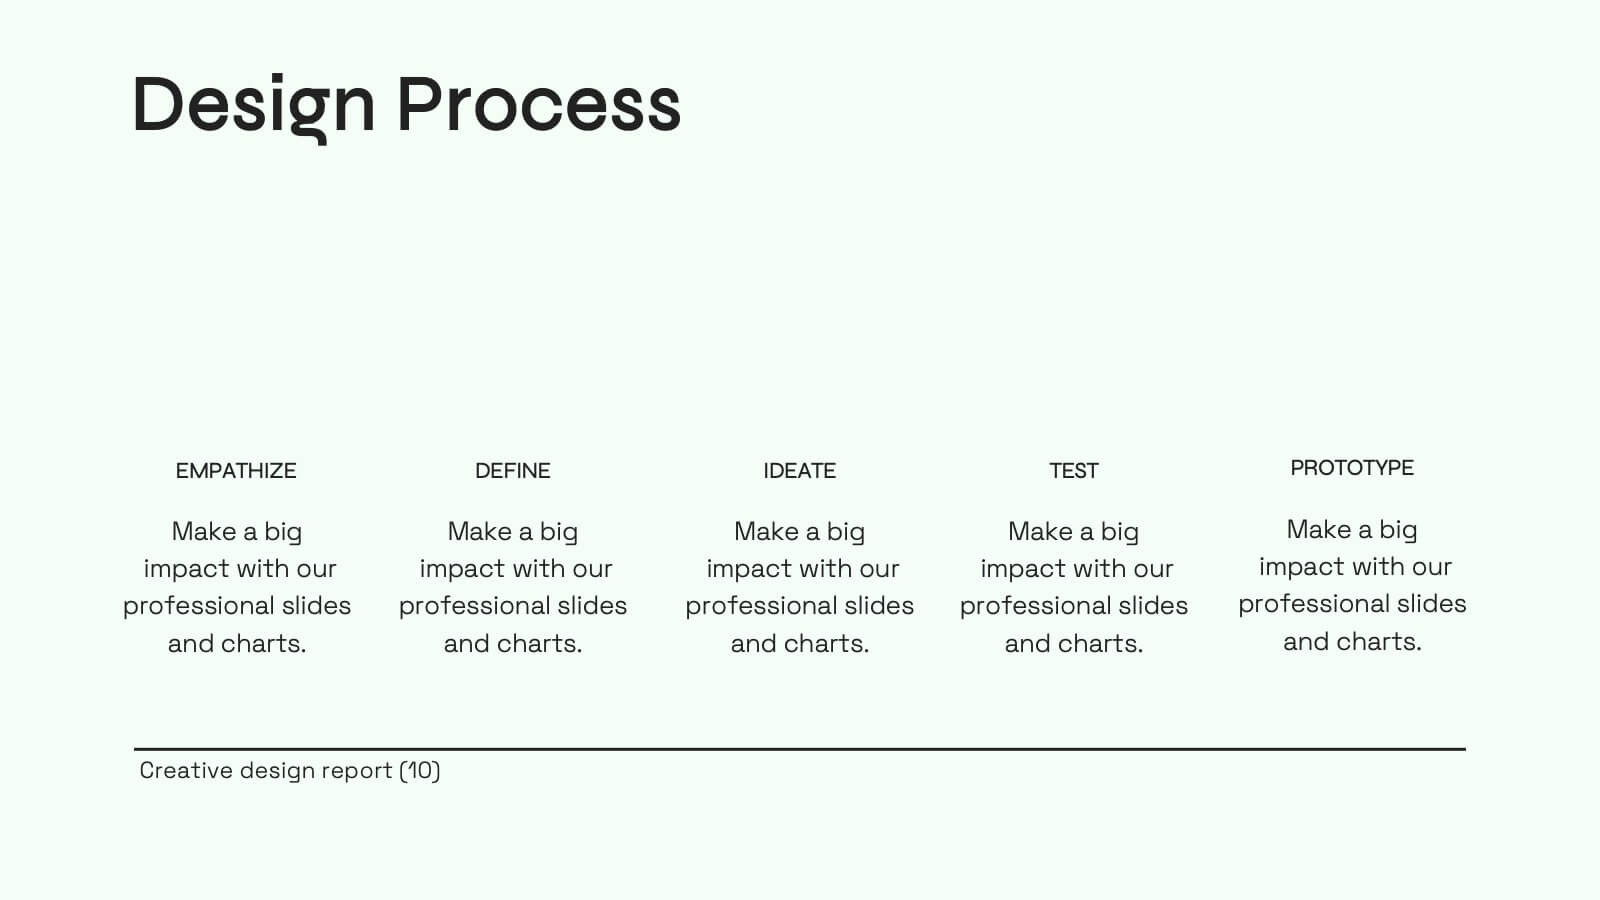
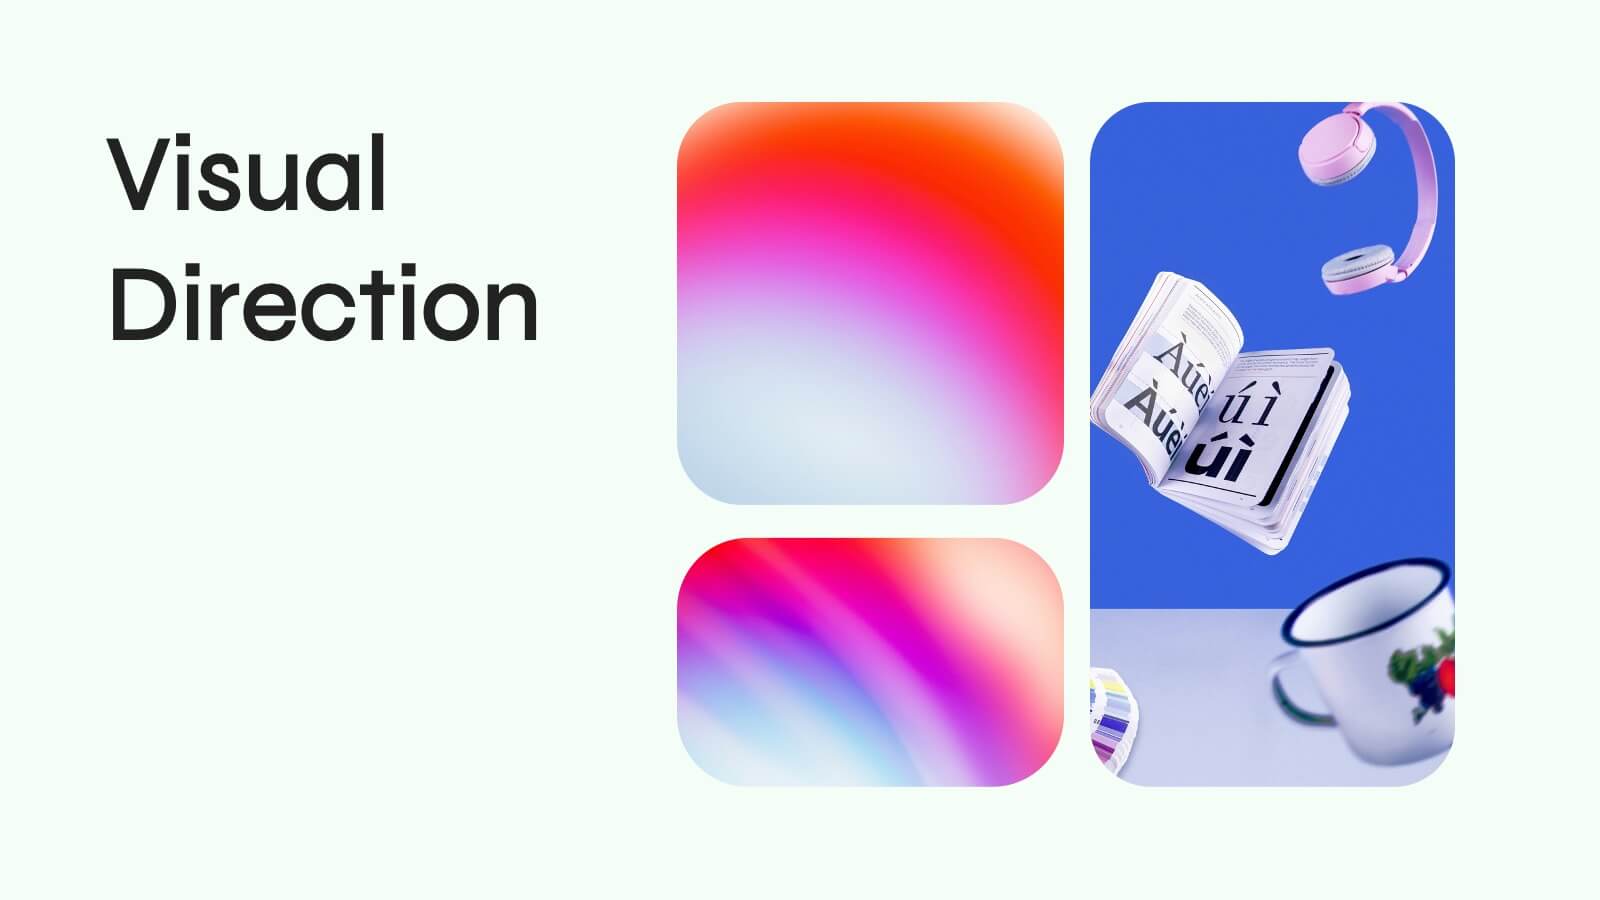
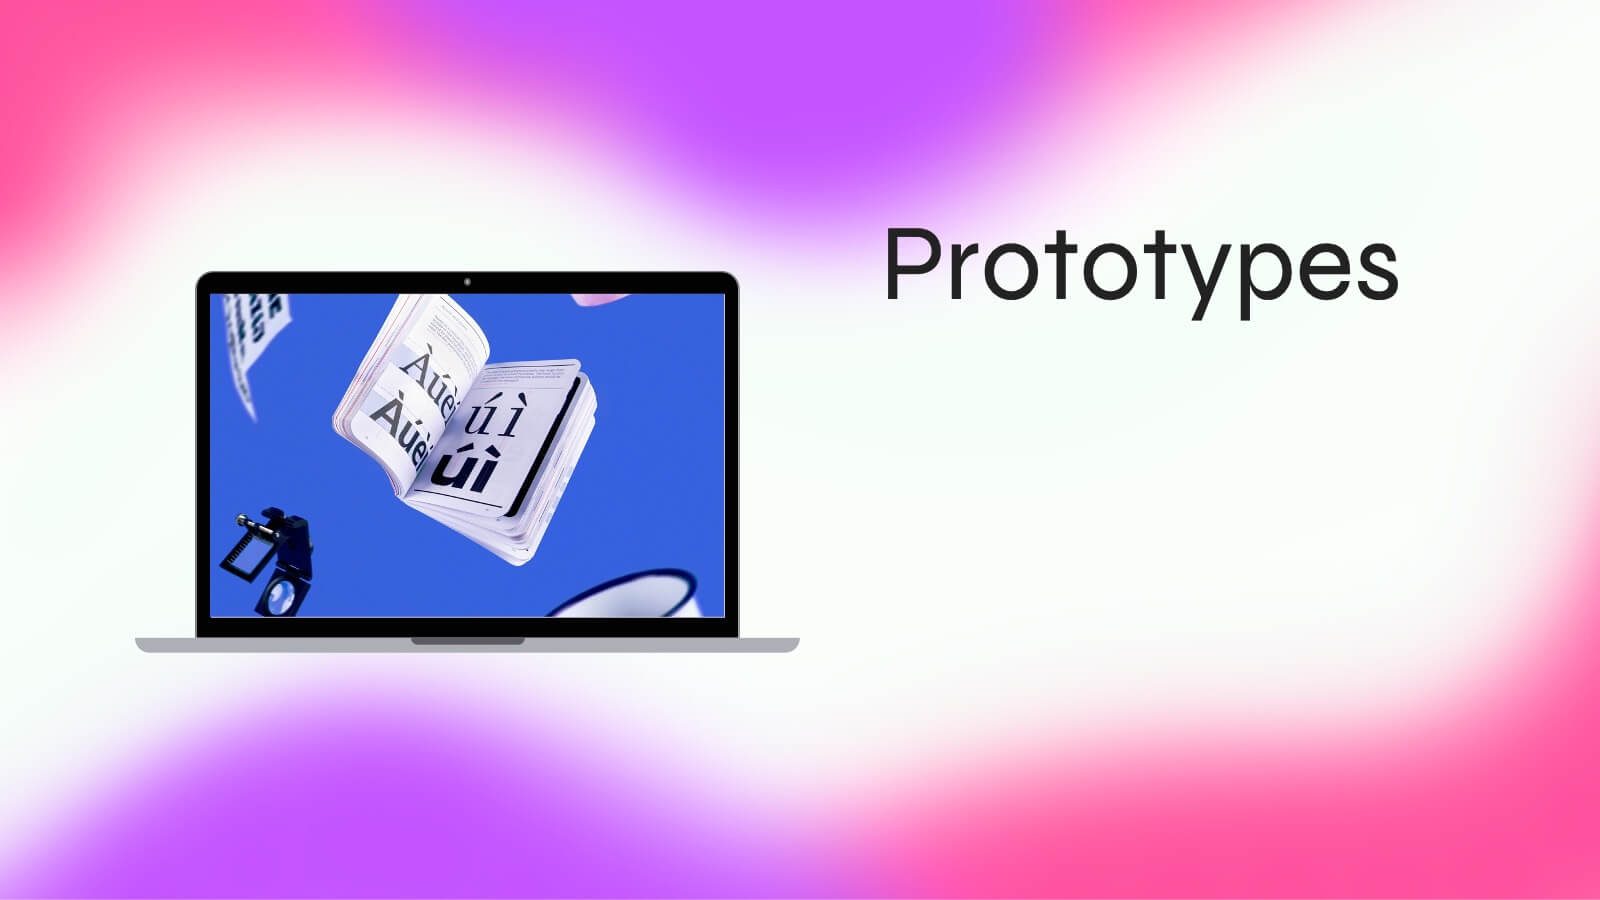
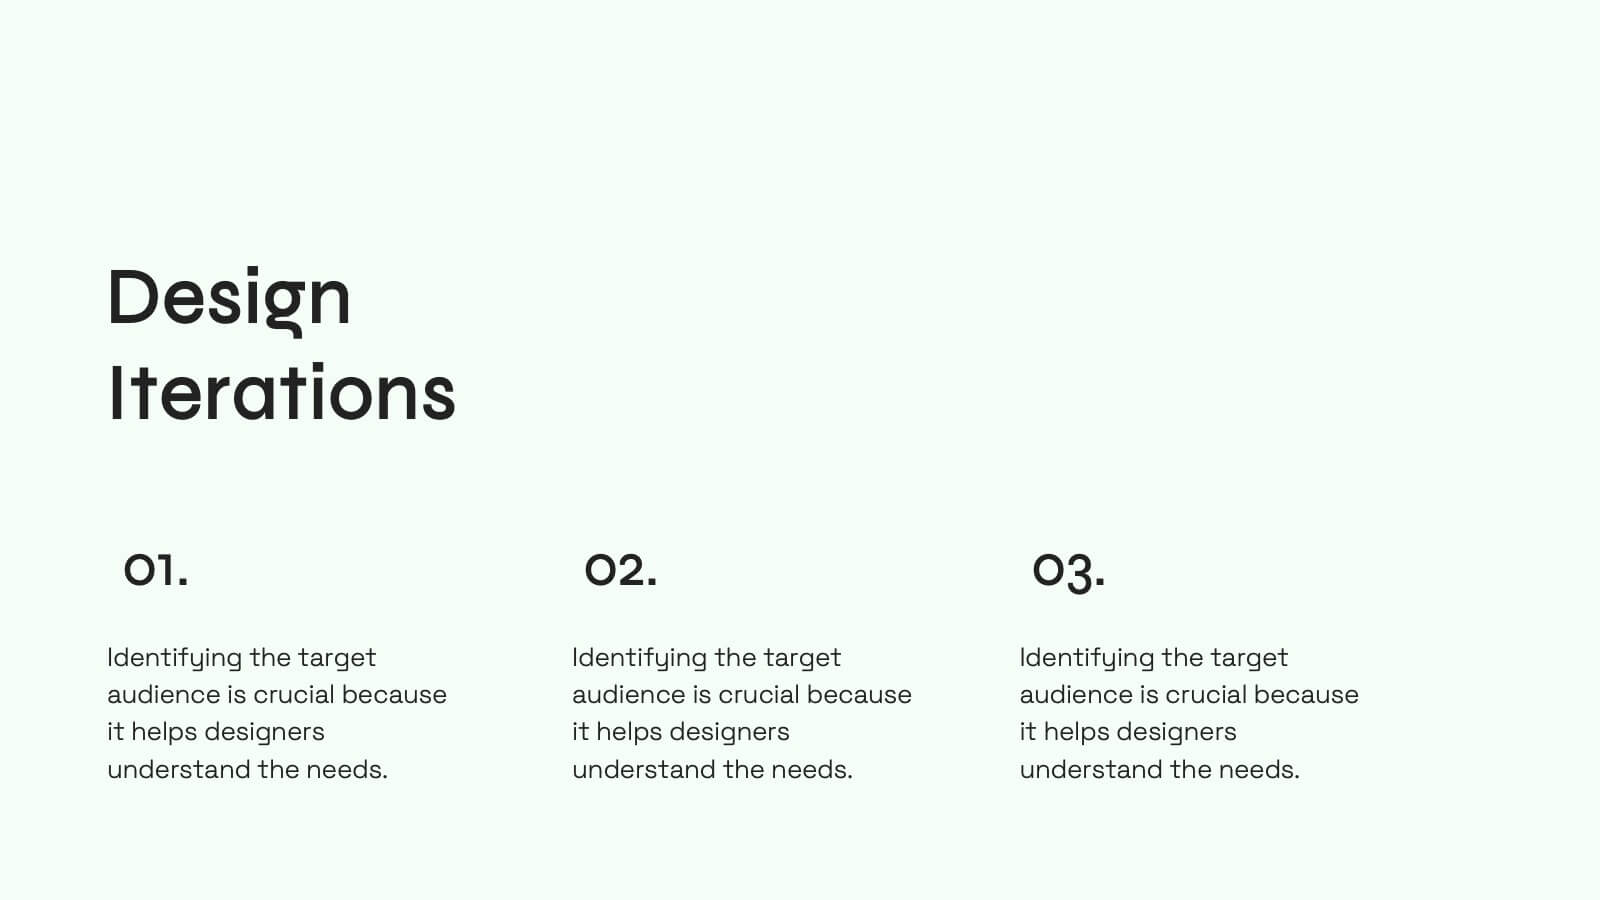
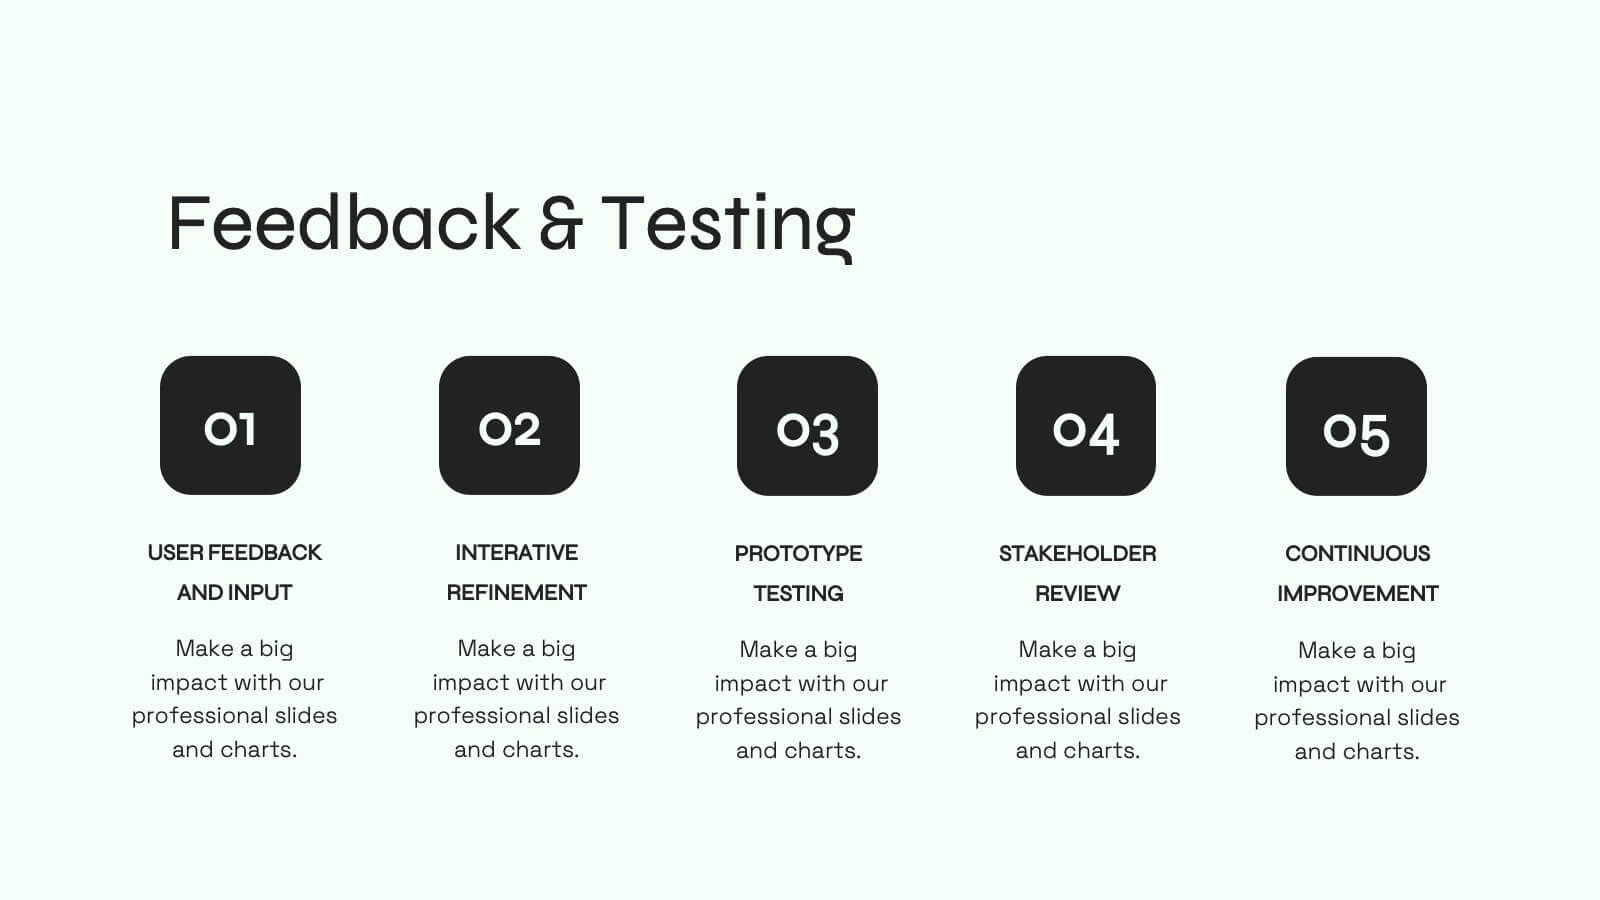
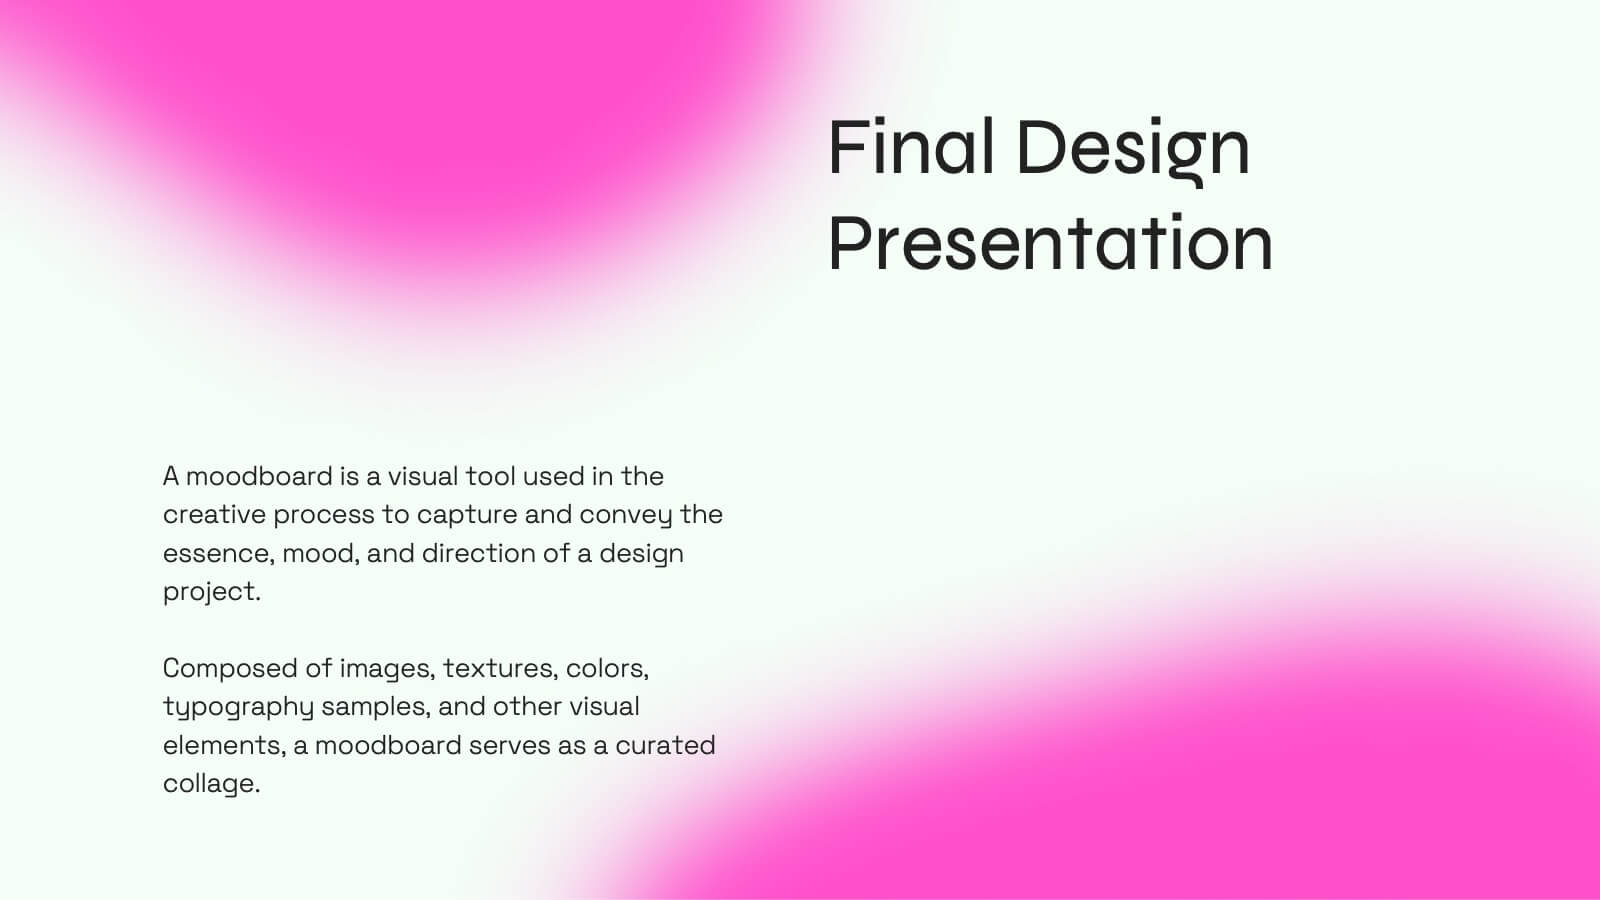
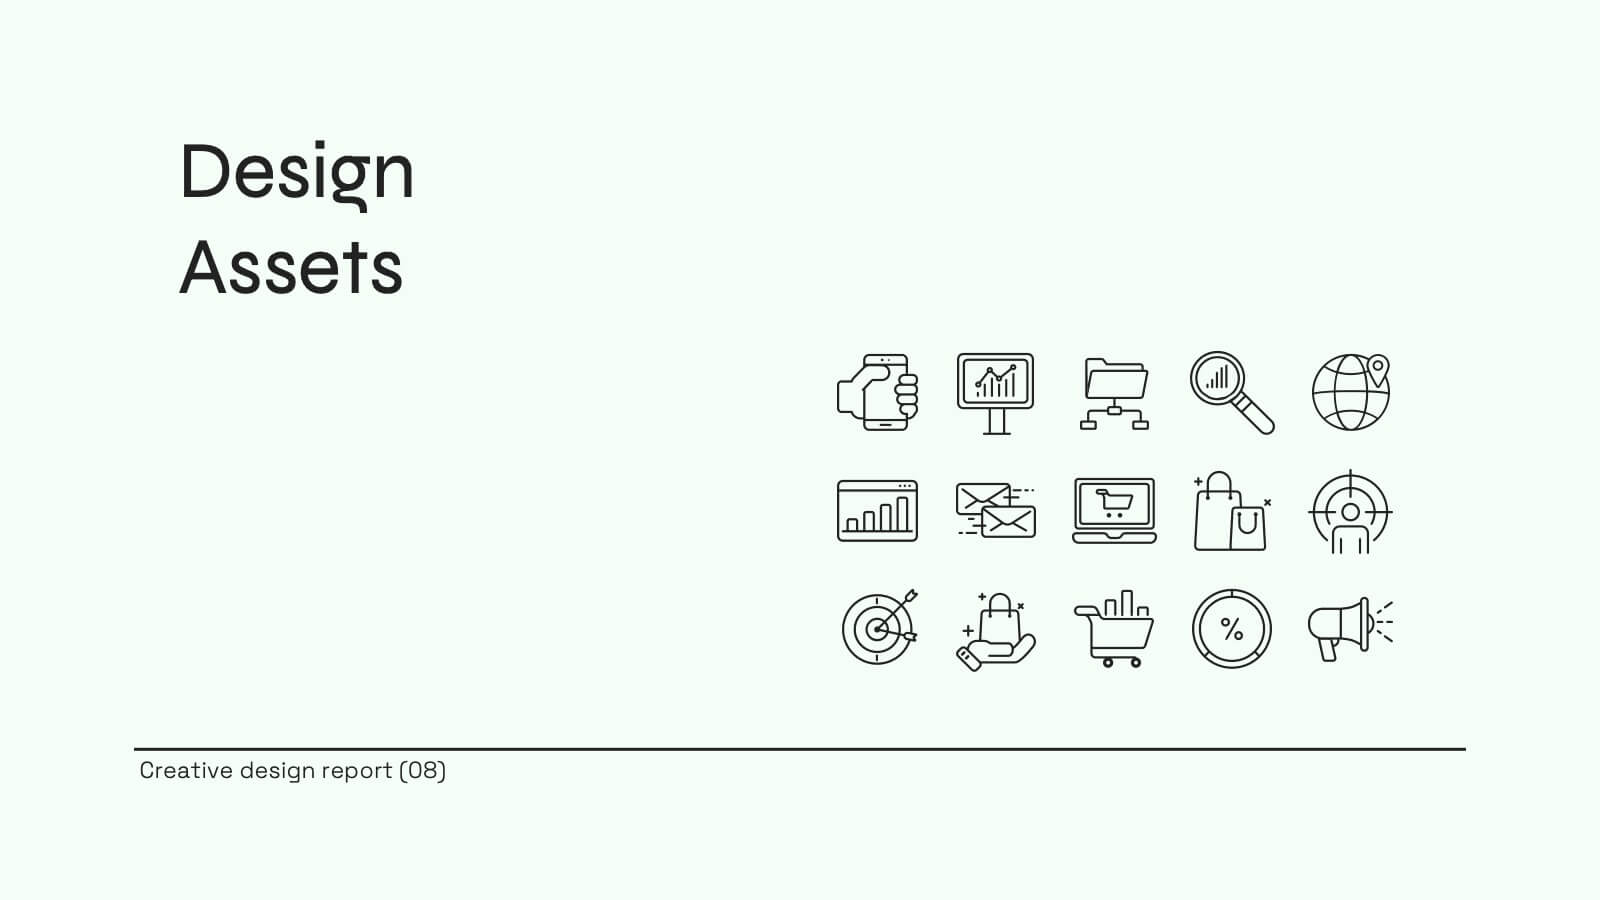
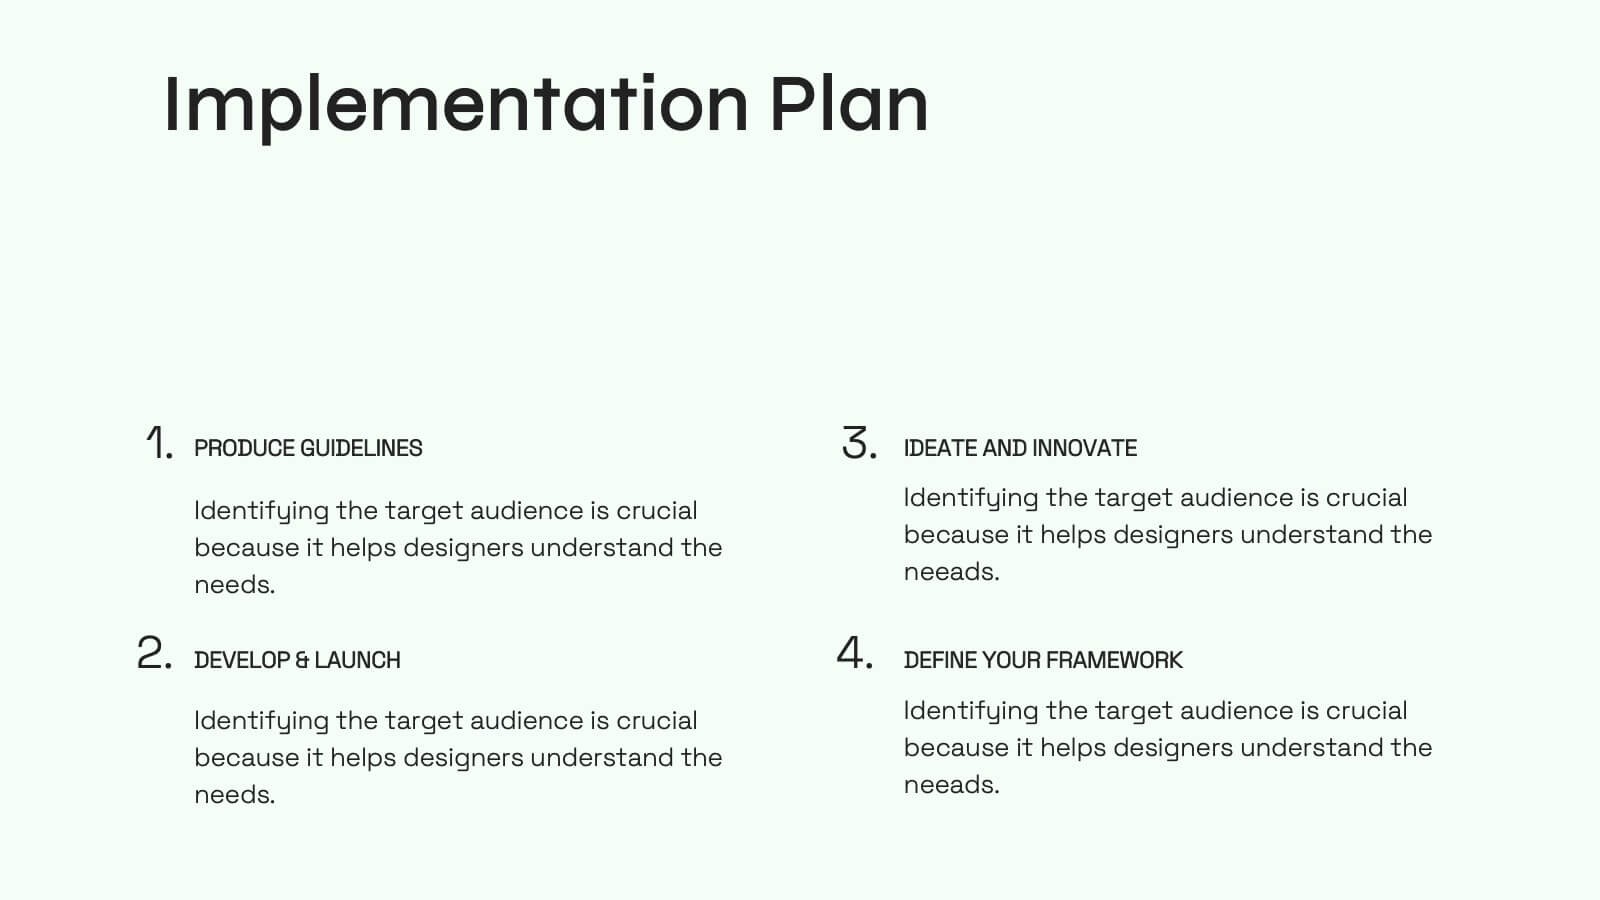
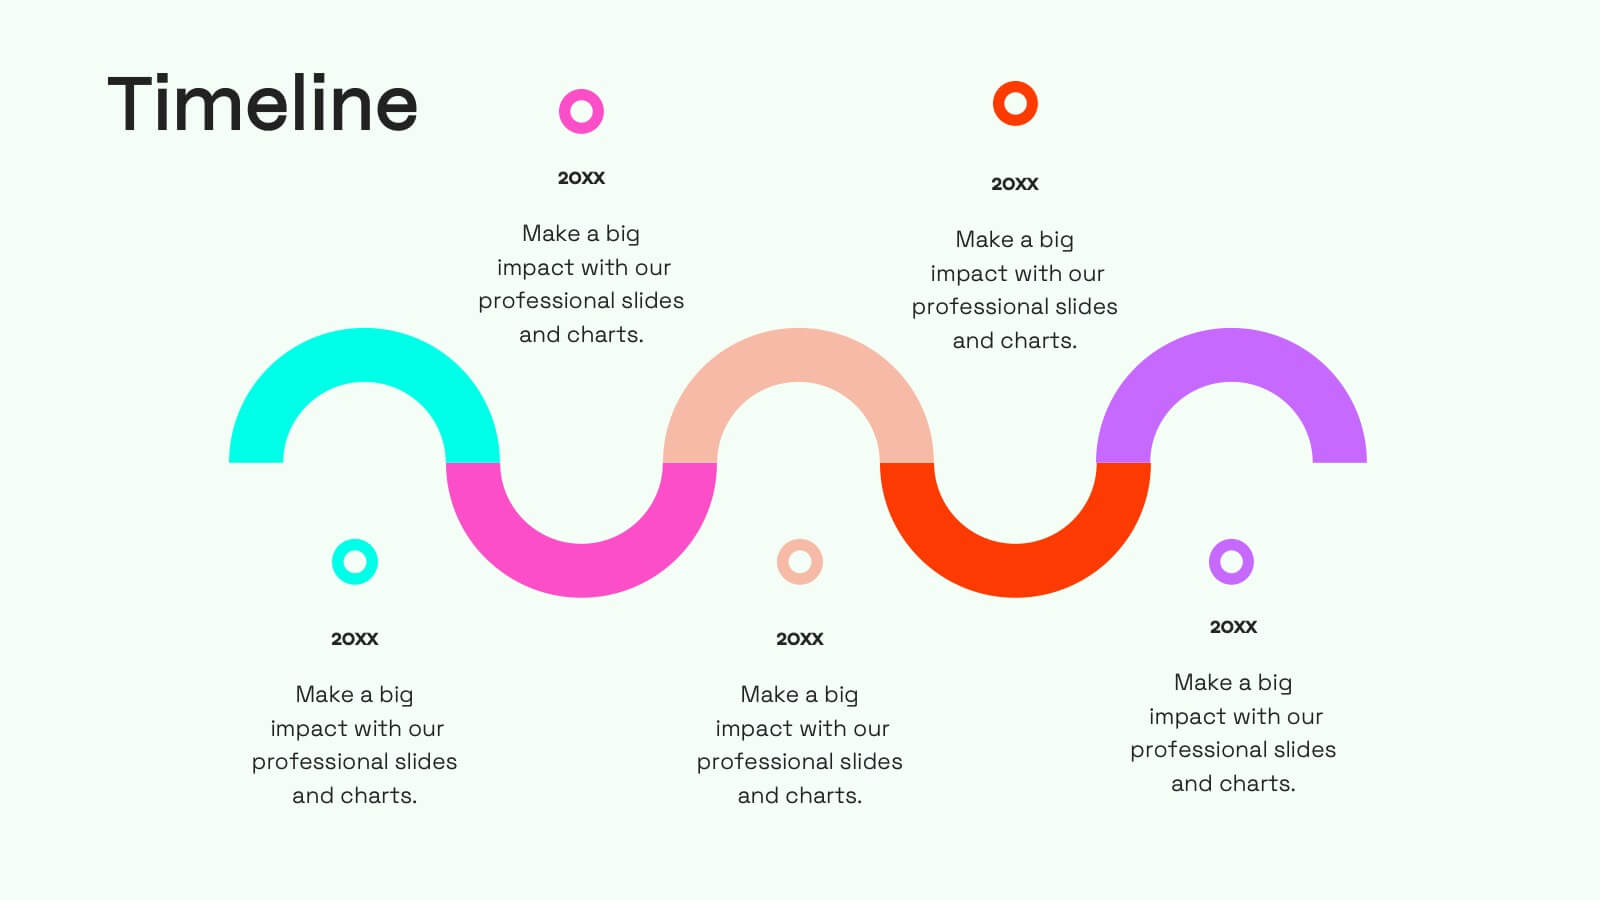
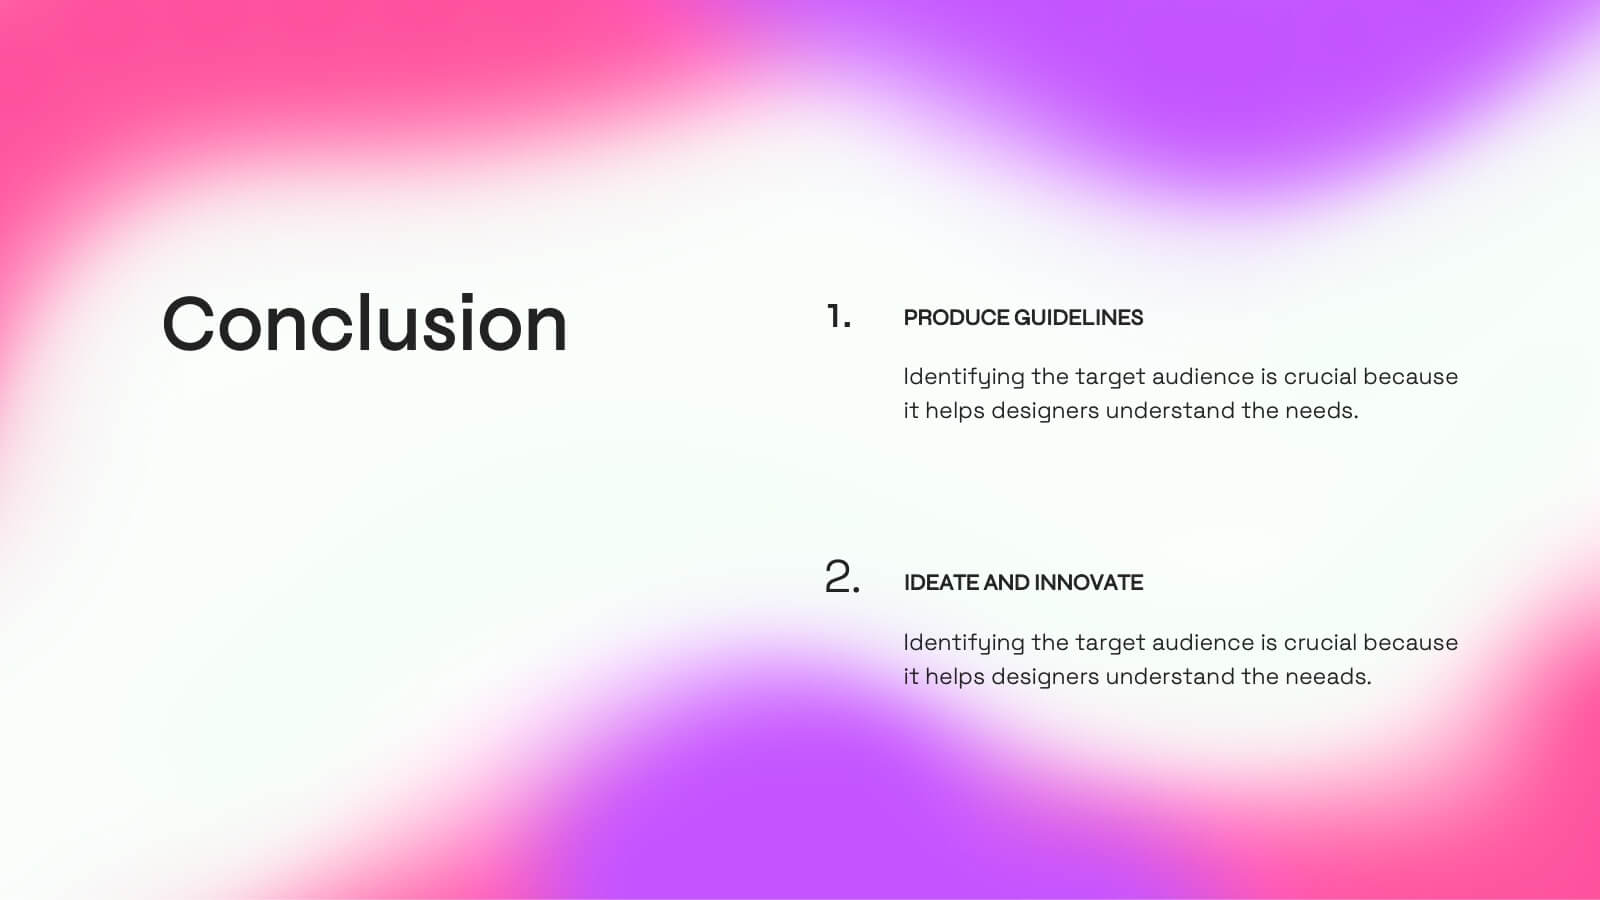
Jade Creative Design Report Presentation
Transform your design report into a captivating visual experience with this elegant jade-themed presentation template! Ideal for showcasing your creative projects, it effectively highlights key concepts, methodologies, and outcomes in a polished format. With its striking design, your work will impress clients and stakeholders alike. Compatible with PowerPoint, Keynote, and Google Slides.


7 diapositivas
Human Resources Administration Infographic
Human Resources Administration involves managing and overseeing various aspects of an organization's human capital and related processes. Our HR administration Infographic is your compass in the vast realm of HR, guiding you through essential aspects, best practices, and strategies crucial for successful HR management. This template is your guide to navigating the HR terrain. Compatible with Powerpoint, Keynote, and Google Slides. Discover best practices, strategies, and essential aspects of HR, empowering you to lead with expertise, empathy, and efficiency in the exciting world of human resources.


4 diapositivas
Virtual Collaboration and WFH Tools Presentation
Supercharge your workflow with a clean visual that brings your digital workspace to life! This presentation template focuses on streamlining communication and productivity through key virtual collaboration tools and remote work essentials. It’s perfect for outlining platforms, strategies, or tools that boost efficiency. Fully compatible with PowerPoint, Keynote, and Google Slides.


22 diapositivas
Quantum Scientific Research Presentation
Present your scientific research with this comprehensive and professional template! Perfect for detailing research objectives, methodology, and key findings. Ideal for researchers and academics aiming to share their work clearly and effectively. Compatible with PowerPoint, Keynote, and Google Slides, this template ensures your scientific presentations are thorough, engaging, and visually appealing.


7 diapositivas
Processed Food Infographic
Indulge in the intricate world of processed foods with our meticulously crafted infographic. Garnished in a palate of clean white and bold red, this template offers a delectable insight into how our everyday foods transition from raw ingredients to the final product on supermarket shelves. Compatible with Powerpoint, Keynote, and Google Slides, our template offers detailed graphics, intuitive icons, and straightforward image placeholders that dive deep into the realm of processed foods. This is a must-have for nutritionists, dieticians, food bloggers, or any individual keen on educating others about the nuances of processed foods in our daily diet.


5 diapositivas
Brief Overview of Key Insights Presentation
Present essential information at a glance with this Brief Overview of Key Insights slide. Designed around a bold key graphic, this layout highlights up to four major takeaways with icons and concise descriptions. Ideal for summaries, analysis highlights, or recommendations. Fully editable in Canva, PowerPoint, or Google Slides.


7 diapositivas
Strategic Business Execution Playbook Presentation
Streamline your execution roadmap with this Strategic Business Execution Playbook. Featuring a sleek, step-by-step layout, it’s ideal for showcasing business stages, workflows, or strategic planning phases. Easy to customize in PowerPoint, Keynote, and Google Slides, this template helps teams visualize priorities and align goals with precision and clarity.


23 diapositivas
Lexicon Startup Pitch Deck Template Presentation
The Startup Pitch Deck Presentation Template provides a modern and professional design with 23 fully customizable slides, ideal for startups seeking funding or presenting their business idea. Key sections include company overview, problem statement, solution, market opportunity, business model, and unique selling proposition (USP). It also covers competitive landscape, product features, financials, milestones, and funding requirements, ensuring a comprehensive pitch. The vibrant orange and gray color scheme adds energy and creativity to the presentation. Compatible with PowerPoint, Keynote, and Google Slides, this template is perfect for impactful startup pitches.


6 diapositivas
Decision Tree Diagrams Presentation
Turn complex choices into clear, visual stories with this clean and modern template. Perfect for illustrating outcomes, decision paths, or process options, it helps you communicate strategy and logic with confidence. Fully customizable and compatible with PowerPoint, Keynote, and Google Slides for seamless professional presentations.


5 diapositivas
Project Status Update Report Presentation
Keep your project tracking transparent and effective with the "Project Status Update Report" presentation templates. These templates help you visually communicate the progress of tasks, timelines, and milestones, ensuring stakeholders stay informed and engaged. Ideal for project managers needing a streamlined, professional format compatible with PowerPoint, Keynote, and Google Slides, they simplify reporting and enhance project visibility.


8 diapositivas
Vision and Mission Alignment Presentation
Harmonize your organization's aspirations and objectives with our "Vision and Mission Alignment" presentation template. This template provides a visually appealing way to present your company's vision and mission, ensuring clarity and coherence in communication. Perfect for strategic meetings and workshops, it is compatible with PowerPoint, Keynote, and Google Slides. Make use of this design to bridge the gap between where you are and where you want to be.


7 diapositivas
Communication Styles Infographic
Dive into the diverse world of communication with our communication styles infographic. Set against a palette of blue, yellow, and white, this template offers a visual exploration of different communication methods and their nuances. Whether it's assertive, passive, aggressive, or passive-aggressive, understanding these styles is vital in both personal and professional settings. Ideal for corporate trainers, educators, students, or anyone aiming to improve their interpersonal skills. Crafted for clarity and compatibility, this infographic is an excellent addition to PowerPoint, Keynote, and Google Slides, ensuring your presentations resonate with both substance and style.


6 diapositivas
5-Stage Circular Cycle Presentation
Energize your workflow with a clean, circular layout that turns five interconnected steps into a clear, engaging story. This presentation helps you explain any repeating process or continuous cycle with simplicity and flow, making complex ideas easier to follow. Compatible with PowerPoint, Keynote, and Google Slides.


5 diapositivas
Teenage Suicide Awareness Infographics
Teenage suicide is a serious public health concern that requires awareness and attention. These vertical infographics are designed to raise awareness about teenage suicide, its risk factors, and prevention strategies. The goal of these infographics is to educate the audience, including parents, educators, and community members, about the importance of early intervention, mental health support, and creating a supportive environment for teenagers. The design elements included are carefully chosen to evoke empathy, compassion, and understanding. Fully customizable and compatible with Powerpoint, Keynote, and Google Slides.