


Características


¿Tienes alguna pregunta?
Recomendar


5 diapositivas
Law and Criminal Justice Infographics
Law and Criminal Justice are two interconnected fields that encompass the study, enforcement, and administration of laws and regulations within a society. These vertical infographic templates provide an overview of key concepts, statistics, and information related to the field of law and criminal justice. It is designed to educate and inform the audience about various aspects of the legal system and the criminal justice process. These infographics will allow you to provide a comprehensive overview of the law and criminal justice system. Easily customizable and compatible with Powerpoint, Keynote, and Google Slides.


3 diapositivas
Governance and Compliance Slide Presentation
Bring structure and clarity to complex corporate processes with this modern triangle-based presentation design. Ideal for showcasing governance principles, compliance strategies, and operational standards, it visually balances accountability and efficiency. Fully editable and compatible with PowerPoint, Keynote, and Google Slides for seamless professional customization.


5 diapositivas
Business Annual Report Summary Presentation
Clear, Concise, and Impactful! The Business Annual Report Summary Presentation template helps you present key performance indicators, financial metrics, and company growth in a professional and visually engaging way. Fully customizable and compatible with PowerPoint, Keynote, and Google Slides, it’s ideal for executives and analysts aiming for a compelling data-driven presentation.


5 diapositivas
Financial Budget Infographics
Financial goals refer to specific objectives and targets that individuals or businesses set to manage their finances effectively and achieve financial success. These vertical infographics are designed to help individuals and businesses effectively present their financial budgets and plans. Whether you're a financial analyst or a business owner, this template is perfect for conveying complex financial information in a clear and concise manner. These infographics provide an overview of the budget, showcasing key financial goals, total income, and total expenses. This features visuals to help users set and track financial goals.


12 diapositivas
Corporate Growth Strategy Steps Presentation
Showcase your expansion roadmap with this Corporate Growth Strategy Steps Presentation. Designed as a five-step vertical ladder, this layout is perfect for illustrating progressive stages like market entry, development, scaling, innovation, and leadership. Each level includes editable icons and text placeholders for clarity and customization. Fully compatible with PowerPoint, Keynote, and Google Slides.


6 diapositivas
OKR Goal-Setting Framework
Clarify your goals and drive performance with this OKR-based layout that maps Objectives, Key Activities, and Results in a clear, actionable format. Ideal for teams, managers, and performance reviews. Each section is fully editable to match your organizational strategy. Compatible with PowerPoint, Keynote, and Google Slides.


22 diapositivas
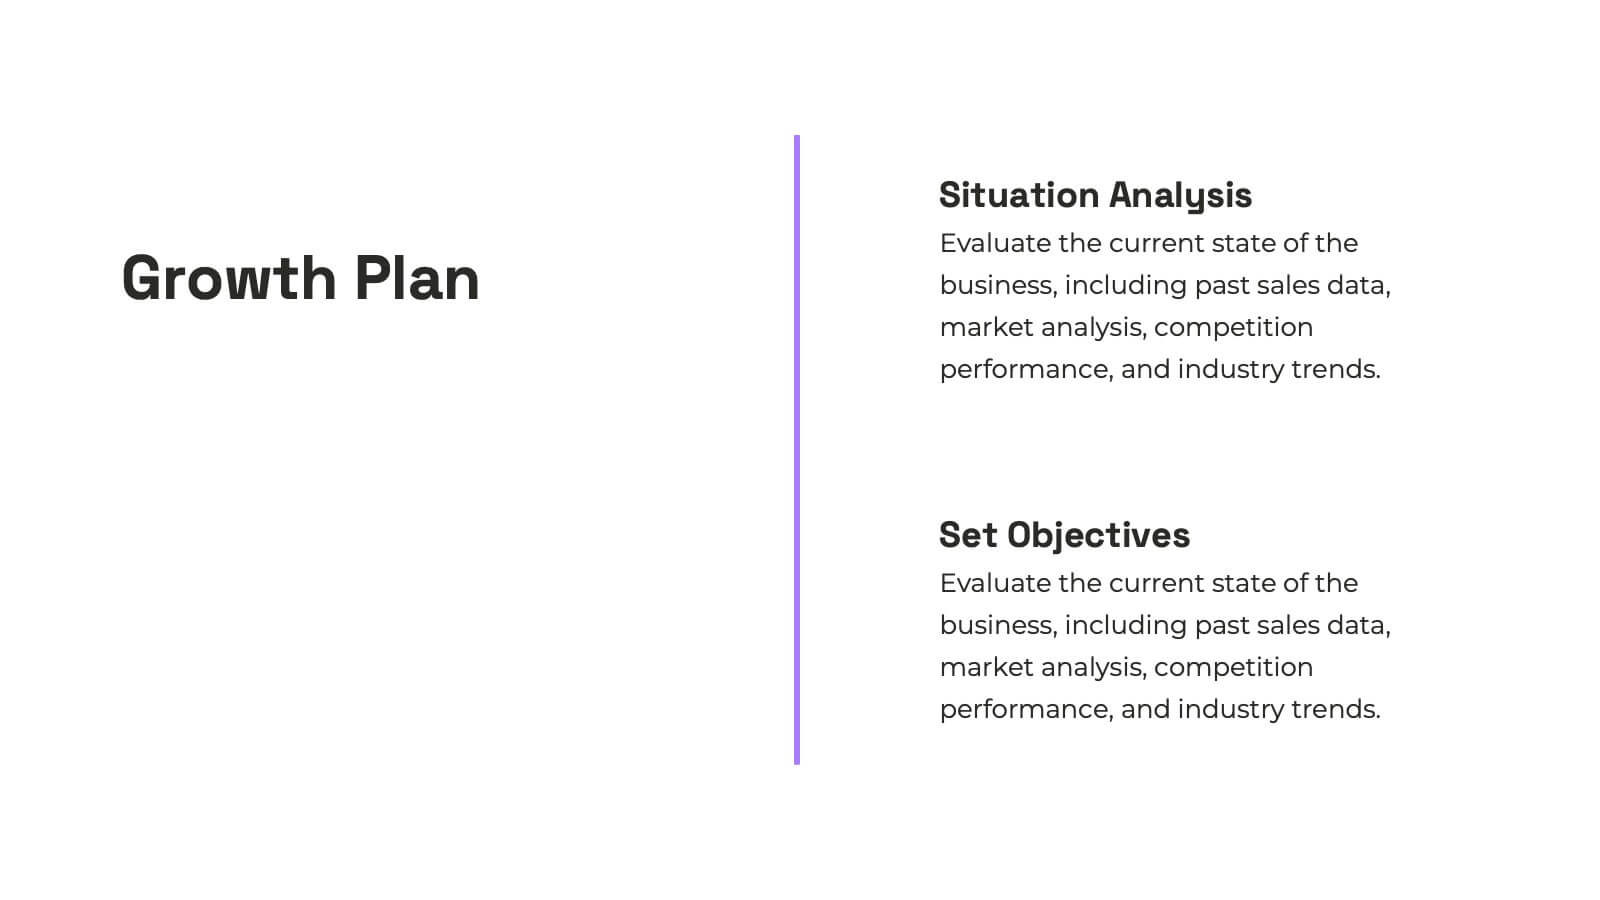
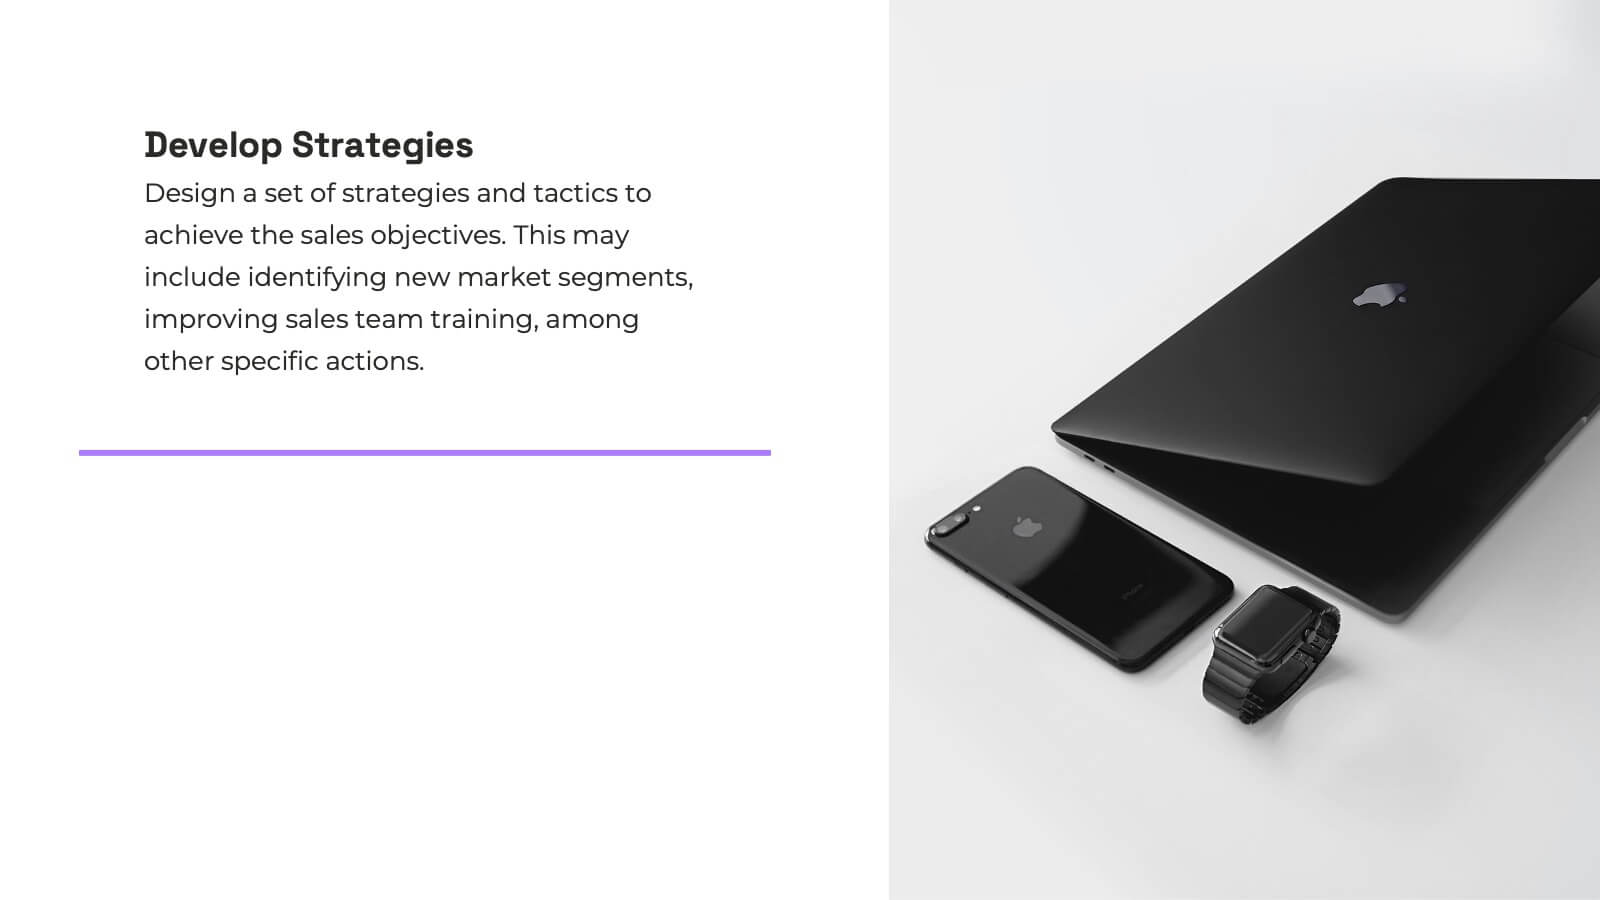
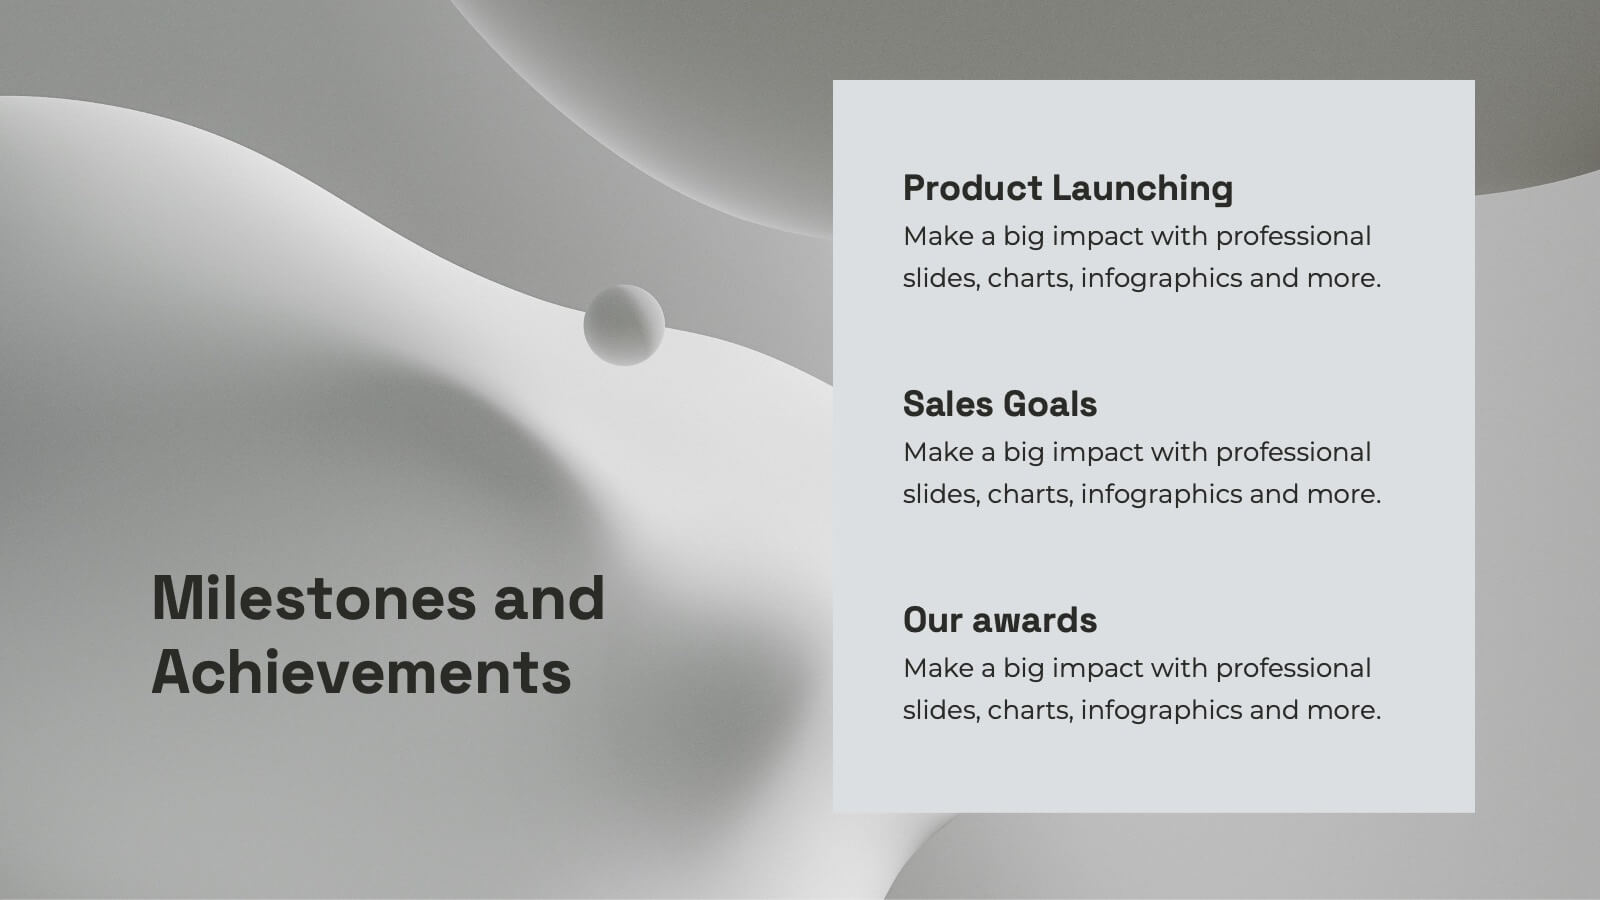
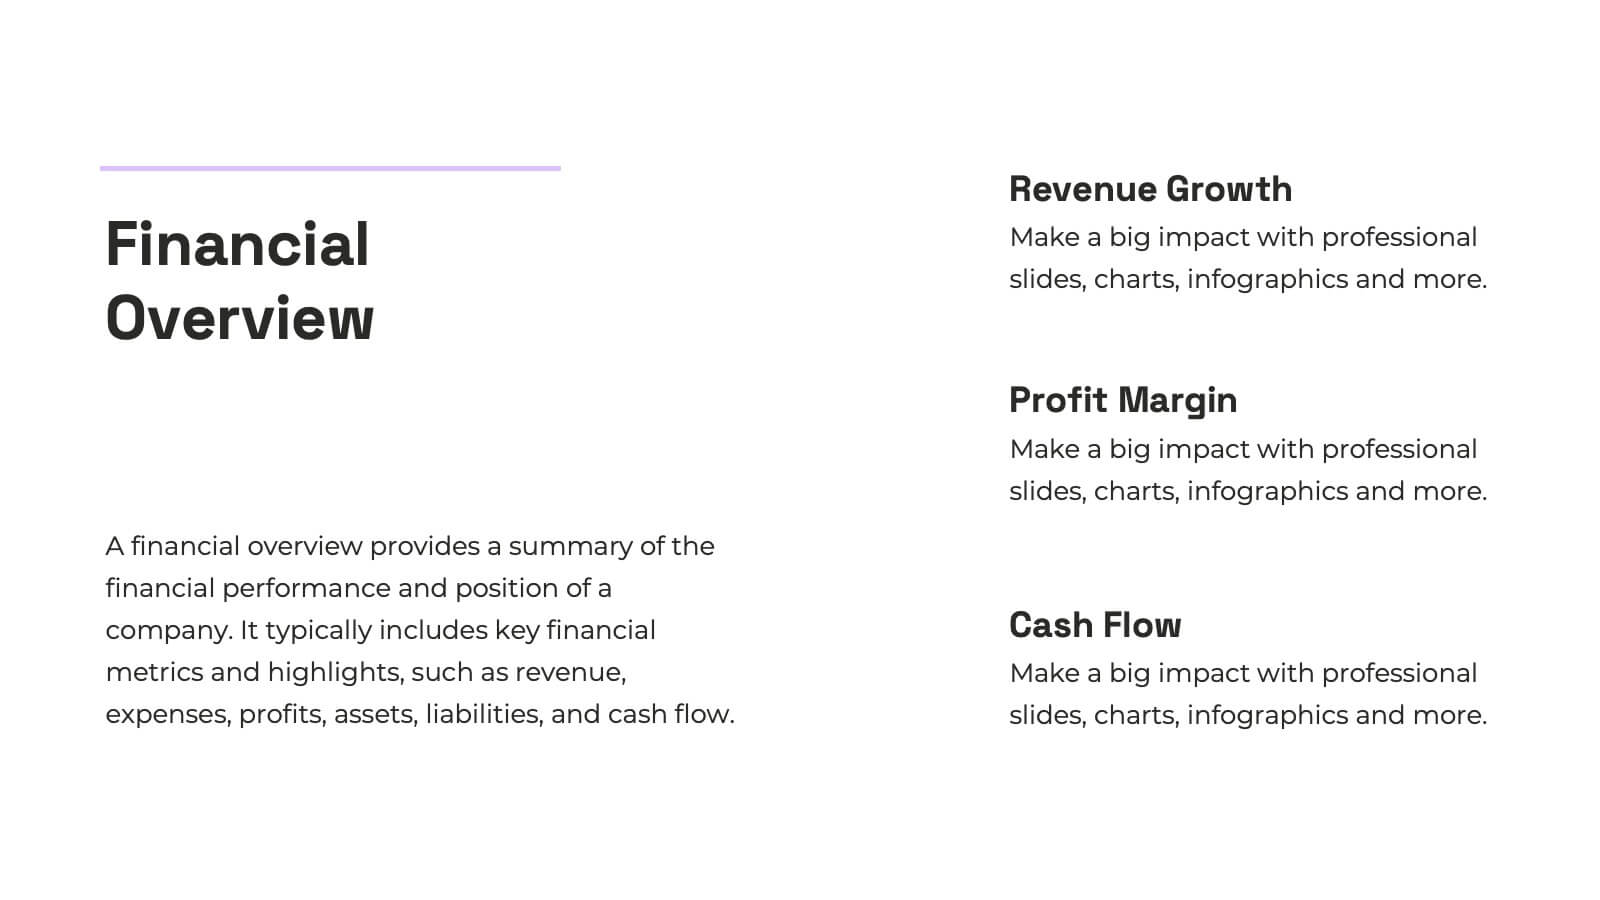
Nexus Startup Growth Plan Presentation
Jumpstart your business journey with this dynamic presentation template! Ideal for outlining your startup growth plan, it covers mission, vision, market analysis, and financial projections with sleek, professional slides. Capture investor interest and articulate your strategy effortlessly. Compatible with PowerPoint, Keynote, and Google Slides, ensuring seamless presentation across all platforms.


7 diapositivas
Core Business Values Slide Presentation
Show what your company stands for with a bold, structured layout that highlights the principles driving your success. This presentation is ideal for communicating organizational values, culture, and goals in a professional, visually balanced way. Fully editable and compatible with PowerPoint, Keynote, and Google Slides for easy customization.


5 diapositivas
WFH Policy Overview Presentation
Bring clarity and confidence to your remote-work guidelines with a clean, puzzle-style layout that makes every policy easy to follow. This presentation explains key expectations, communication standards, and workflow essentials designed to support productive work-from-home environments. Fully customizable and compatible with PowerPoint, Keynote, and Google Slides.


5 diapositivas
Concise Company Overview Executive Summary Presentation
Present your business snapshot with clarity using this Concise Company Overview Executive Summary Presentation. Featuring a colorful puzzle-style diagram with six customizable titles, this slide is ideal for outlining key departments, initiatives, or functions. Fully editable in PowerPoint, Keynote, Google Slides, and Canva for maximum flexibility.


5 diapositivas
Real Estate Investing Infographics
Real estate investing refers to the purchase, ownership, management, rental, or sale of real estate properties with the objective of generating income and/or capital appreciation. These infographic templates can be used to provide key information and insights about real estate investing. These are designed to educate individuals about the basics of real estate investing, its benefits, and important considerations to help them make informed investment decisions. These infographics are great for anyone seeking to understand the basics of real estate. Compatible with Powerpoint, Keynote, and Google Slides.


26 diapositivas
Innovative Business Strategies Presentation
Maximize your business's potential with our Innovative Business Strategies presentation template. This versatile template is a game-changer, compatible with PowerPoint, Keynote, and Google Slides, ensuring seamless integration into any platform you prefer. Crafted to propel your presentations to the next level, it is perfect for entrepreneurs, startups, and corporations aiming to showcase their strategic vision with clarity and impact. The Innovative Business Strategies template includes a variety of slides designed to present complex business strategies in a straightforward, digestible format. It features a clean, professional design that helps convey your message effectively, making it easier for your audience to grasp and remember key points. With customizable graphics and easy-to-edit layouts, you can tailor each slide to fit your brand's unique identity and strategic goals. Whether you're presenting to stakeholders, team members, or at a conference, this template provides the tools you need to communicate your business strategy with confidence. Boost your presentation's visibility and make it the go-to resource for individuals seeking a clear and engaging way to learn about innovative business strategies.


6 diapositivas
User Empathy Map Infographic
An Empathy Map is a visual tool used in design thinking and customer-centric approaches to understand the needs, thoughts, feelings, and behaviors of a specific target user or customer. This infographic template is a tool used in user-centered design and product development to better understand and empathize with the needs, thoughts, emotions, and experiences of the target users. It helps teams gain deeper insights into the users' perspectives and develop more user-focused solutions. The infographic consists of four quadrants, each representing different aspects of the user's experience. Compatible with Powerpoint, Keynote, and Google Slides.


6 diapositivas
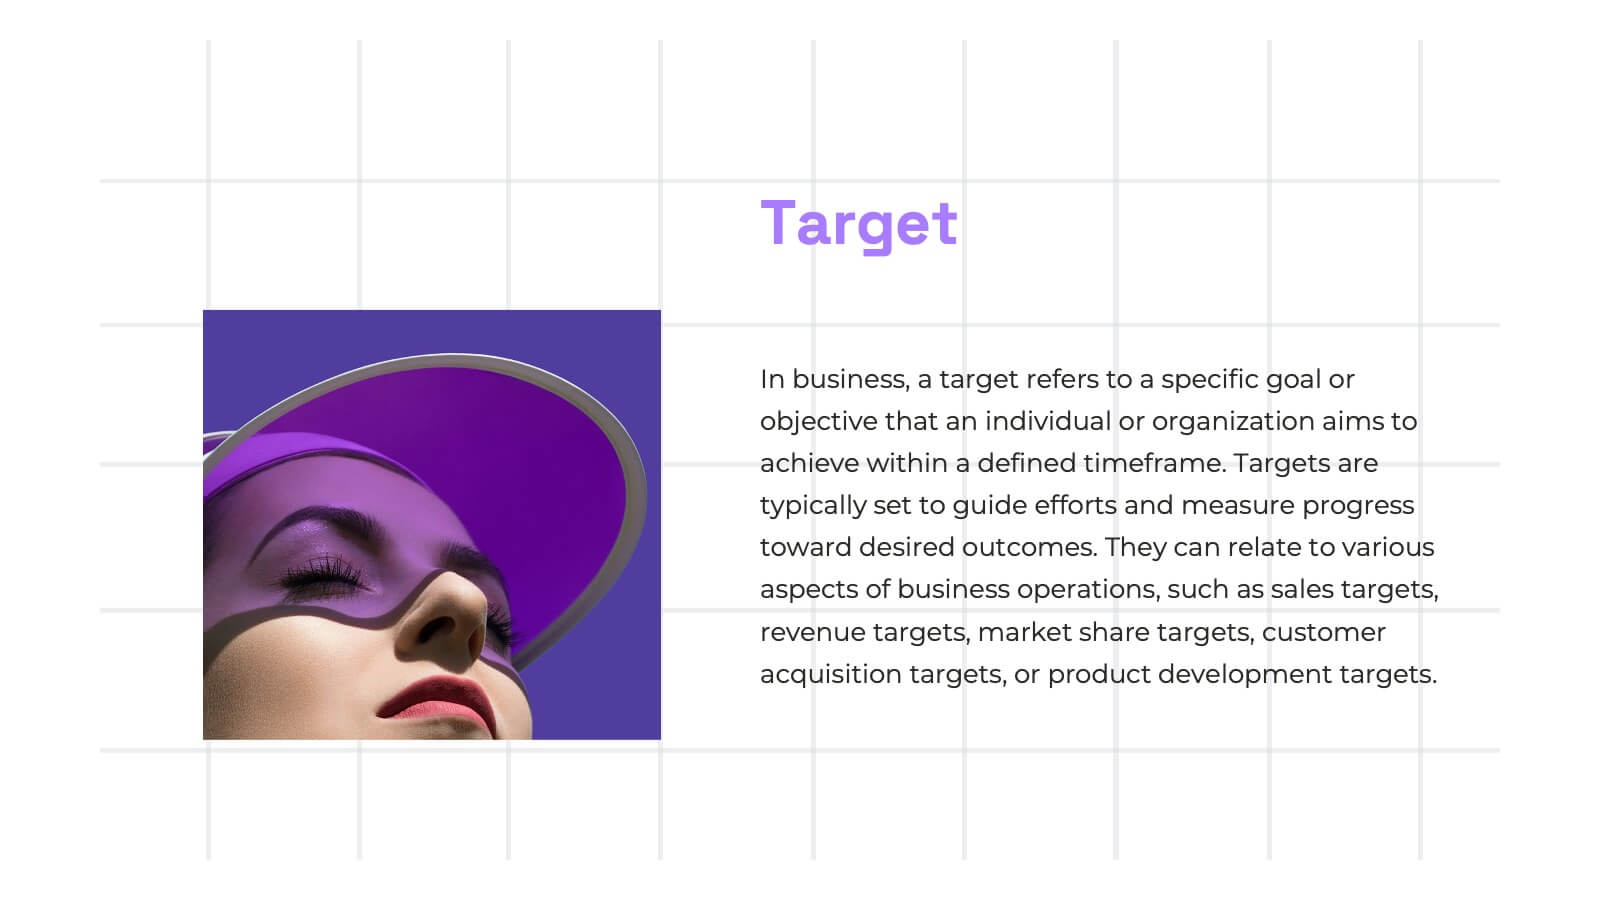
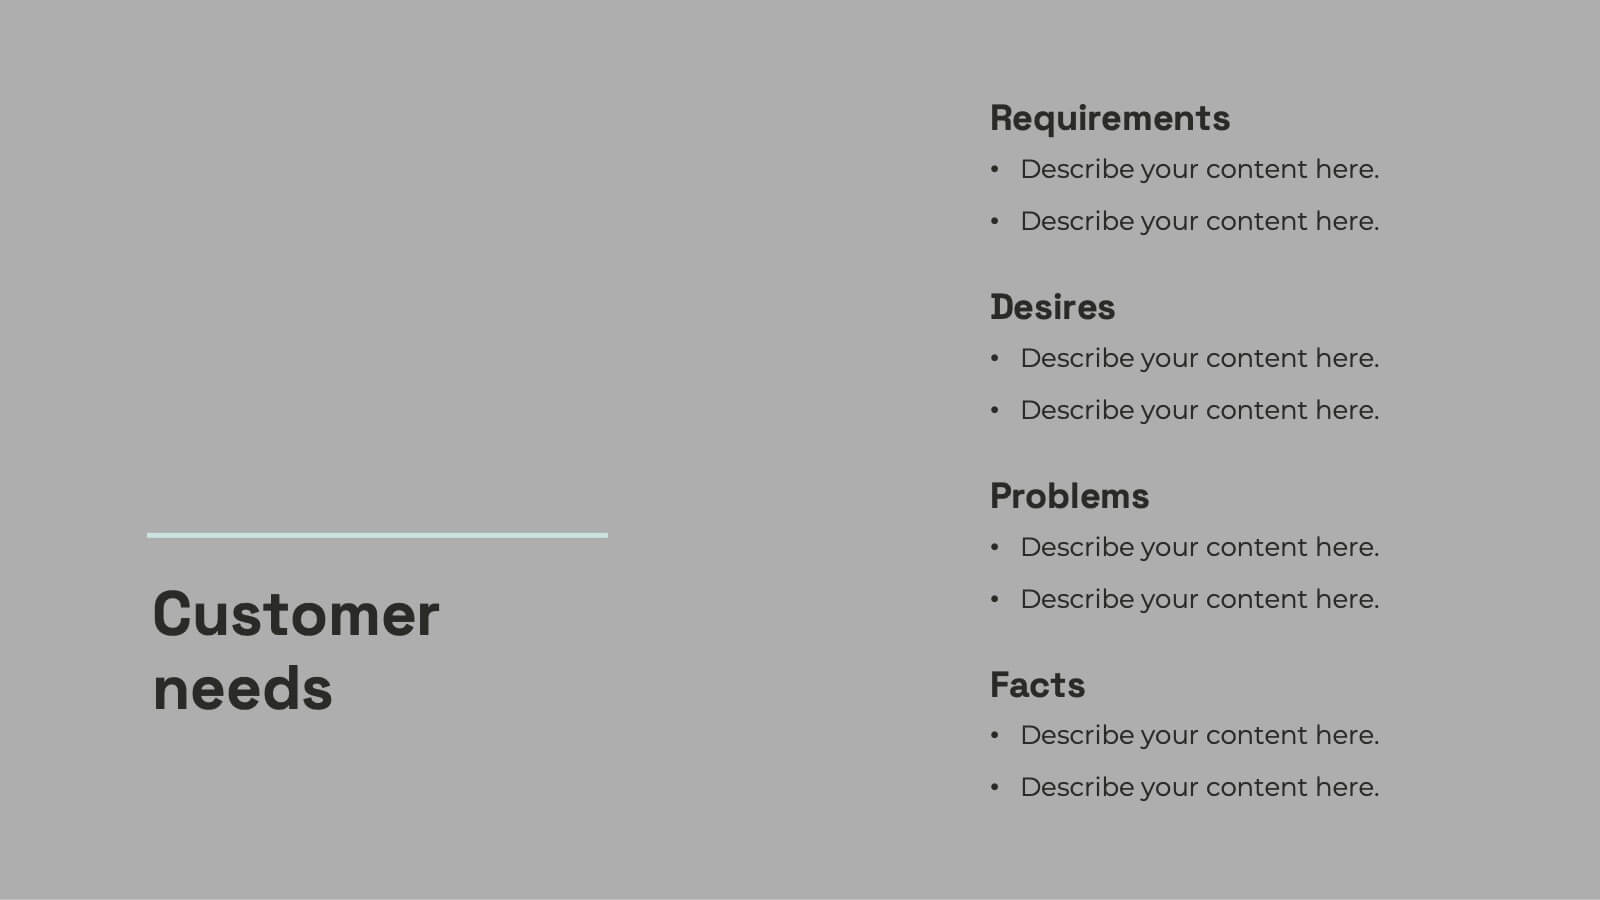
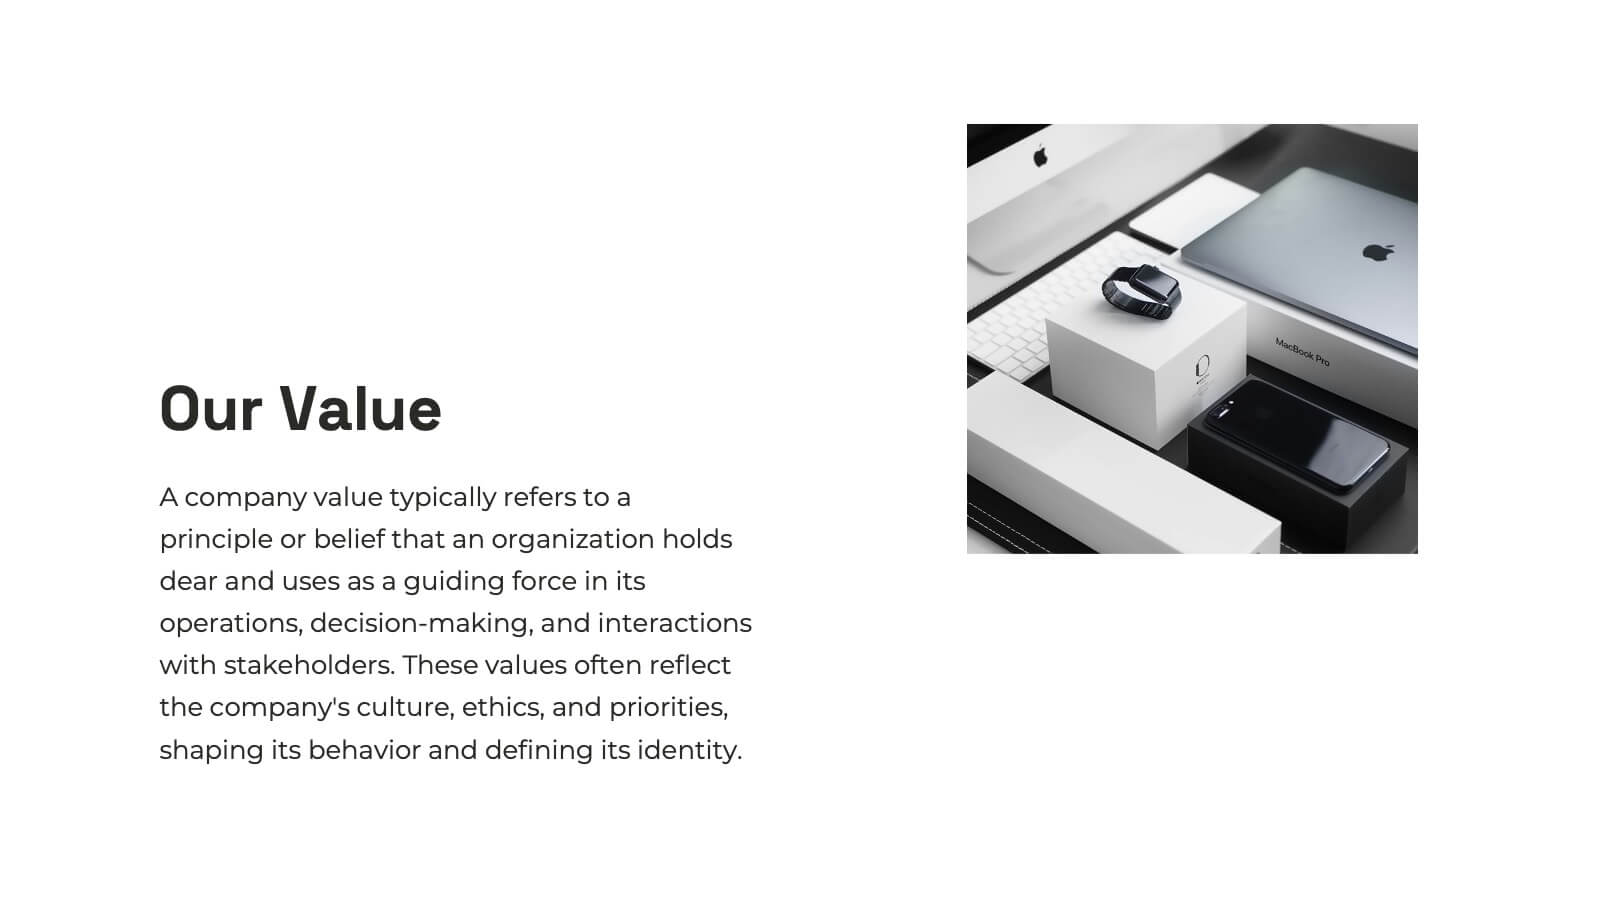
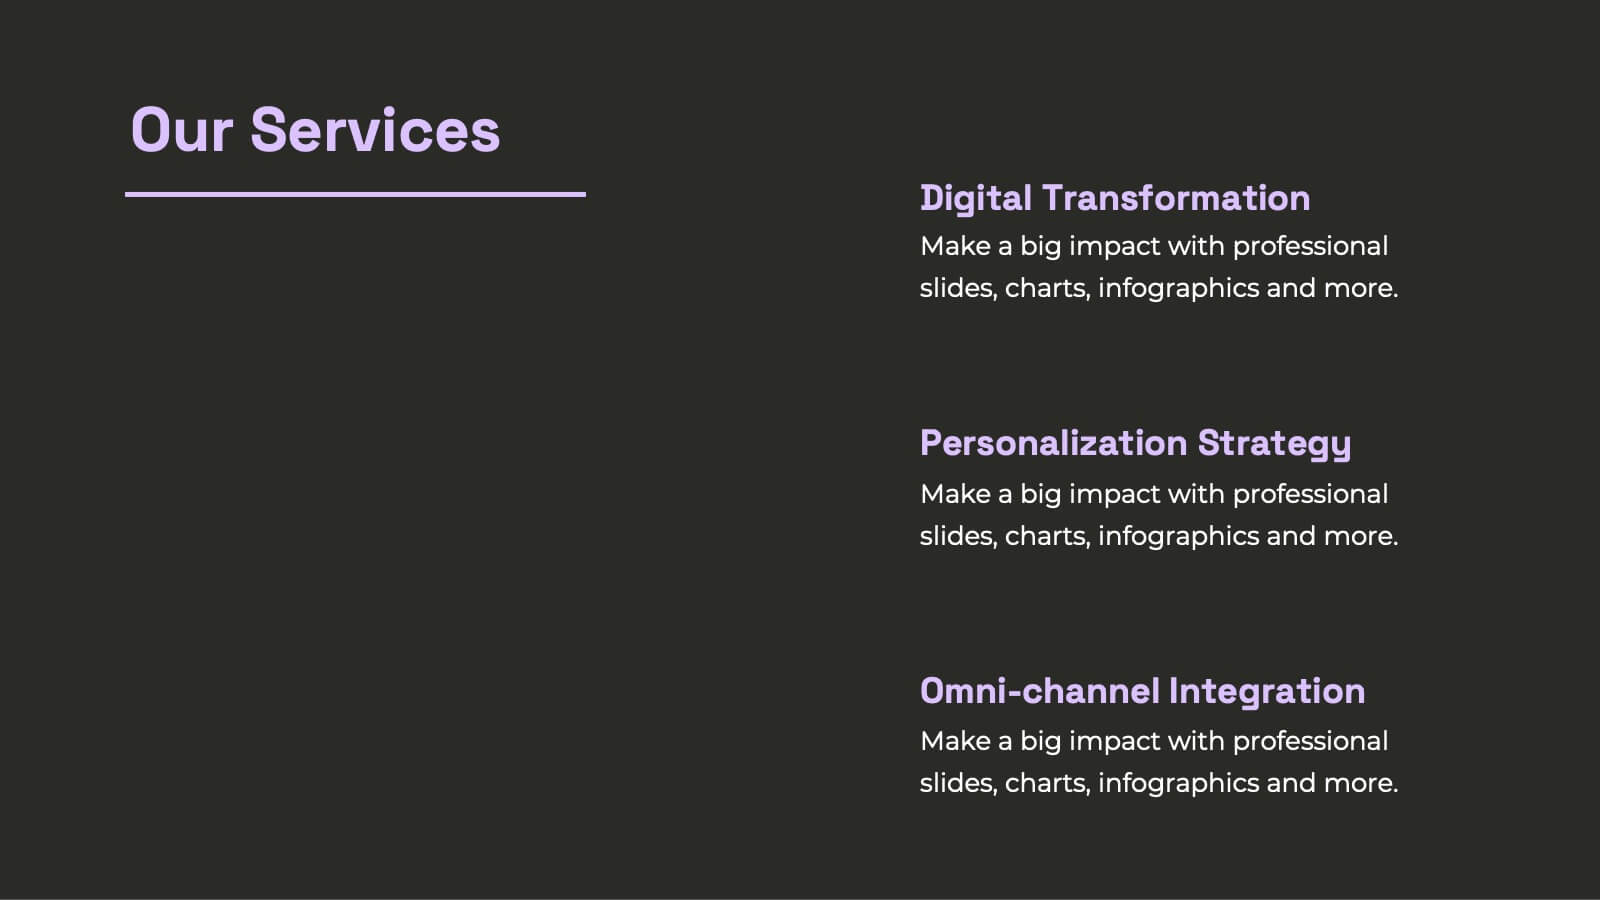
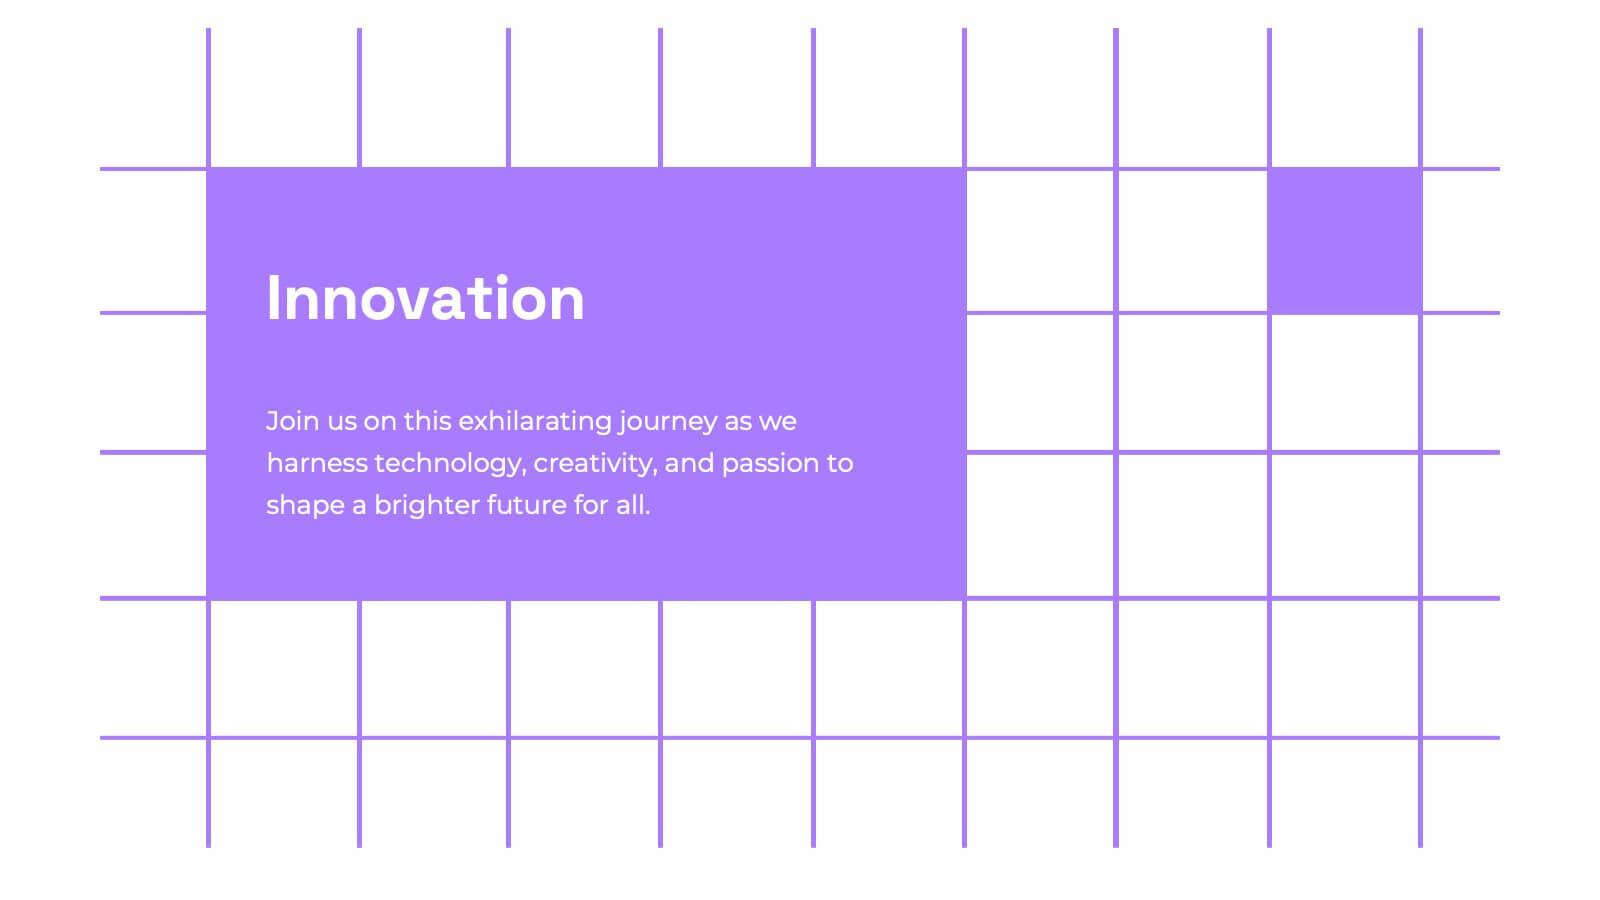
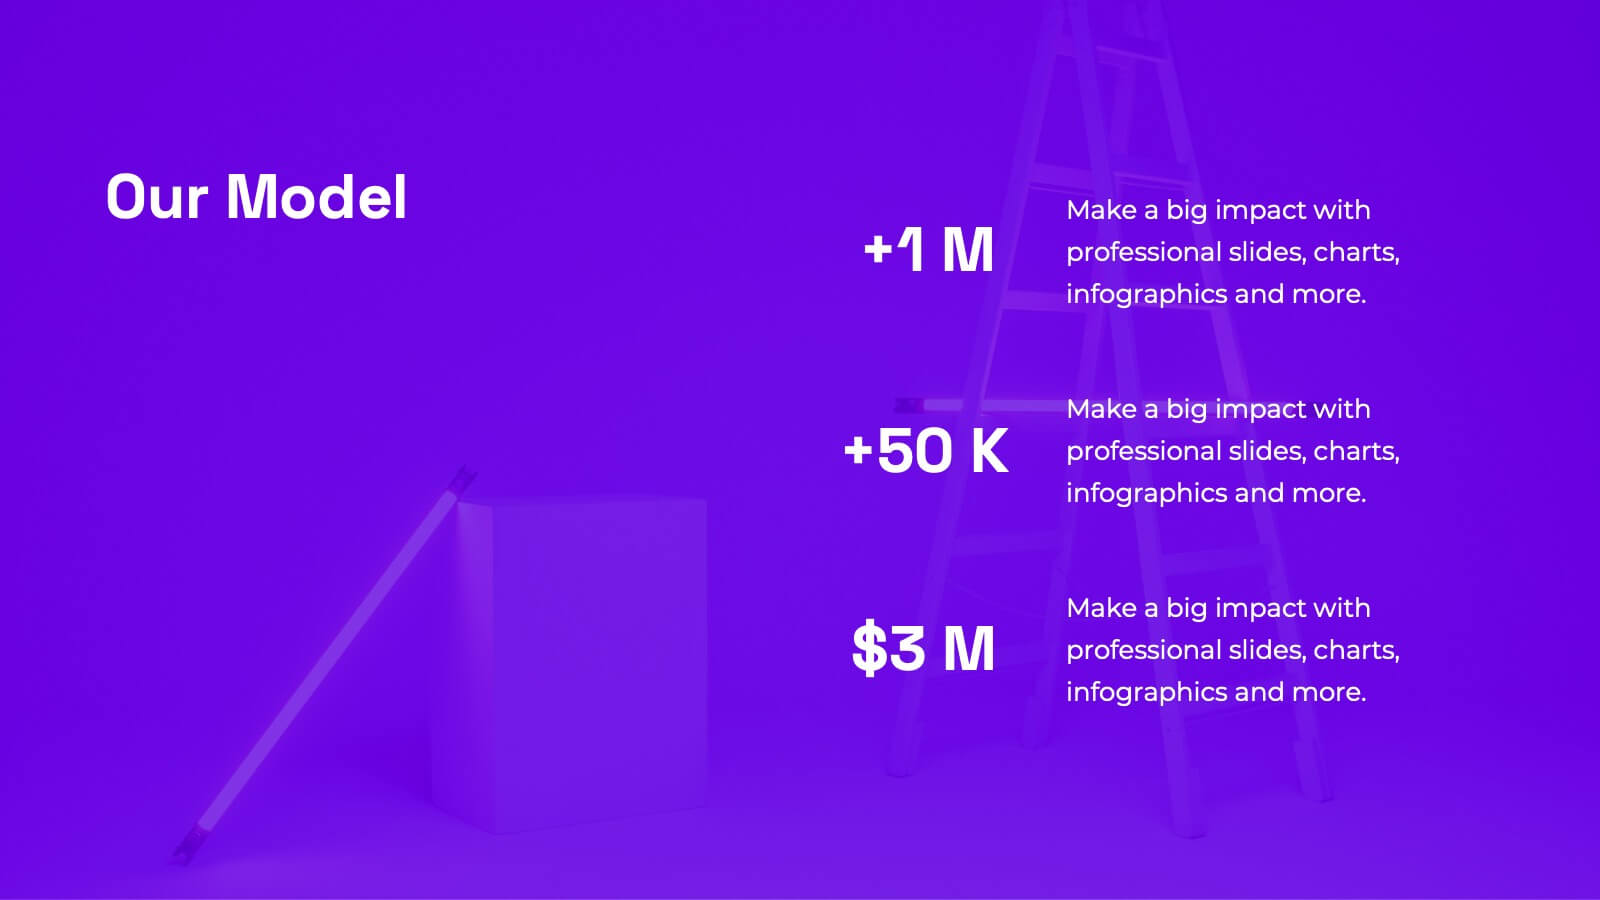
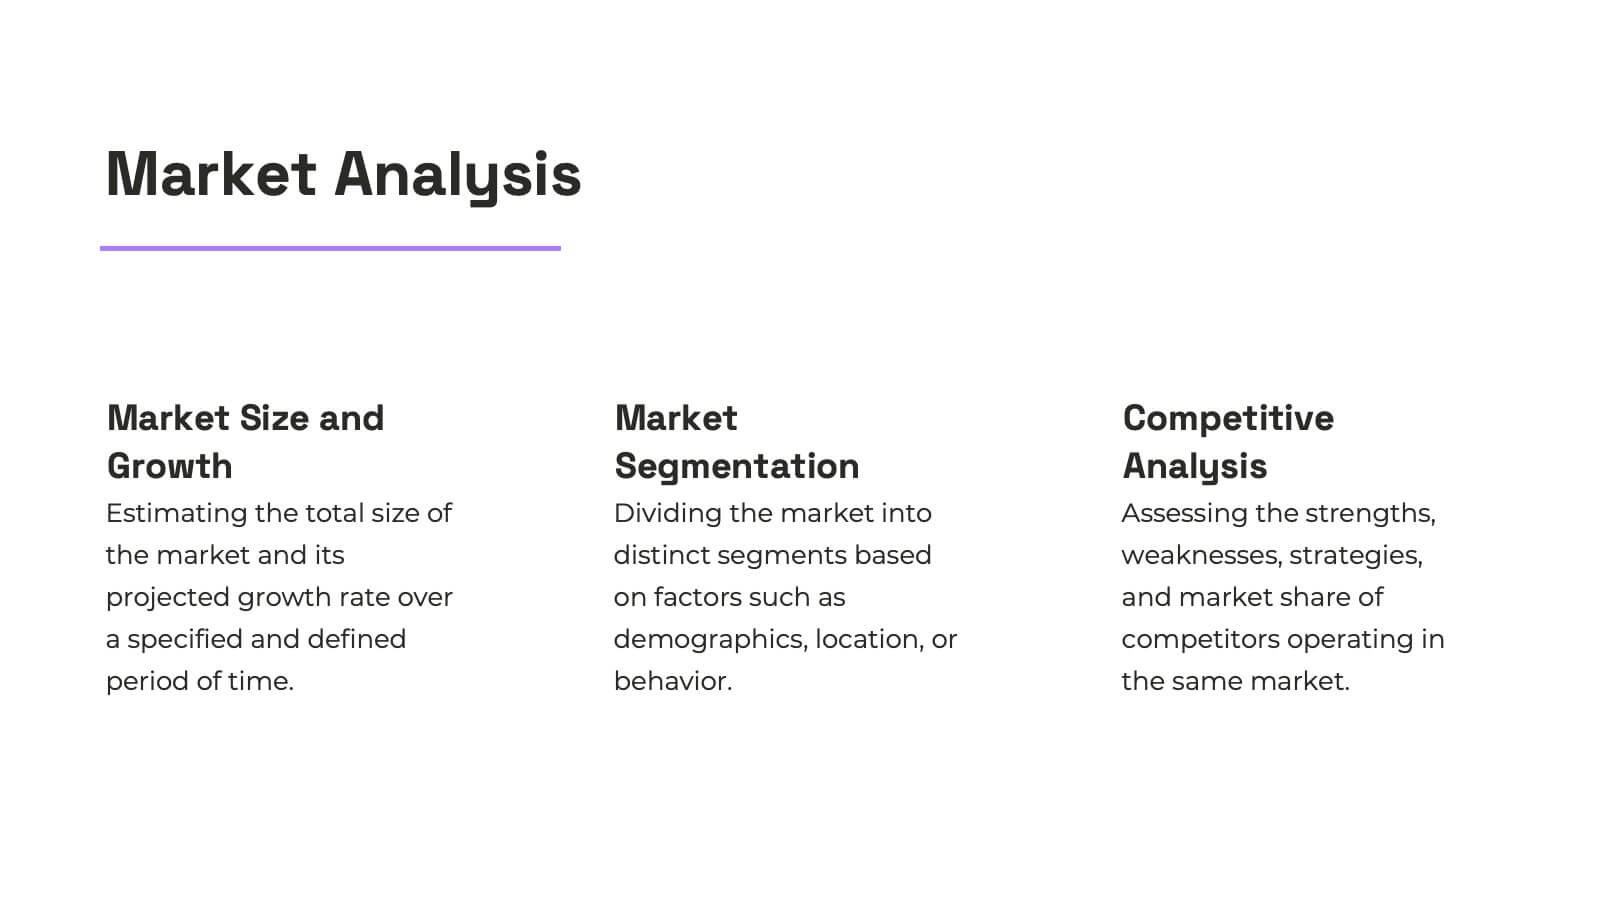
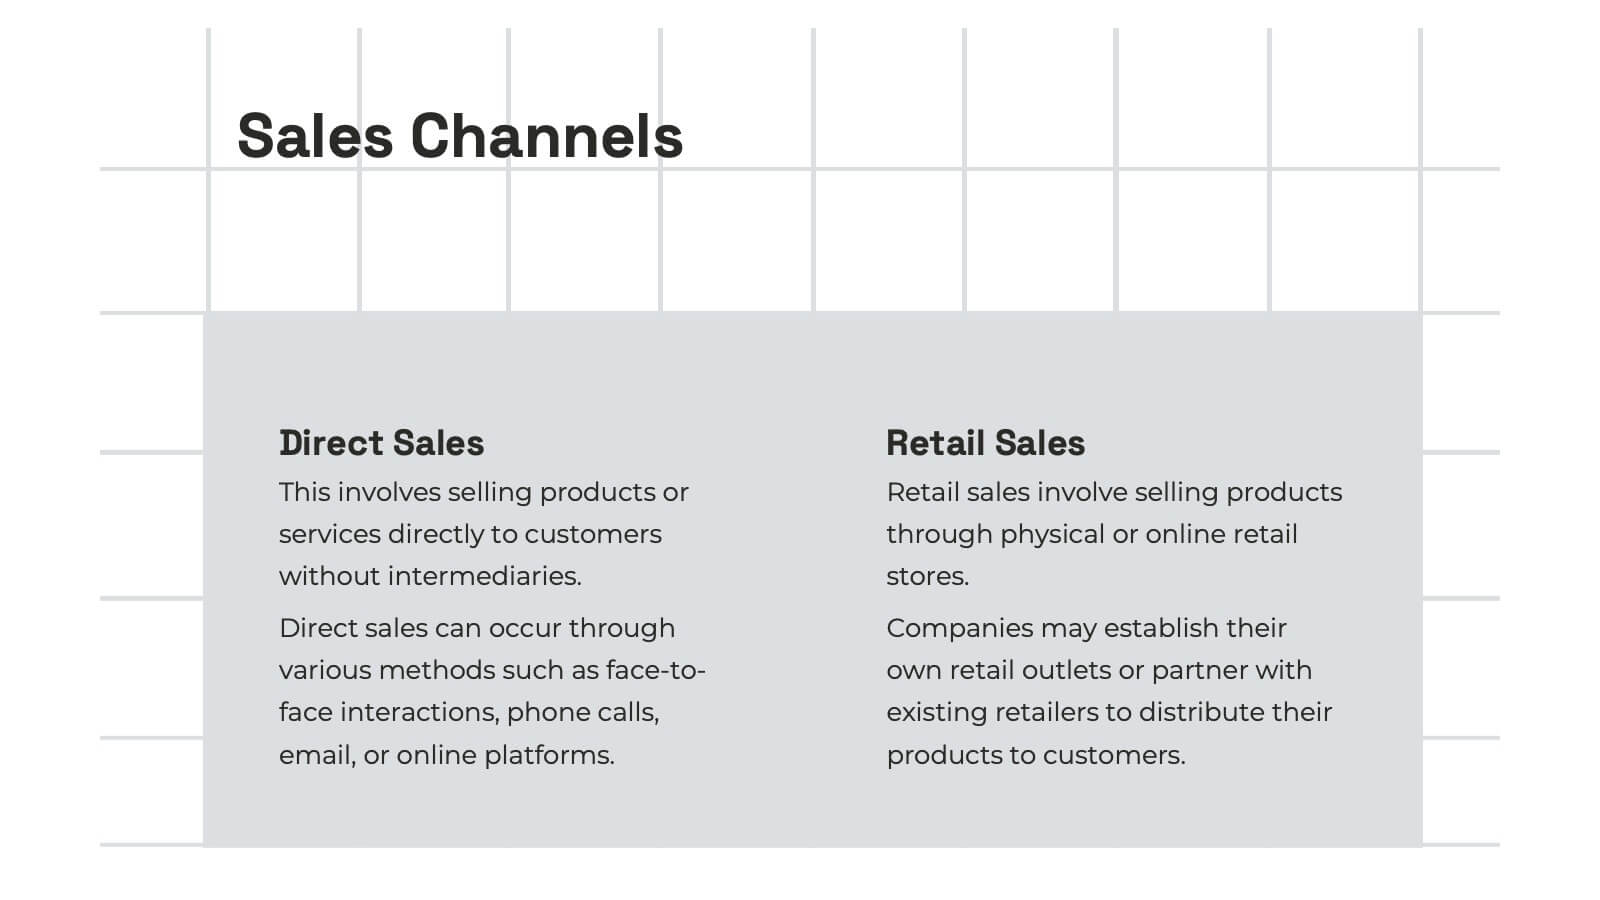
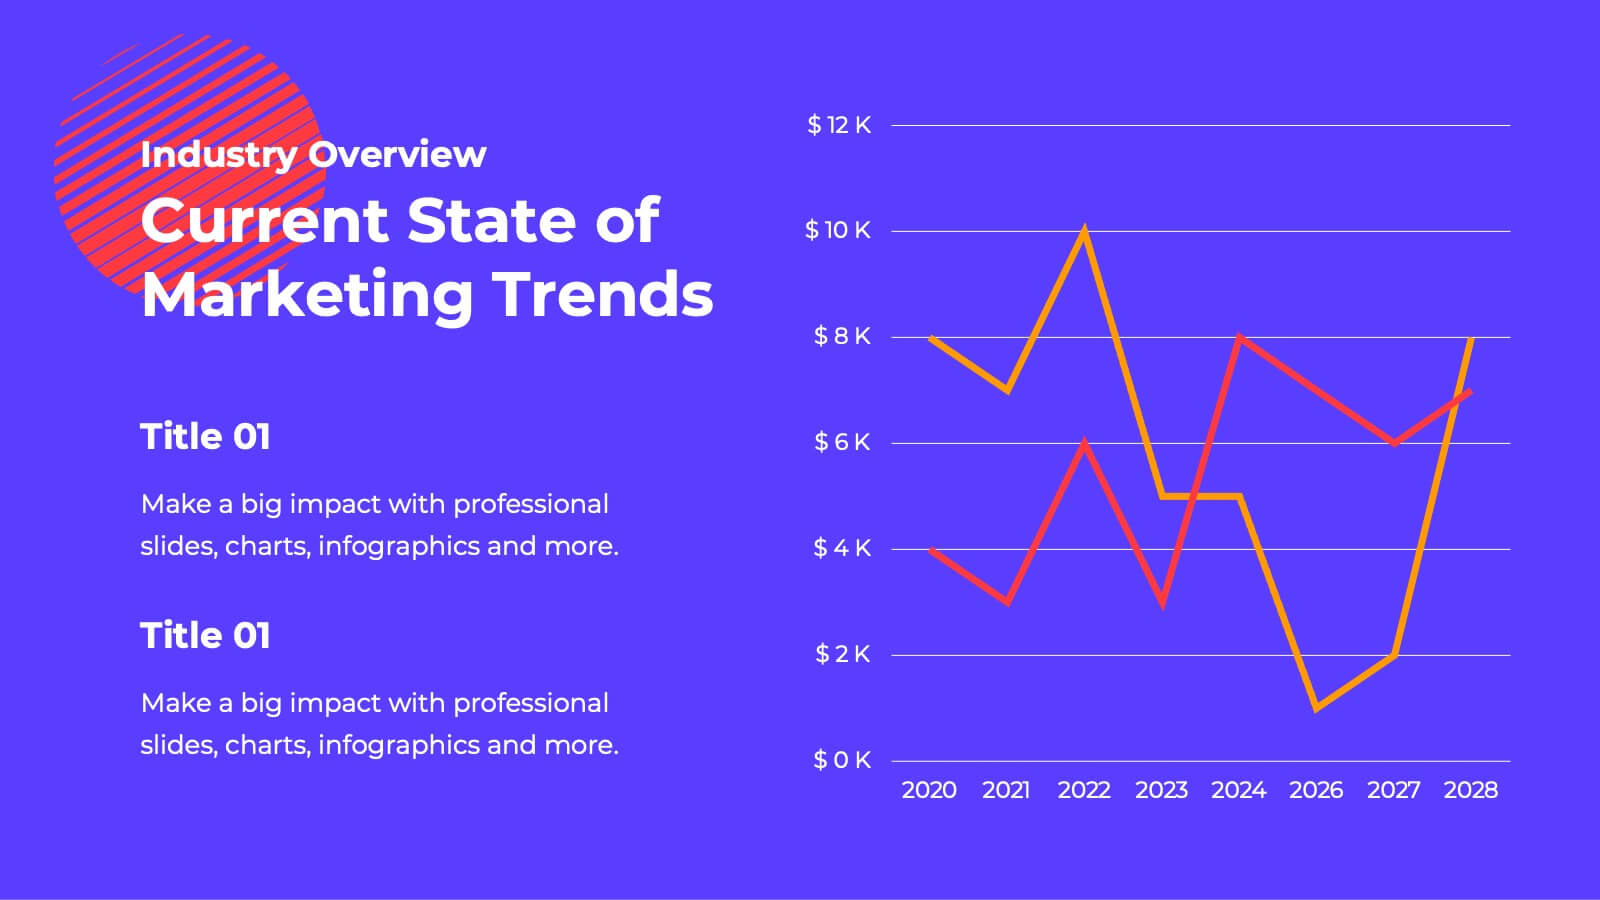
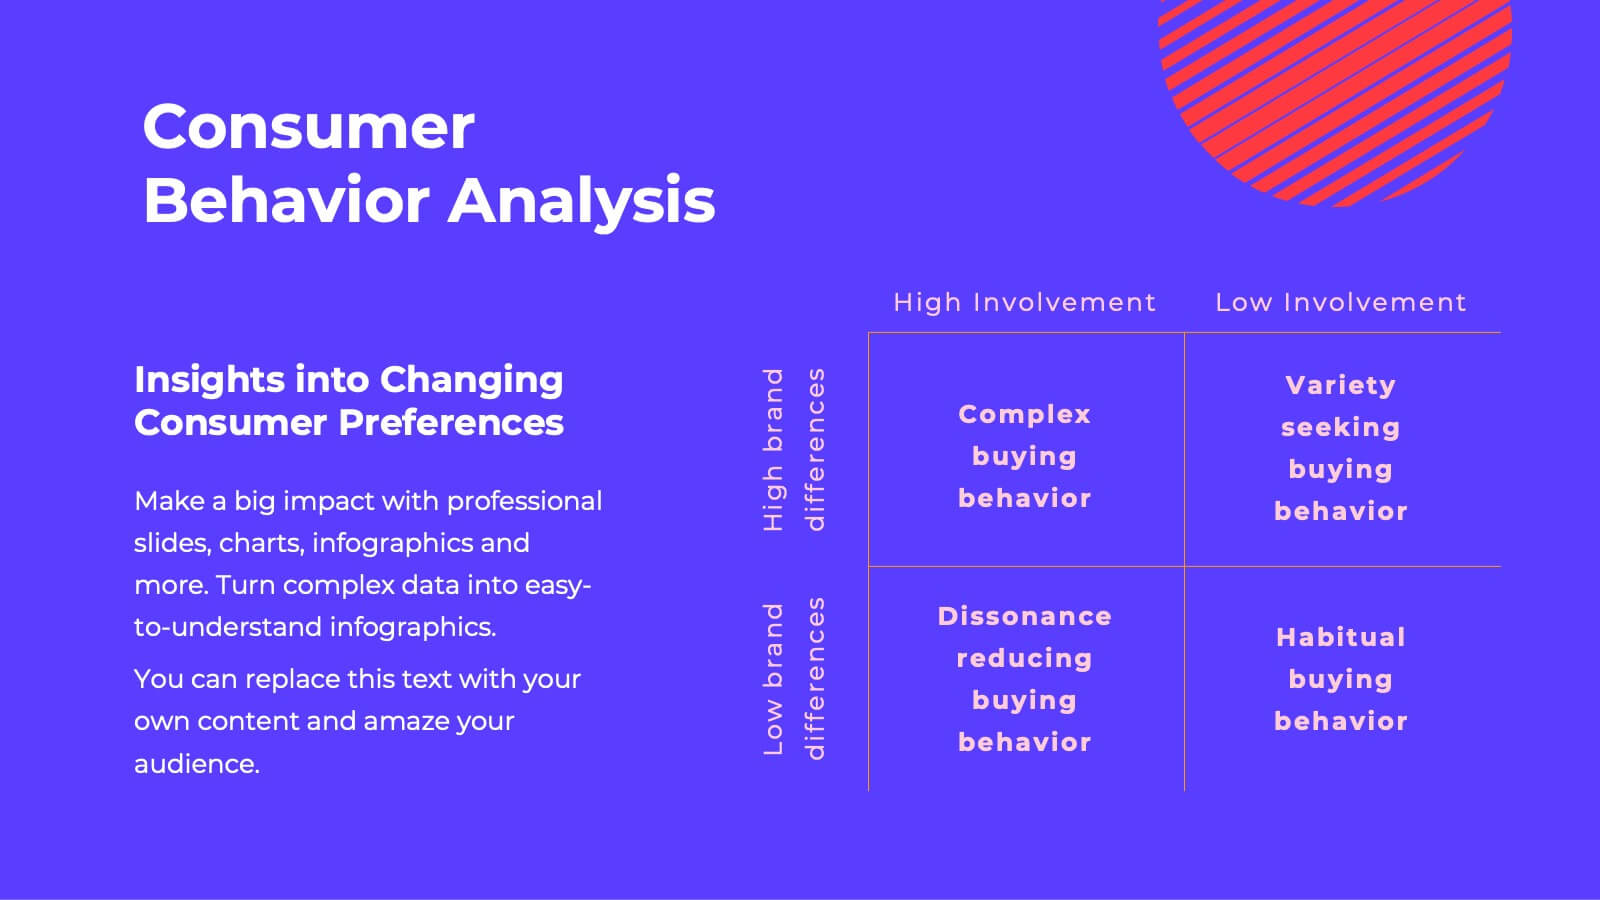
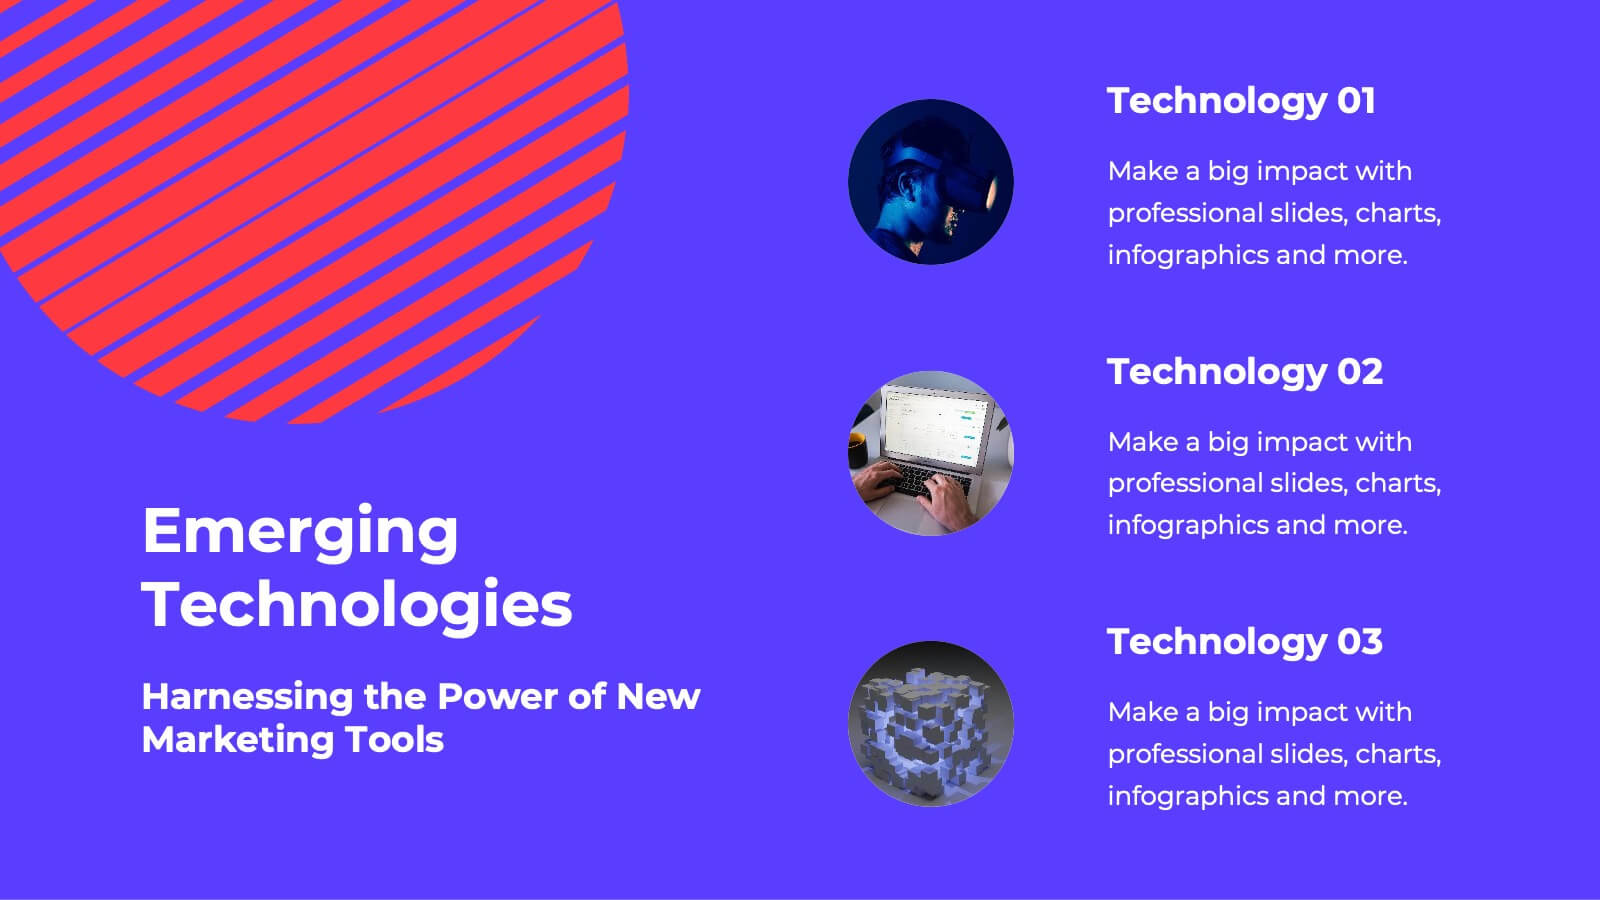
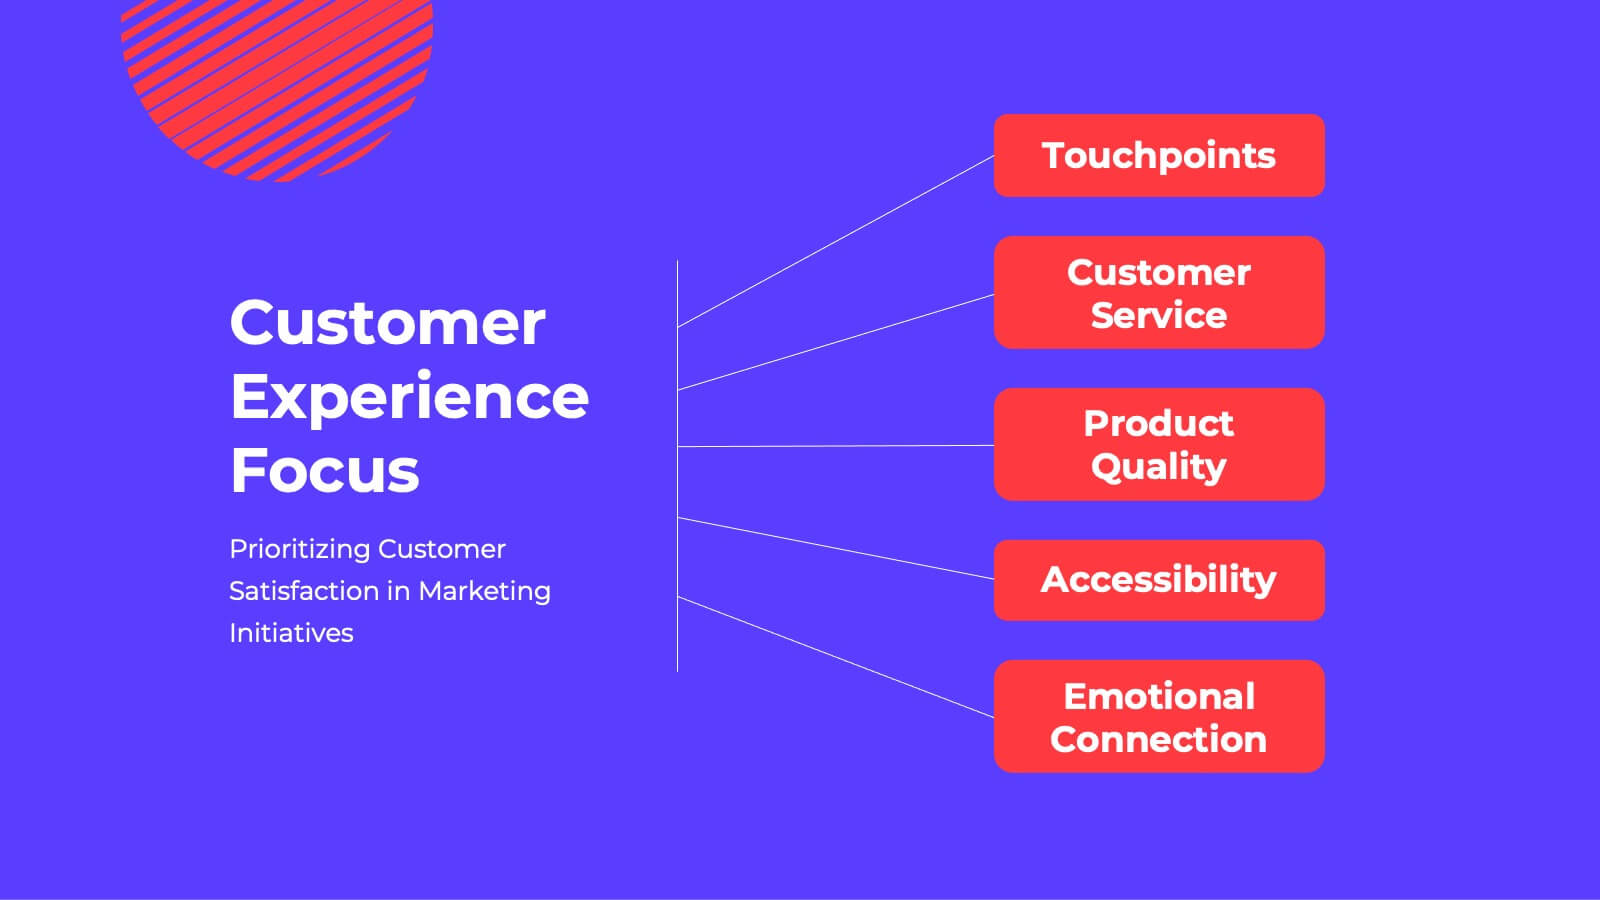
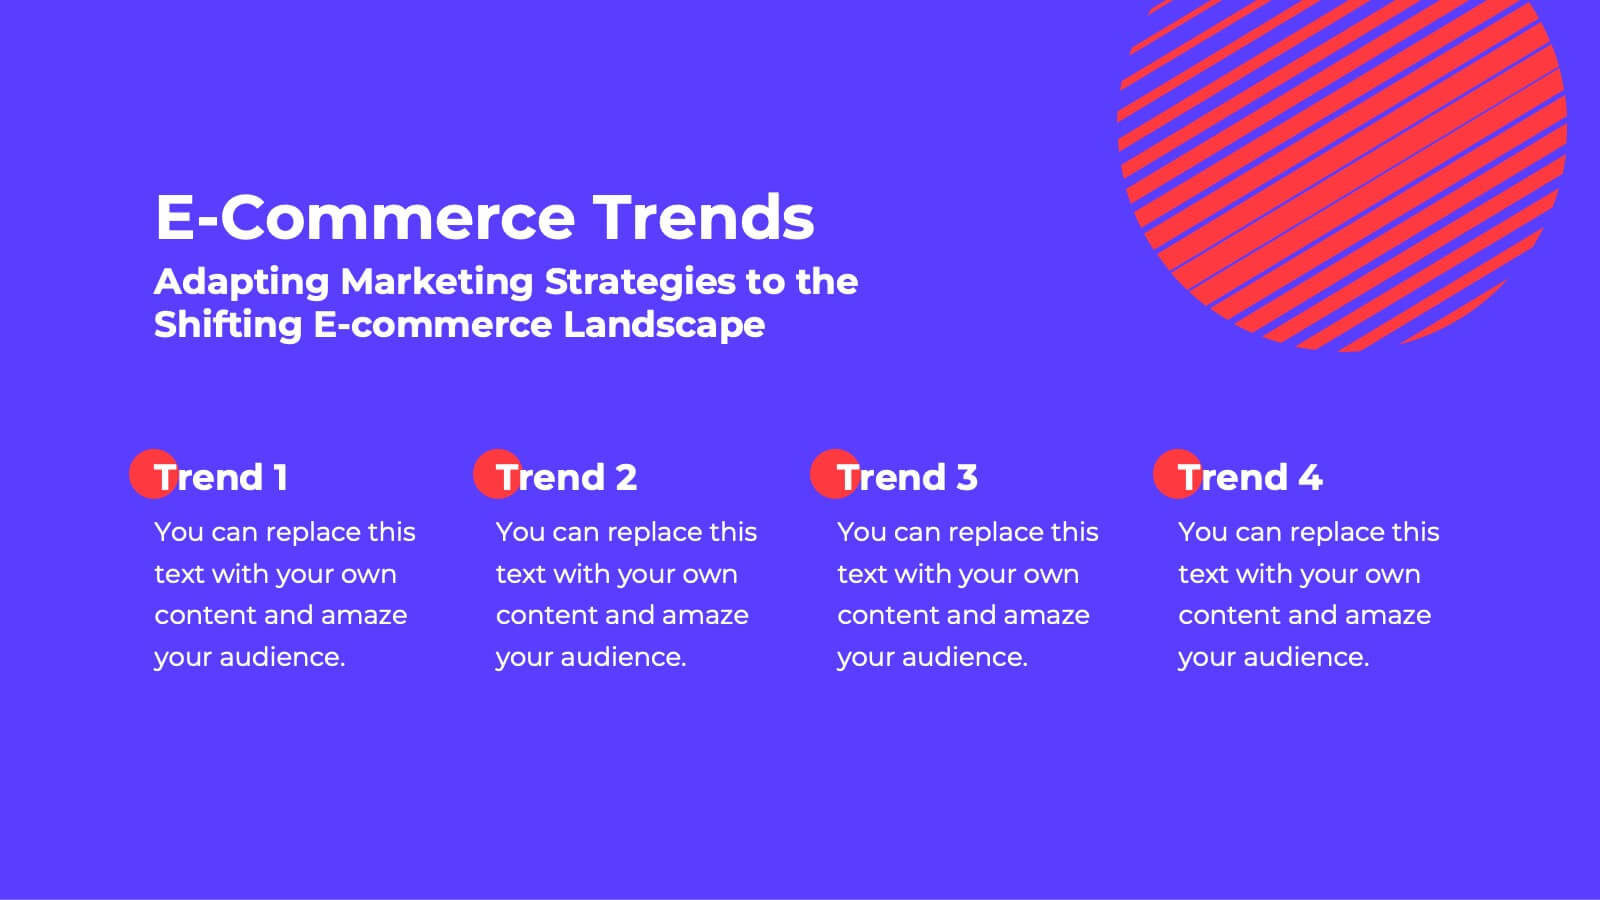
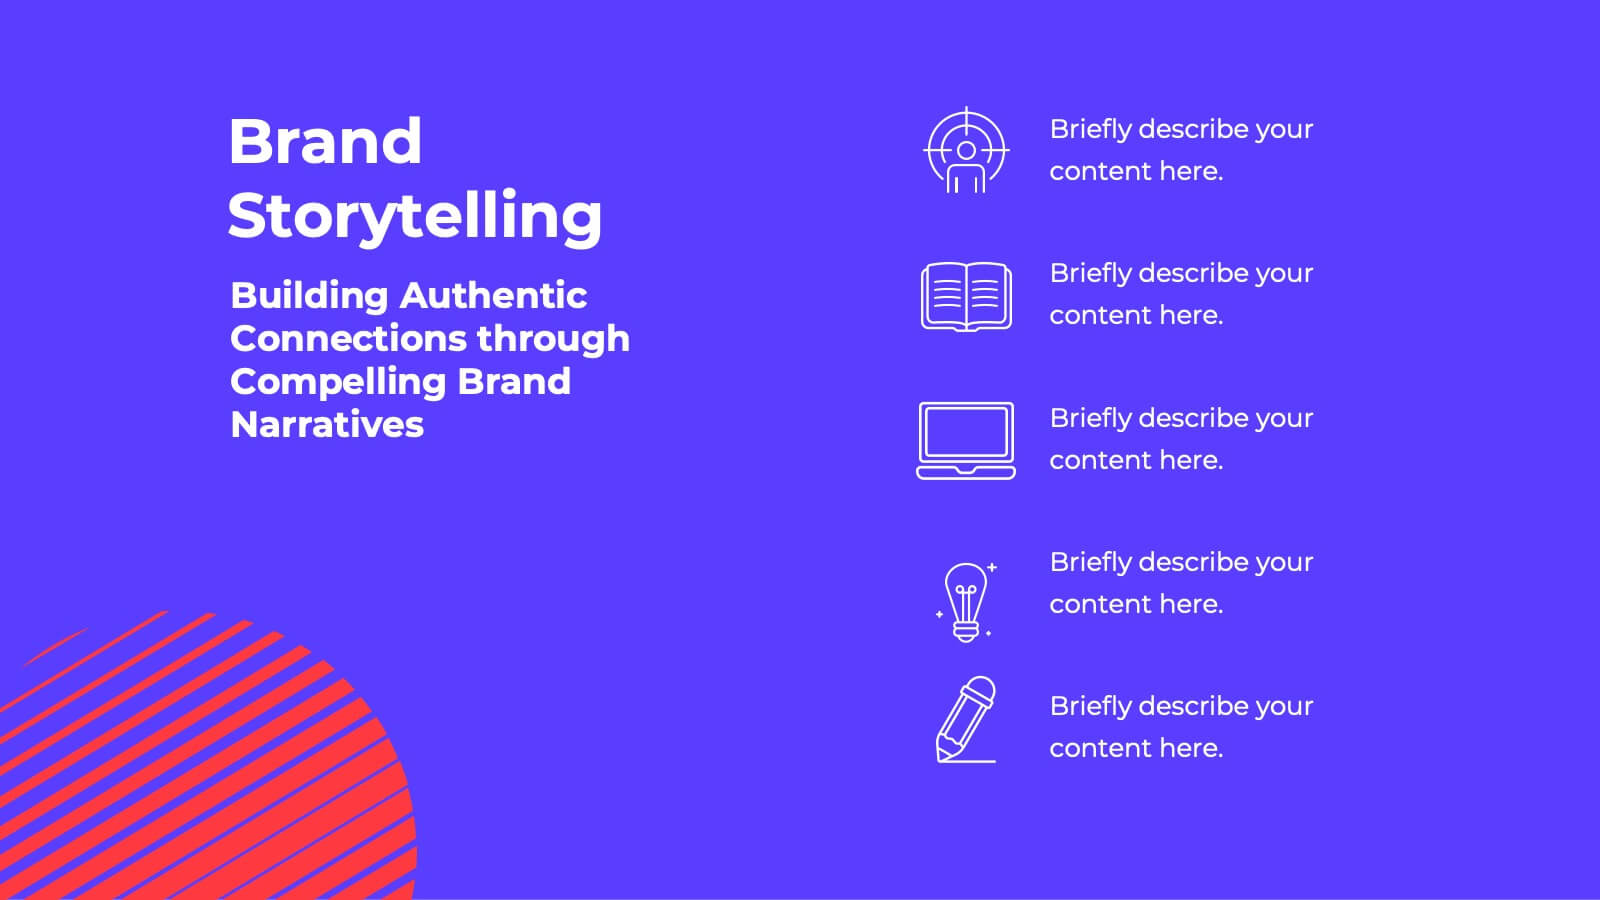
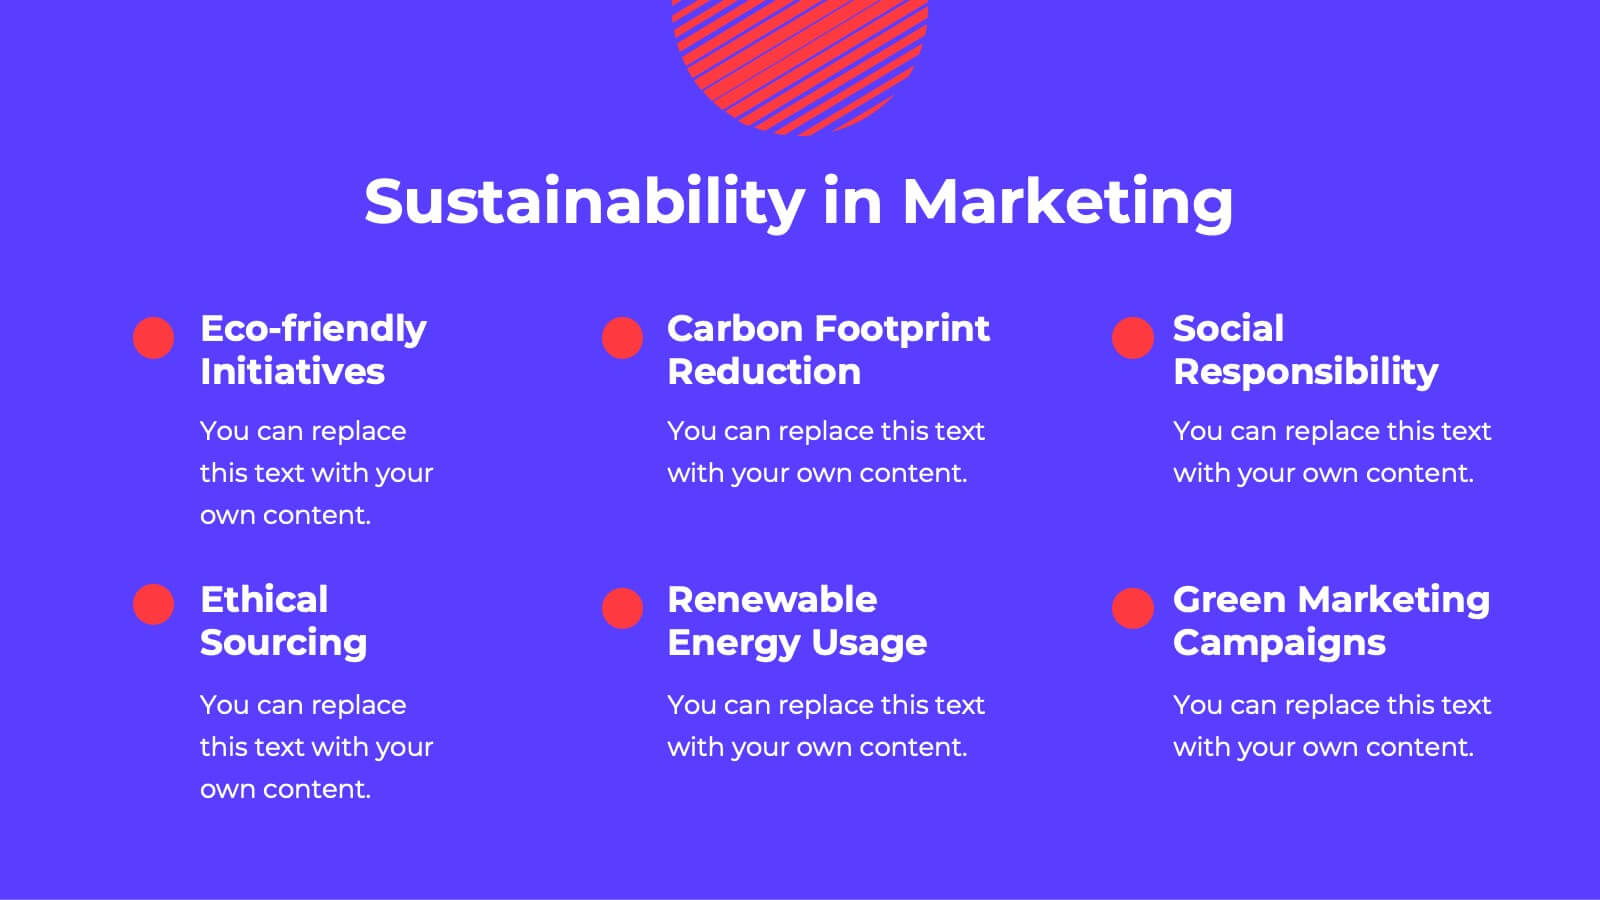
Title Hierarchy Infographic
The collection of slides is designed to efficiently convey key themes with a striking visual appeal, ensuring that crucial topics are presented with clarity and emphasis. Each slide utilizes bold typography and a unique color palette to draw attention and maintain viewer engagement. The designs incorporate dynamic shapes and minimalist layouts, enhancing the presentation's readability while emphasizing important content. This set is ideal for professionals aiming to present complex ideas in a clear and memorable way during meetings or in corporate documents. It supports various communicative goals, such as introducing concepts, outlining challenges, or promoting organizational initiatives, making it a versatile tool for enhancing message delivery in any professional setting.

20 diapositivas
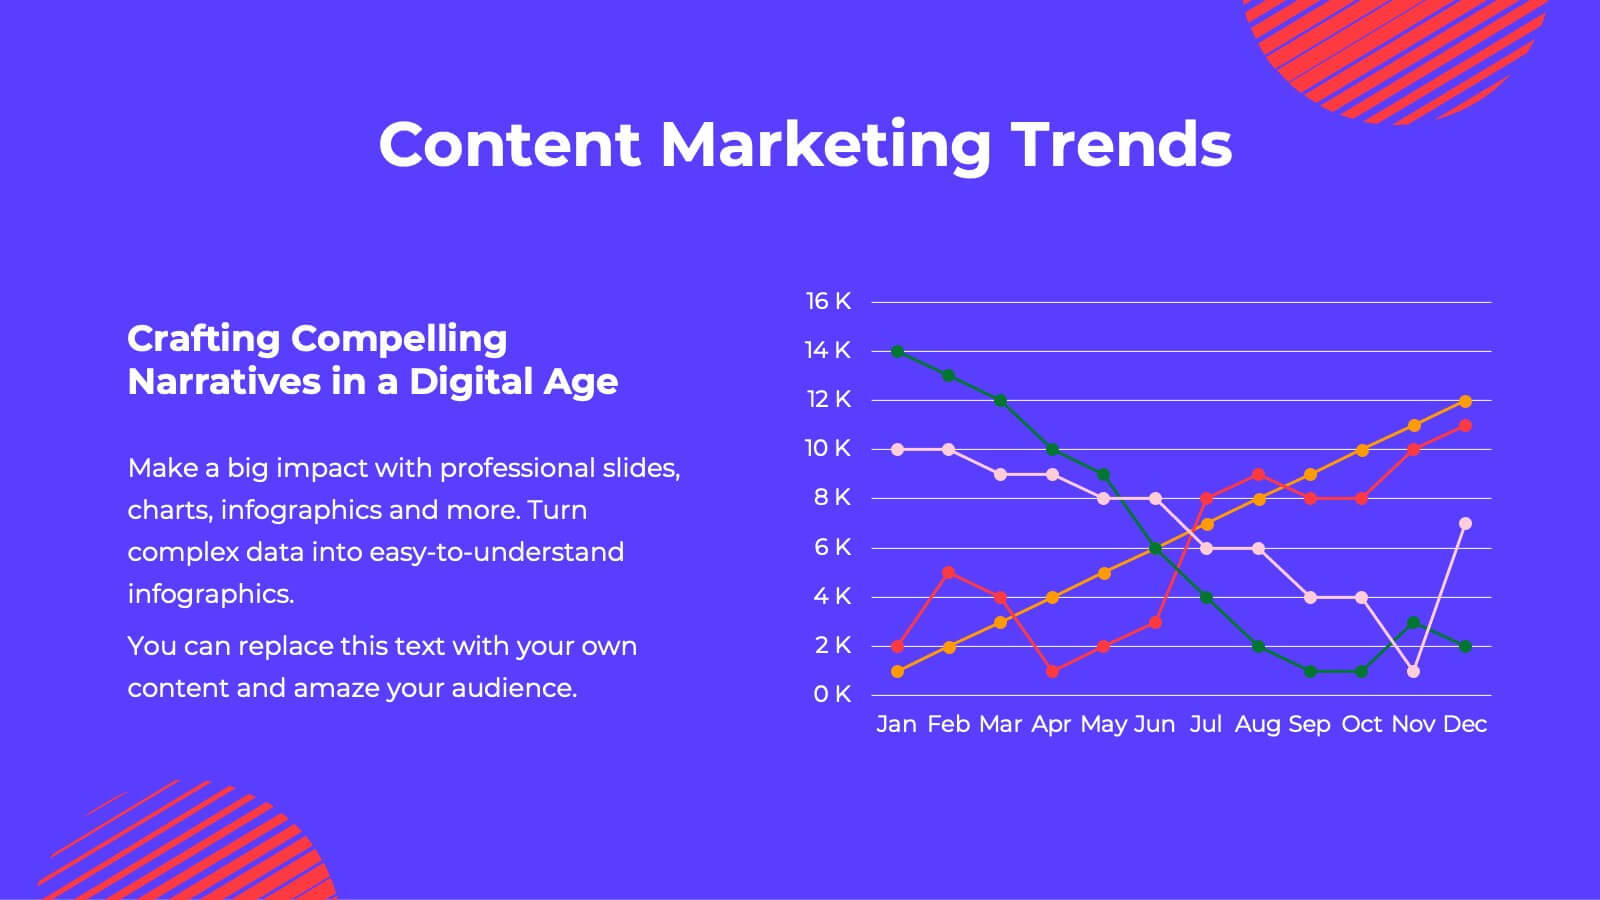
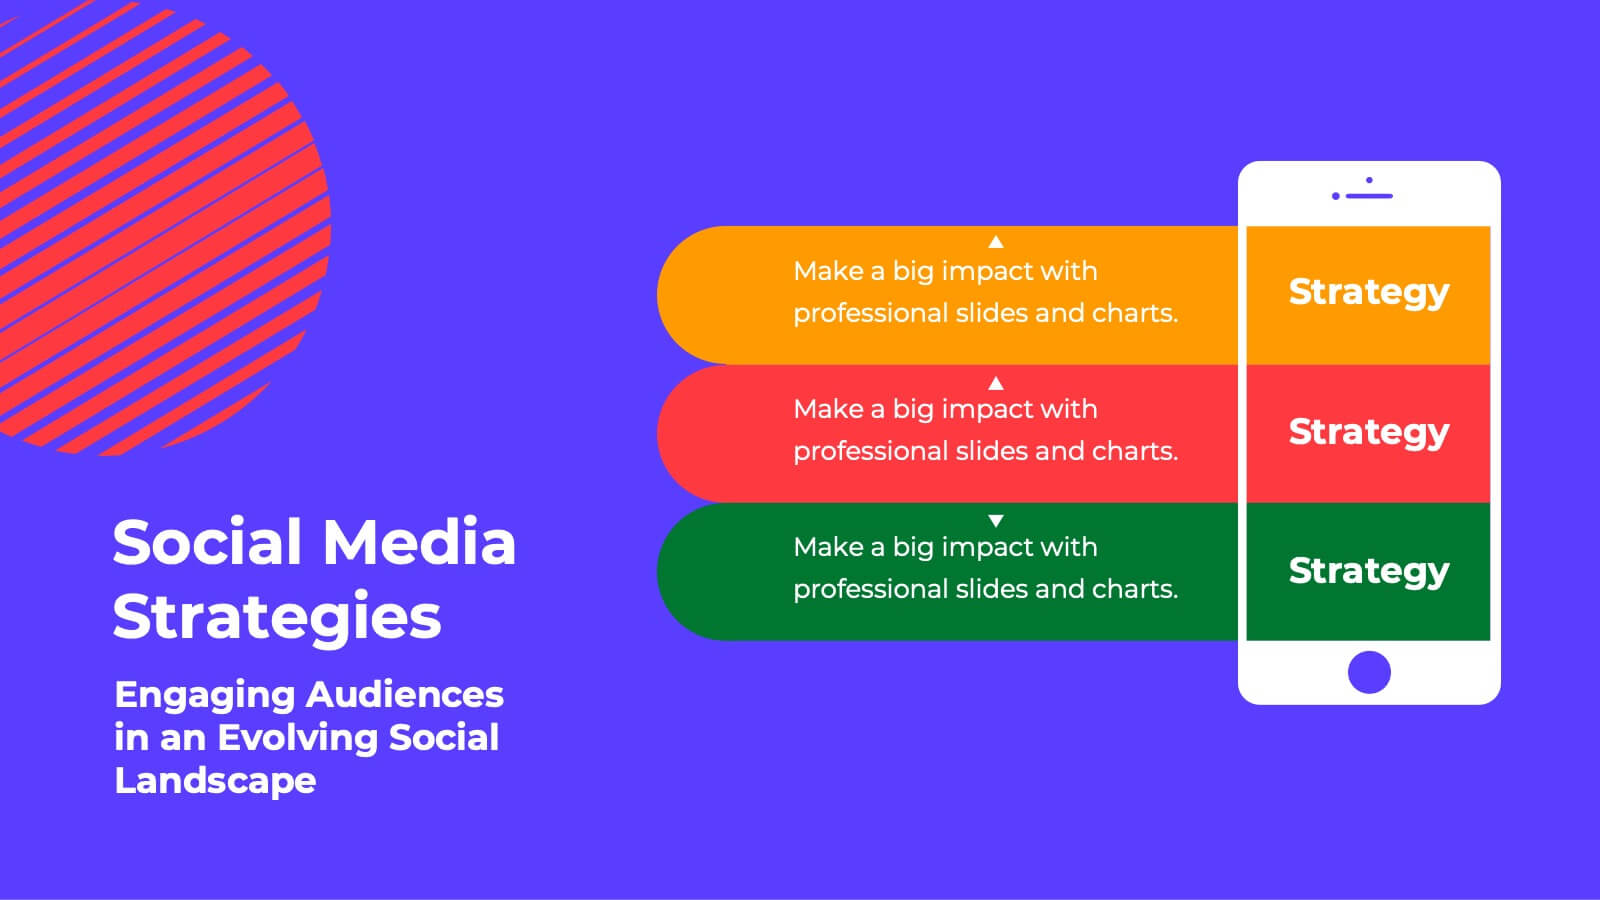
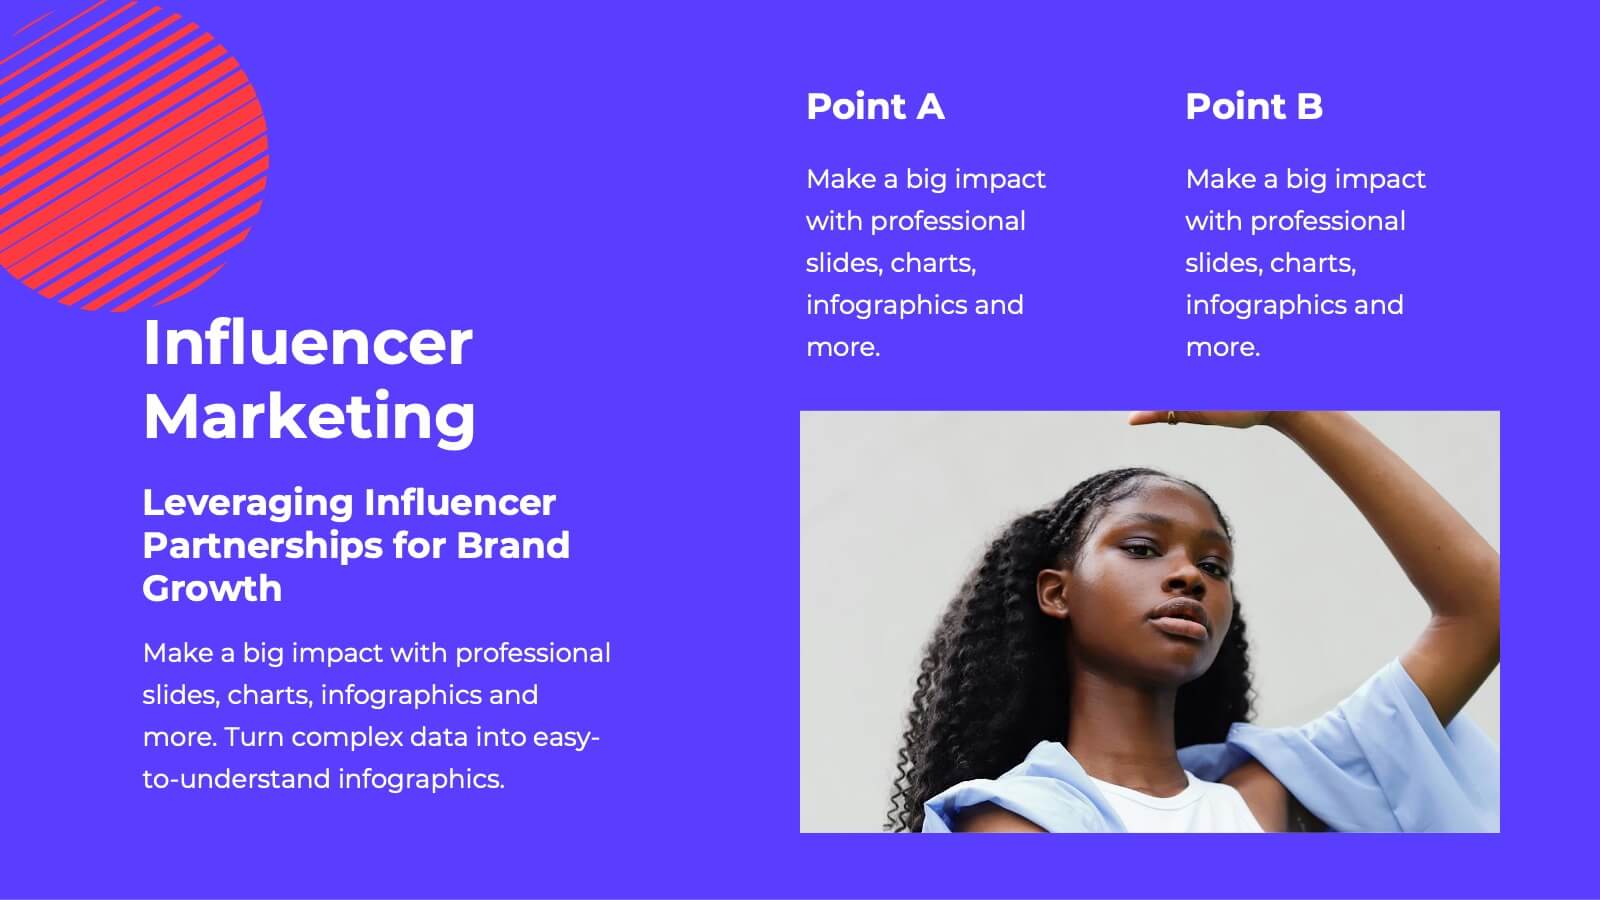
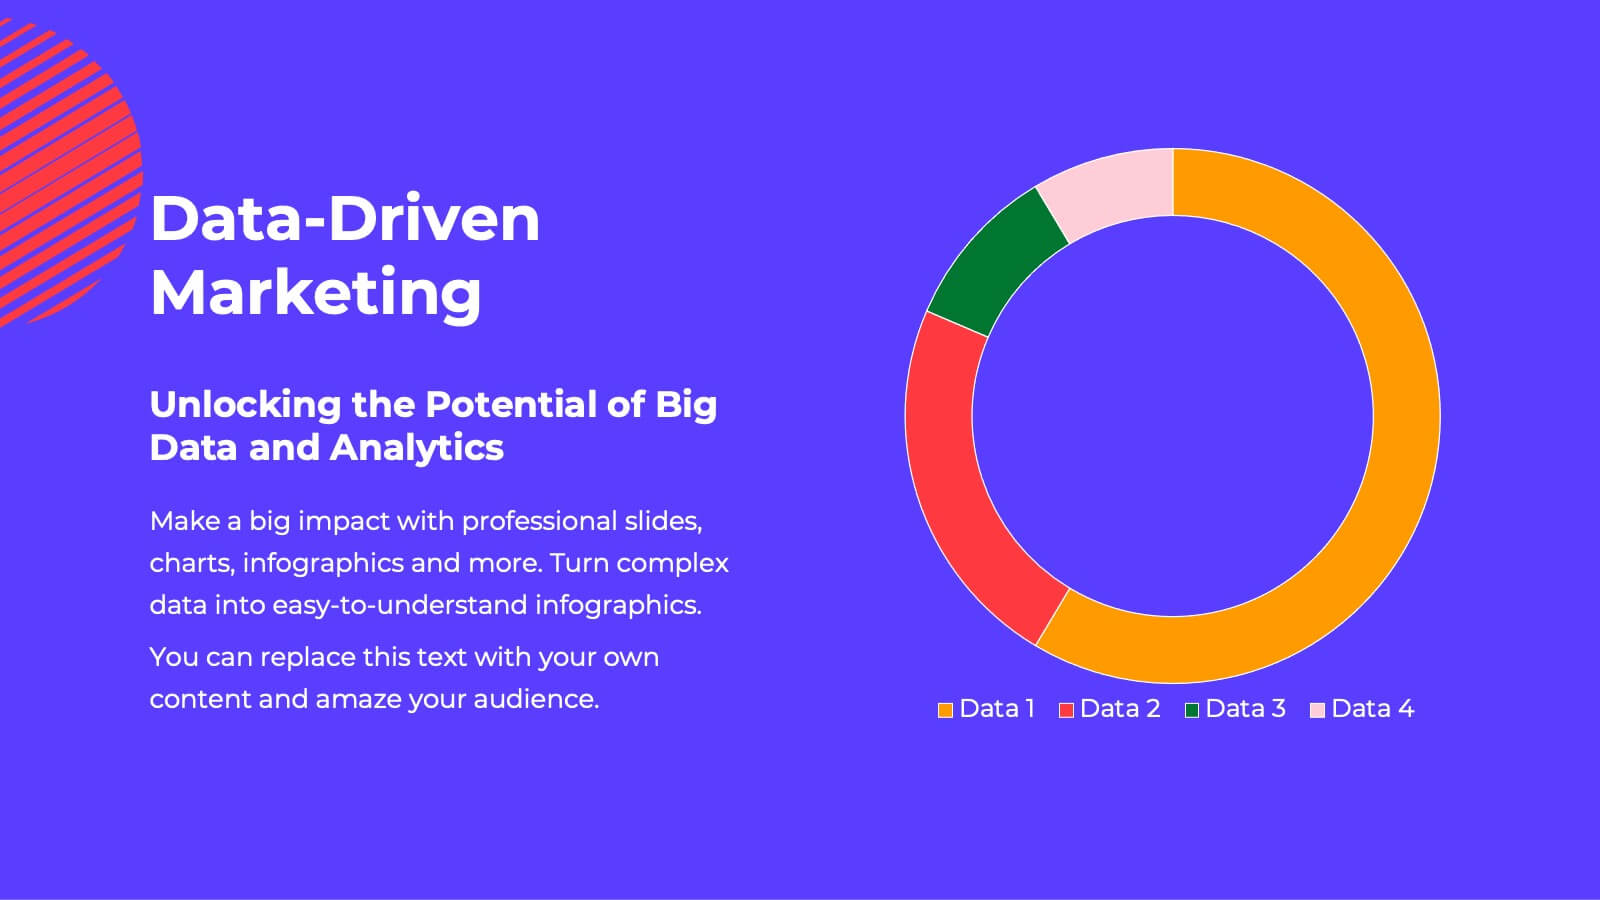
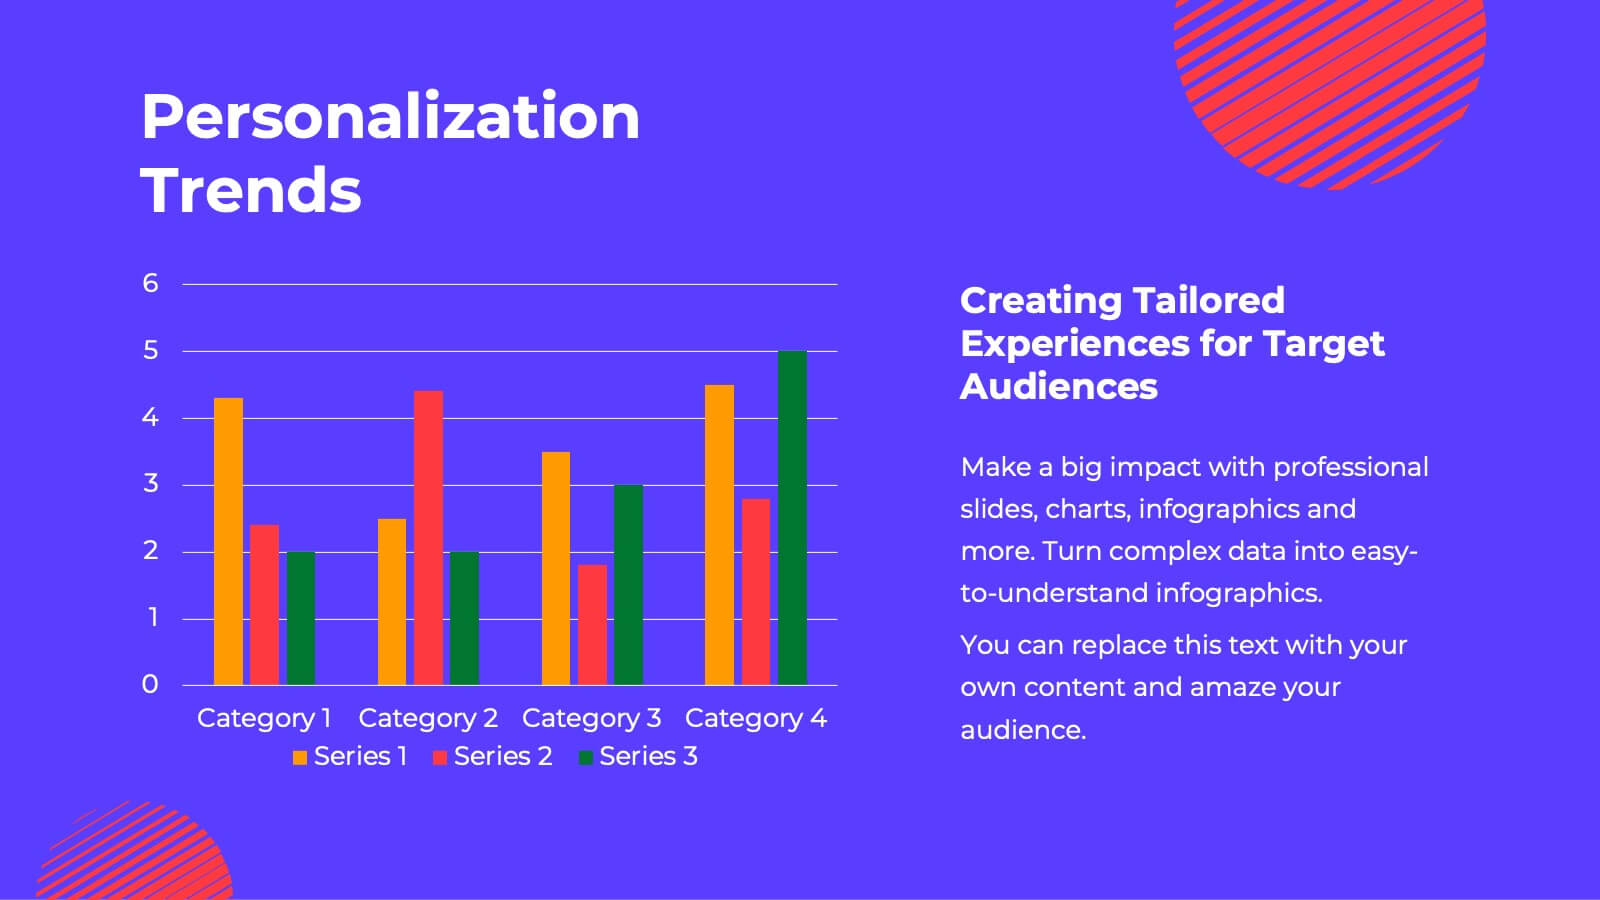
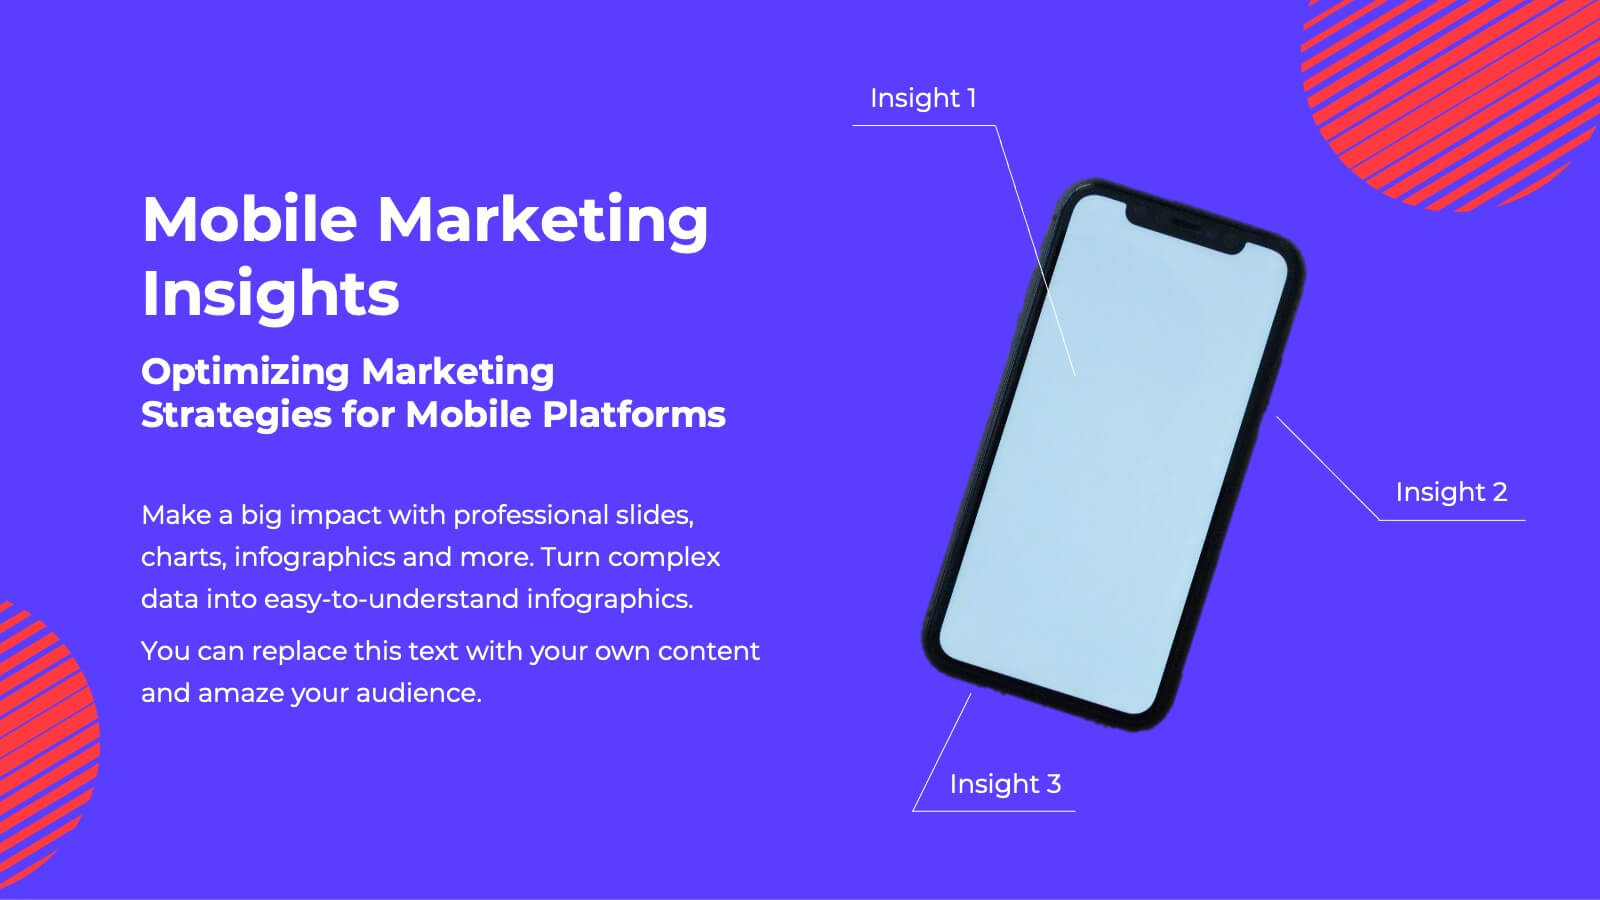
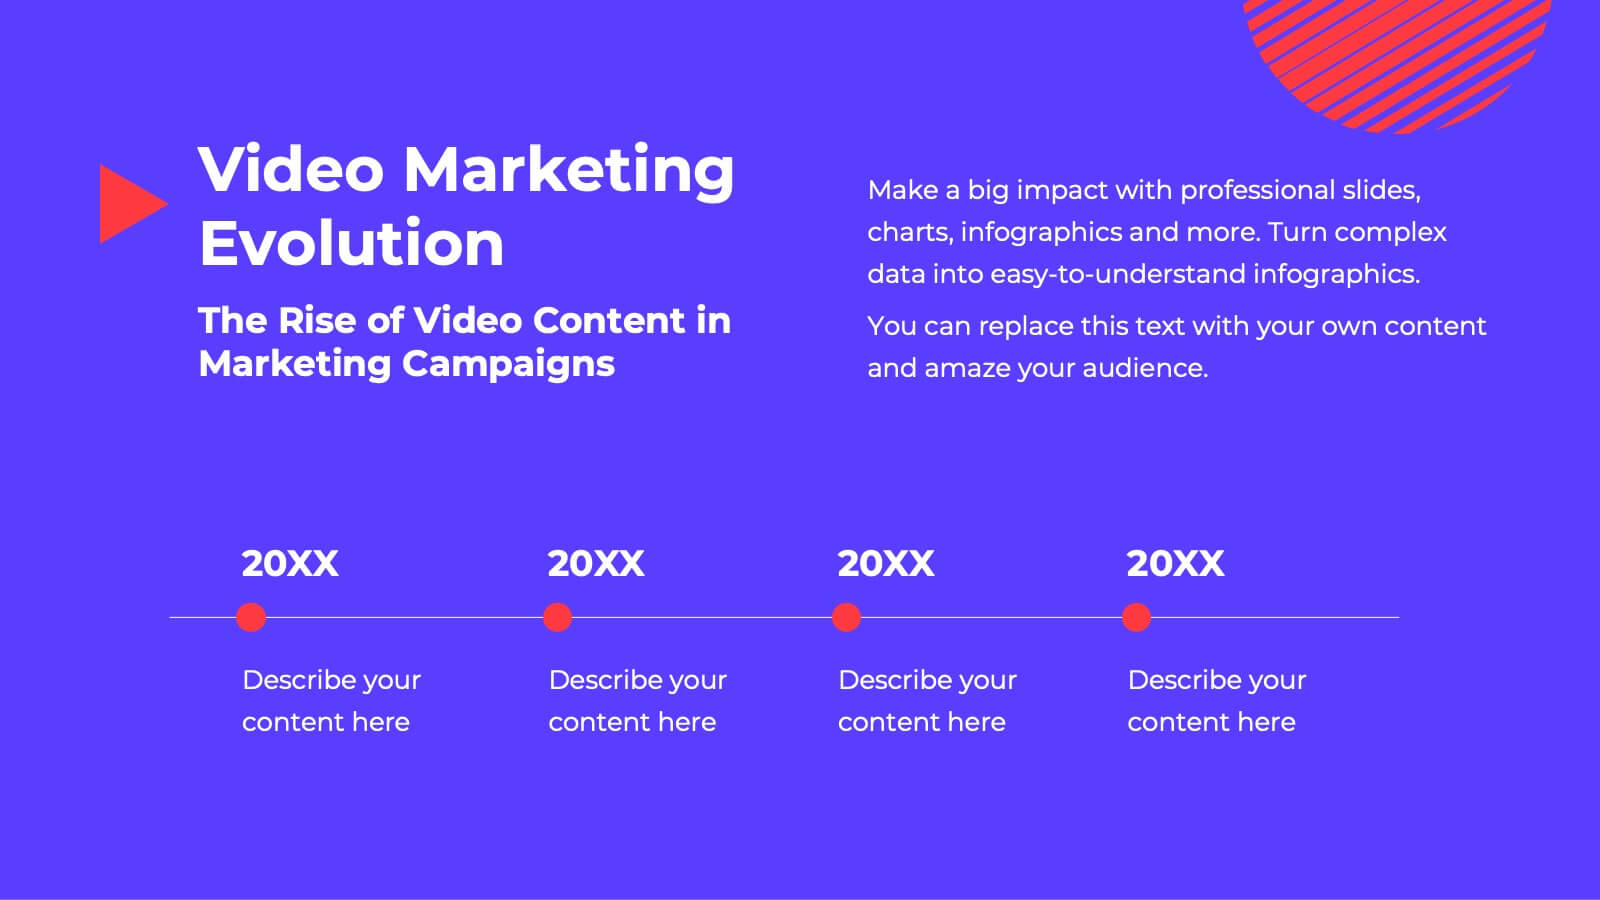
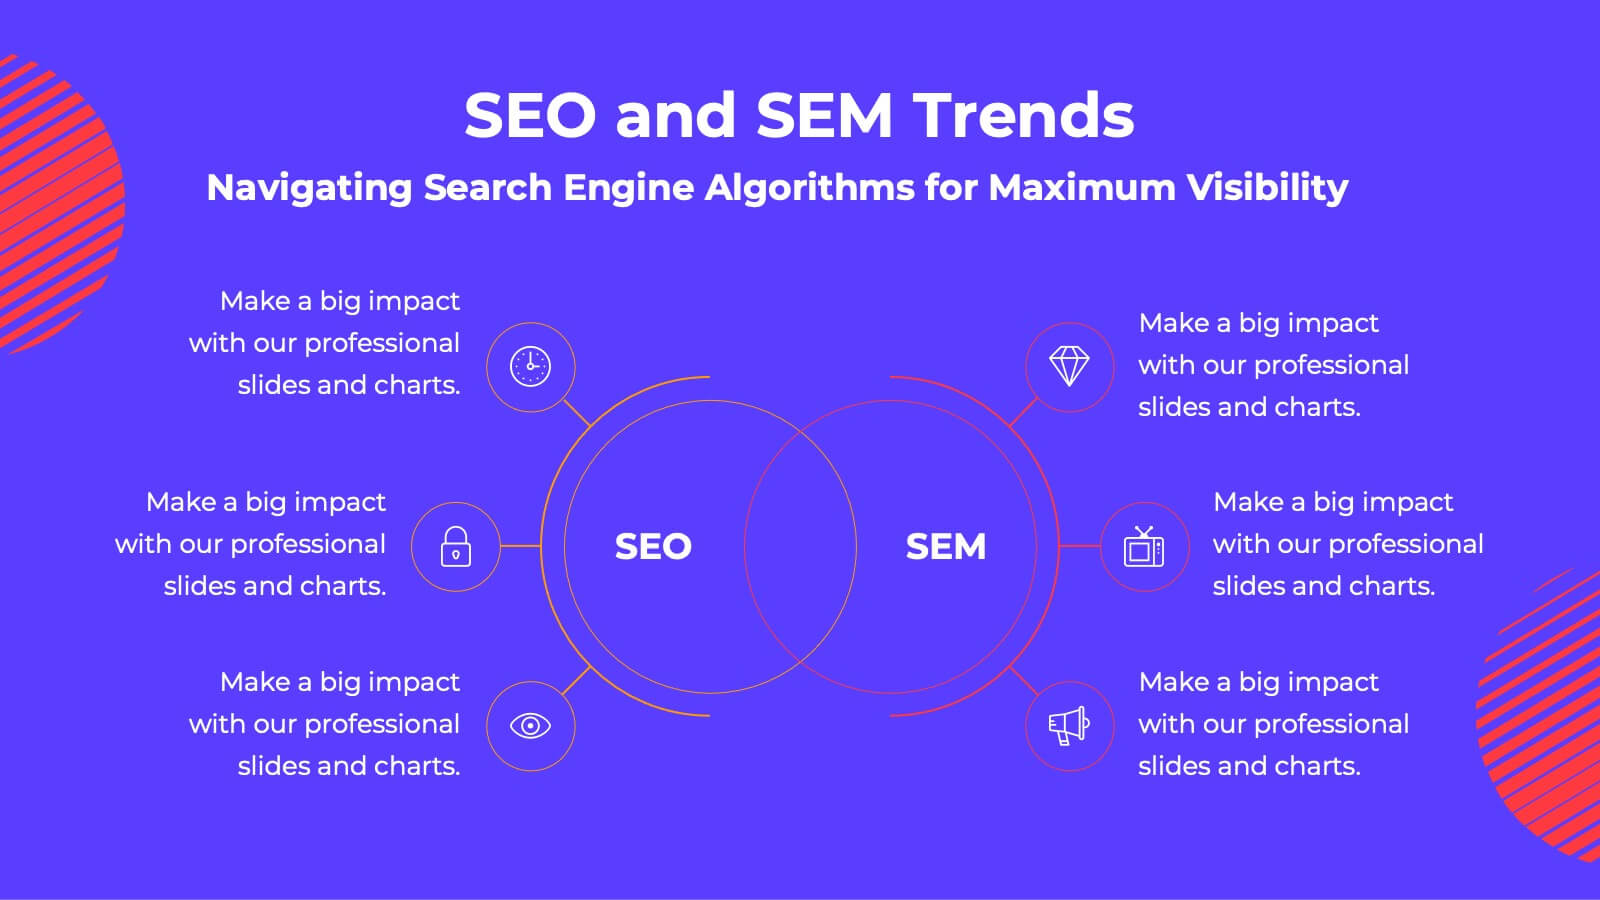
Fusion Marketing Campaign Presentation
Unleash the power of your marketing campaigns with this vibrant marketing campaign template! Dive into social media strategies, influencer marketing, data-driven insights, and more. Perfect for presenting to stakeholders and team members. Fully customizable and compatible with PowerPoint, Keynote, and Google Slides.


5 diapositivas
Operational Process Logic Map
Visualize how every function interconnects with the Operational Process Logic Map Presentation. This template uses a radial node structure to break down workflows, responsibilities, or systems into logical clusters, showing how different units or steps interact within an operational framework. Each node is color-coded and icon-marked for clarity, ideal for explaining process flows, department roles, or system dependencies. Fully editable in PowerPoint, Keynote, and Google Slides.


7 diapositivas
Business Process in Step-by-Step Presentation
Streamline operations with the Business Process in Step-by-Step presentation. This structured template breaks down complex workflows into clear, actionable steps, enhancing clarity and decision-making. Perfect for project planning, strategy execution, and workflow optimization. Fully customizable in PowerPoint, Keynote, and Google Slides for seamless presentation delivery.