


Características


¿Tienes alguna pregunta?
Recomendar


6 diapositivas
Business Milestone Timeline Presentation
Showcase key achievements and future goals with the Business Milestone Timeline Presentation. This visually engaging template allows you to highlight crucial company events, project phases, or strategic plans in a clear, structured format. Ideal for corporate reporting, business growth tracking, and investor presentations. Fully customizable and compatible with PowerPoint, Keynote, and Google Slides.


7 diapositivas
Bowtie Risk Management Diagram Presentation
Visualize cause and consequence with a clean, symmetrical flow that simplifies complex risk scenarios. This presentation helps you illustrate threats, controls, and outcomes in one cohesive framework, making decision-making clear and impactful. Fully customizable and compatible with PowerPoint, Keynote, and Google Slides for professional risk analysis presentations.


21 diapositivas
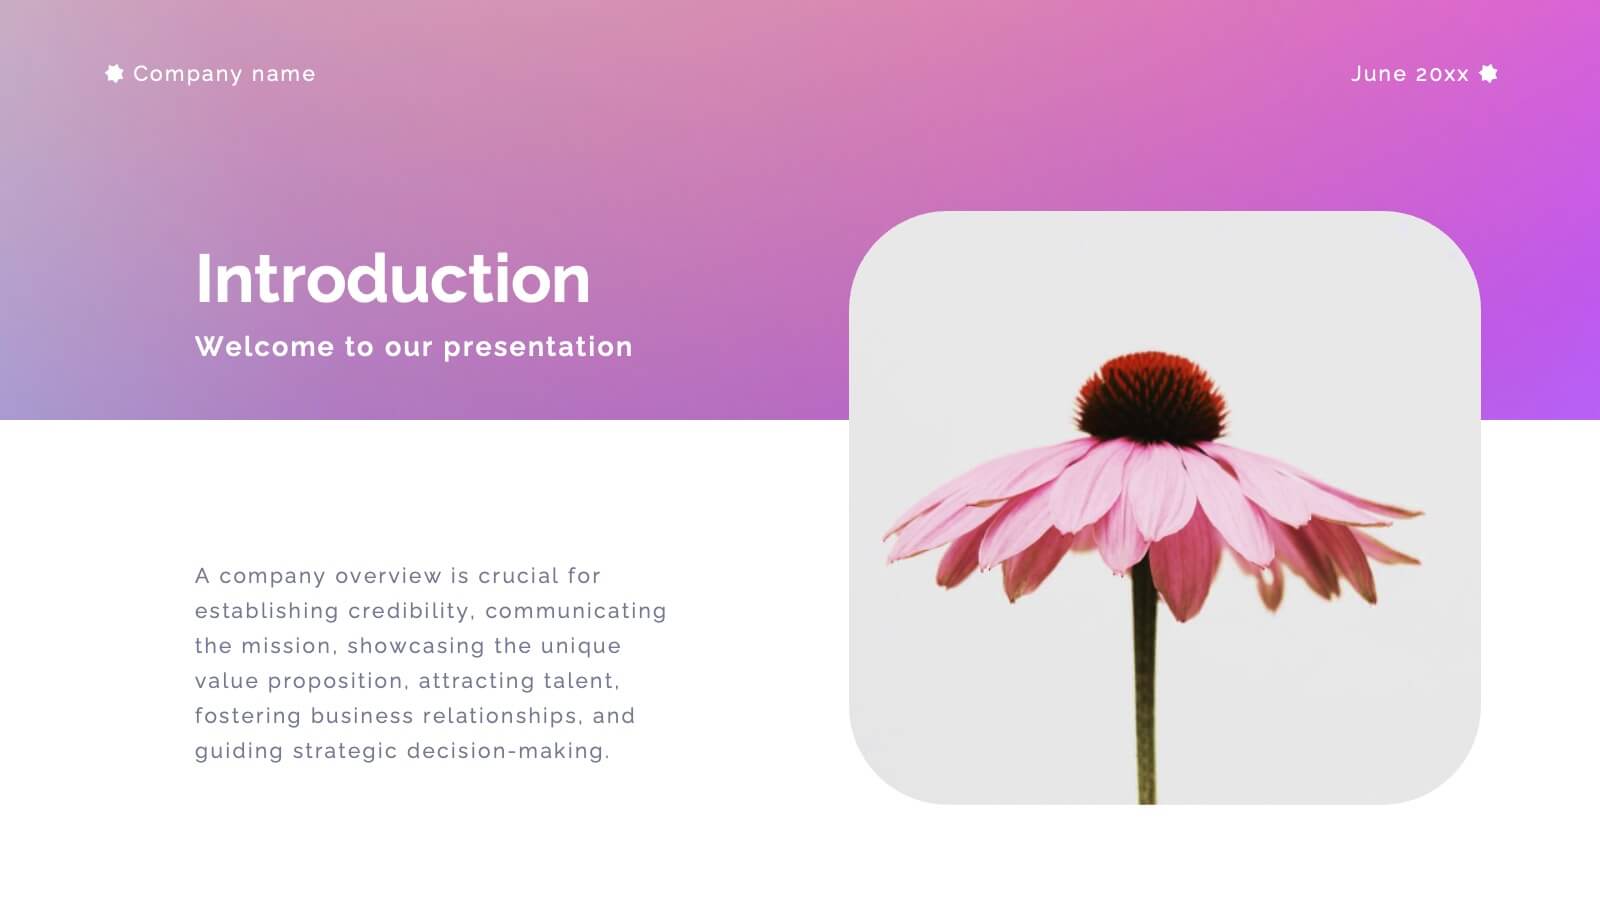
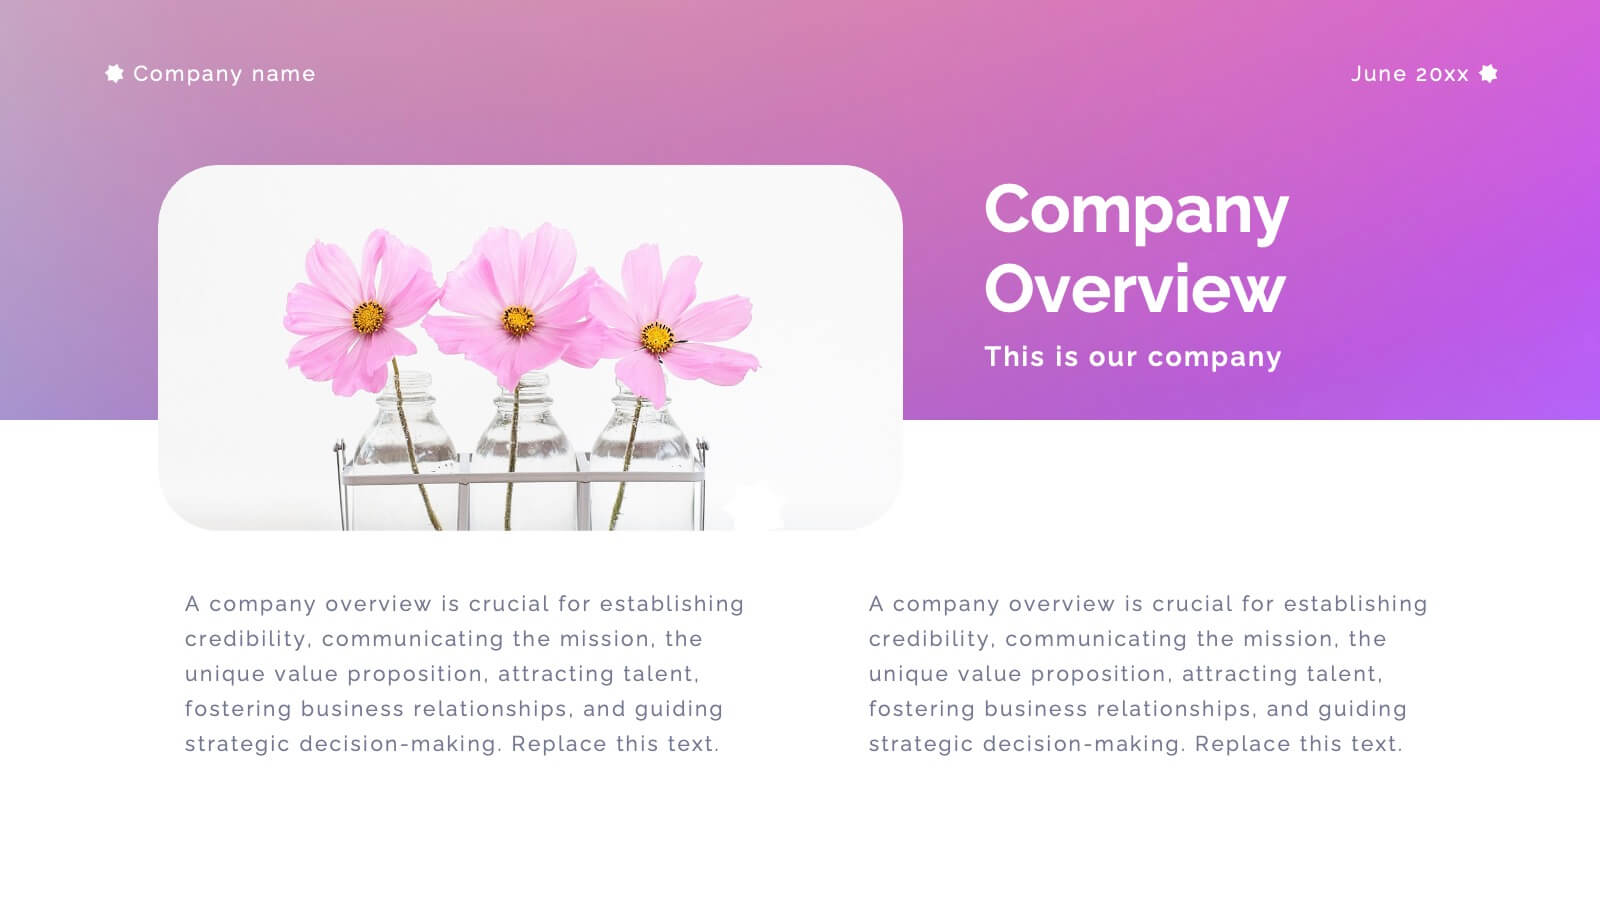
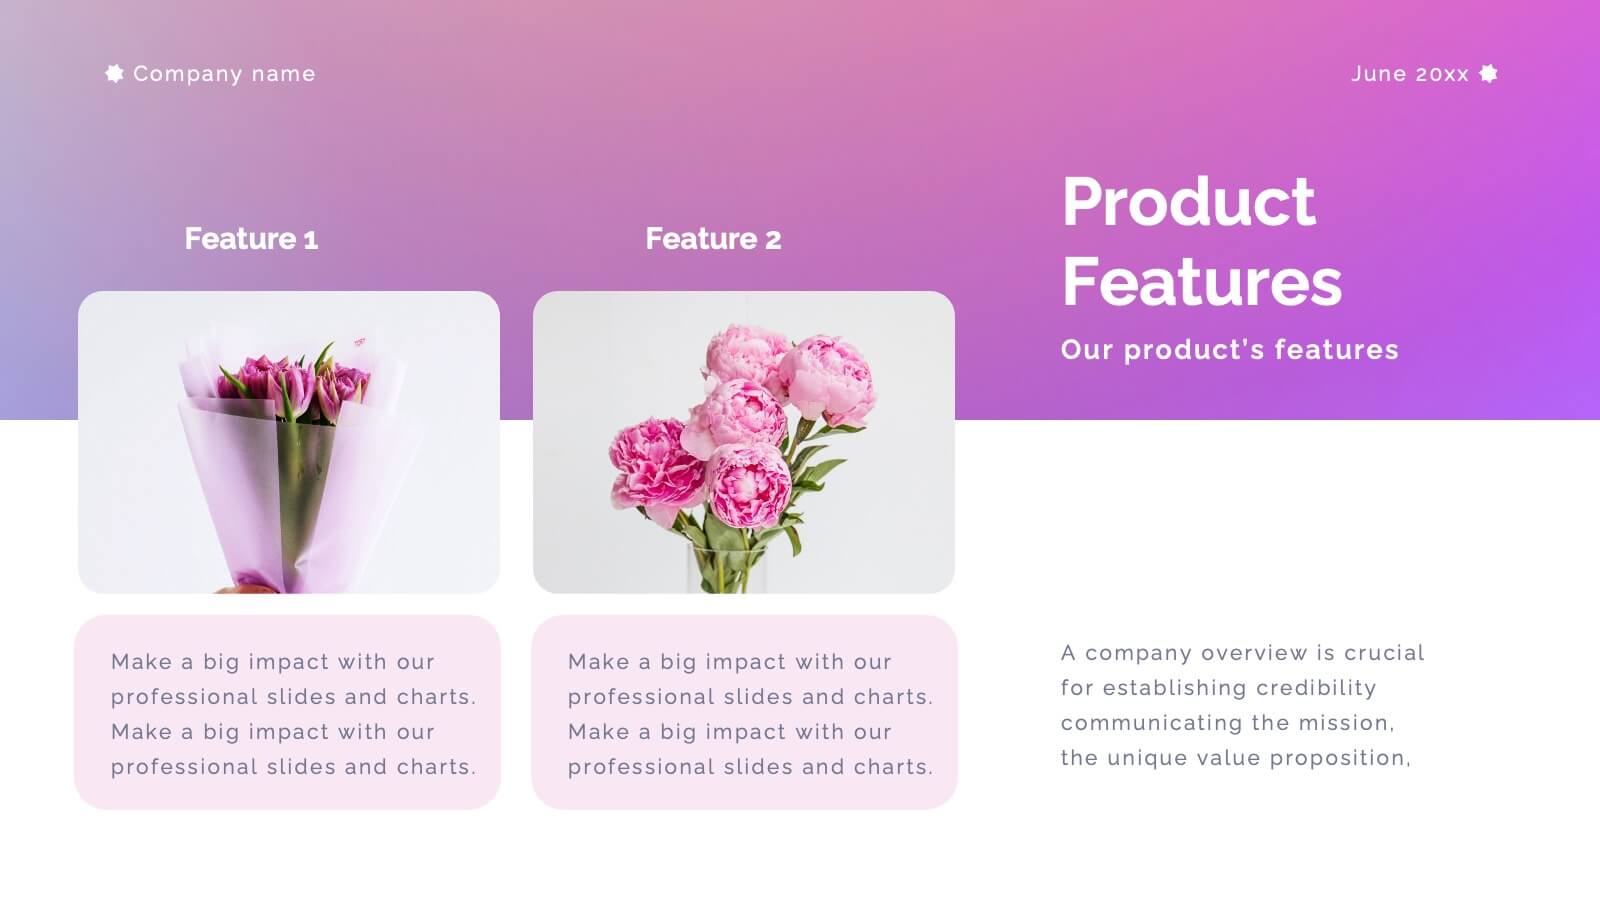
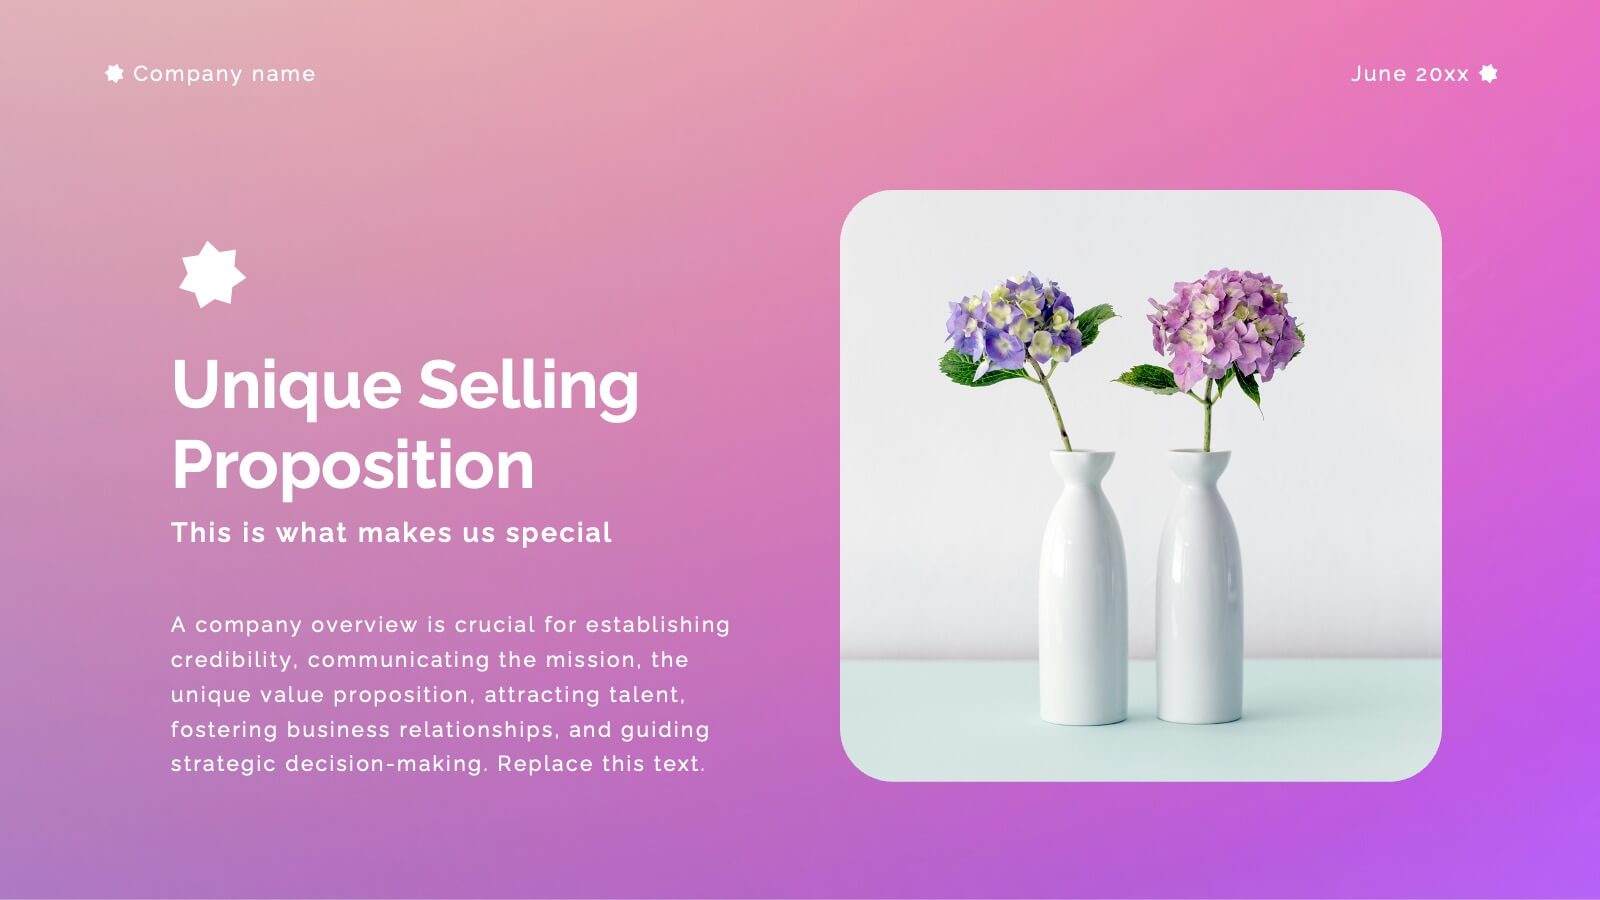
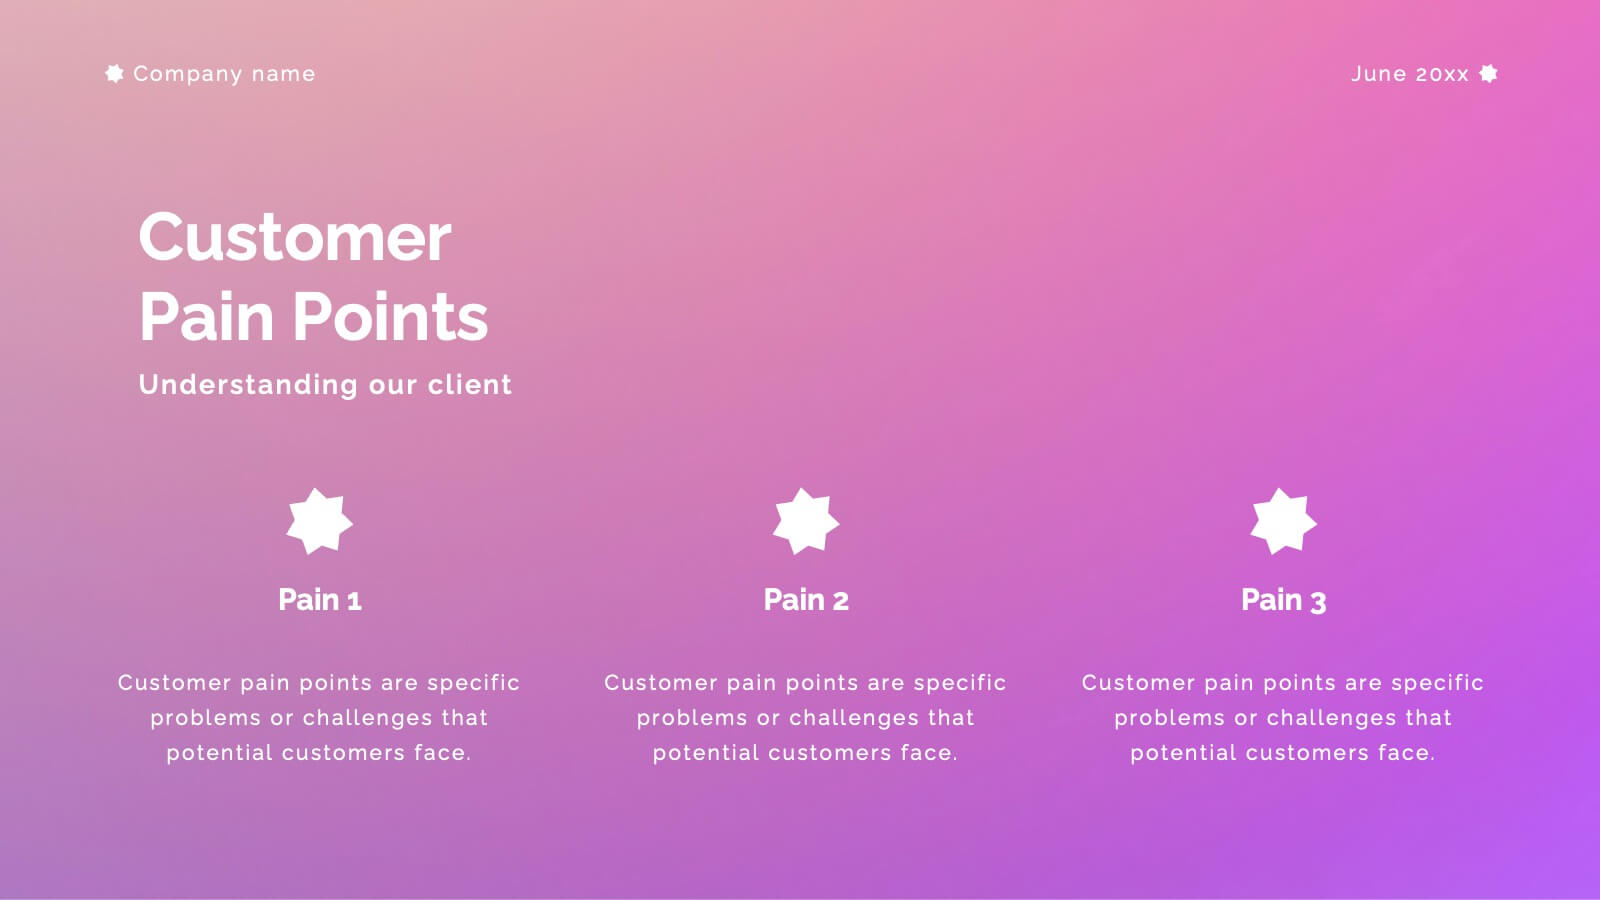
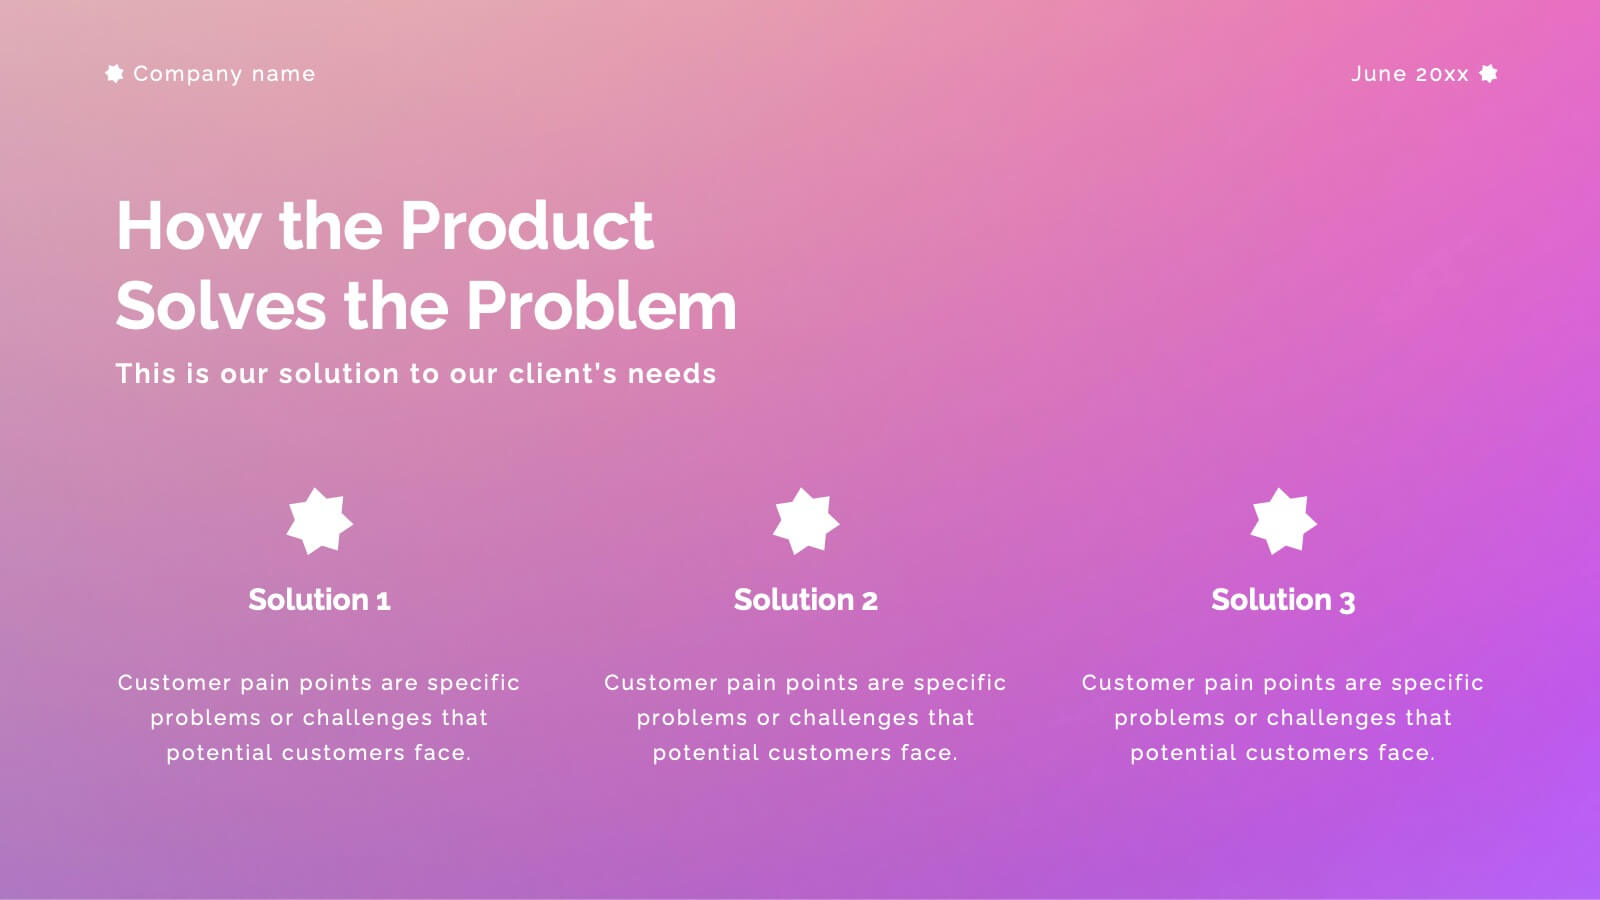
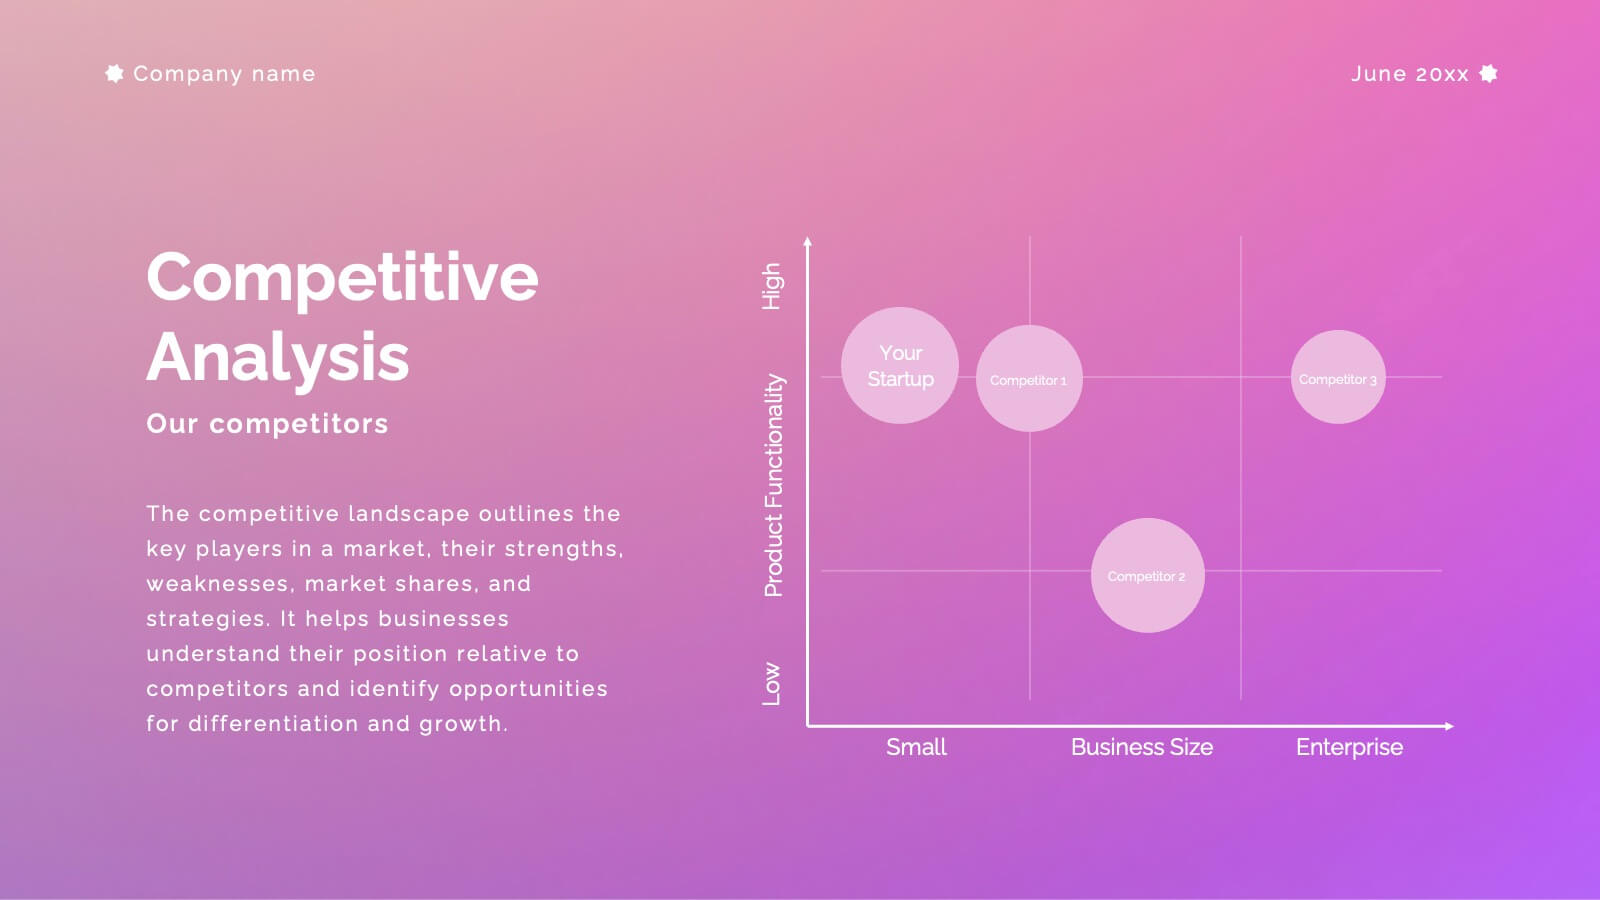
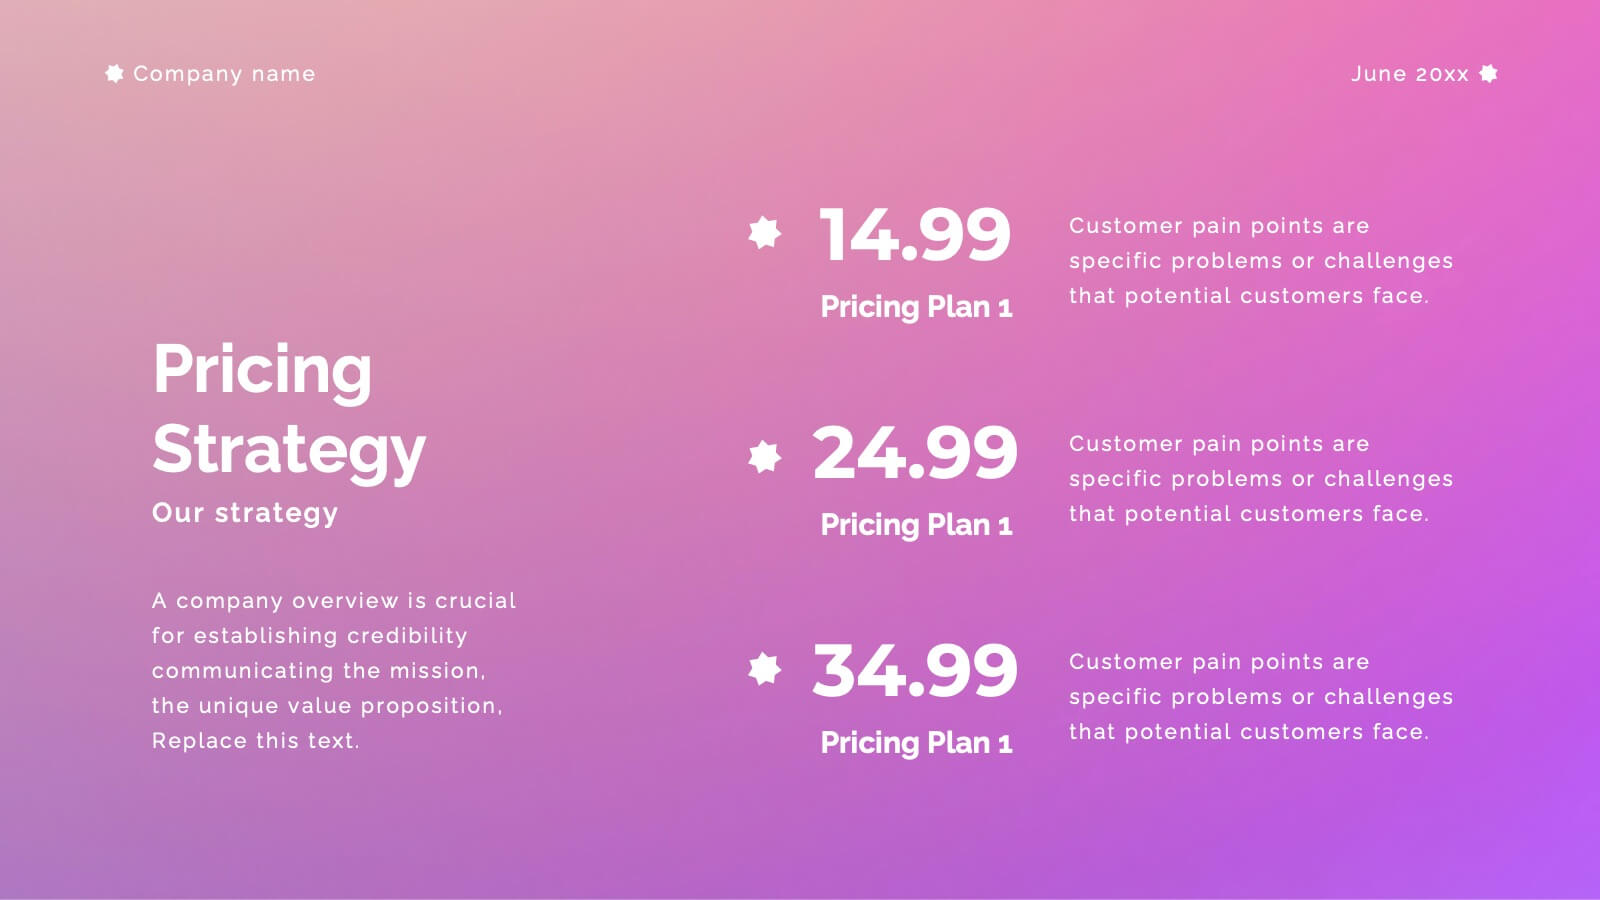
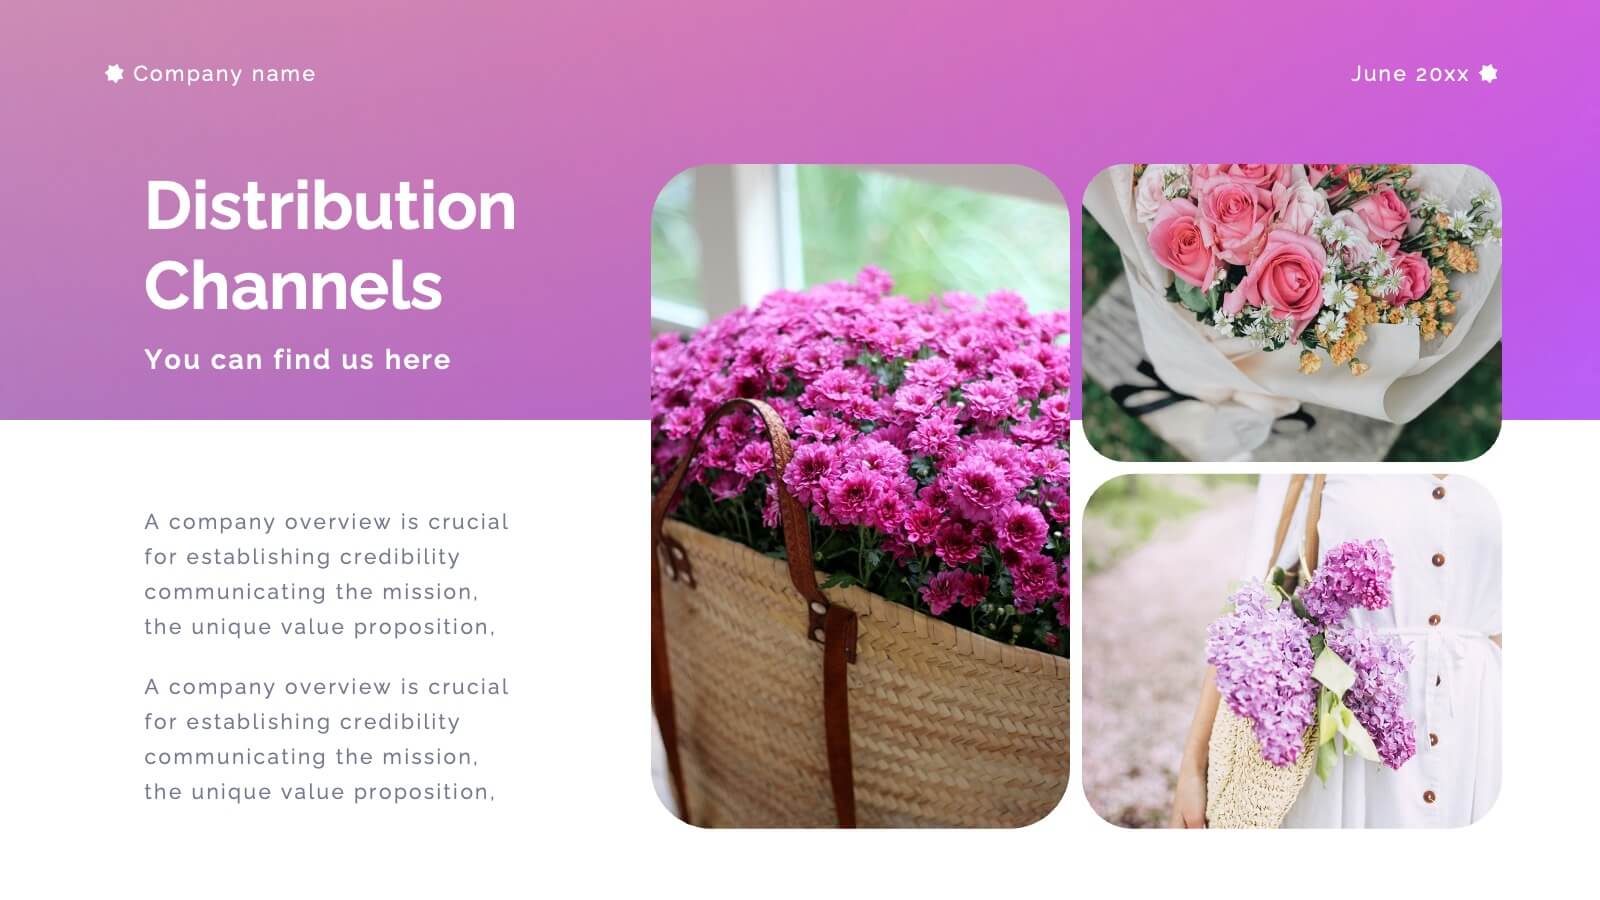
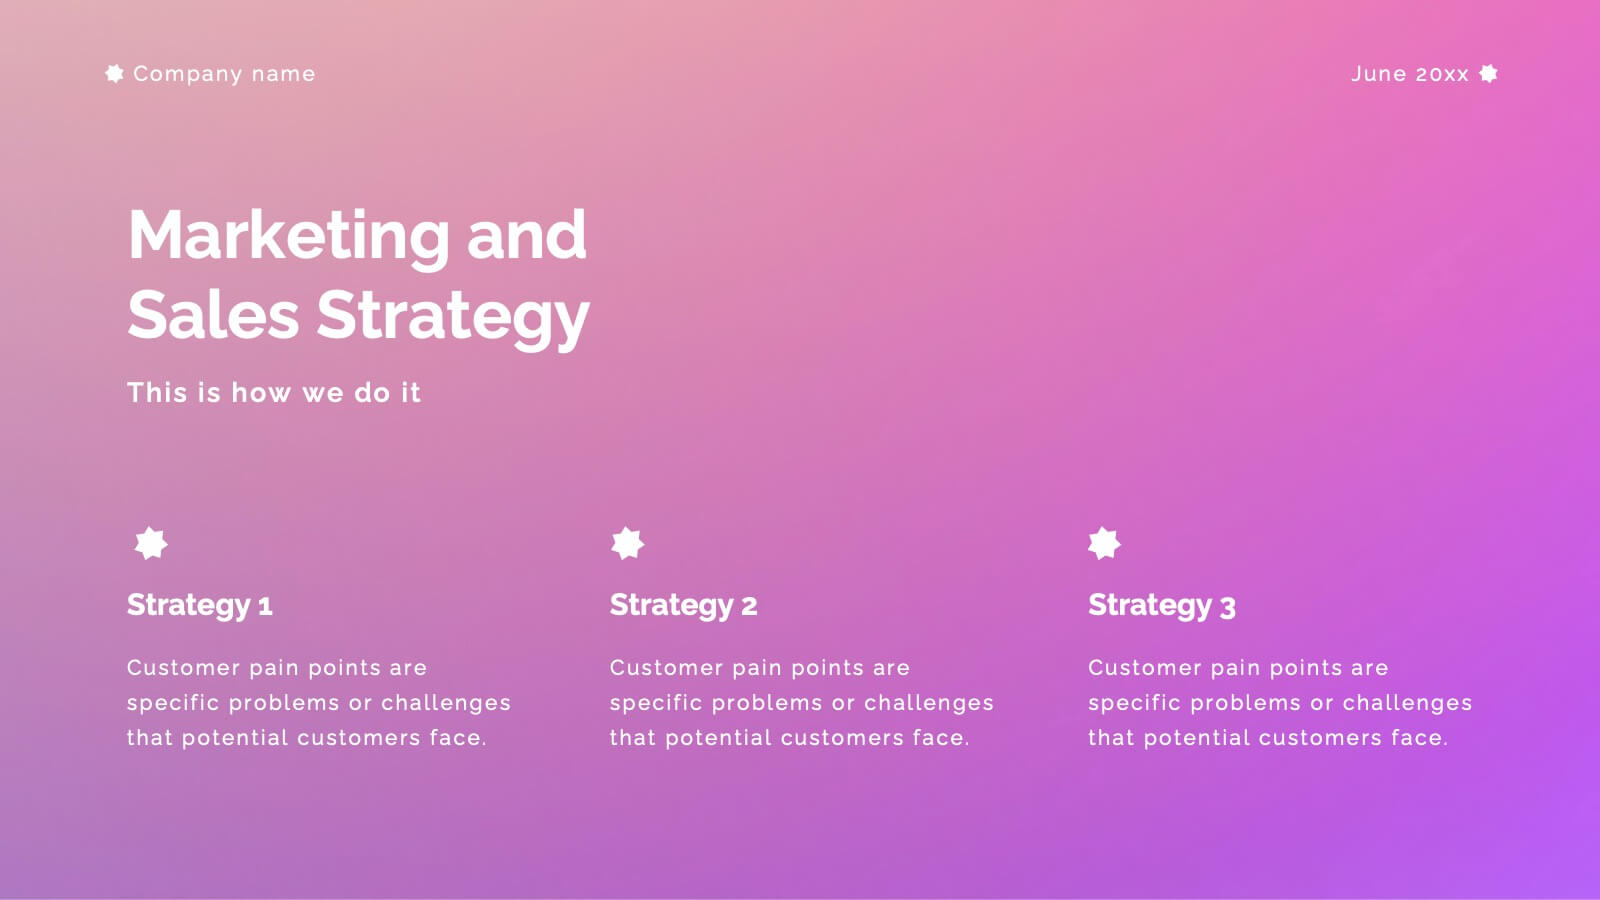
Aventurine New Product Proposal Presentation
Showcase your product in style with this vibrant and modern product proposal template! It covers everything from product features to target market, pricing strategy, and marketing plans. Designed for clarity and impact, it's perfect for pitching your product. Fully customizable, and compatible with PowerPoint, Keynote, and Google Slides for seamless presentations.


6 diapositivas
System Maintenance and Support Presentation
Streamline your technical processes with the System Maintenance and Support Presentation. This slide features a clean alphabetical list layout (A–E) paired with icons and concise text areas—ideal for illustrating maintenance protocols, support categories, or troubleshooting stages. The right-side wrench graphic adds a visual metaphor for IT upkeep. Fully editable in PowerPoint, Keynote, and Google Slides.


26 diapositivas
Kohen Presentation Template
Kohen is a minimal coffee shop template that features slide designs you can use together, making it perfect for sharing your business and services. It is easy to use, resulting in convenient high quality presentations. This template design can be used to create more elaborate presentations about food and restaurants. It is complete with charts, images, and text boxes for endless presentation possibilities. This template will help make your message more compelling and informative. The presentation includes a variety of tools and resources, to highlight key points and ideas with minimal text.


6 diapositivas
Market Sizing with TAM SAM SOM Strategy Presentation
Clearly define your market opportunity using the Market Sizing with TAM SAM SOM Strategy Presentation. This template breaks down Total Addressable Market, Serviceable Available Market, and Serviceable Obtainable Market with a visual bullseye format that’s intuitive and persuasive. Easily editable in PowerPoint, Keynote, and Google Slides.


8 diapositivas
AI Trends and Future Technology Presentation
Step into the future with this sleek, modern template designed to visualize cutting-edge concepts in artificial intelligence. Featuring futuristic robot graphics and a clean circular flow layout, this design is perfect for showcasing tech trends, automation strategies, or AI-driven innovations. Each section is color-coded and icon-supported for easy customization. Ideal for tech startups, AI researchers, and innovation consultants. Fully editable in PowerPoint, Keynote, and Google Slides.


5 diapositivas
Business Gap Identification Presentation
Identify key performance gaps from point A to B with this step-based visualization. Each arch-shaped column represents a stage in the improvement process. Use it to highlight capability gaps, missed opportunities, or strategy breakdowns. Fully editable and compatible with PowerPoint, Keynote, and Google Slides—ideal for consulting, planning, and reporting.


26 diapositivas
Professional Etiquette Presentation
Navigate the nuances of professional decorum through this tapestry of visuals that articulate the essence of workplace conduct. Against a palette of serene blues, each slide is a chapter in the unwritten manual of corporate finesse. Behold the tableau of contents, a compass that guides through topics from networking nuances to meeting mastery. Profile snapshots reveal the faces behind the expertise, their demeanors a blend of affability and authority. Charts ascend like ladders, each bar a rung towards proficiency, while infographics spiral into knowledge funnels, distilling broad concepts into digestible insights. In the realm of comparison, dichotomies transform into dialogues, contrasting ideas merging into a unified vision of etiquette. Venn diagrams interlock circles of skills, control, and success, illustrating the symbiotic relationship of competencies. Contact slides extend a virtual handshake, inviting engagement and fostering connections. This presentation is an homage to the unspoken - the grace of gratitude, the elegance of silence, and the power of a well-timed gesture - as it crafts an environment where professionalism is not just practiced, but lived.


26 diapositivas
Haeleigh Presentation Template
The Haeleigh Powerpoint Template is a 26 modern slide template that is perfect for any presentation. With a clean classy aesthetic and easy to read text, this template is ideal for reading content and looking professional. The use of nude colors helps keep the look clean and easy to read. The theme comes packed with features to target your audience and help you get your message across. The charts, graphics, timelines included are easy to edit. This template is also perfect for businesses seeking to make an impression on their audience. Haeleigh is mobile friendly and easy to navigate.


6 diapositivas
Customer Value Proposition Framework Presentation
Clarify your business offering with the Customer Value Proposition Framework Presentation. This template is designed to help you align your products or services with customer needs through a side-by-side visual of the Value Proposition Canvas. Highlight pain points, customer gains, and how your solution uniquely addresses them. Fully customizable in PowerPoint, Keynote, and Google Slides. Perfect for marketers, product managers, and strategic planning teams.


5 diapositivas
Planning and Delivery in Five Phases Presentation
Guide your audience through each step of your execution plan using the Planning and Delivery in Five Phases Presentation. This clean, drop-pin style layout highlights five essential milestones for structured delivery and progress tracking. Each phase is color-coded for easy reference. Fully editable in PowerPoint, Keynote, Google Slides, and Canva.


4 diapositivas
South America Growth Market Strategy Presentation
Showcase expansion potential with the South America Growth Market Strategy Presentation. This slide template visually maps out your business strategy across the continent using location markers, ranking indicators (A–D), and concise text sections for each market. Perfect for growth analysis, investment briefings, or sales planning. Fully editable in PowerPoint, Keynote, Google Slides, and Canva.


6 diapositivas
5-Stage Circular Cycle Presentation
Energize your workflow with a clean, circular layout that turns five interconnected steps into a clear, engaging story. This presentation helps you explain any repeating process or continuous cycle with simplicity and flow, making complex ideas easier to follow. Compatible with PowerPoint, Keynote, and Google Slides.

21 diapositivas
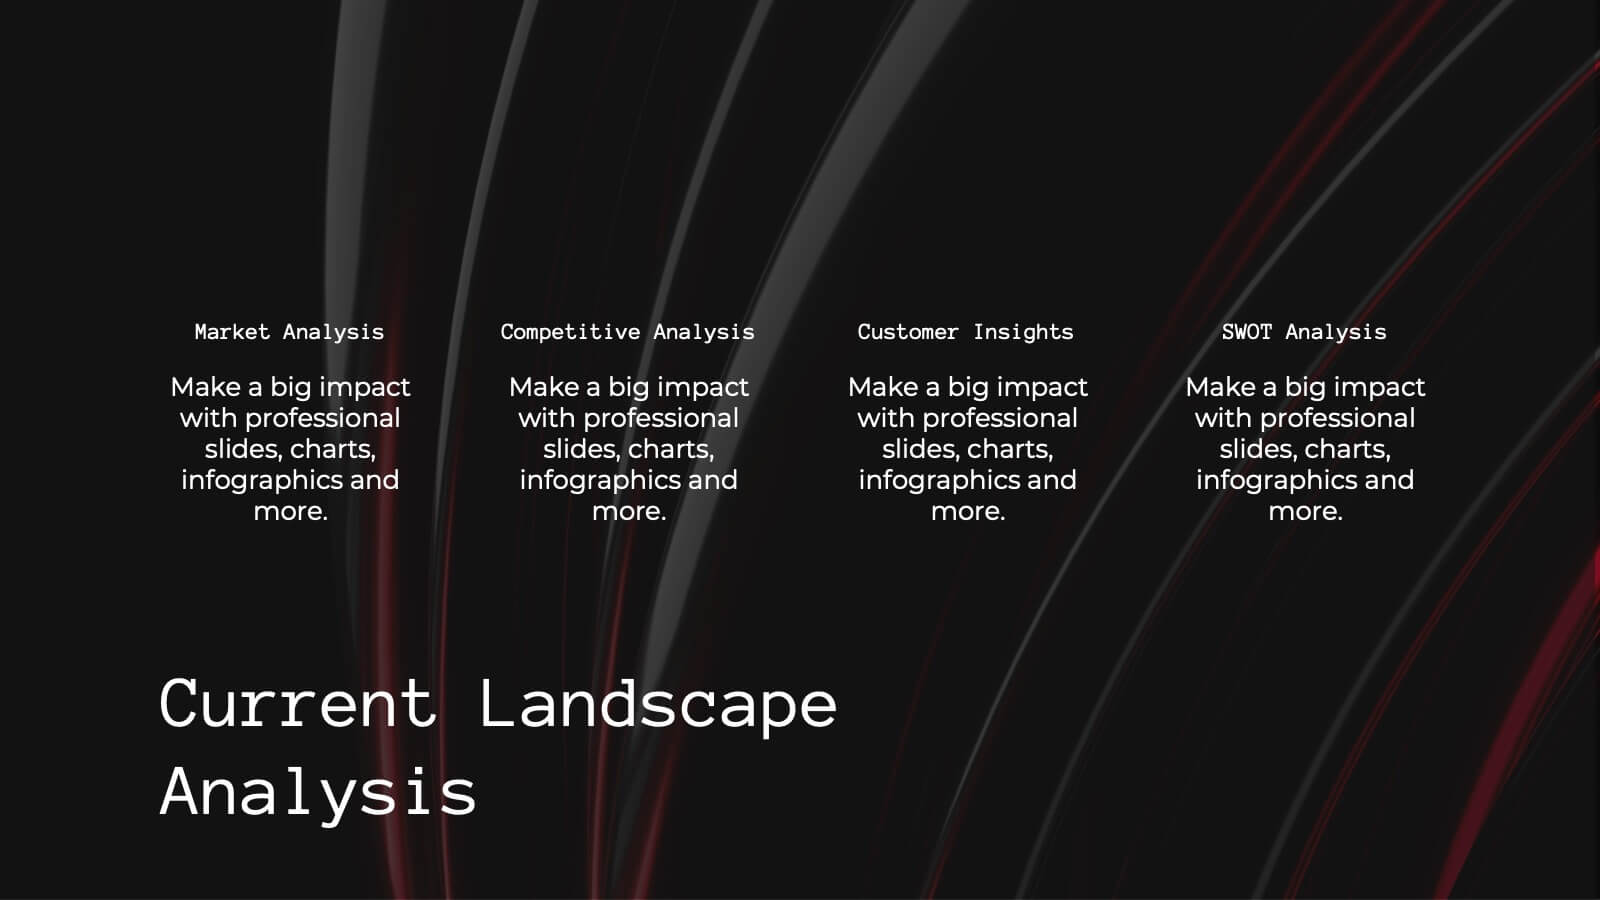
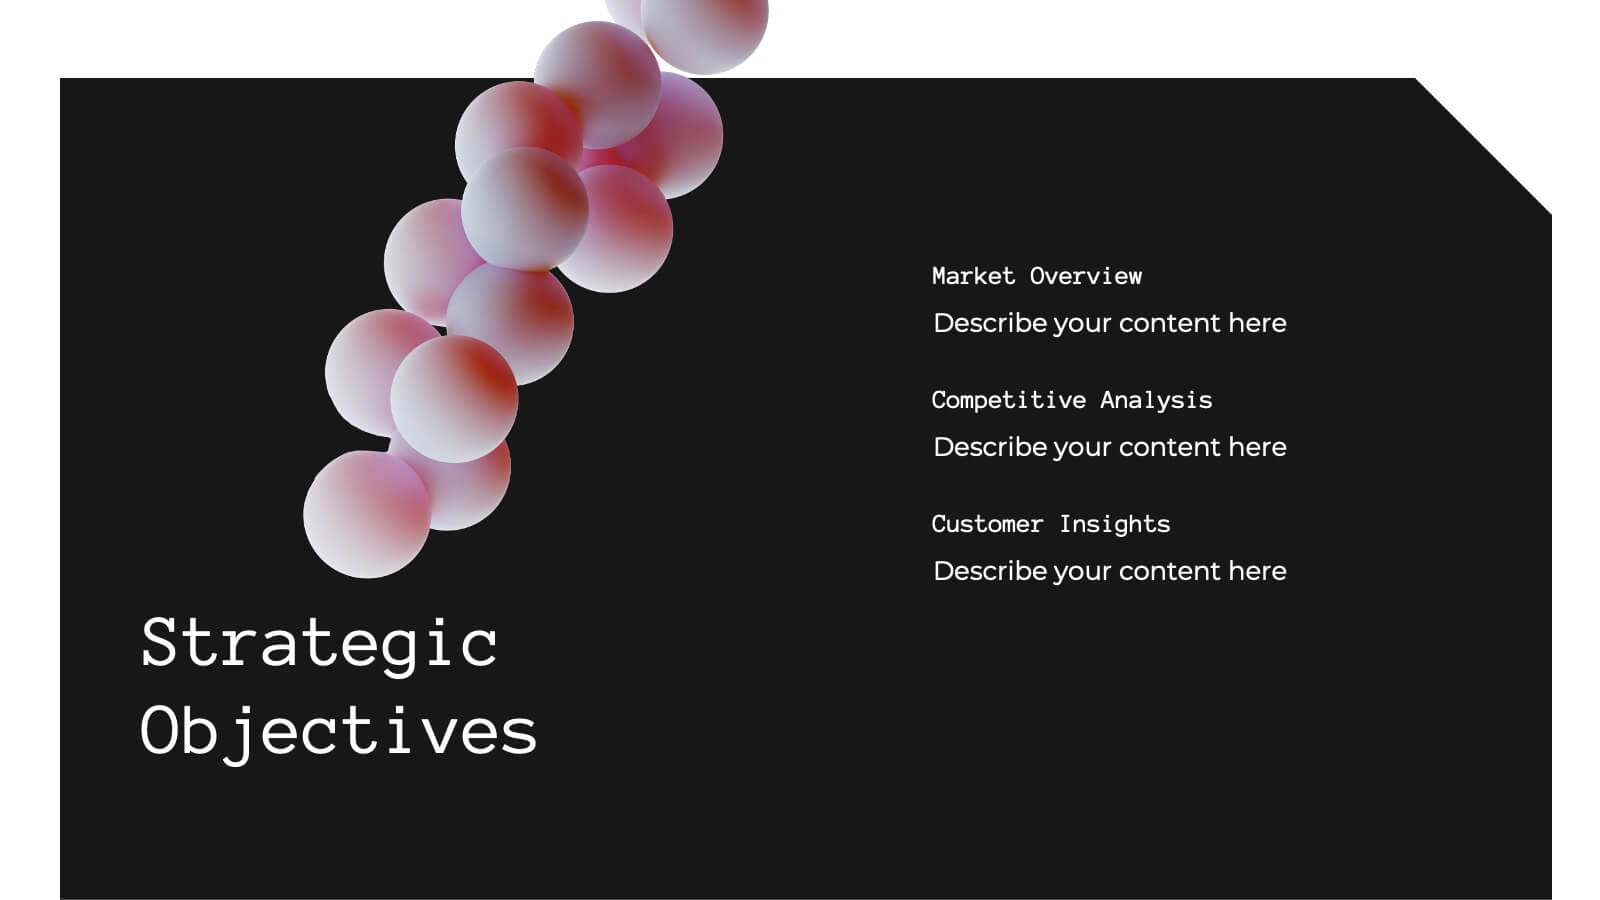
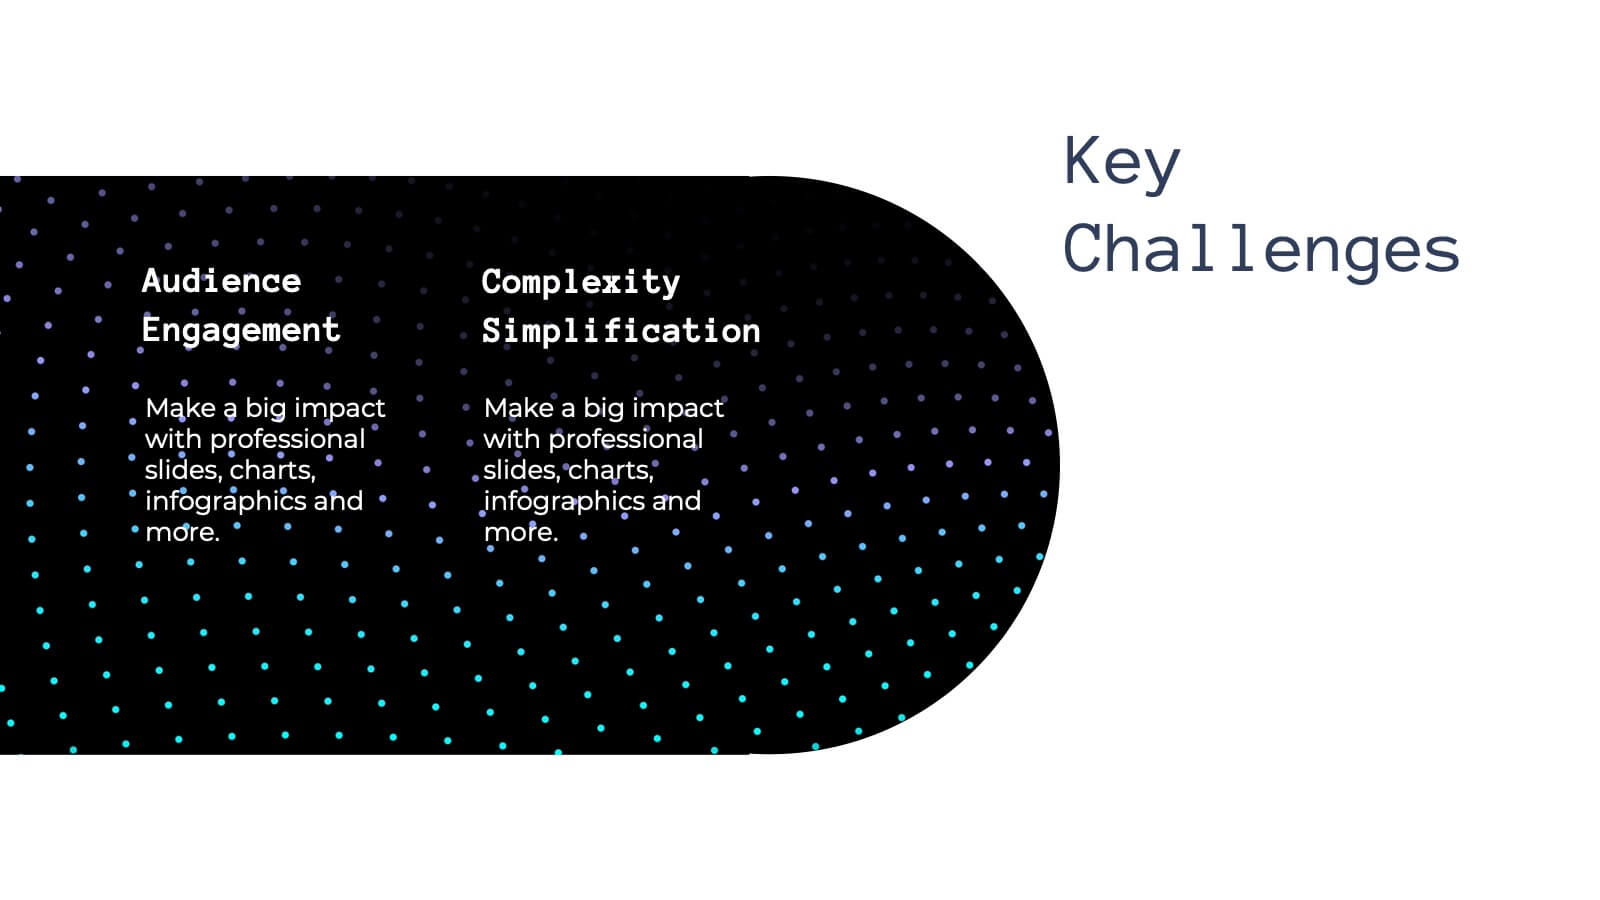
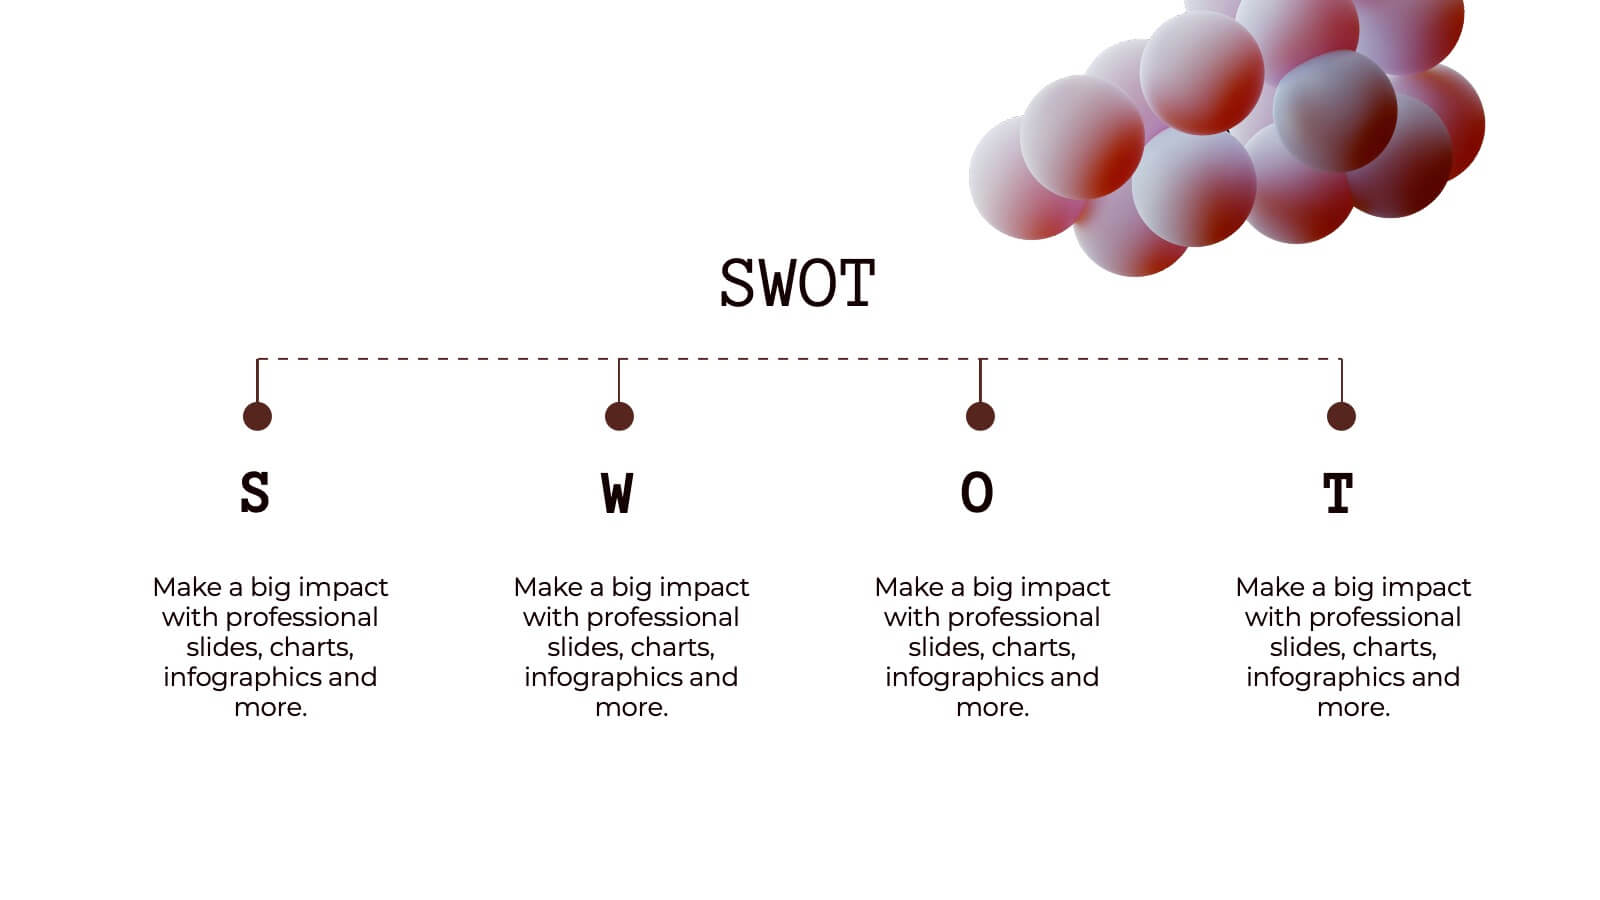
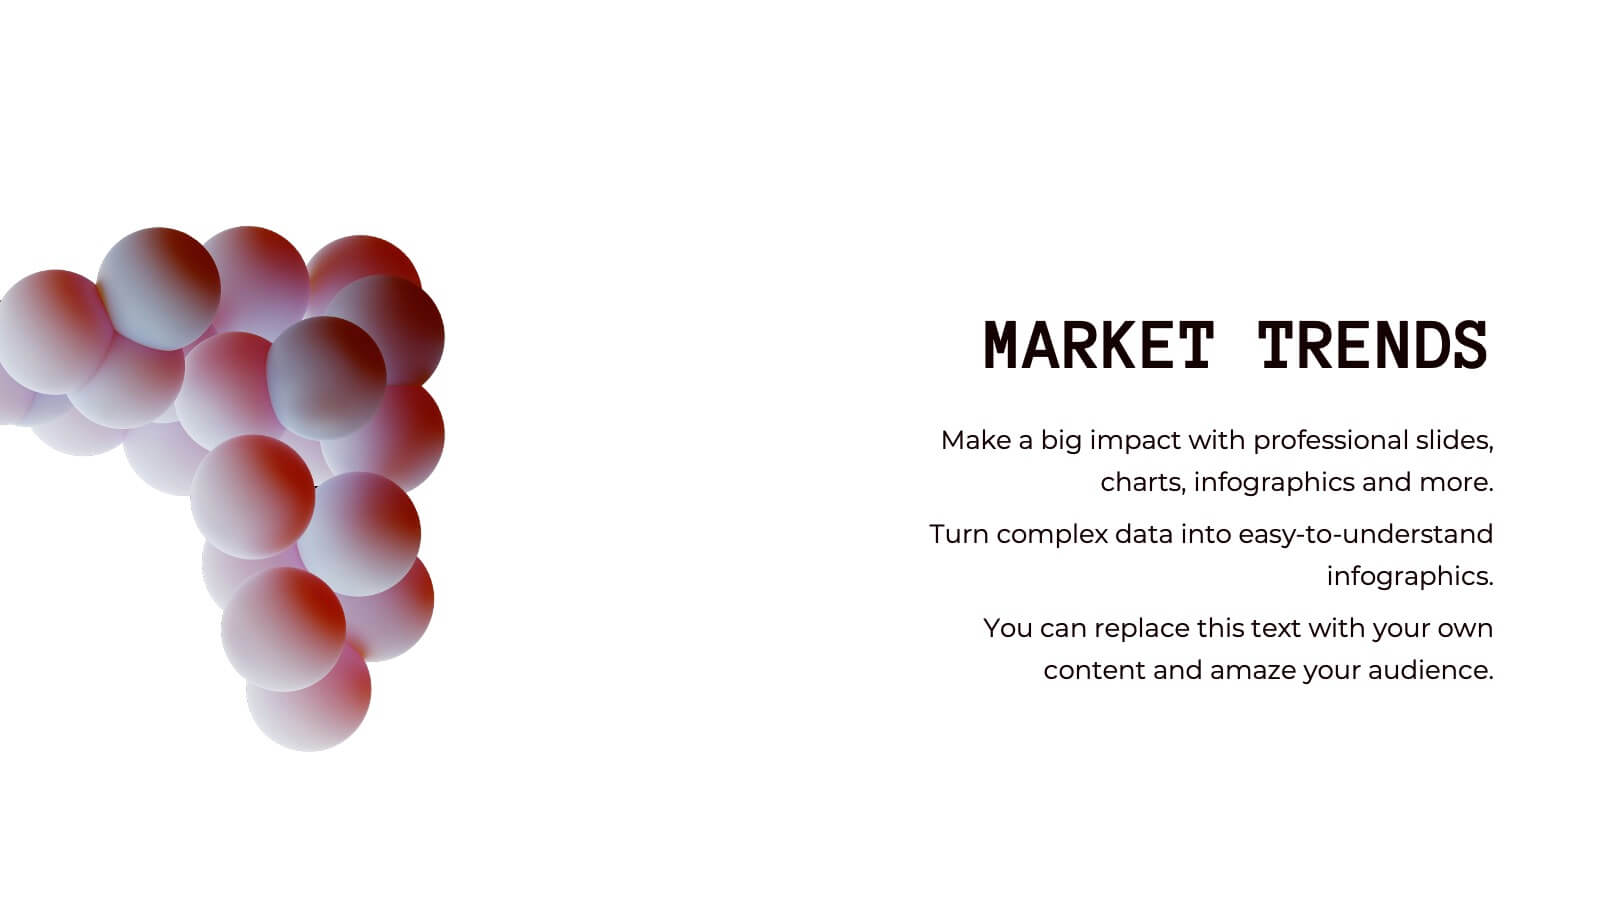
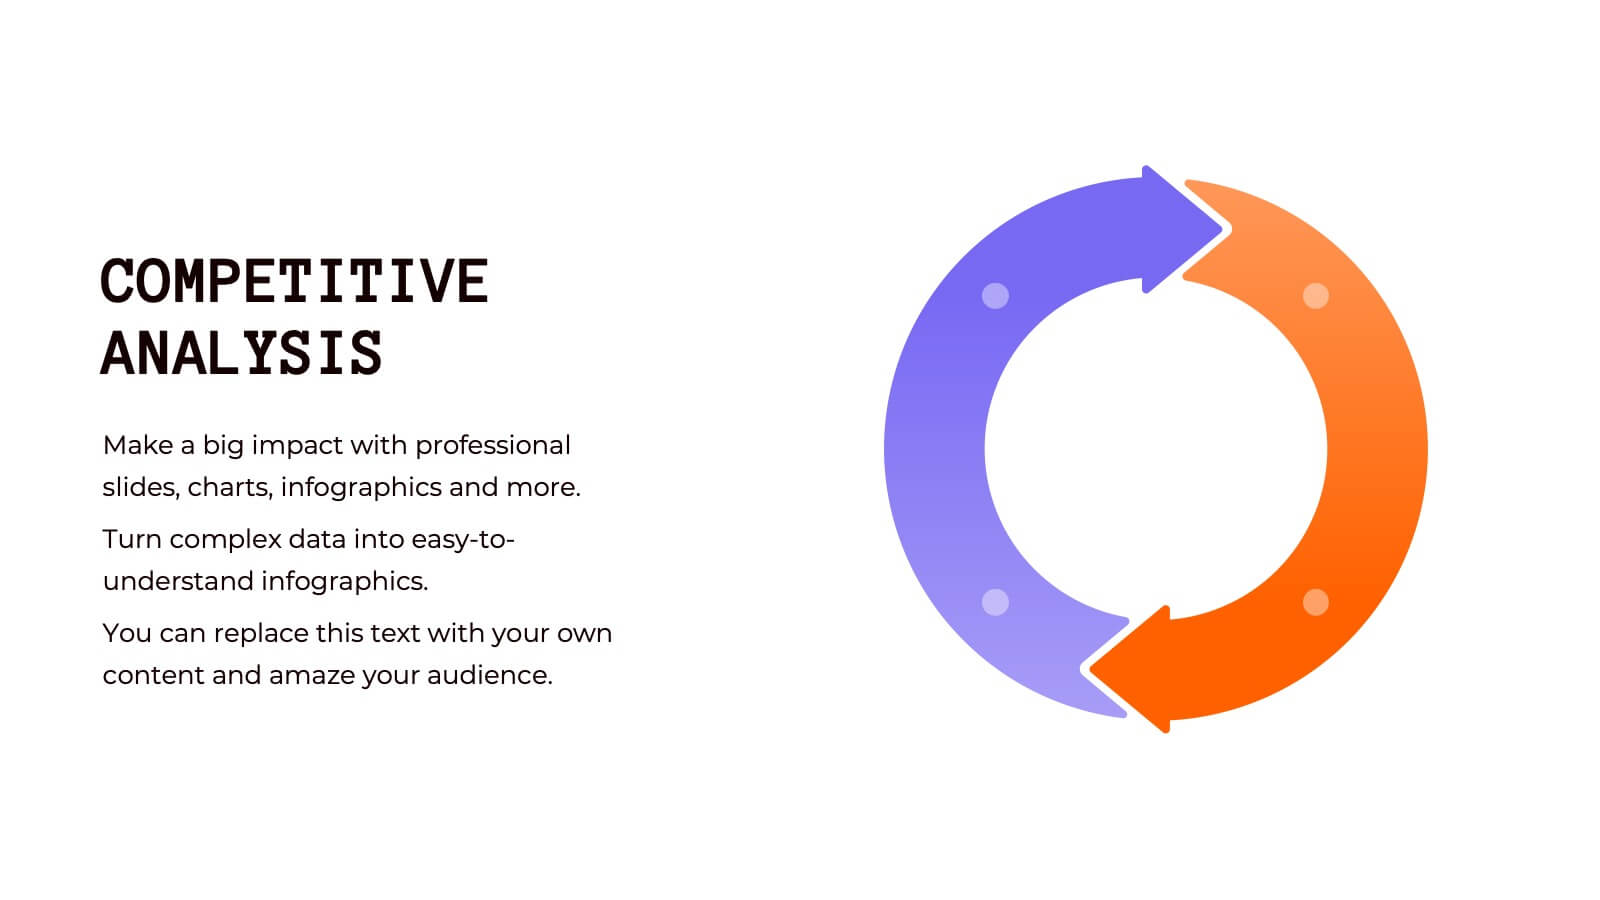
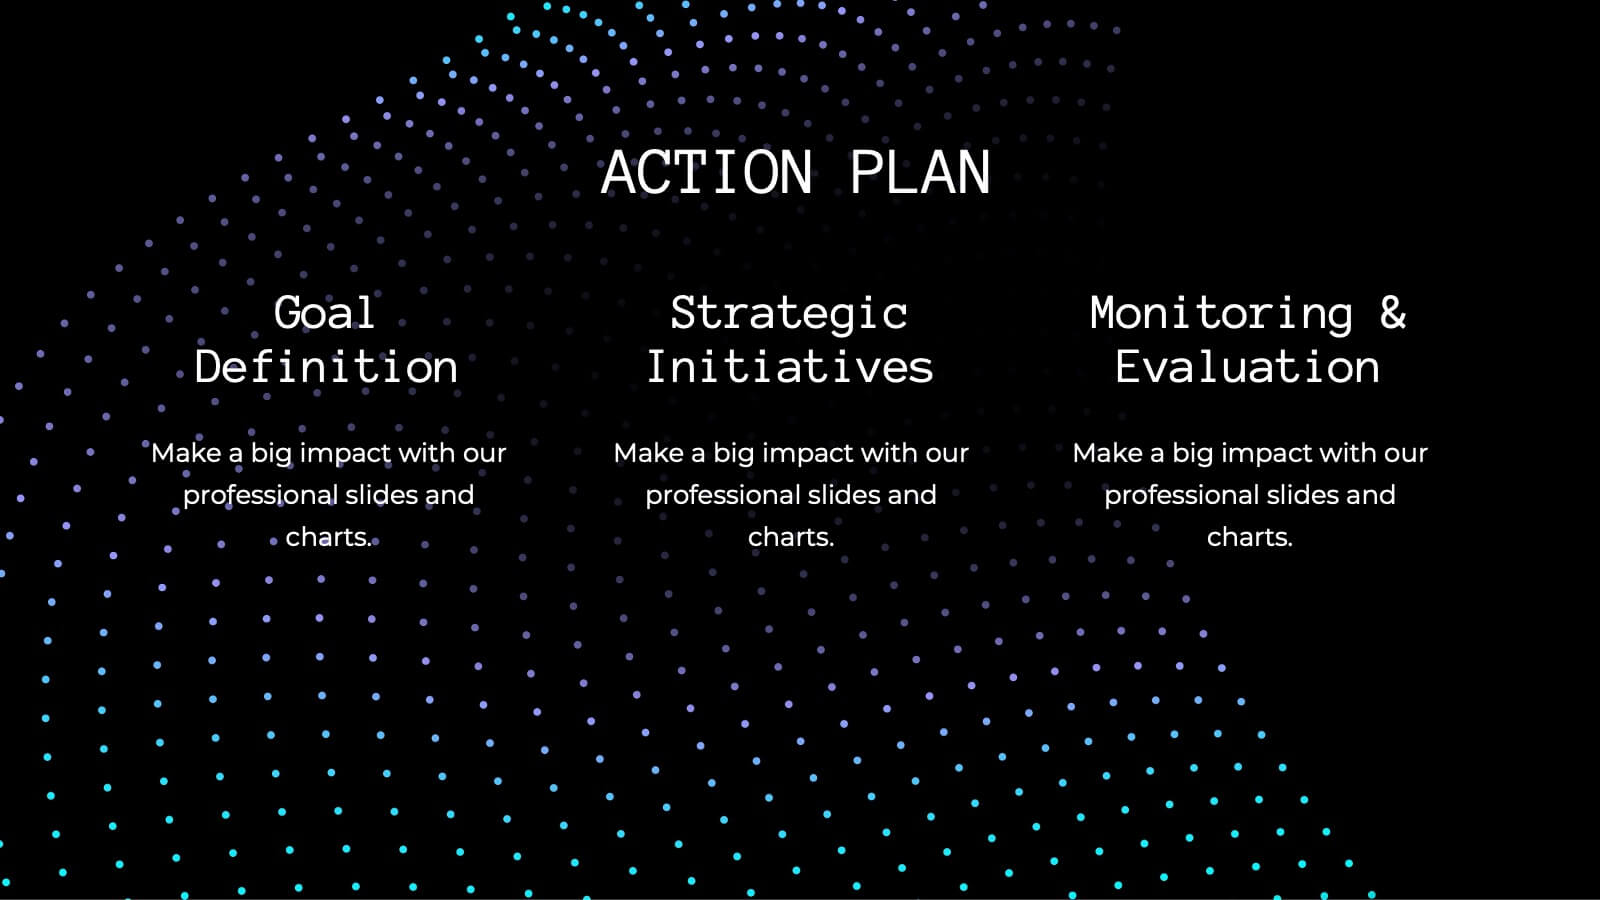
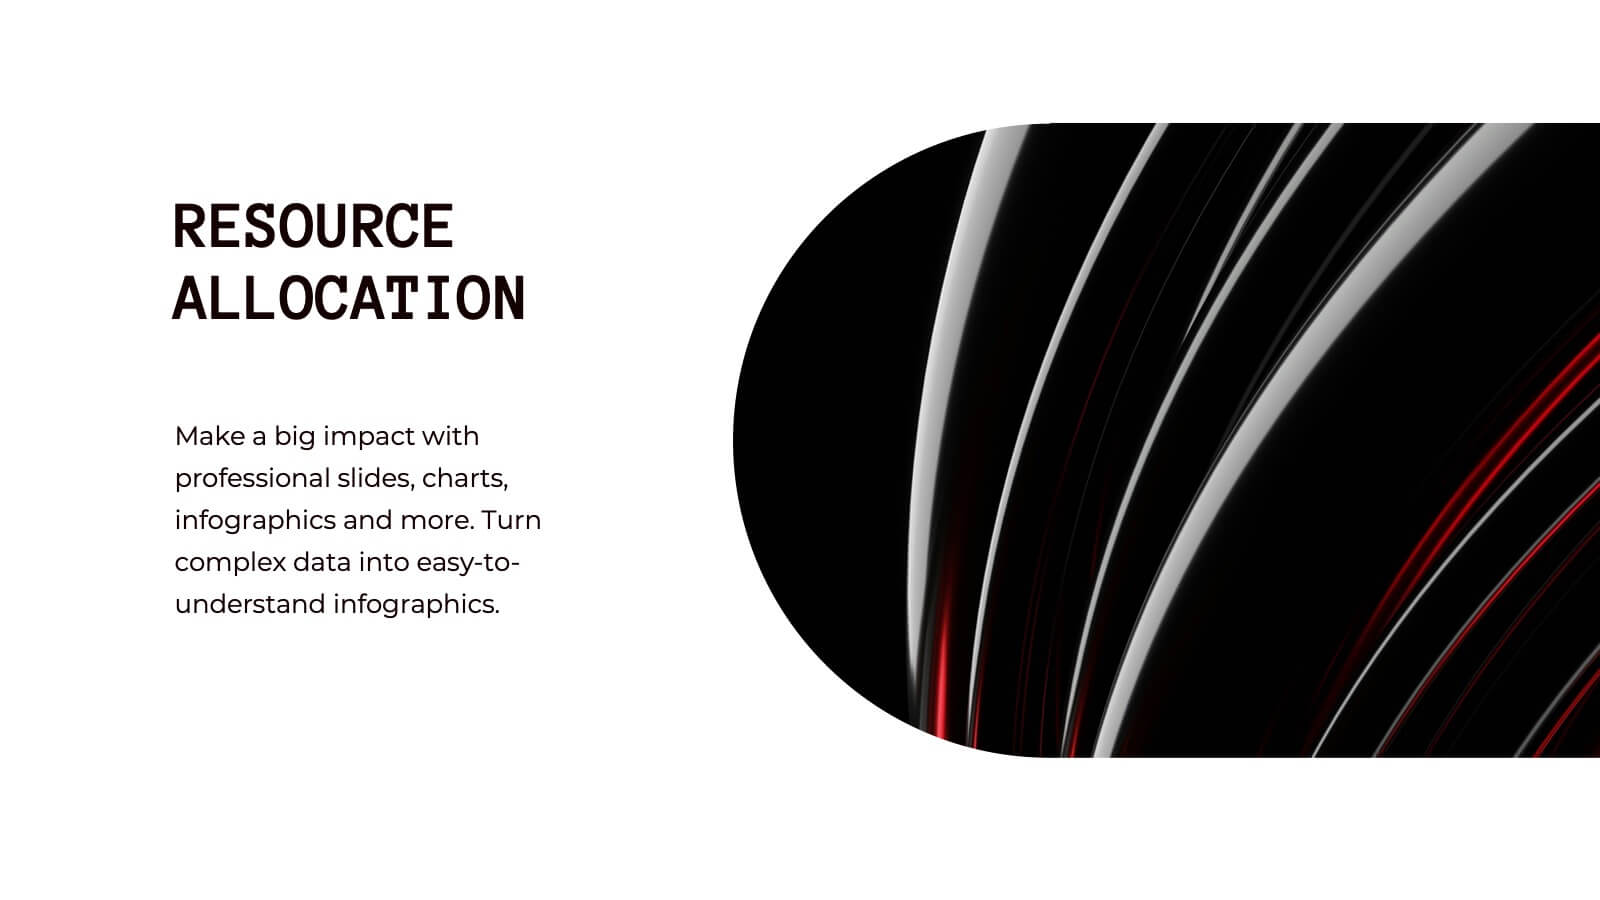
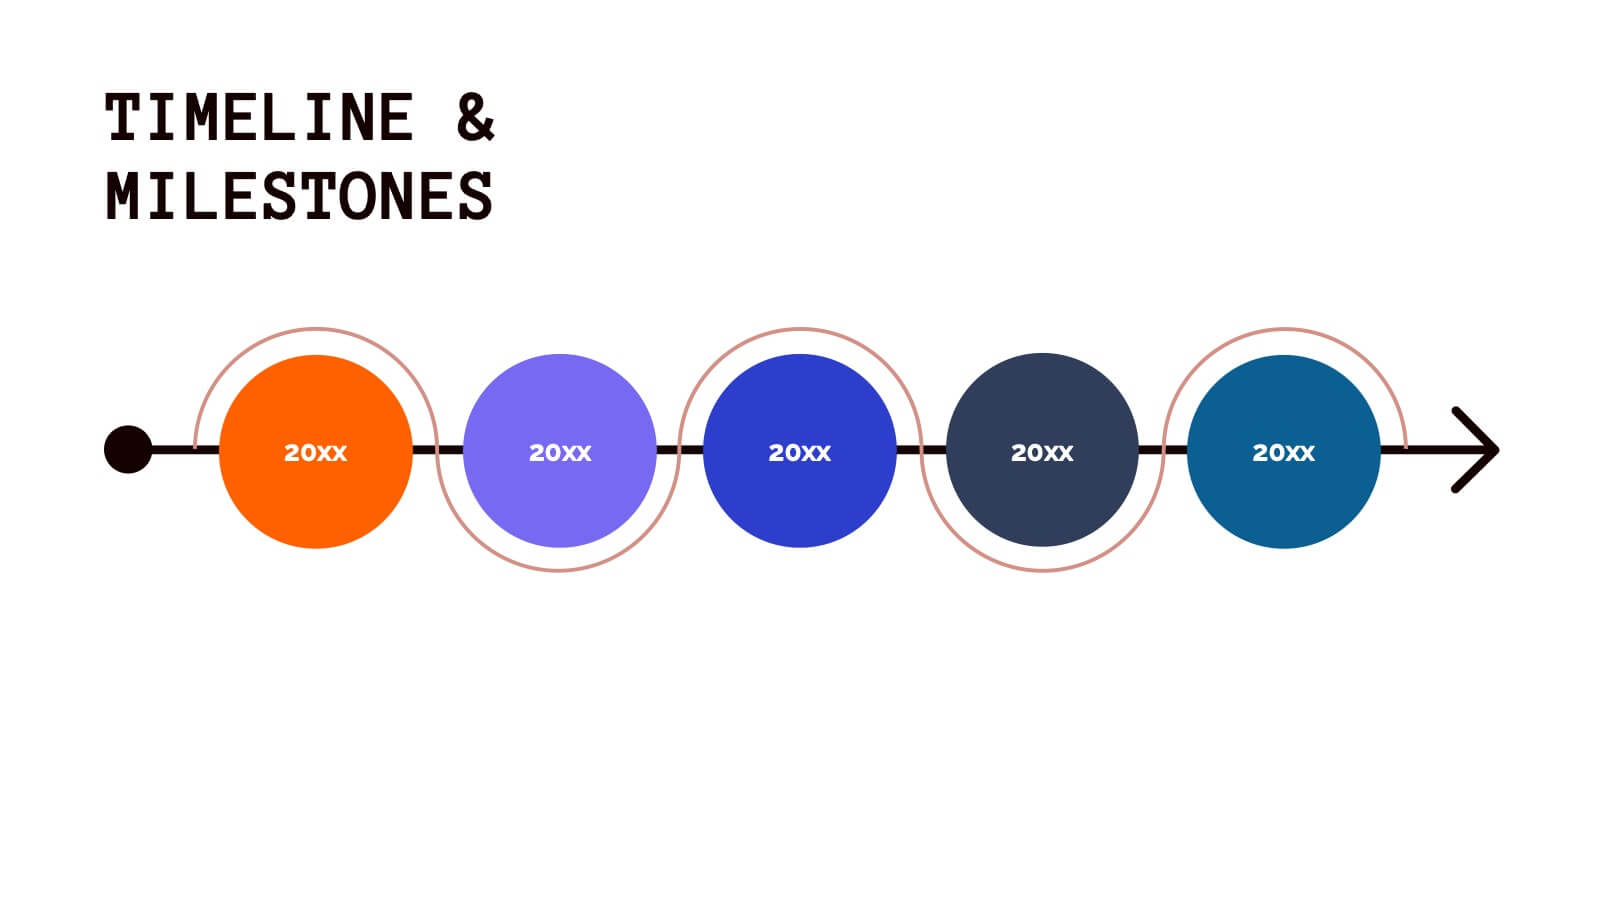
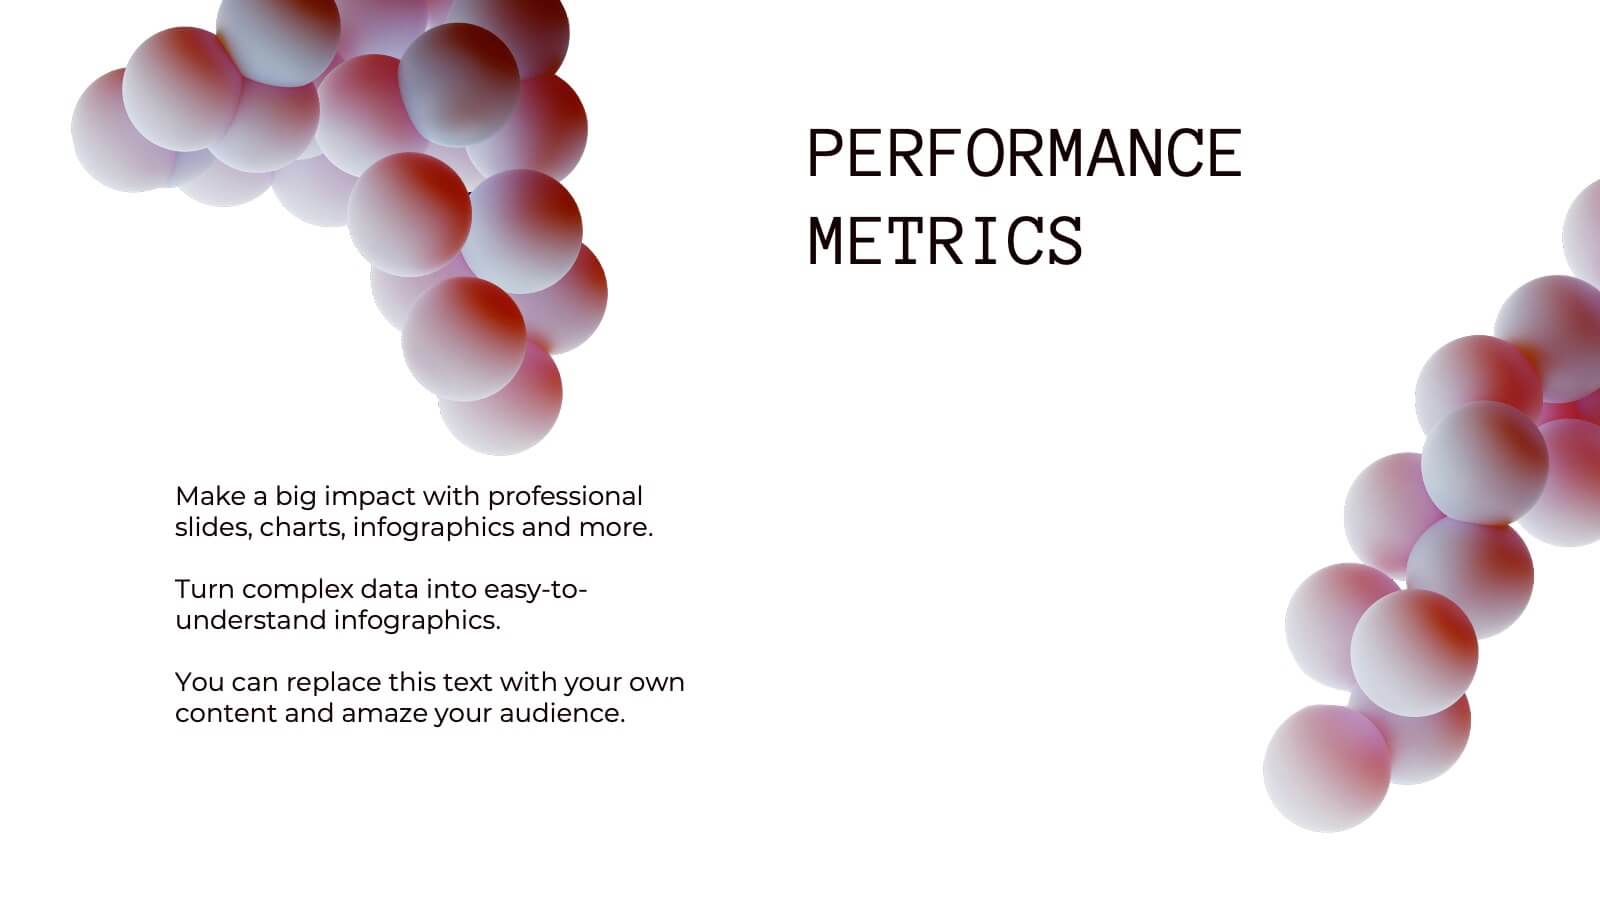
Mermaid Corporate Strategy Proposal Presentation
Present your corporate strategy with confidence using this sleek, modern proposal template! It covers strategic objectives, market trends, SWOT analysis, and resource allocation, ensuring a comprehensive overview of your plan. Fully customizable and compatible with PowerPoint, Keynote, and Google Slides, this template is ideal for launching new initiatives and achieving business goals.


6 diapositivas
Employee Change Management Strategy Presentation
Communicate change with clarity using this structured, gear-themed presentation slide. Designed to visualize six strategic stages of employee transition, it's ideal for HR professionals, team leaders, and consultants managing organizational change. Each step is represented with a numbered circle and aligned text for easy guidance. Fully customizable in PowerPoint, Keynote, and Google Slides.


8 diapositivas
International Data Visualization Map Presentation
Present global data with clarity using this International Data Visualization Map. Highlight regional performance, market share, or user distribution through clean, infographic-style visuals. Ideal for business reports, global strategy updates, or research findings. Fully editable in PowerPoint, Keynote, and Google Slides—designed for sleek, professional storytelling across international audiences.