


Características


¿Tienes alguna pregunta?
Recomendar
22 diapositivas
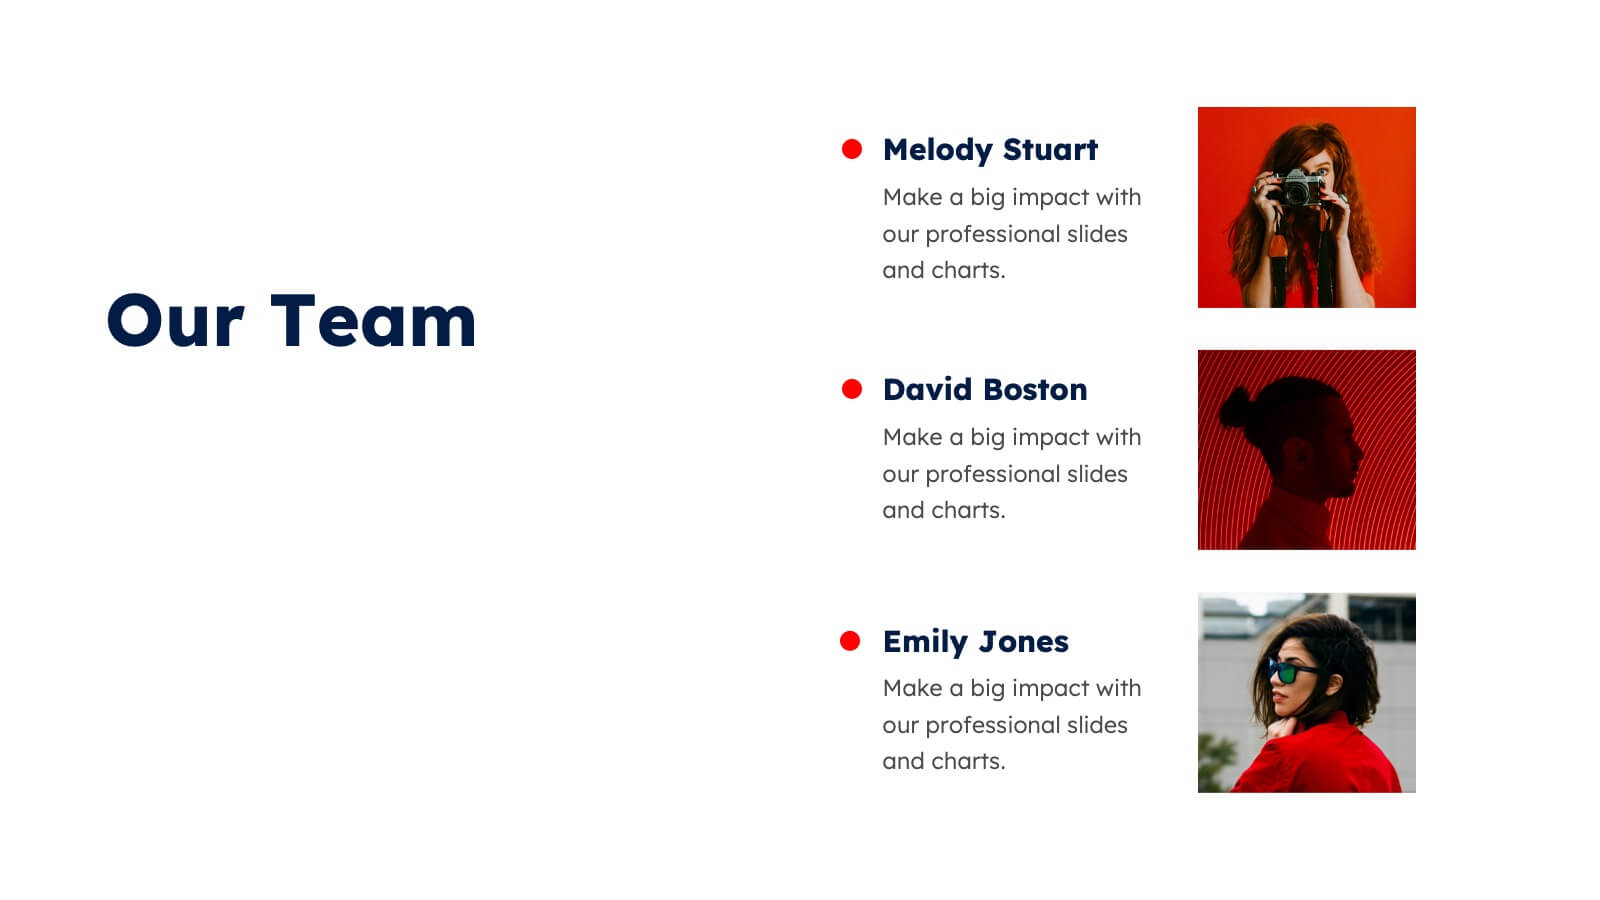
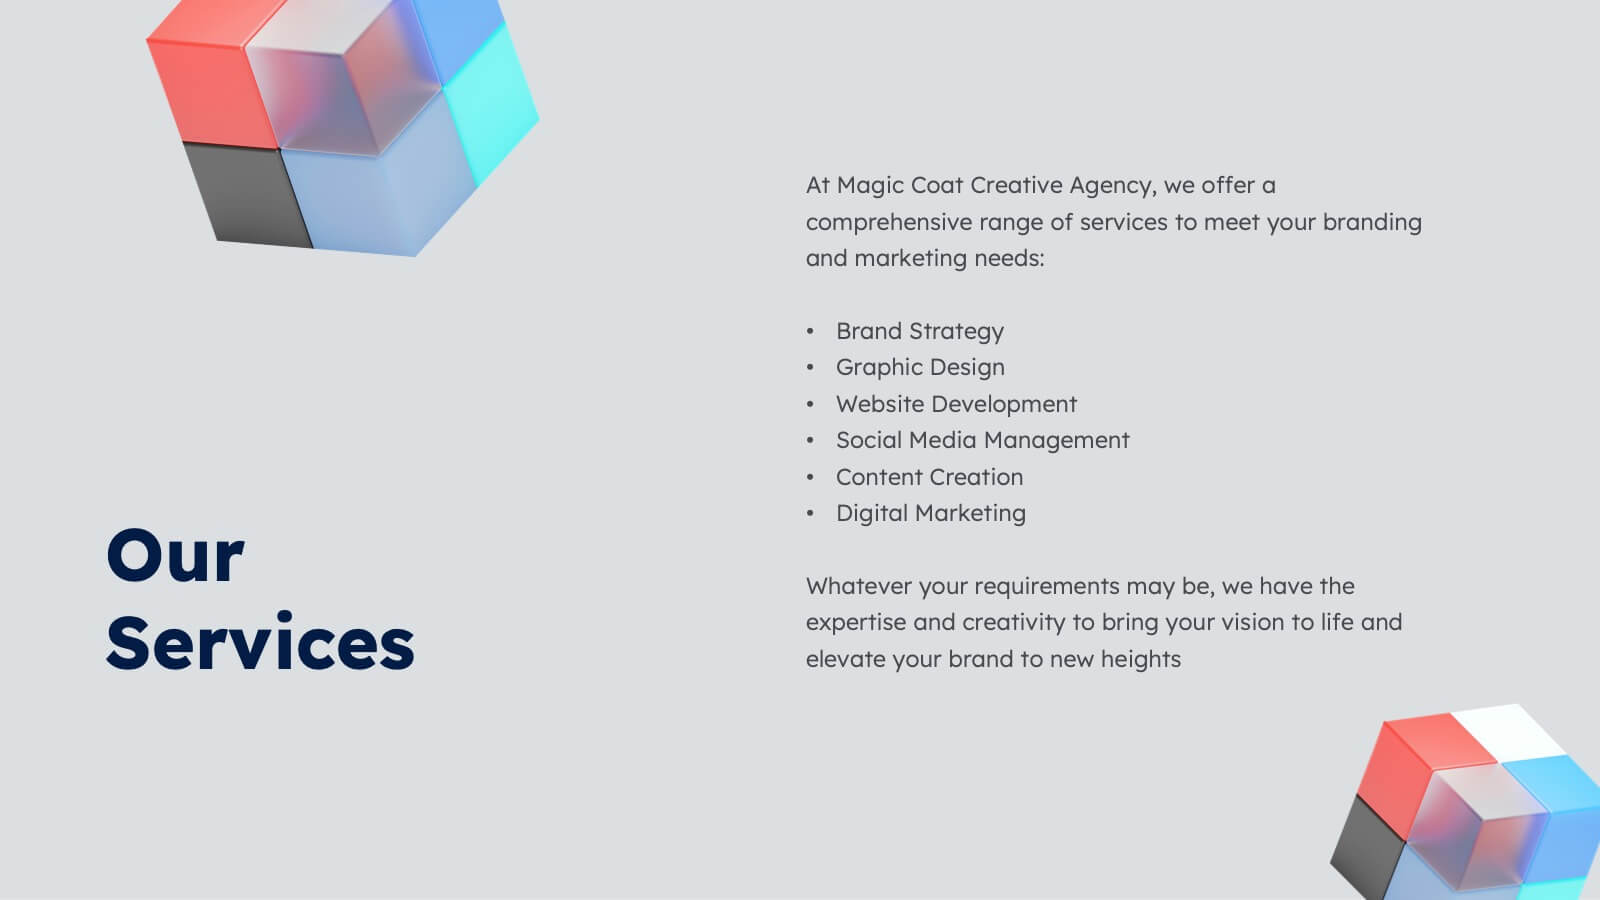
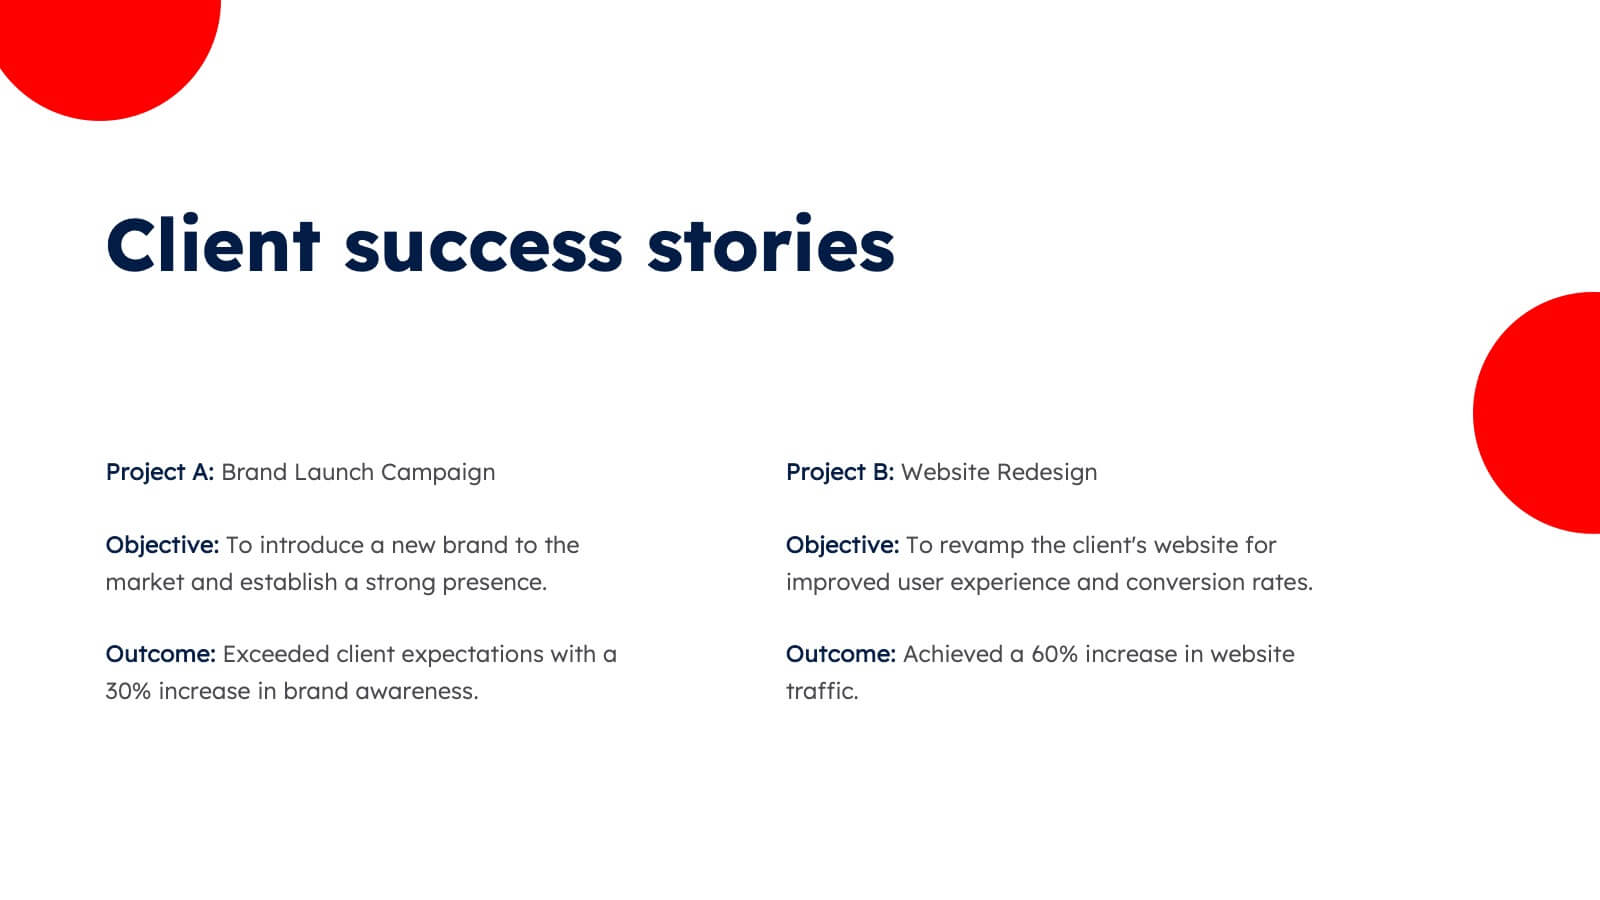
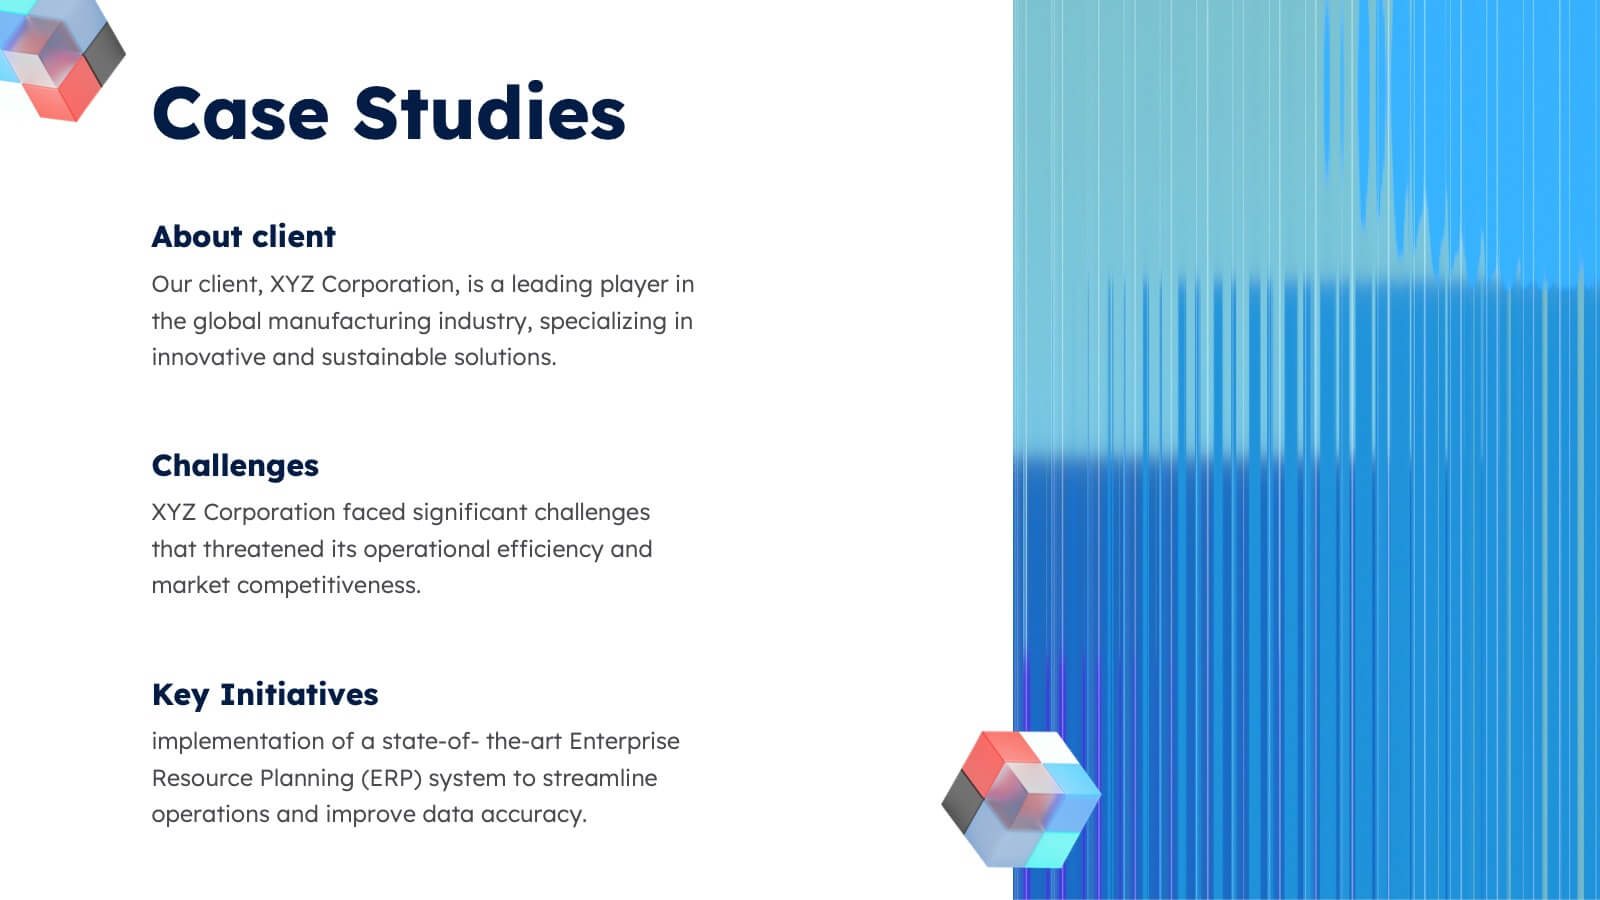
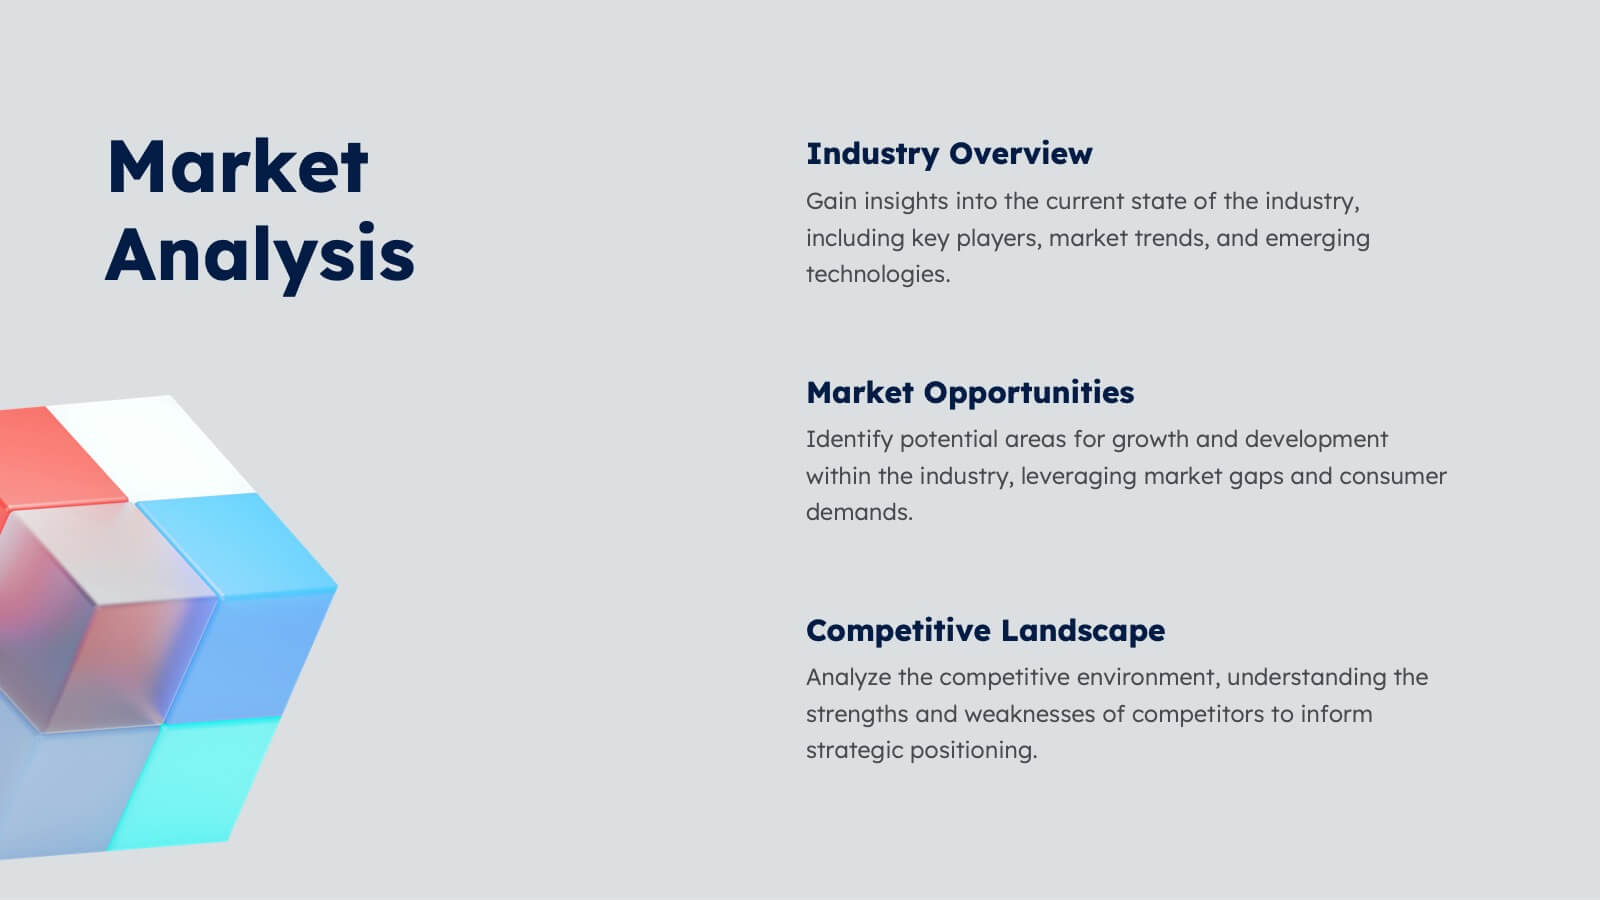
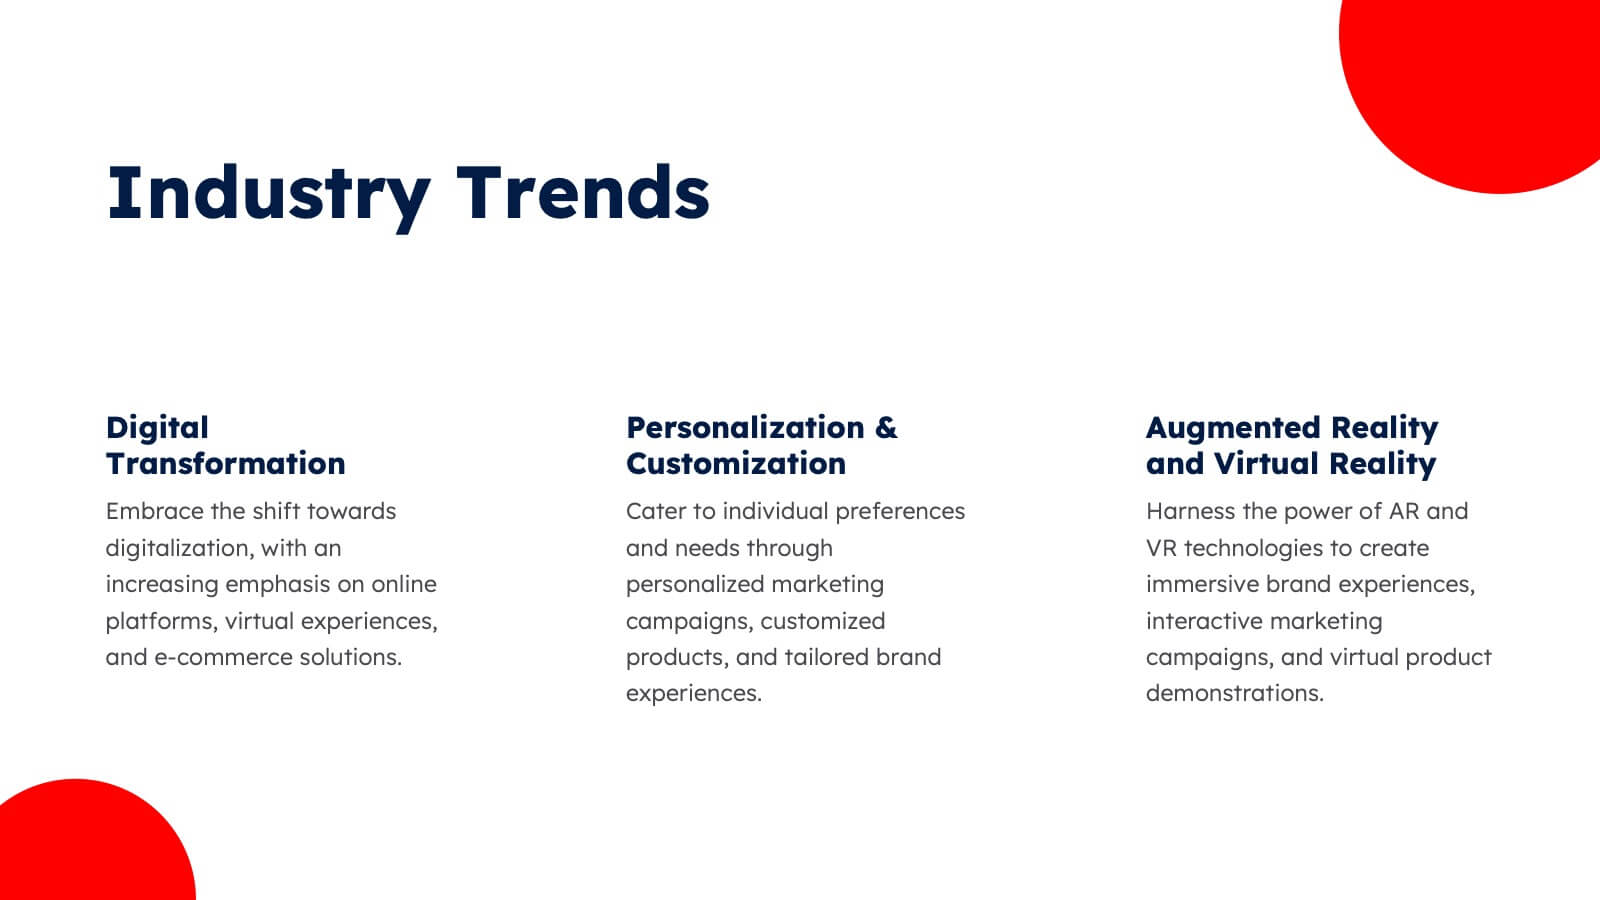
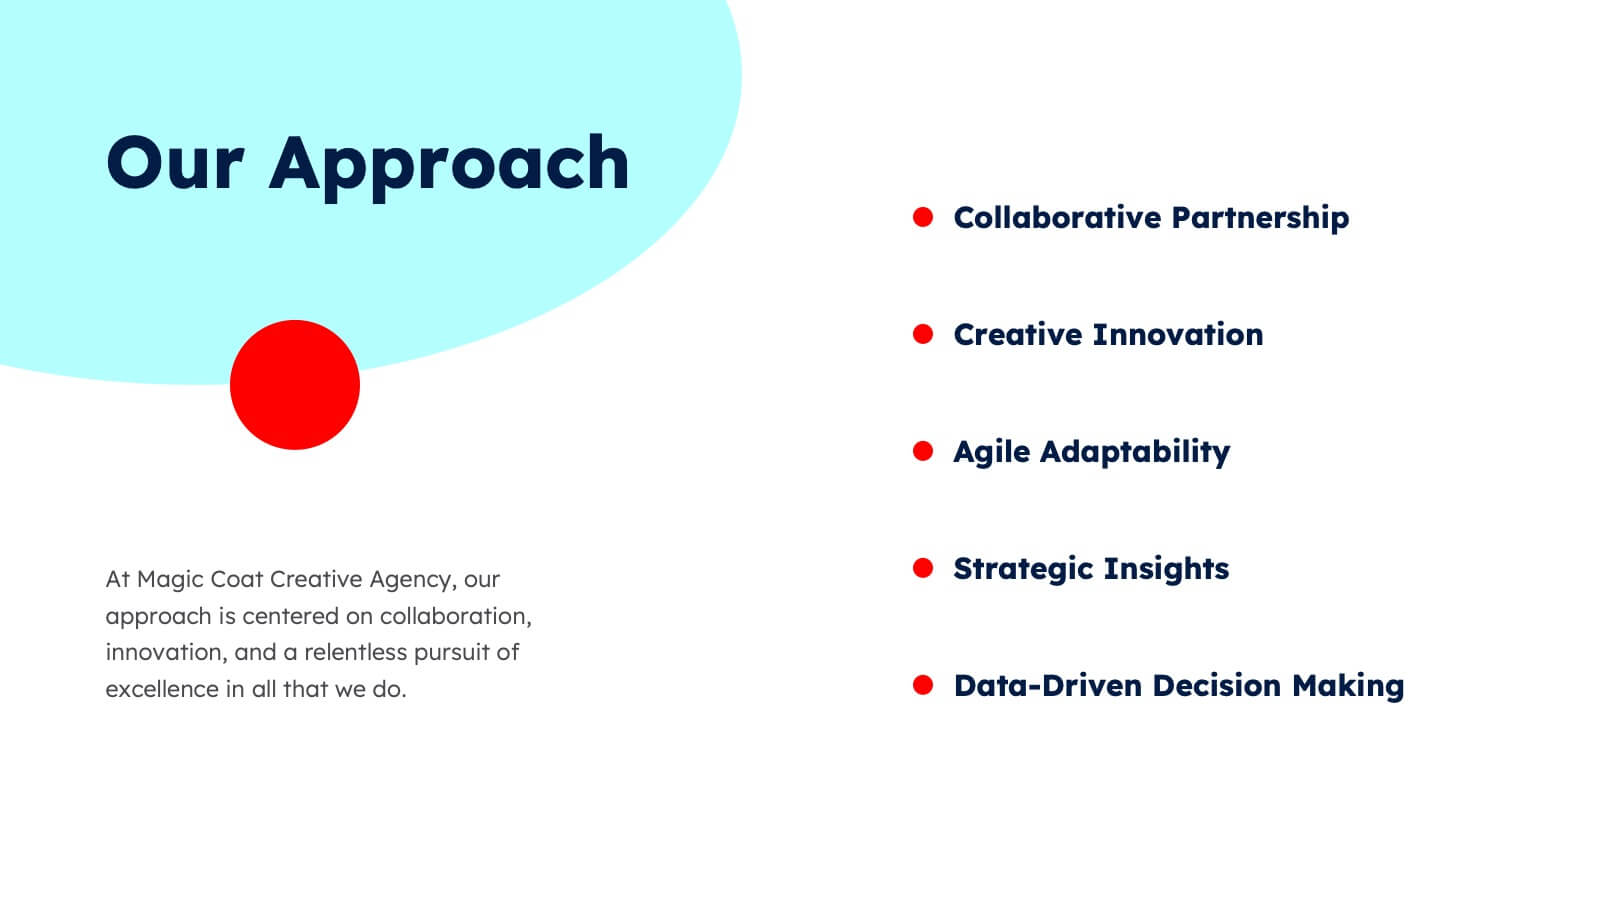
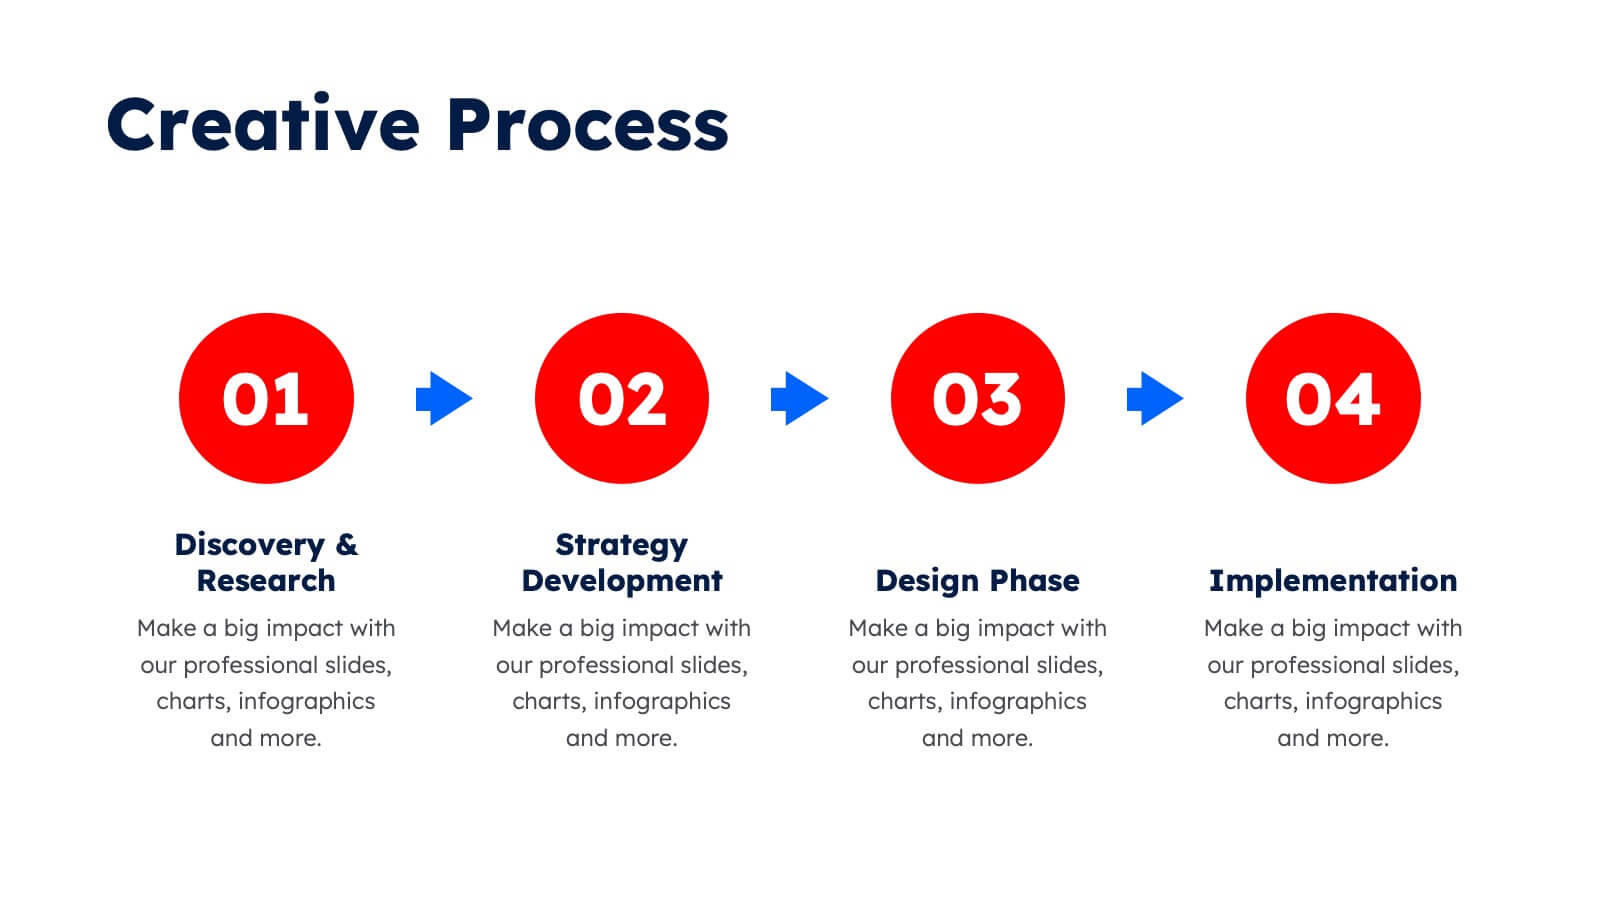
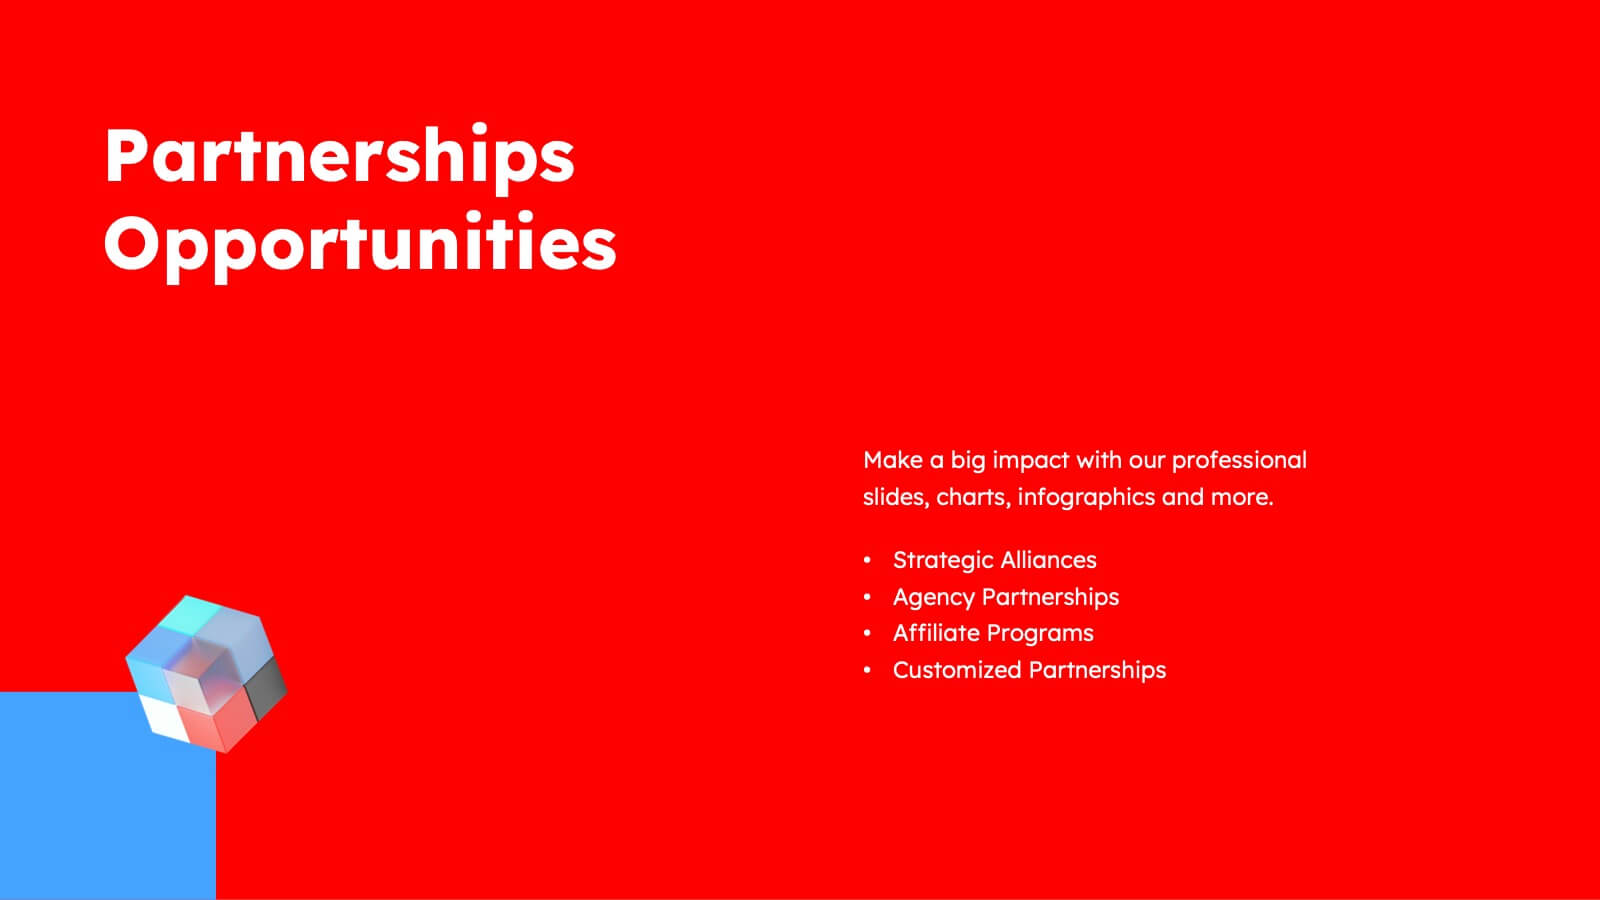
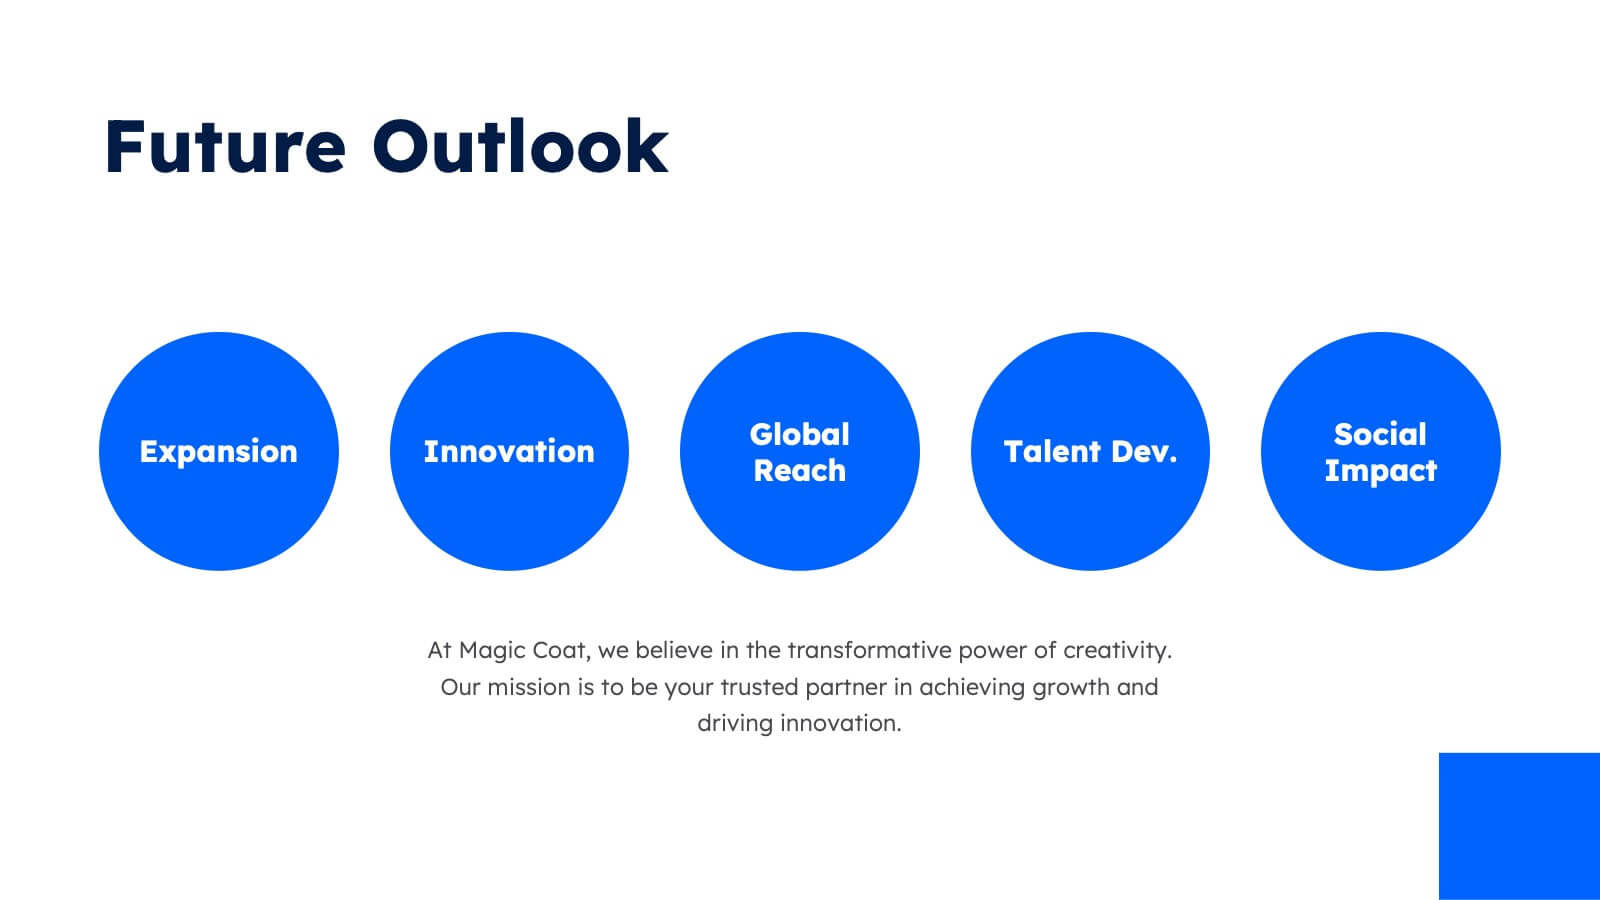
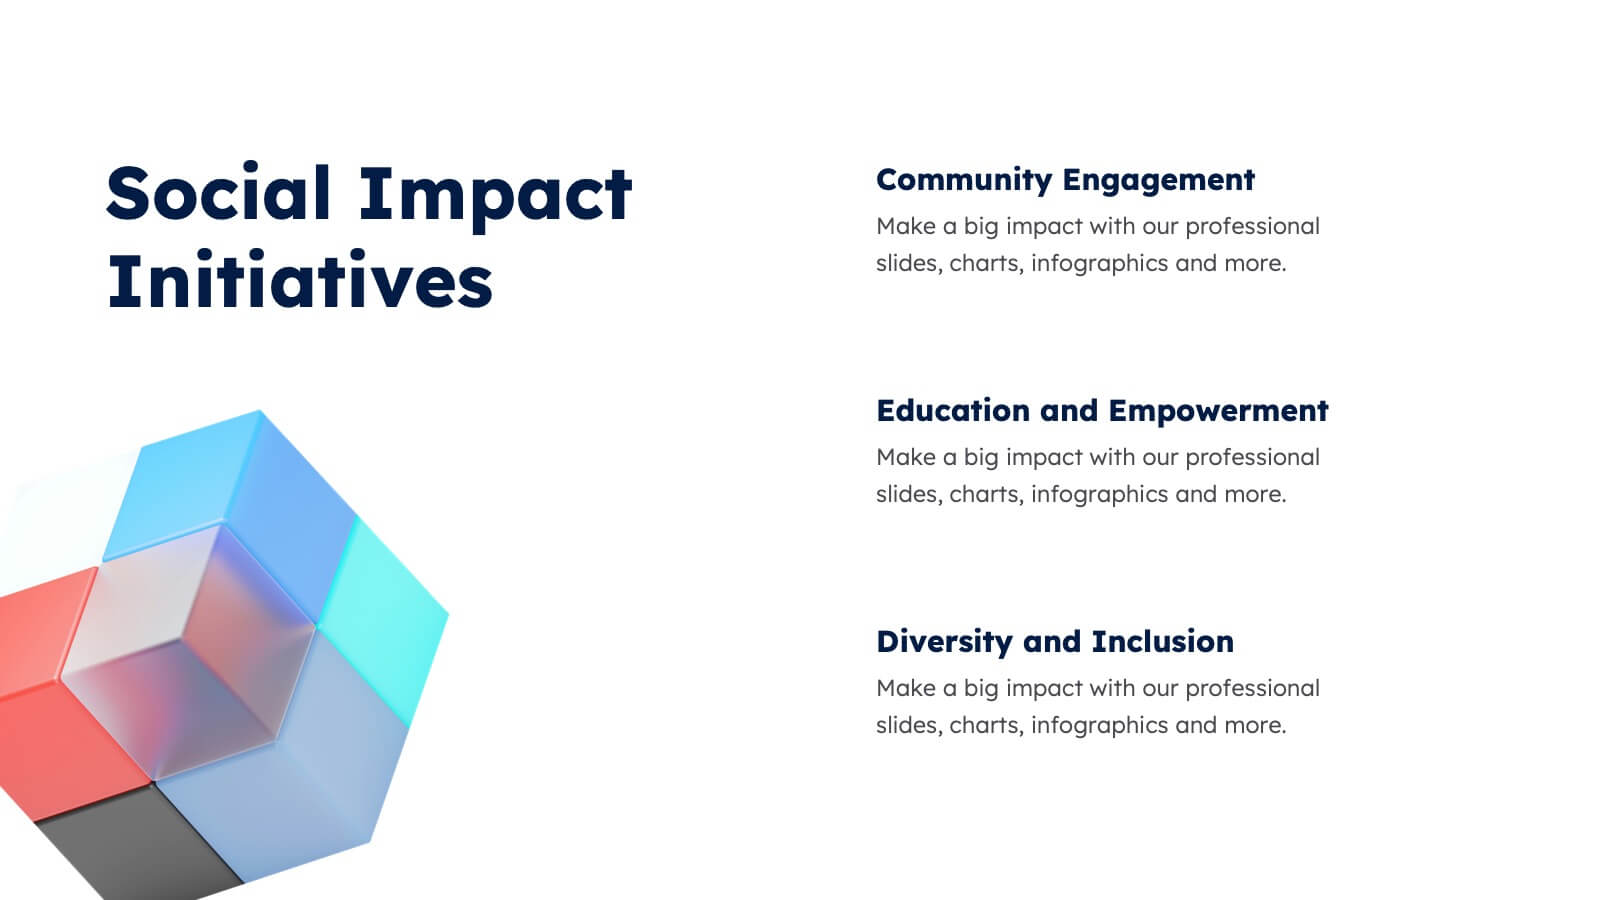
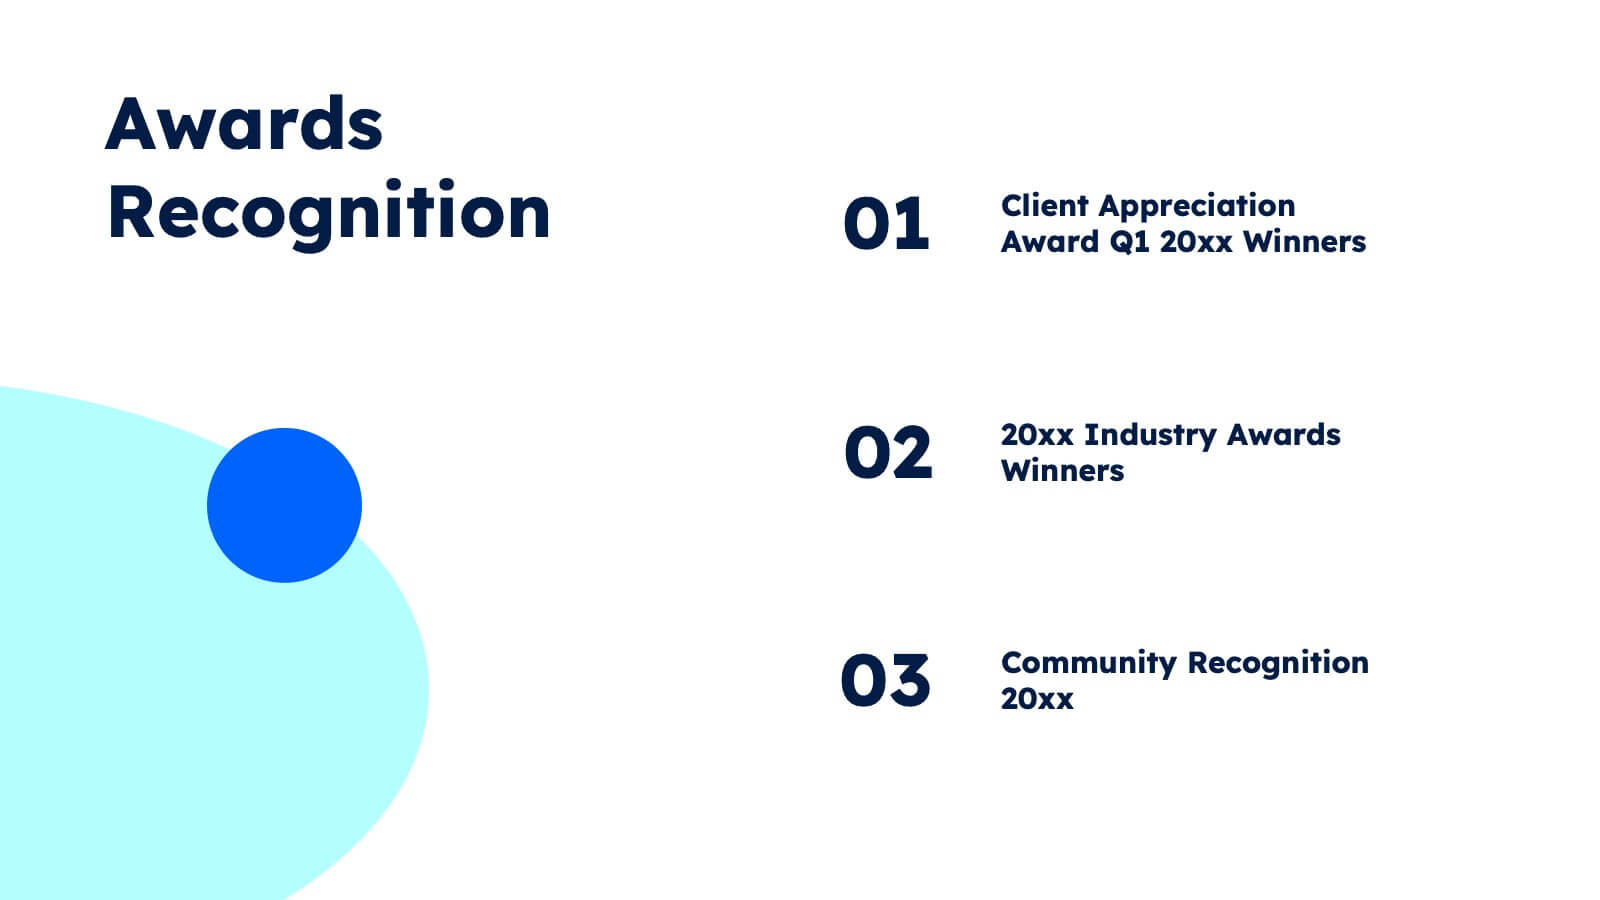
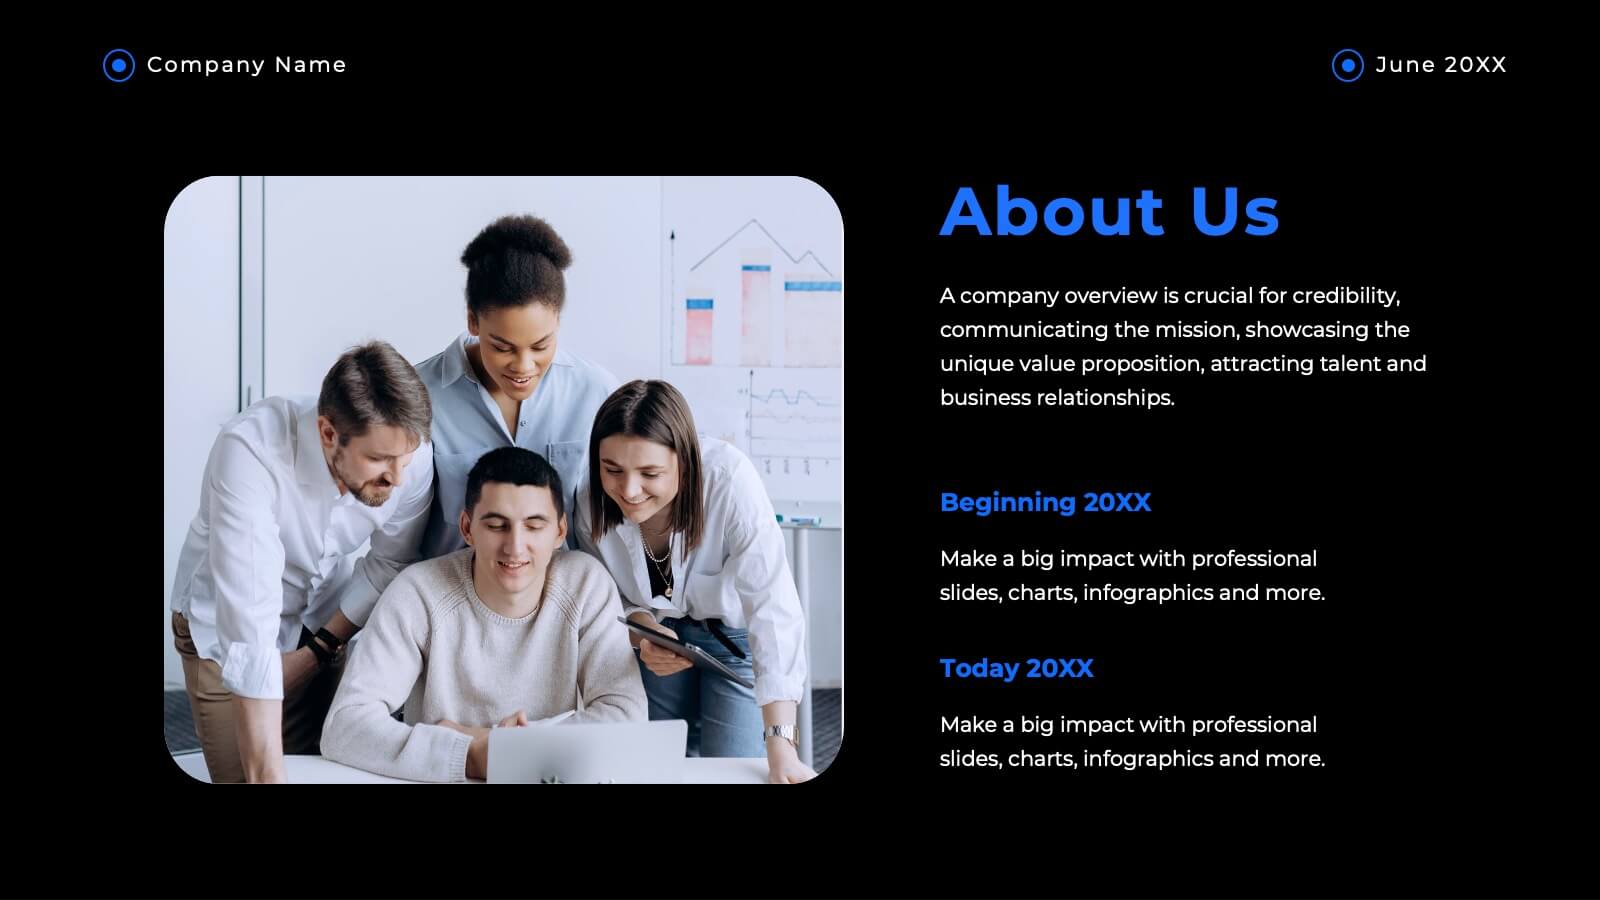
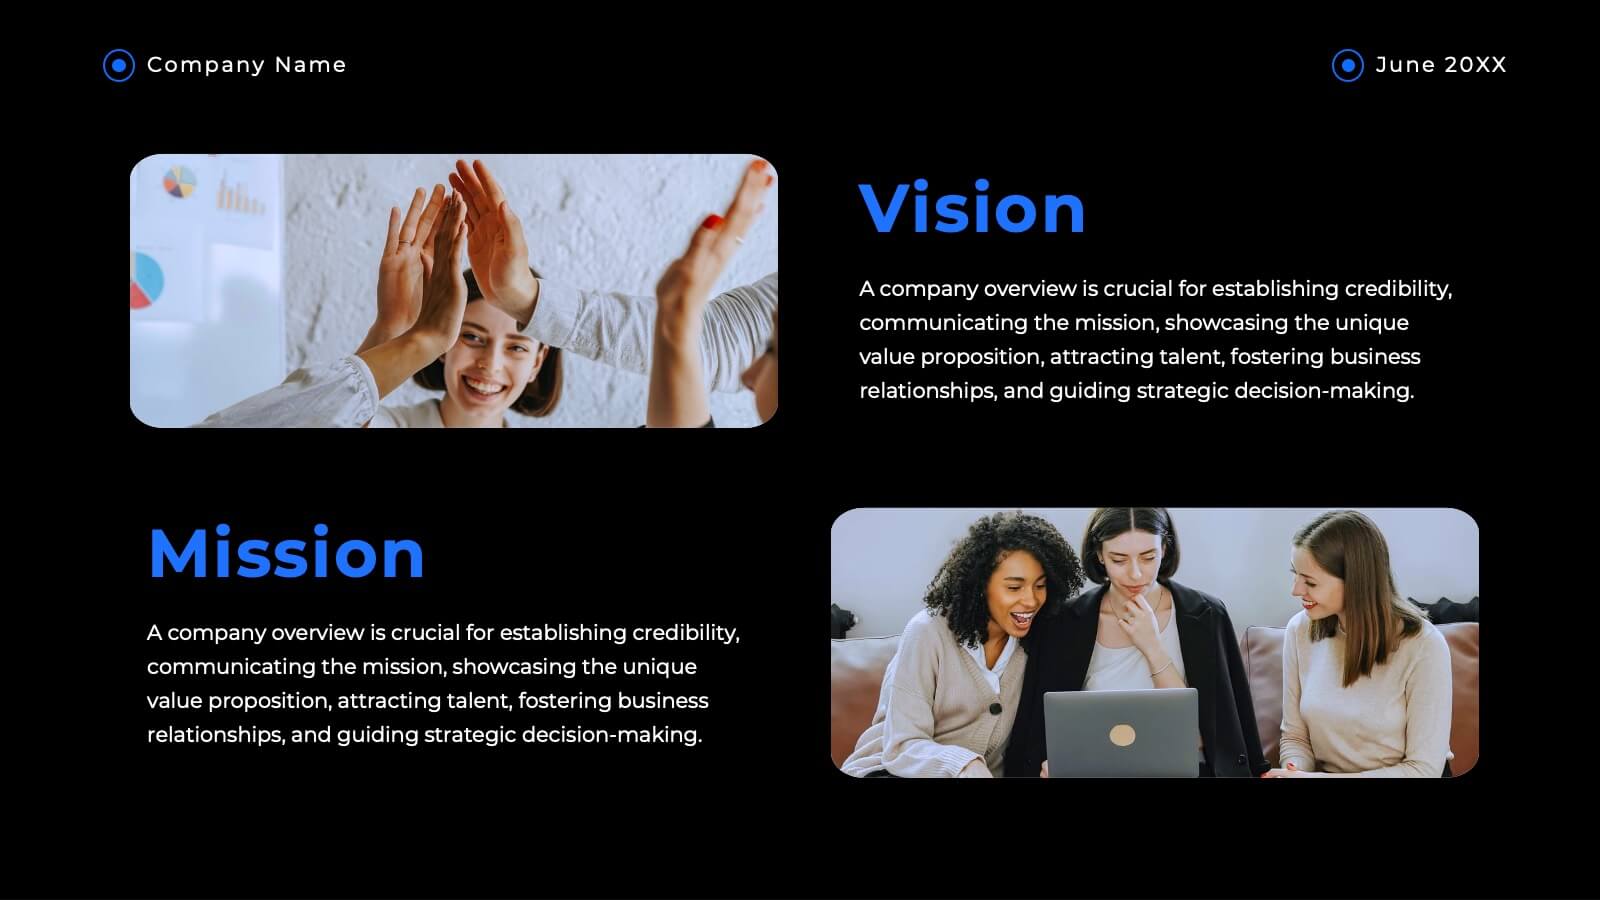
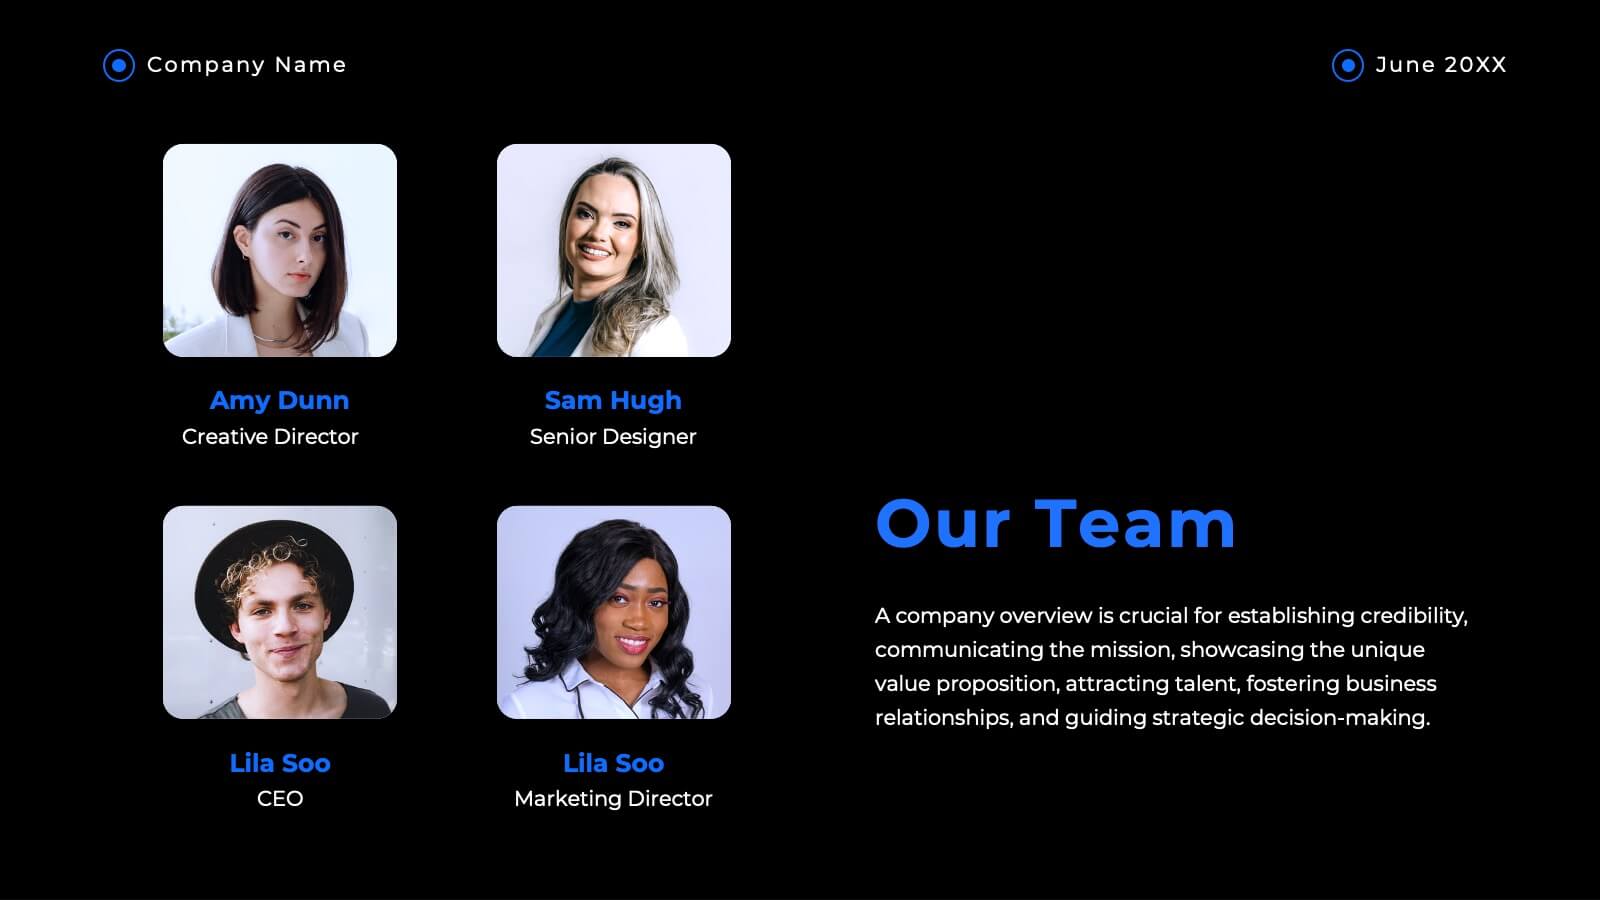
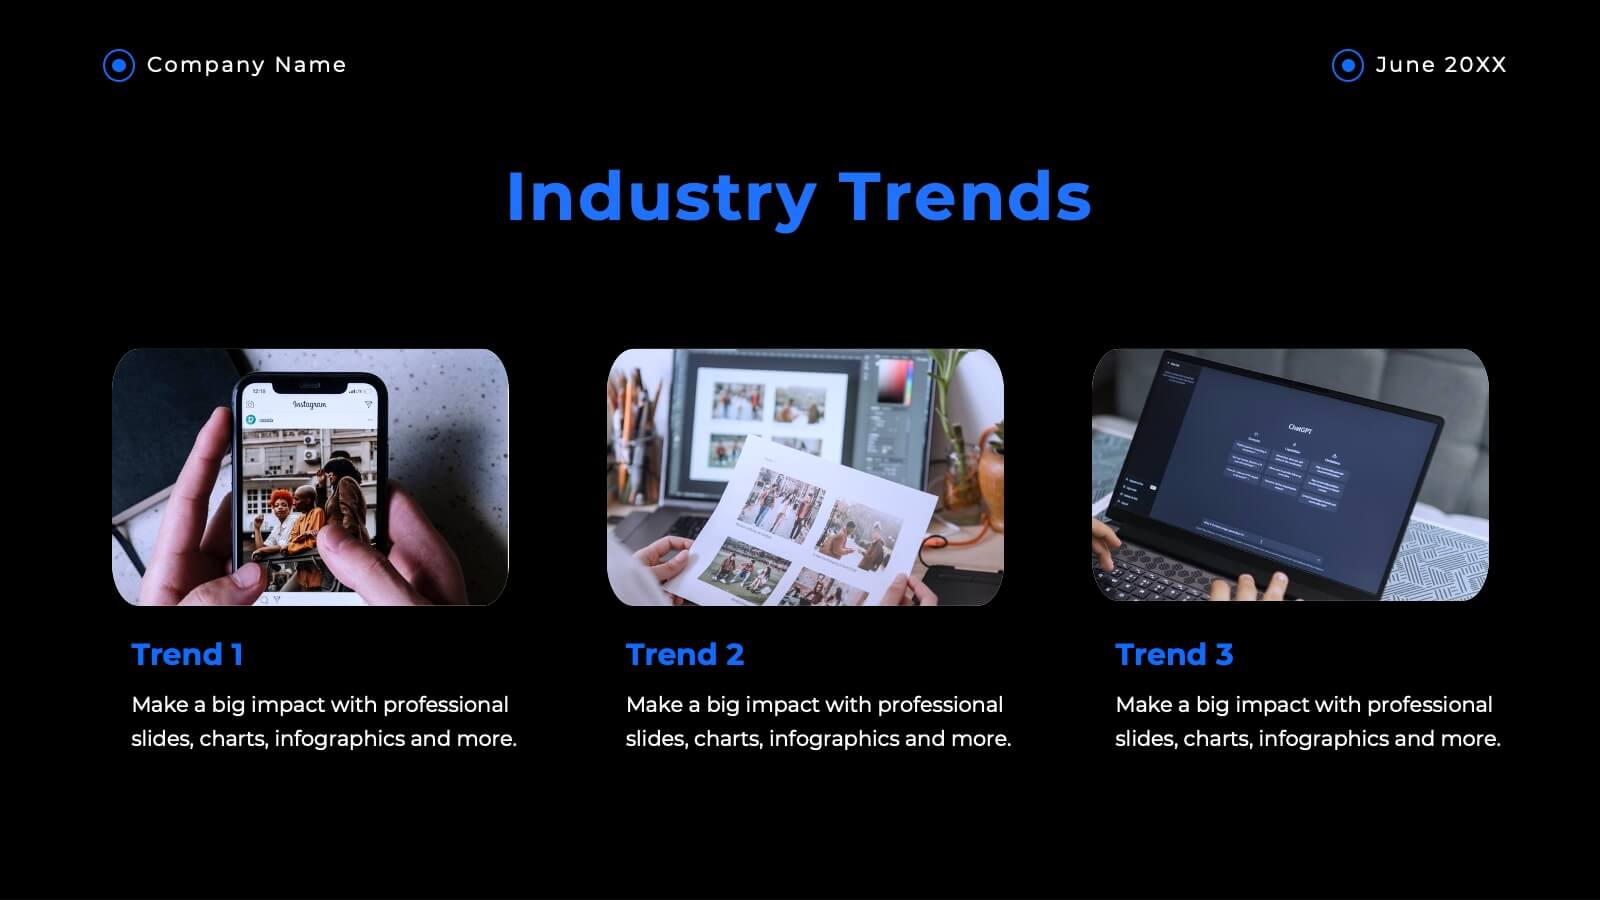
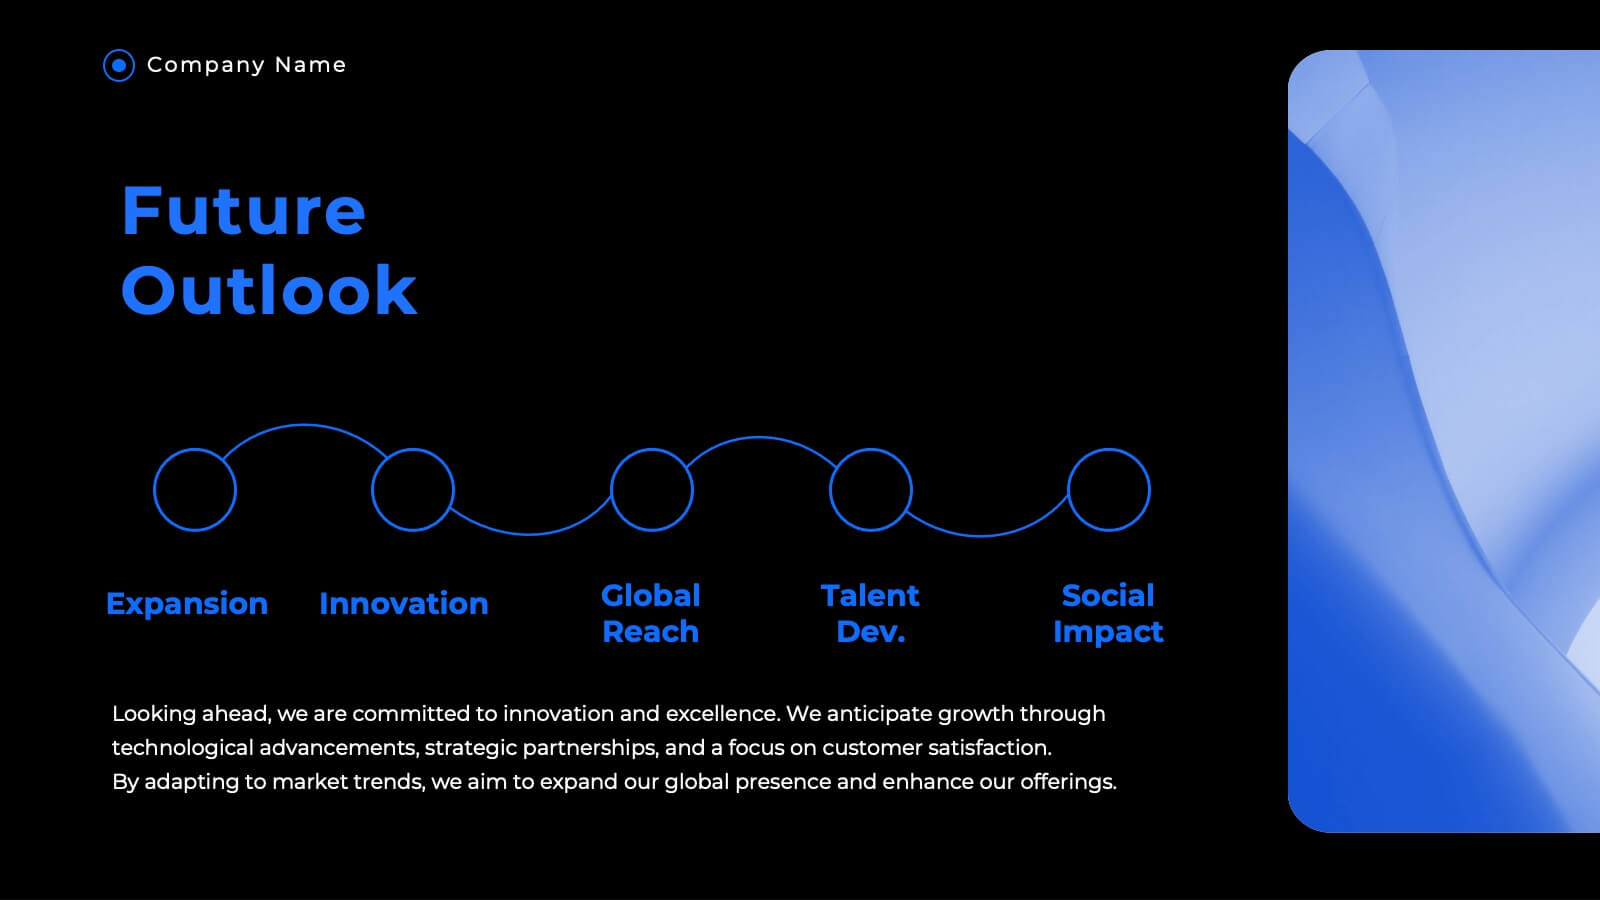
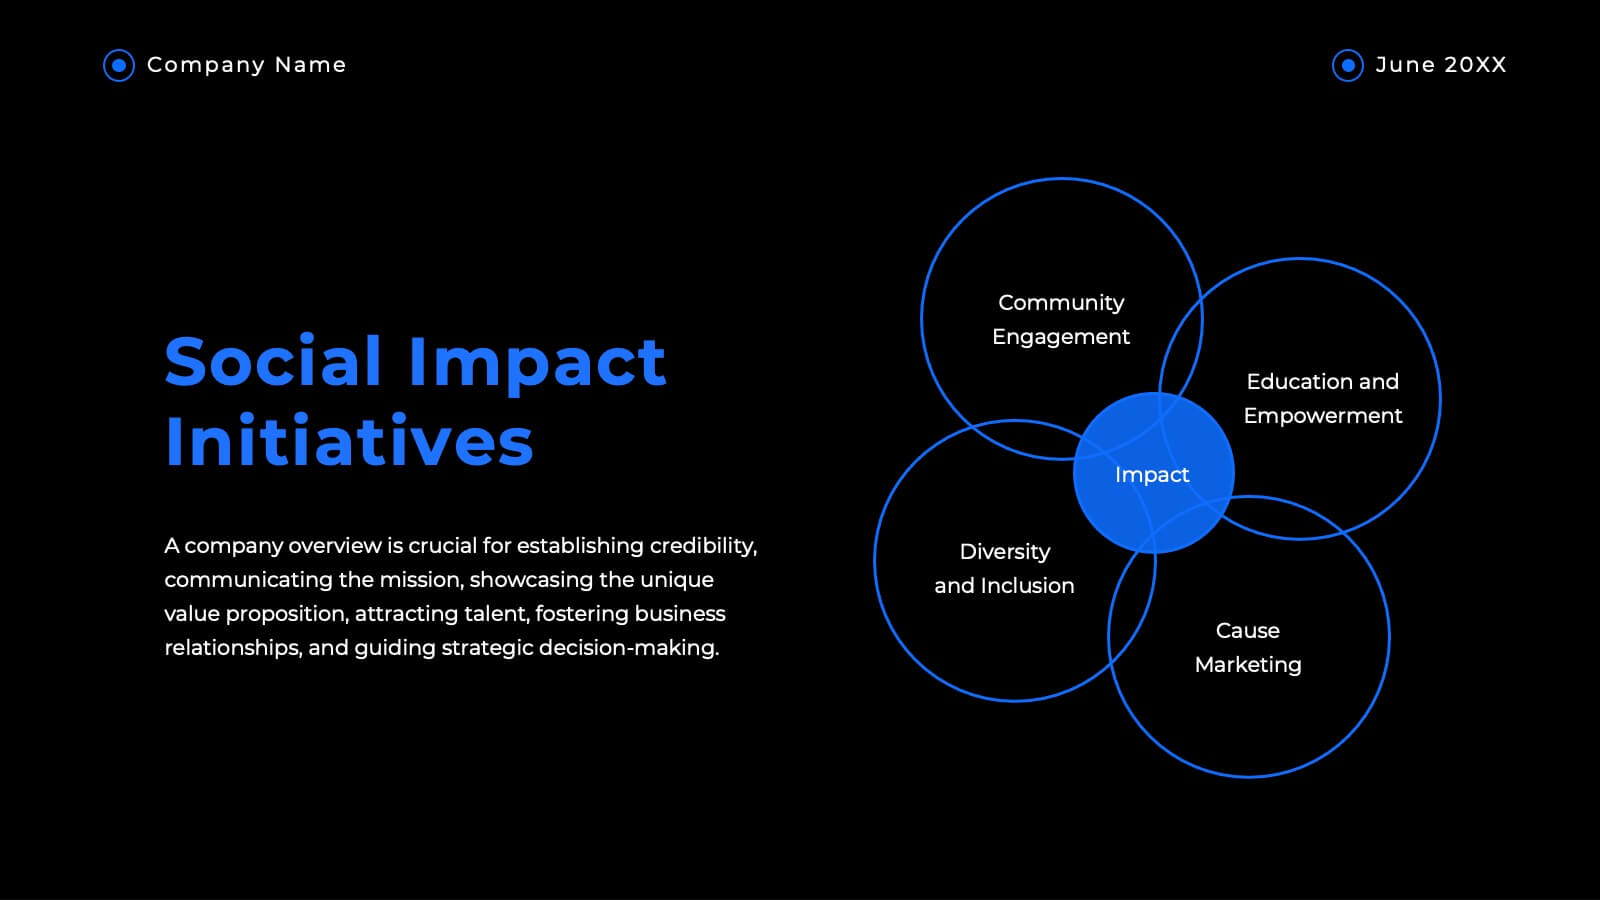
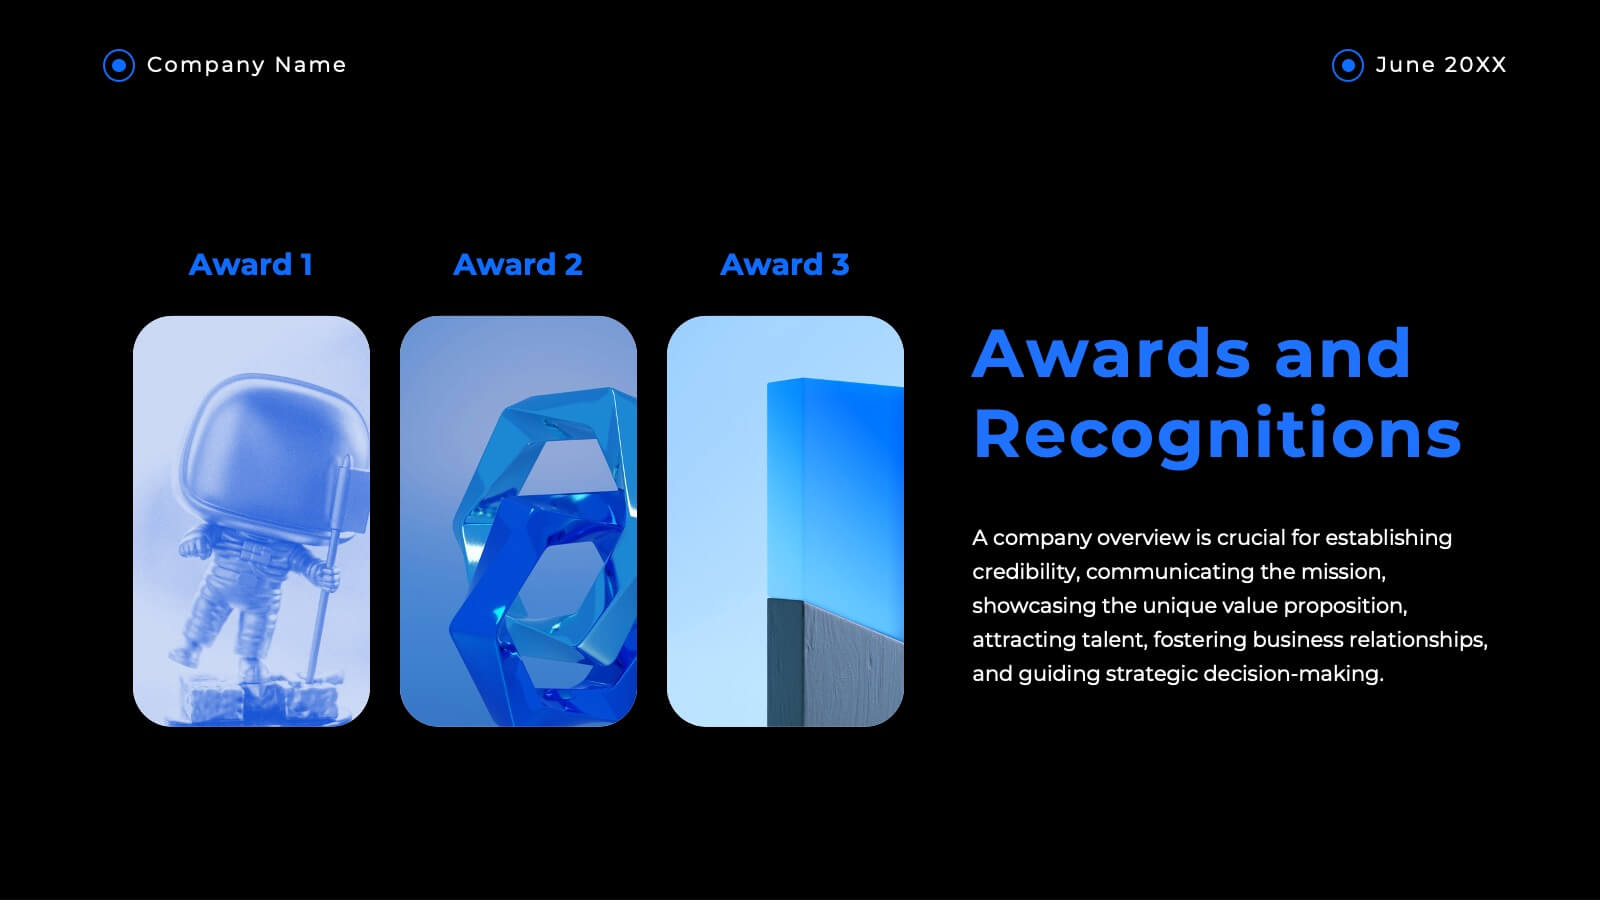
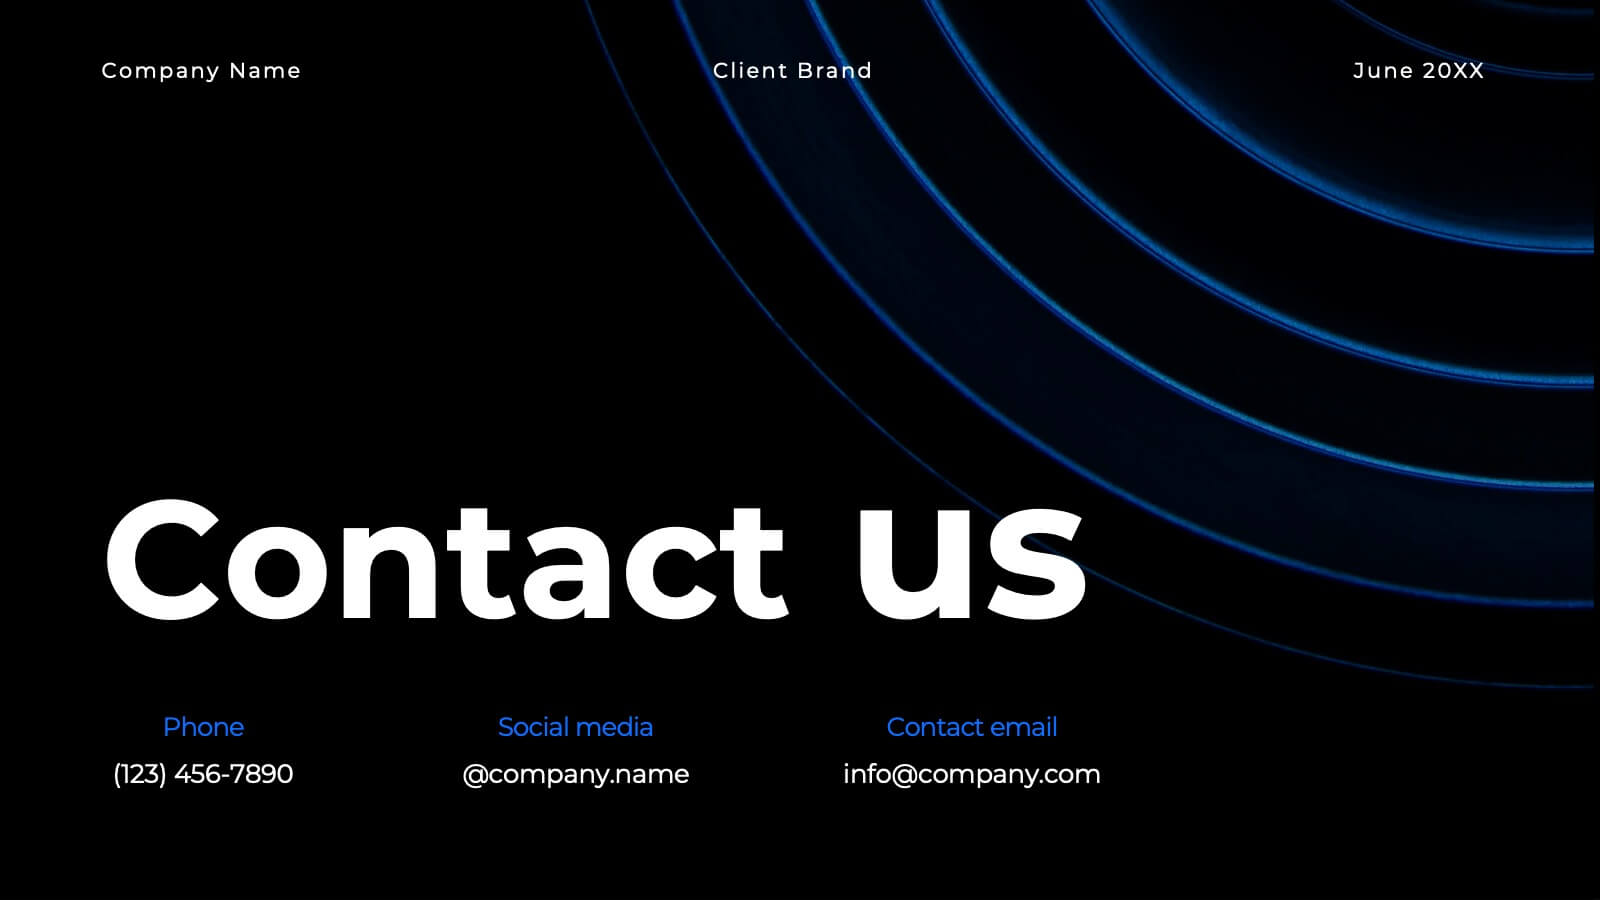
Aura Agency Portfolio Presentation
Showcase your agency's brilliance with this vibrant portfolio presentation template! Ideal for highlighting your mission, vision, case studies, and market analysis, it brings your achievements to life with colorful, engaging slides. Impress clients and partners with a well-structured, visually appealing narrative. Compatible with PowerPoint, Keynote, and Google Slides for easy use on any platform.


4 diapositivas
Workforce Skills Gap Analysis
Spot the gap. Bridge the skills. This Workforce Skills Gap Analysis slide helps visualize the journey from your team’s current capabilities to their desired performance level, with a clear action plan in between. Fully editable and works seamlessly in PowerPoint, Keynote, and Google Slides.


4 diapositivas
Networking Strategy Plan Presentation
Make every connection count with this clean and modern presentation design. Perfect for outlining relationship-building strategies, collaboration methods, or communication plans, it presents ideas clearly using a structured circular layout. Fully customizable and compatible with PowerPoint, Keynote, and Google Slides for a seamless and professional presentation experience.


7 diapositivas
Problem Solution Infographic
The Problem Solution Infographic is a versatile template designed to clearly articulate challenges and corresponding strategies. It guides viewers through a sequence of problem identification to the implementation of solutions, offering a structured approach to problem-solving. This template is perfect for professionals who aim to present issues and their solutions in a logical, step-by-step manner. With its compatibility across PowerPoint, Google Slides, and Keynote, this tool is ideal for workshops, business meetings, academic environments, or any scenario where clear communication of problem-solving is required.


34 diapositivas
Validation Pitch Deck
A Validation Pitch Deck, is a visual presentation that provides an overview of a startup company's business idea, market opportunity, value proposition, and progress towards validation of its concept or product. This template consists of a series of slides that are designed to convey the key elements of your business model in a concise and persuasive manner. Use this template as a tool to communicate your vision, market opportunity, and progress to potential investors or other stakeholders. Compatible with PowerPoint, Keynote, and Google Slides. The color scheme and design elements can be easily customized to match your brand or business.


6 diapositivas
Product Life Cycle Stages and Management Presentation
Visualize the journey from product development to market maturity with this modern, conveyor-style layout. Designed to represent five sequential phases, this presentation is perfect for product managers, marketing teams, or business strategists explaining launch strategies, performance tracking, or growth planning. Fully editable in PowerPoint, Keynote, and Google Slides.


23 diapositivas
Blade Corporate Strategy Proposal Presentation
Prepare to captivate your audience with the Blade Corporate Strategy Proposal template! This sleek and modern design is perfect for professionals looking to present their strategic objectives with clarity and impact. The template features a balanced color palette of blue and white, exuding professionalism while ensuring your content stands out. From analyzing the current landscape to outlining key challenges and growth opportunities, each slide is meticulously crafted to convey your strategic vision effectively. The clean layout ensures that complex data, such as SWOT analysis, performance metrics, and competitive analysis, is easily digestible. With dedicated sections for team roles, resource allocation, and timelines, this template helps you guide your audience through every step of your strategic plan. Fully compatible with PowerPoint, Keynote, and Google Slides, the Blade template is your go-to choice for delivering presentations that resonate with decision-makers and stakeholders alike.


10 diapositivas
Customer Demographic Breakdown Presentation
Give your insights a bold, modern look with a clear visual layout that turns customer data into an easy-to-follow story. This presentation helps you explain key demographic patterns, highlight audience behavior, and support smarter decisions with clean, structured visuals. Fully editable and compatible with PowerPoint, Keynote, and Google Slides.


26 diapositivas
Azahar Presentation Template
Azahar is a perfect modern template with a clean and professional feel. This theme can help your business connect with clients through an easy to understand template. Azahar was designed by professionals to help businesses connect with their audience. It has a modern, chic aesthetic and very detailed look. The colors are fresh which help keep the look clean and easy to read. The theme comes packed with features to target your audience and get your message across. Charts, timelines and easy to edit text, this template is perfect for businesses seeking to make an impression on their audience.


12 diapositivas
Creative Mind Map Presentation
Unlock new perspectives with the Creative Mind Map Presentation. Designed to visualize brainstorming, strategic thinking, or concept development, this template offers an intuitive radial layout to highlight five key ideas. Fully customizable and ideal for professionals, educators, and creatives. Compatible with PowerPoint, Keynote, and Google Slides for seamless use.


4 diapositivas
Operational KPI Monitoring Dashboard
Stay on top of business performance with the Operational KPI Monitoring Dashboard Presentation. This slide is designed to visually communicate key operational metrics using gradient-filled progress bars, percentage indicators, and area charts. Perfect for status updates, executive reporting, or performance reviews, it enables quick analysis of KPIs at a glance. Fully customizable in PowerPoint, Keynote, and Google Slides.


7 diapositivas
Business Strategy Options Presentation
Bring clarity to your strategic choices with a clean, modern layout that helps you present multiple business directions side by side. Ideal for showcasing growth plans, decision paths, or market approaches, this presentation makes strategy easy to follow. Fully compatible with PowerPoint, Keynote, and Google Slides for effortless editing.


5 diapositivas
Energy Sources in The United States Infographics
Energy Sources in The United States Infographics is a bold, colorful, and modern presentation


7 diapositivas
Executive Summary Infographic Presentation Template
An Executive Summary is a document that provides an overview of the main points of a larger report. It is often written to share with individuals who may not have time to review the entire report. The executive summary provides a summary that sets out what's in the report, who it is written for, what it covers and why it's important. Use this template to create a powerful summary, which makes it easier to communicate your engagement results and outline your most important points. This template was designed to suggest a number of ways to enhance your executive summary and make it more persuasive.


3 diapositivas
Workflow Improvement and Progress Chart Presentation
Folders aren't just for files—they’re perfect for ideas too. This visual chart maps out streamlined processes, making it easier to track progress and improve internal workflow. Great for managers and teams, this infographic presentation template is fully compatible with PowerPoint, Keynote, and Google Slides for effortless editing and sharing.
22 diapositivas
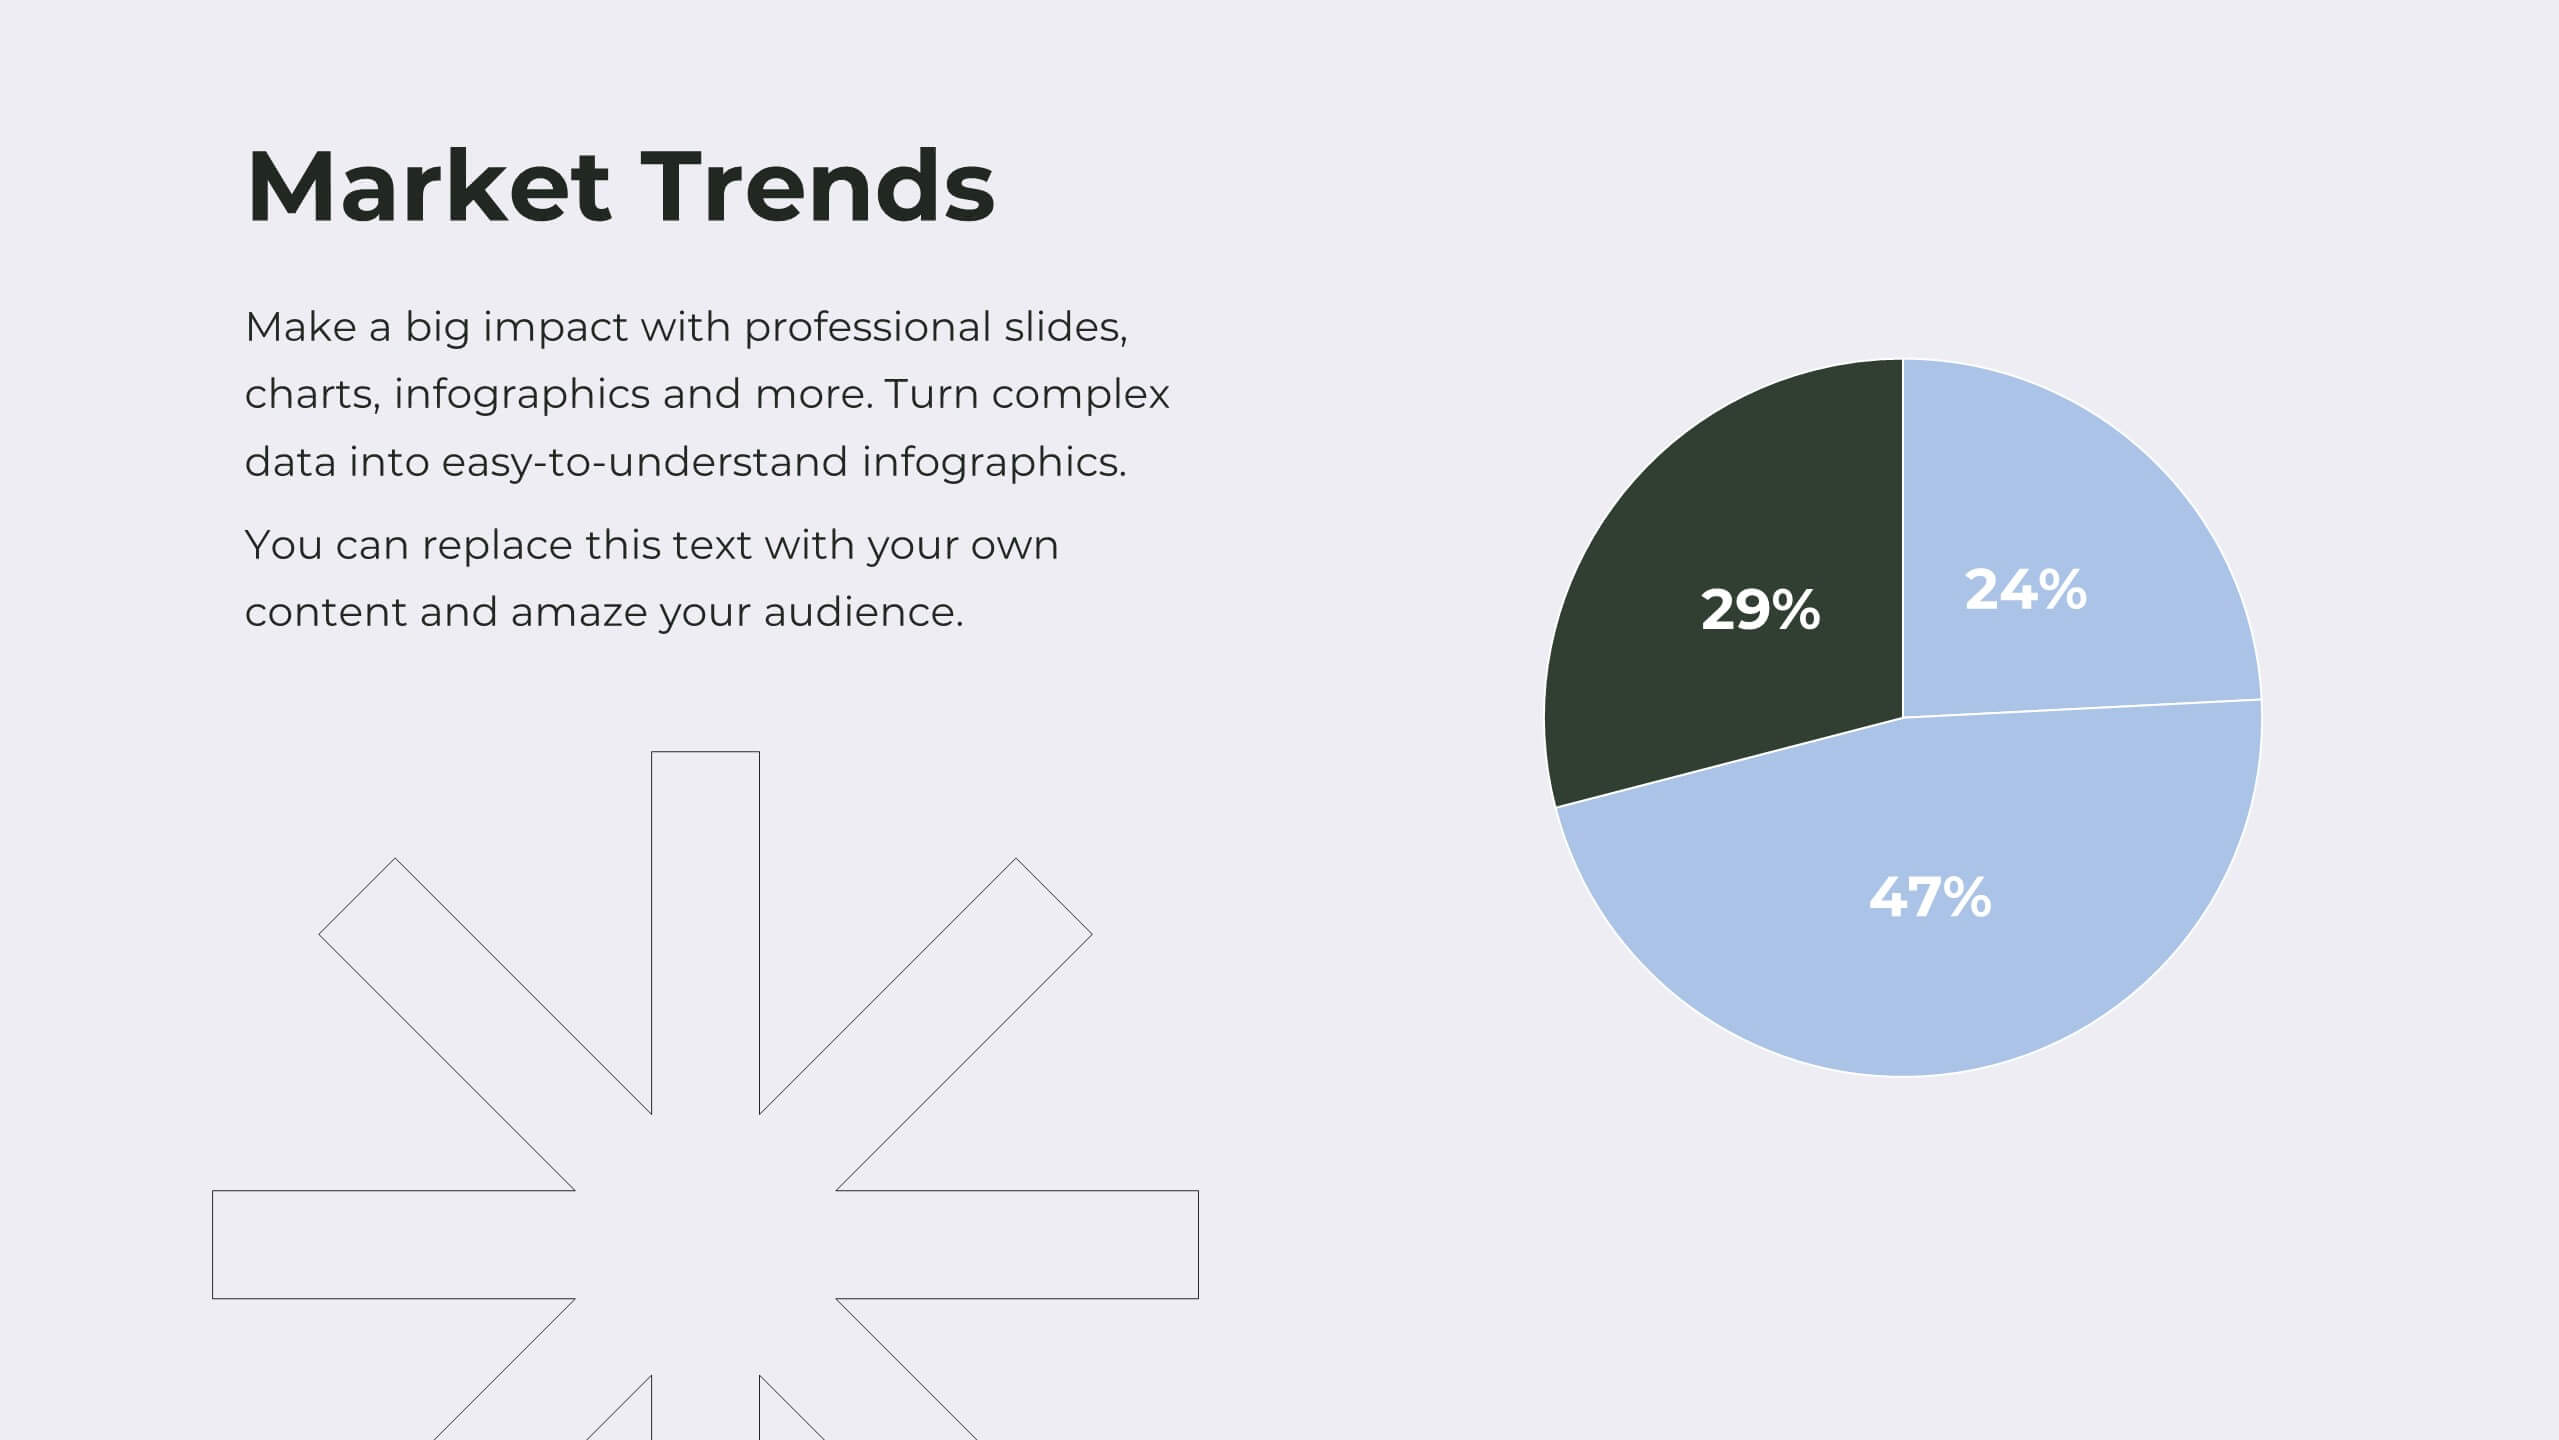
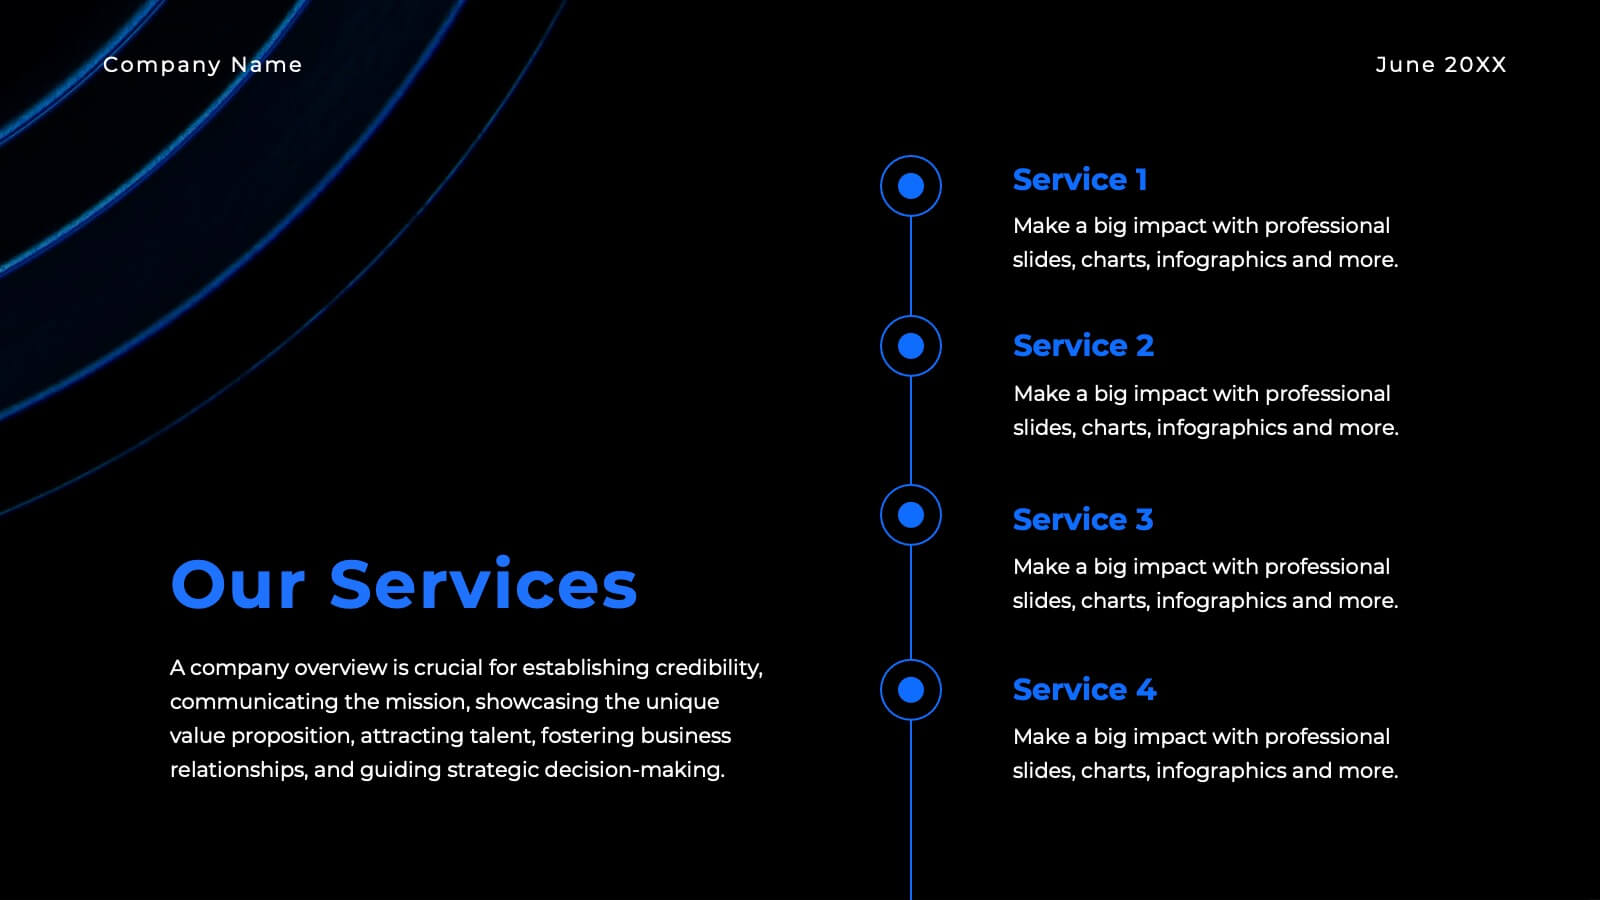
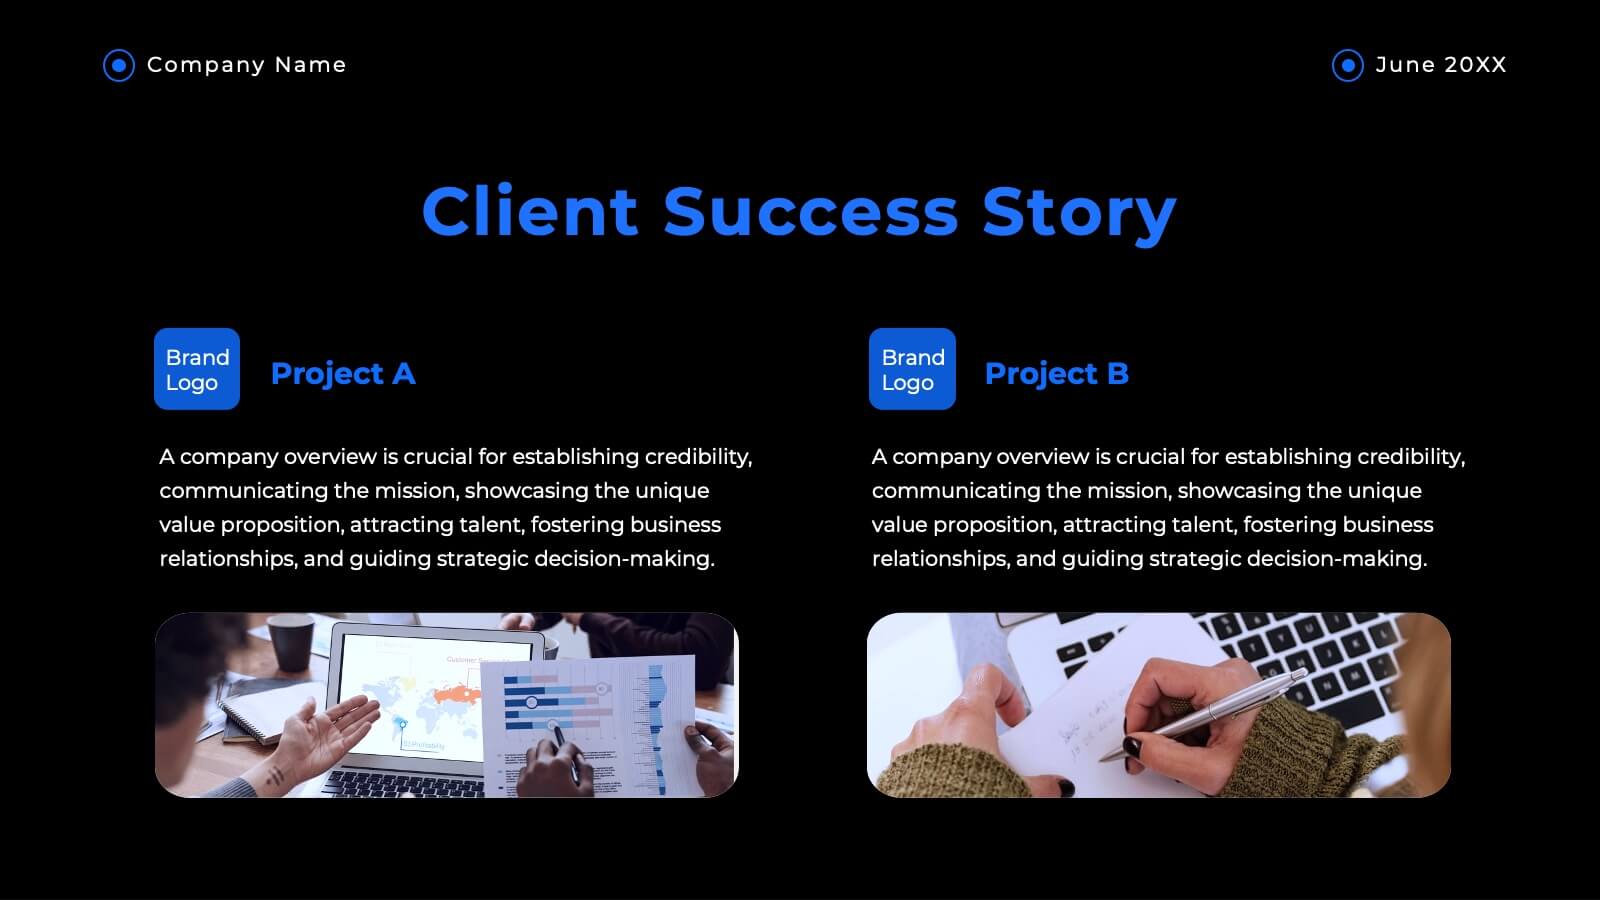
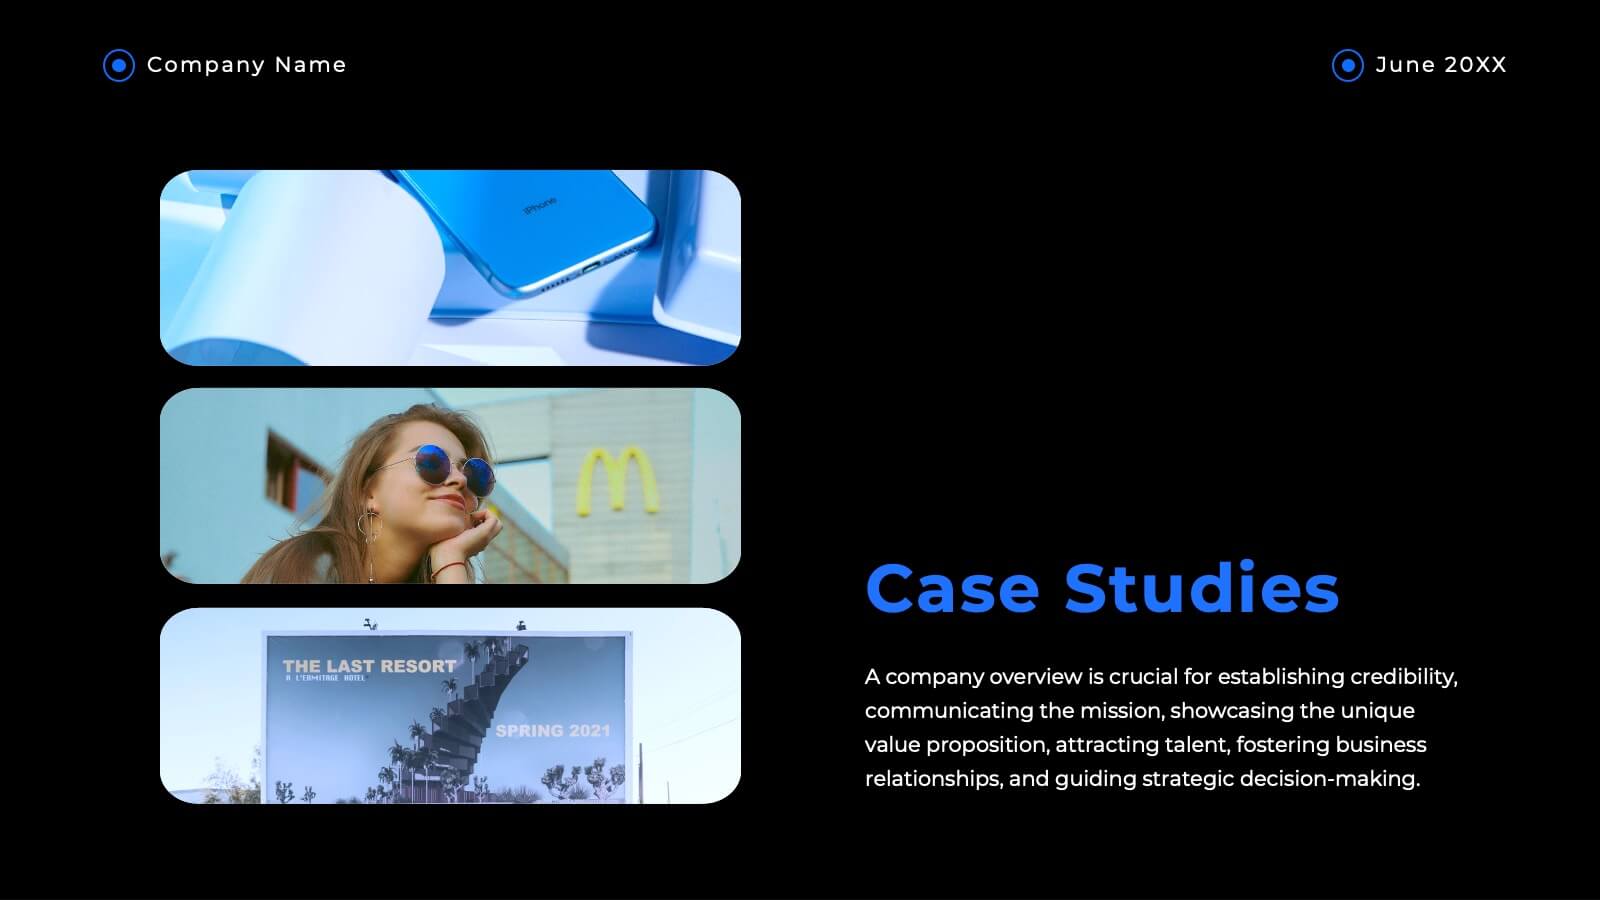
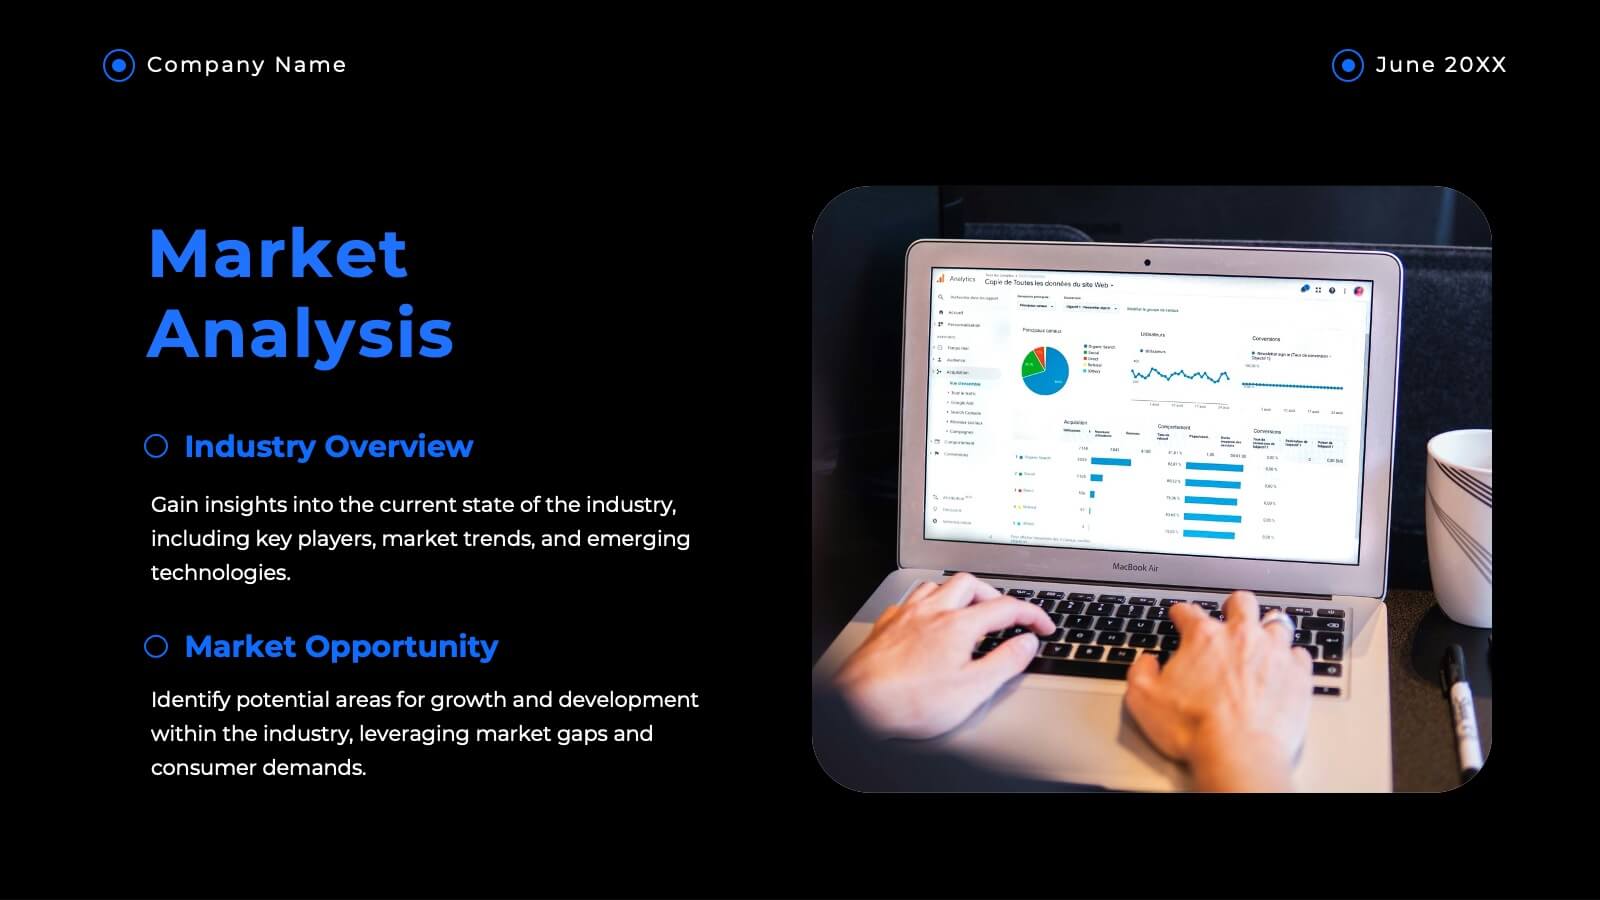
Haven Advertising Agency Proposal Presentation
Wow your clients with this sophisticated agency presentation template! Perfect for showcasing your services, client success stories, and market analysis. Ideal for agencies looking to impress and secure new business. Compatible with PowerPoint, Keynote, and Google Slides, this template ensures your proposals stand out with professional elegance. Perfect for any pitch or proposal.


4 diapositivas
Vision Statement Development Framework Presentation
Define and refine your company’s future with the Vision Statement Development Framework. This clean, step-by-step infographic guides you through creating a focused and inspiring vision statement. Ideal for strategic sessions, leadership presentations, and goal-setting workshops. Fully editable in PowerPoint, Canva, and Google Slides for seamless customization.