


Características


¿Tienes alguna pregunta?
Recomendar


6 diapositivas
Strategic Task and To-Do List Slide Presentation
Keep your team aligned and on track with the Strategic Task and To-Do List Slide Presentation. This layout is ideal for showcasing action items, project priorities, and status updates using a visual notepad style. Color-coded sections and checkmark indicators make it easy to communicate task progress. Fully customizable in PowerPoint, Keynote, and Google Slides.


21 diapositivas
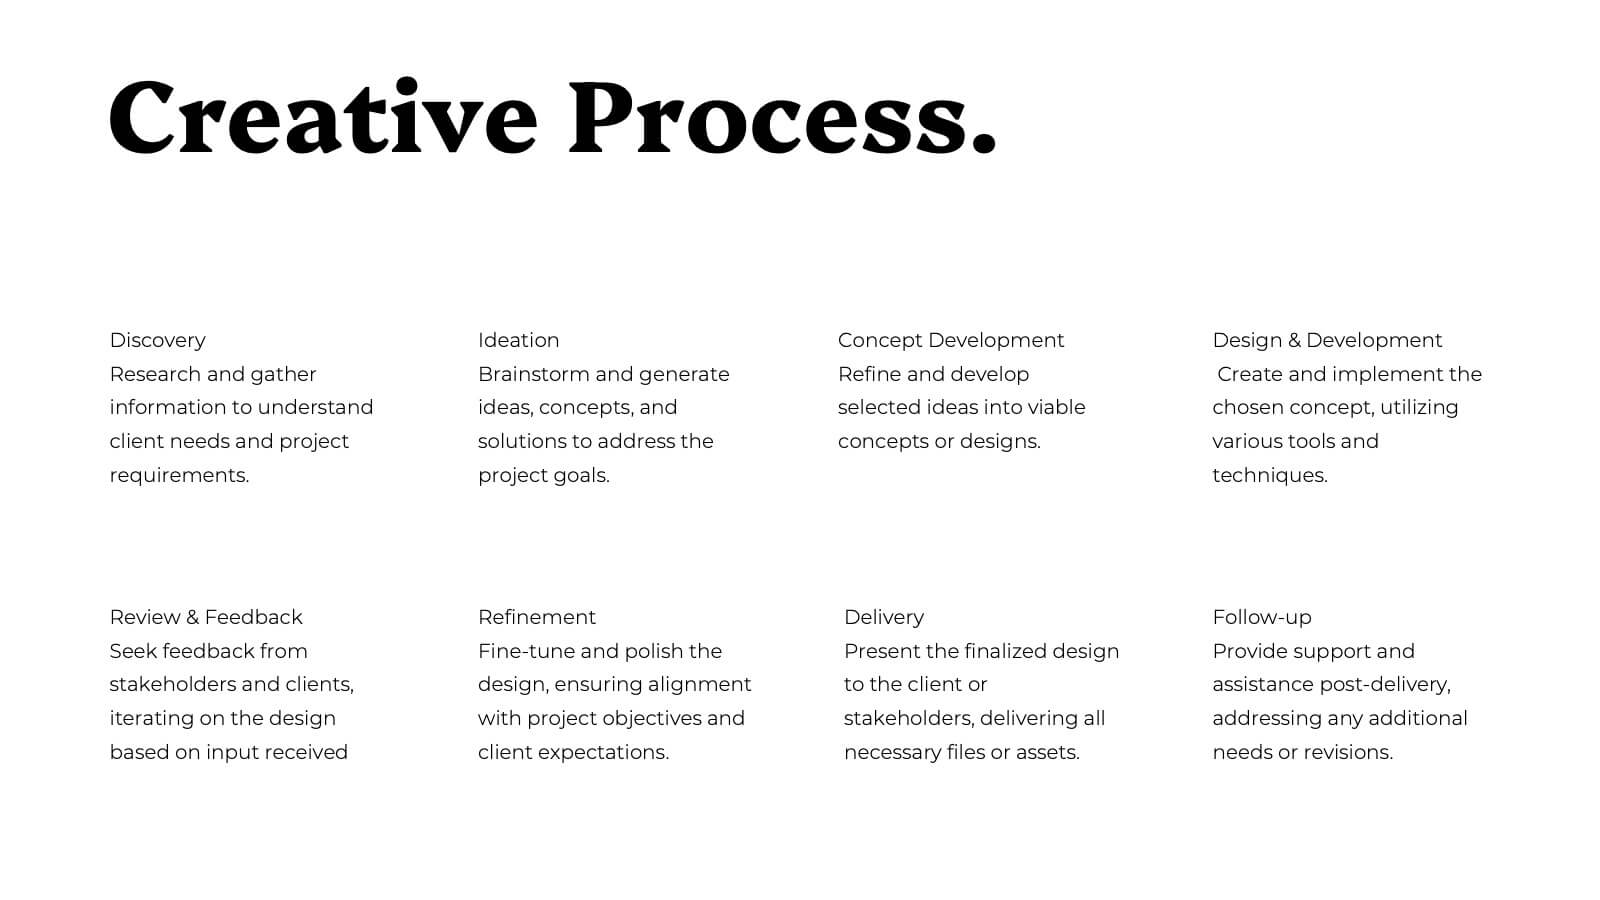
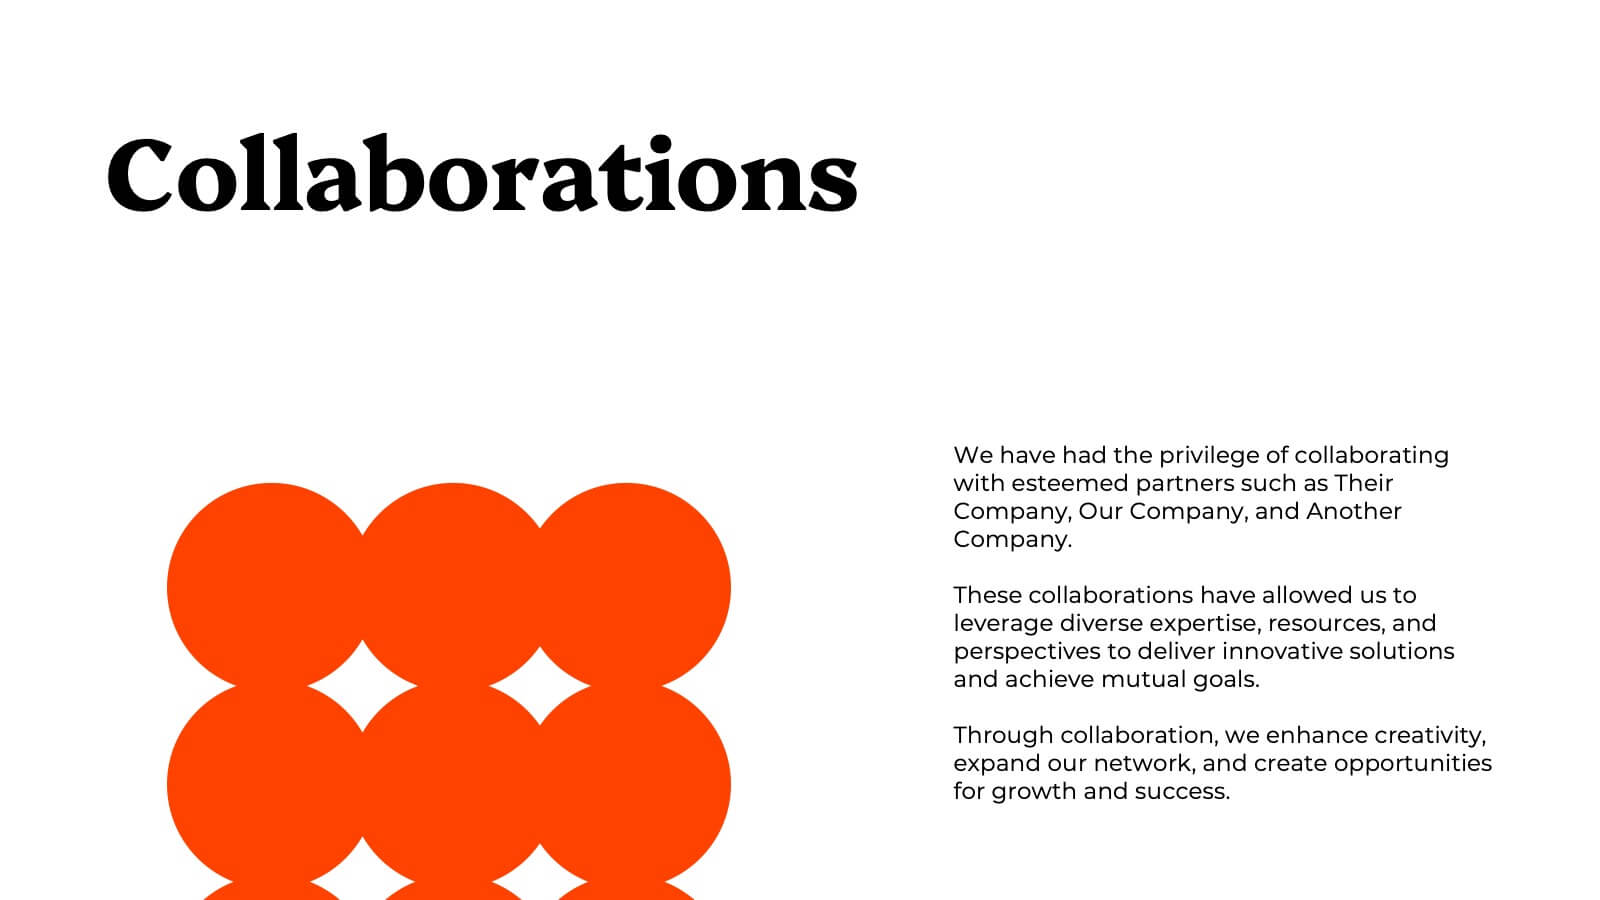
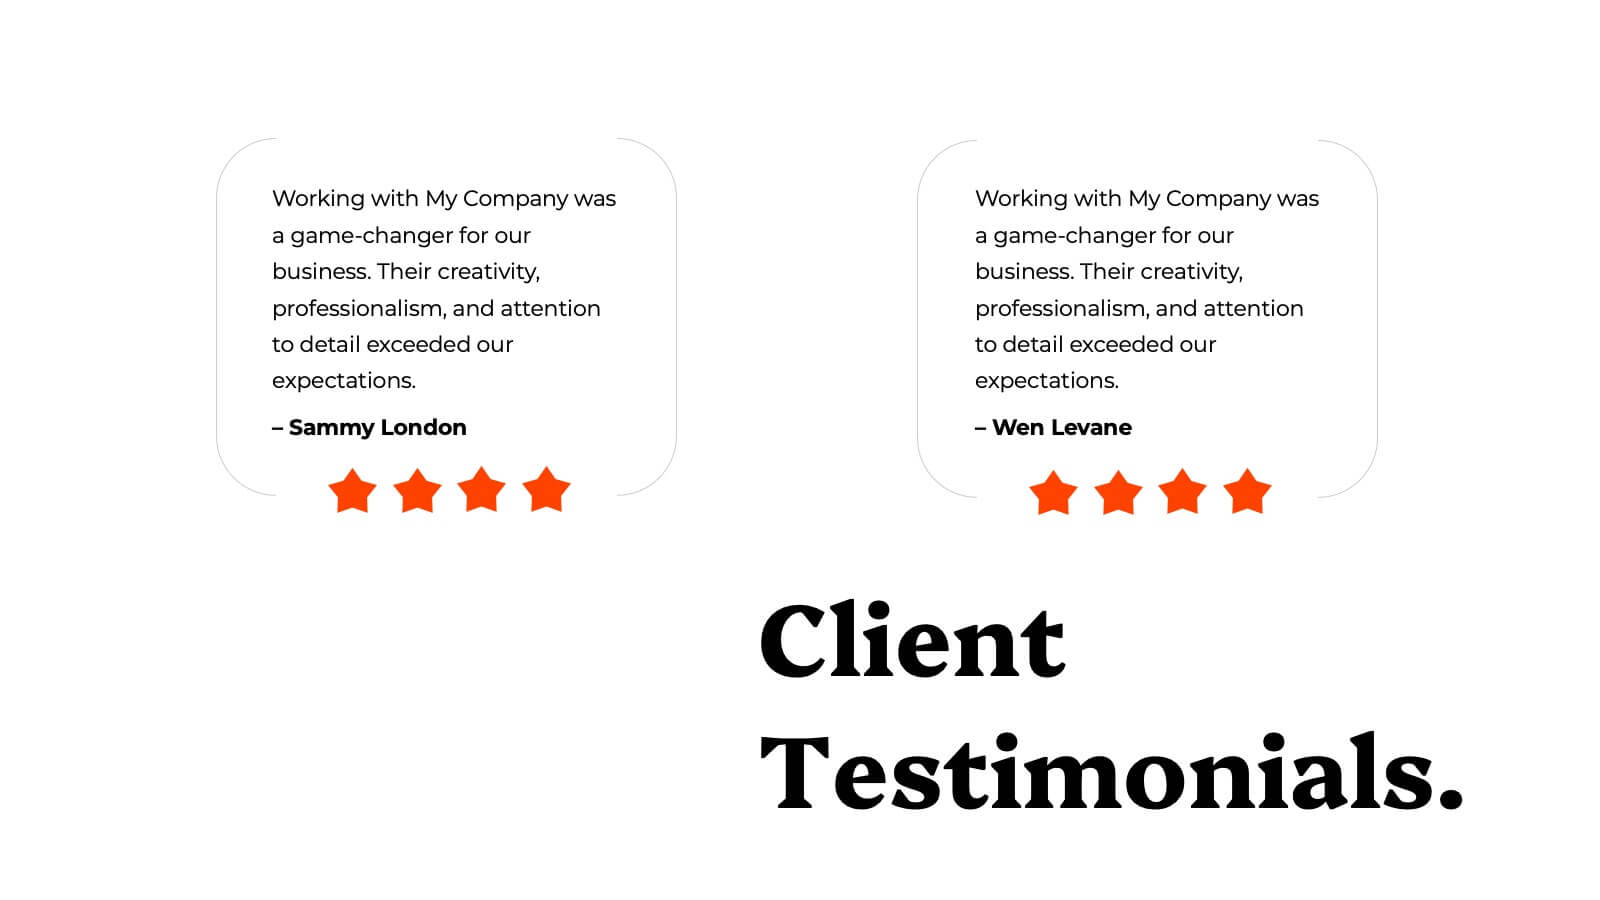
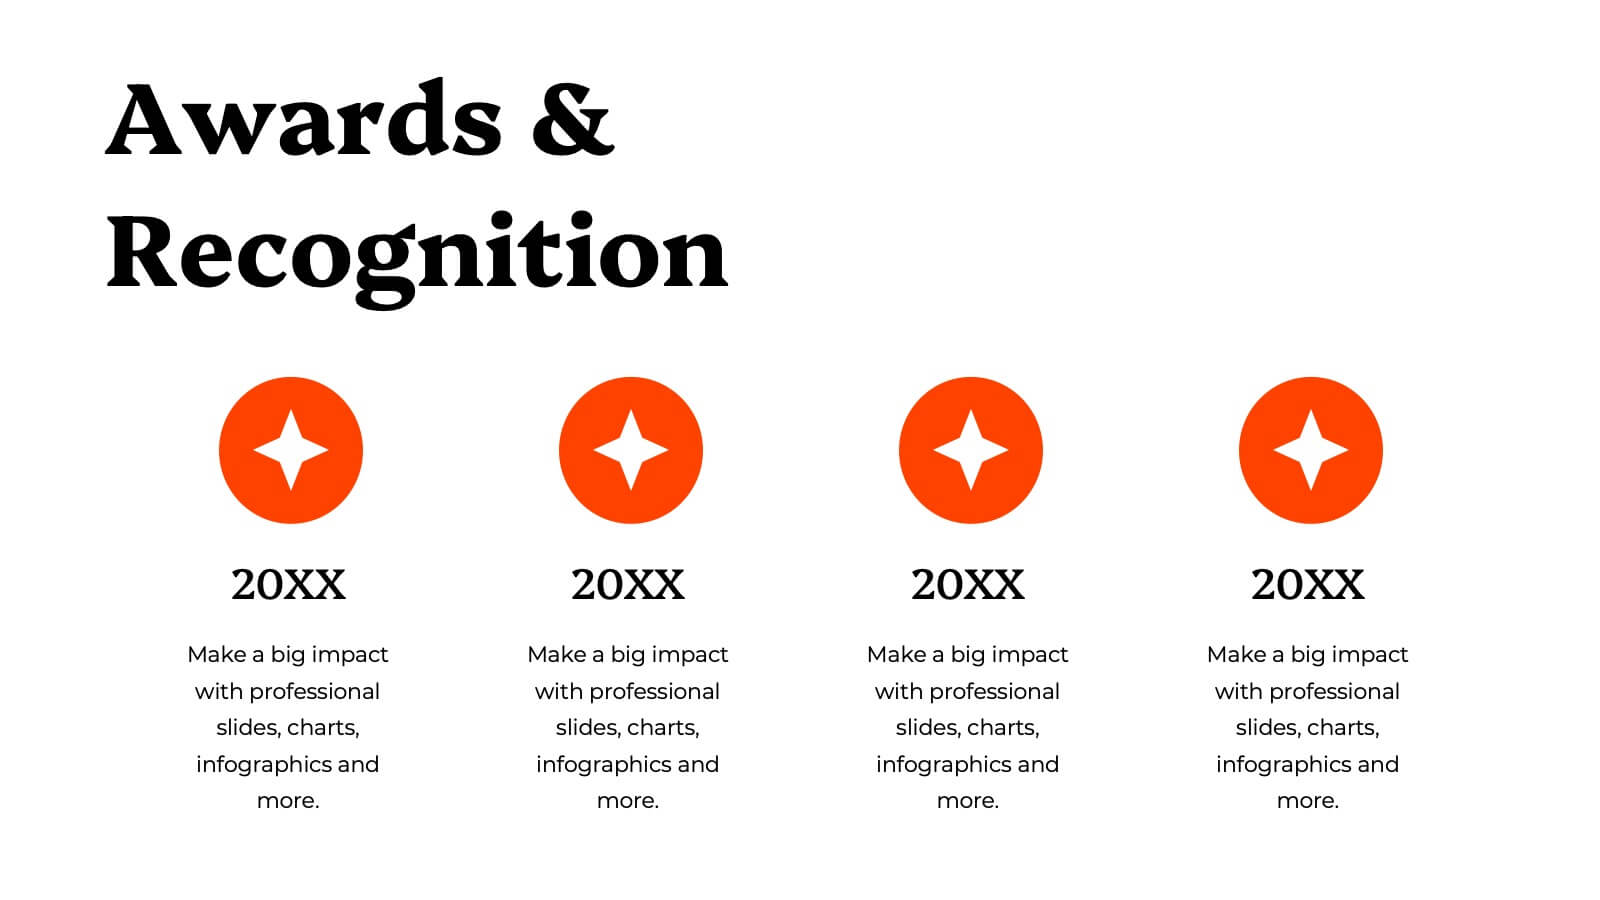
Arcadian Photography Portfolio Template Presentation
Showcase your best work with this sleek and stylish photography portfolio presentation template! It’s perfect for presenting your featured projects, creative process, and client testimonials in a visually stunning way. This template is fully customizable and offers a professional touch to your portfolio, making it ideal for both personal and client presentations. Compatible with PowerPoint, Keynote, and Google Slides.
8 diapositivas
Business Growth and Progress Tracking Presentation
Visualize success with this upward-arrow roadmap template designed to highlight four key stages of business development. Ideal for managers, analysts, and entrepreneurs, this slide uses milestone icons and clean, directional layout to emphasize progress. Fully editable in PowerPoint, Keynote, and Google Slides for seamless customization.


10 diapositivas
Business Expansion and Growth Path Presentation
Illustrate your company’s strategic milestones with the Business Expansion and Growth Path Presentation. This step-by-step layout is perfect for showcasing phases of development, scaling goals, or startup growth trajectories. Fully customizable in PowerPoint, Keynote, and Google Slides—ideal for business plans, pitch decks, and strategic reviews.


5 diapositivas
Organizational Management Frameworks Overview Presentation
Clarify reporting lines and decision-making roles with the Organizational Management Frameworks Overview Presentation. This clean and color-coded hierarchy chart helps visualize team structure, leadership levels, or departmental breakdowns. Ideal for organizational design, onboarding, or strategic alignment discussions, each placeholder is fully customizable to reflect your company’s framework. Compatible with PowerPoint, Keynote, and Google Slides—perfect for HR professionals, managers, and consultants seeking structure and clarity.


7 diapositivas
Business Networking Strategy Presentation
Build strong business connections with this Business Networking Strategy template. Featuring a circular segmented diagram, this slide helps illustrate key networking approaches, strategic partnerships, and relationship-building techniques in an easy-to-understand format. Ideal for entrepreneurs, business developers, and corporate leaders, this fully editable slide is compatible with PowerPoint, Keynote, and Google Slides.


4 diapositivas
Artificial Intelligence Use Cases Overview Presentation
Navigate a maze of insights with this creative template designed to showcase real-world tech applications in a visually engaging way. Whether you're covering machine learning in healthcare or automation in customer service, this AI use case infographic keeps your points clear and organized. Works seamlessly in PowerPoint, Keynote, and Google Slides.


26 diapositivas
Shooting Star Brand Identity Presentation
Step into the world of brand identity with this dynamic presentation that brings your brand story to life! From vision and mission statements to audience personas, this template covers all key elements essential for brand development. Easily customizable, it’s perfect for PowerPoint, Keynote, and Google Slides, making your branding pitch a breeze.


6 diapositivas
SEO Ads and Social Media Planning Presentation
Boost your online presence with the SEO, Ads, and Social Media Planning Presentation. This layout features engaging iconography and a central post mockup to highlight content strategy, paid advertising, engagement metrics, and platform-specific insights. Ideal for marketing teams and campaign proposals. Fully editable in PowerPoint, Keynote, and Google Slides.


3 diapositivas
Search Engine Optimization Strategy Presentation
Stand out in your next presentation with this dynamic visual breakdown of digital visibility tactics. Perfect for marketers, business owners, or SEO specialists, this colorful circular infographic highlights the key pillars of a search strategy in a way that's both professional and easy to follow. Compatible with PowerPoint, Keynote, and Google Slides.


5 diapositivas
New Venture Pitch Deck Structure Presentation
Outline your pitch with clarity using the New Venture Pitch Deck Structure Presentation. Designed for startups and entrepreneurs, this vertical timeline layout helps you present key sections like business model, problem/solution, and go-to-market strategy. Fully editable in PowerPoint, Canva, and Google Slides to fit your branding needs.


6 diapositivas
Stock Market Investment and Analysis Presentation
Showcase your market insights with this dynamic zigzag arrow diagram—perfect for highlighting bullish vs. bearish trends, financial analysis, and investment milestones. The slide features a split-path layout with icons and editable text areas to clearly compare strategies or illustrate turning points. Fully customizable in PowerPoint, Keynote, and Google Slides.


5 diapositivas
Brief Overview of Key Insights Presentation
Present essential information at a glance with this Brief Overview of Key Insights slide. Designed around a bold key graphic, this layout highlights up to four major takeaways with icons and concise descriptions. Ideal for summaries, analysis highlights, or recommendations. Fully editable in Canva, PowerPoint, or Google Slides.
5 diapositivas
Business Strategy Arrow Presentation
Enhance your strategic planning with the Business Strategy Arrow Presentation. This visually structured template guides your audience through a step-by-step progression, making it ideal for business roadmaps, strategic plans, and goal-oriented workflows. Easily customize the colors, text, and icons to align with your brand. Fully compatible with PowerPoint, Keynote, and Google Slides for effortless editing and professional presentations.


6 diapositivas
Sports Training Program Presentation
Get ready to energize your audience with a slide that feels fast, motivating, and built for action. This presentation helps you outline key training steps, performance goals, and athletic milestones in a clean, visual way that keeps information clear and engaging. Fully compatible with PowerPoint, Keynote, and Google Slides.


21 diapositivas
Literati Research Proposal Presentation
Present your research proposal with confidence using this professionally crafted template, designed to streamline complex ideas into a cohesive, engaging narrative. With a modern design and dynamic visuals, it ensures your research objectives and findings are communicated effectively. The template includes sections for your introduction, background, methodology, data collection, analysis, and key findings, giving your proposal a logical structure. Use the literature review and data visualization slides to back up your arguments with credible sources and compelling graphics. Dedicated slides for conclusions, recommendations, and implications allow you to outline the impact of your research clearly. Fully editable in PowerPoint, Google Slides, and Keynote, this template adapts effortlessly to your needs. Perfect for academic, corporate, or professional research presentations, it combines sleek design with functionality to ensure your proposal resonates with your audience. Take your research to the next level with a template that reflects your dedication to excellence.


6 diapositivas
Creative Hexagon Process Flow Presentation
Bring order and creativity together with a sleek, geometric layout that turns complex processes into clear visual stories. This presentation helps you map workflows, stages, or milestones with a modern, connected hexagon flow. Fully editable and compatible with PowerPoint, Keynote, and Google Slides for effortless customization and presentation.