


Características


¿Tienes alguna pregunta?
Recomendar


6 diapositivas
Fishbone Diagram
A fishbone diagram, also known as a cause-and-effect diagram or an Ishikawa diagram, is a visual tool used to identify and analyze the potential causes of a problem or an effect. This infographic template is designed to help you explore and understand the root causes of an issue by visually mapping out various contributing factors. This cause-and-effect diagram, provides a structured approach to identify and categorize the various factors contributing to a specific outcome. This template is fully customizable and compatible with Powerpoint, Keynote, and Google Slides making it easy to input your information.


7 diapositivas
Cryptocurrency Infographic Presentation Template
Cryptocurrency is a form of digital or virtual currency that uses cryptography (the conversion of data into an unreadable format) to secure transactions between two parties. Cryptocurrencies use decentralized control as opposed to centralized electronic money and central banking systems. This template is the perfect presentation for informing on the world of cryptocurrency. The decentralized control of each cryptocurrency works through a blockchain. It is an alternative currency brought on by the emergence of Internet. This template comes with appealing illustrations made for you to customize.


6 diapositivas
Customer Support Team Infographic
The set of slides presented is meticulously designed to encapsulate the essence of customer support team operations, highlighting various key aspects such as teamwork, communication channels, customer interaction points, and support strategies. Each slide utilizes a clean and professional design, integrating soft color palettes and structured layouts to clearly convey complex information in an accessible way. These slides are particularly useful for customer support teams looking to present or revamp their strategy, showcasing how they handle customer queries and feedback across different platforms. The visual elements such as graphs, hierarchical diagrams, and process flows are strategically used to illustrate the team’s structure, response processes, and efficiency metrics, making it easier for stakeholders to grasp the effectiveness of customer support initiatives. Such a collection is indispensable for training new team members, demonstrating the team's impact on customer satisfaction, and internal reviews to improve service delivery. By using these slides, teams can ensure a consistent understanding of goals, roles, and procedures, which is crucial for maintaining high standards of customer service and team alignment.


26 diapositivas
Summer Sale Presentation
Soak up the bright, sunny vibes of a presentation template that’s perfectly tailor-made for the lively summer season. Its radiant design, infused with the essence of summer sales and tropical aesthetics, is a perfect match for retail campaigns, travel promotions, or any topic that aims to bring the sizzle of summer into a room. Bright colors, playful graphics, and beach-inspired backgrounds set the stage for vibrant storytelling, whether you're introducing a seasonal team, showcasing hot vacation spots, or highlighting the latest summer fashion. The template not only captures the casual, cheerful spirit of the season but also ensures that your content makes a splash with clear, concise data displays and infographics. It’s a breeze to use across various platforms like PowerPoint, Keynote, and Google Slides, ensuring your summer message is as refreshing as a cool ocean wave.


6 diapositivas
Objective Research Infographics
Enhance your presentation on "Objective Research" with our professionally designed infographic template. This template, compatible with PowerPoint, Keynote, and Google Slides, is the perfect tool for presenting complex research data in a clear and engaging manner. Our template boasts a clean, modern design with a neutral color scheme, making it ideal for both corporate and academic settings. The layout is expertly crafted to showcase your research objectives, methodologies, and findings in a visually appealing way. It includes elements like graphs, charts, and bullet points, ensuring your data is not only accessible but also impactful. Easy to customize and user-friendly, this template empowers you to convey your research objectives with clarity and professionalism. Whether you're presenting to colleagues, students, or stakeholders, this infographic template will elevate your presentation and make your data stand out.


5 diapositivas
Compete-Free Market Space Creation Presentation
The Compete-Free Market Space Creation Presentation is designed to help illustrate a strategic shift toward innovation-led market growth. This circular diagram layout allows you to highlight four essential focus areas—each with customizable icons, titles, and supporting text. Ideal for presenting frameworks based on Blue Ocean Strategy, business differentiation, or uncontested market exploration. The clean, professional design supports storytelling with clarity and flow, making it perfect for consultants, business strategists, and executive teams. Fully editable in PowerPoint, Keynote, and Google Slides for maximum flexibility.


22 diapositivas
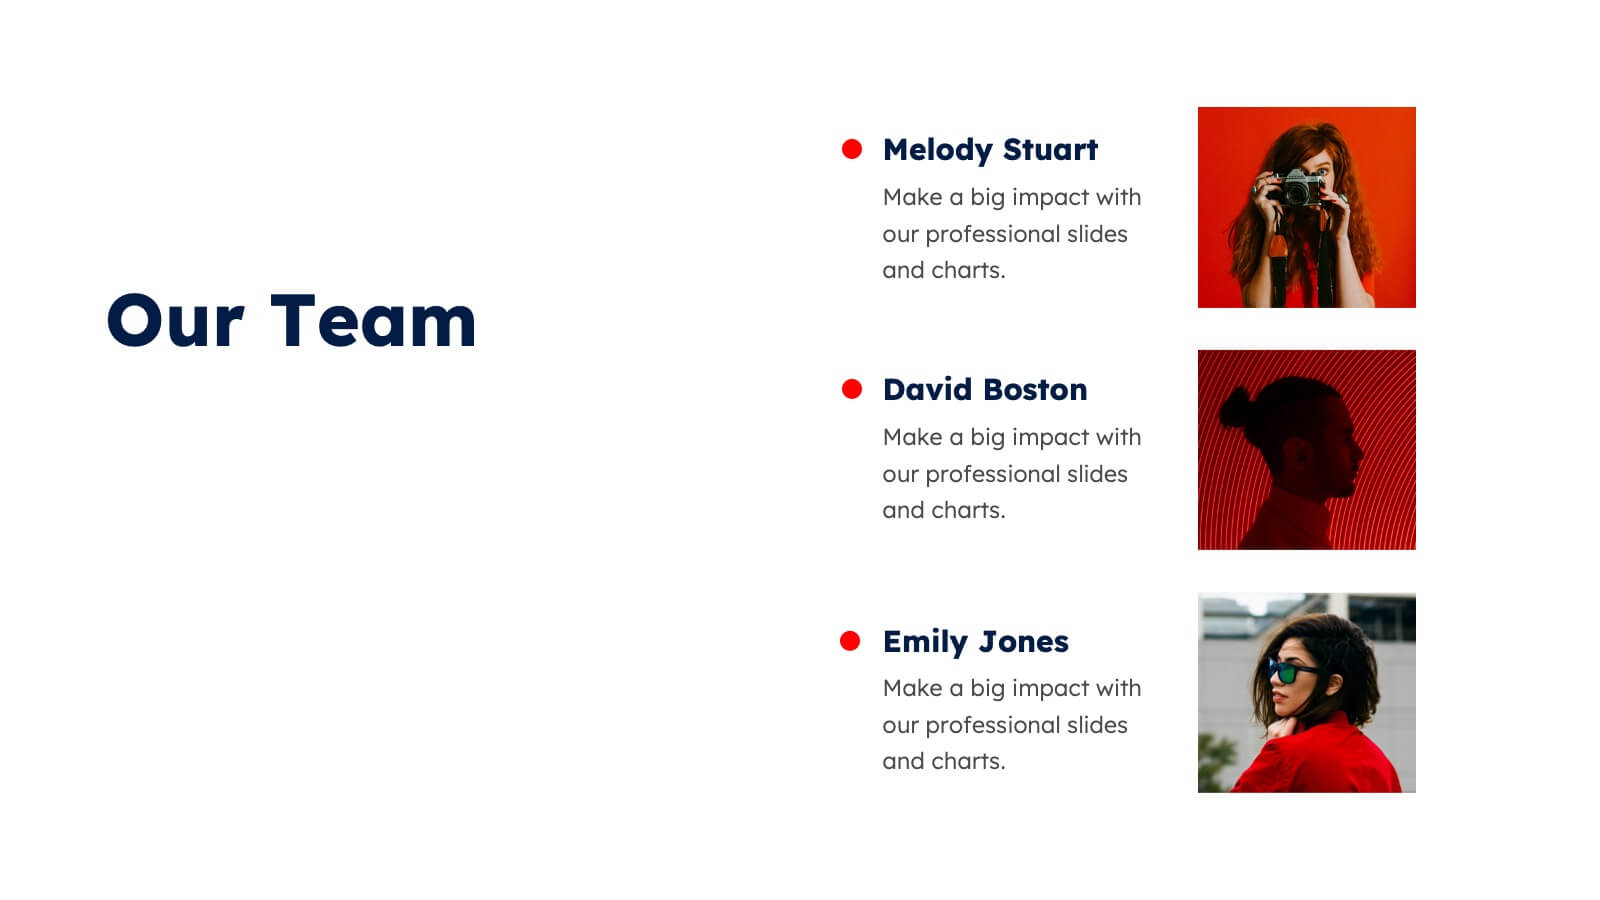
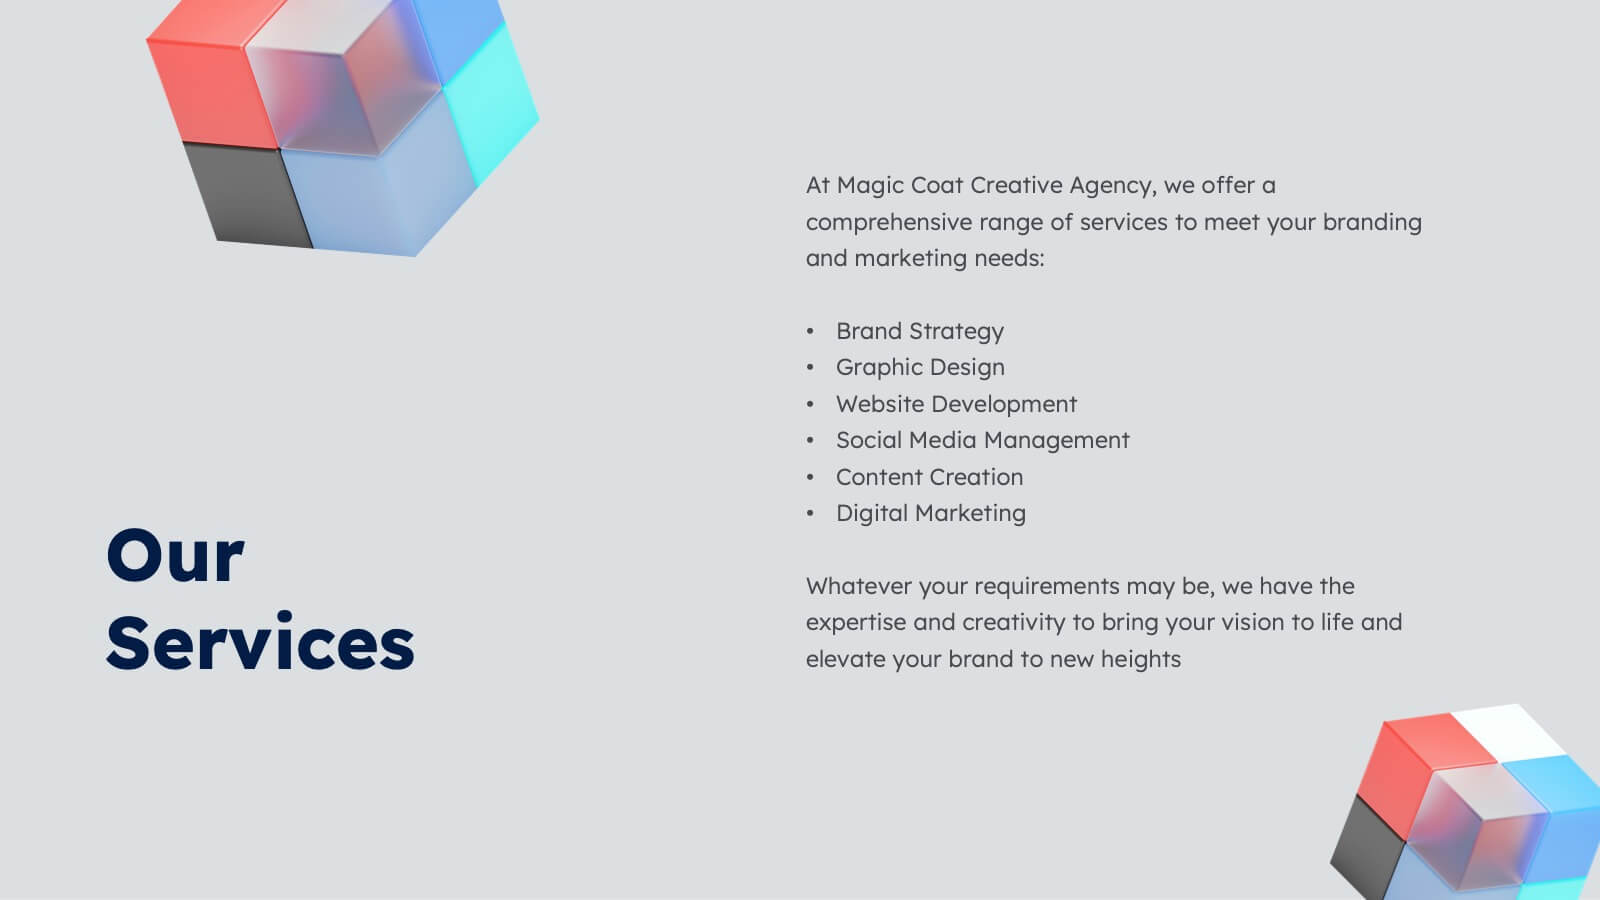
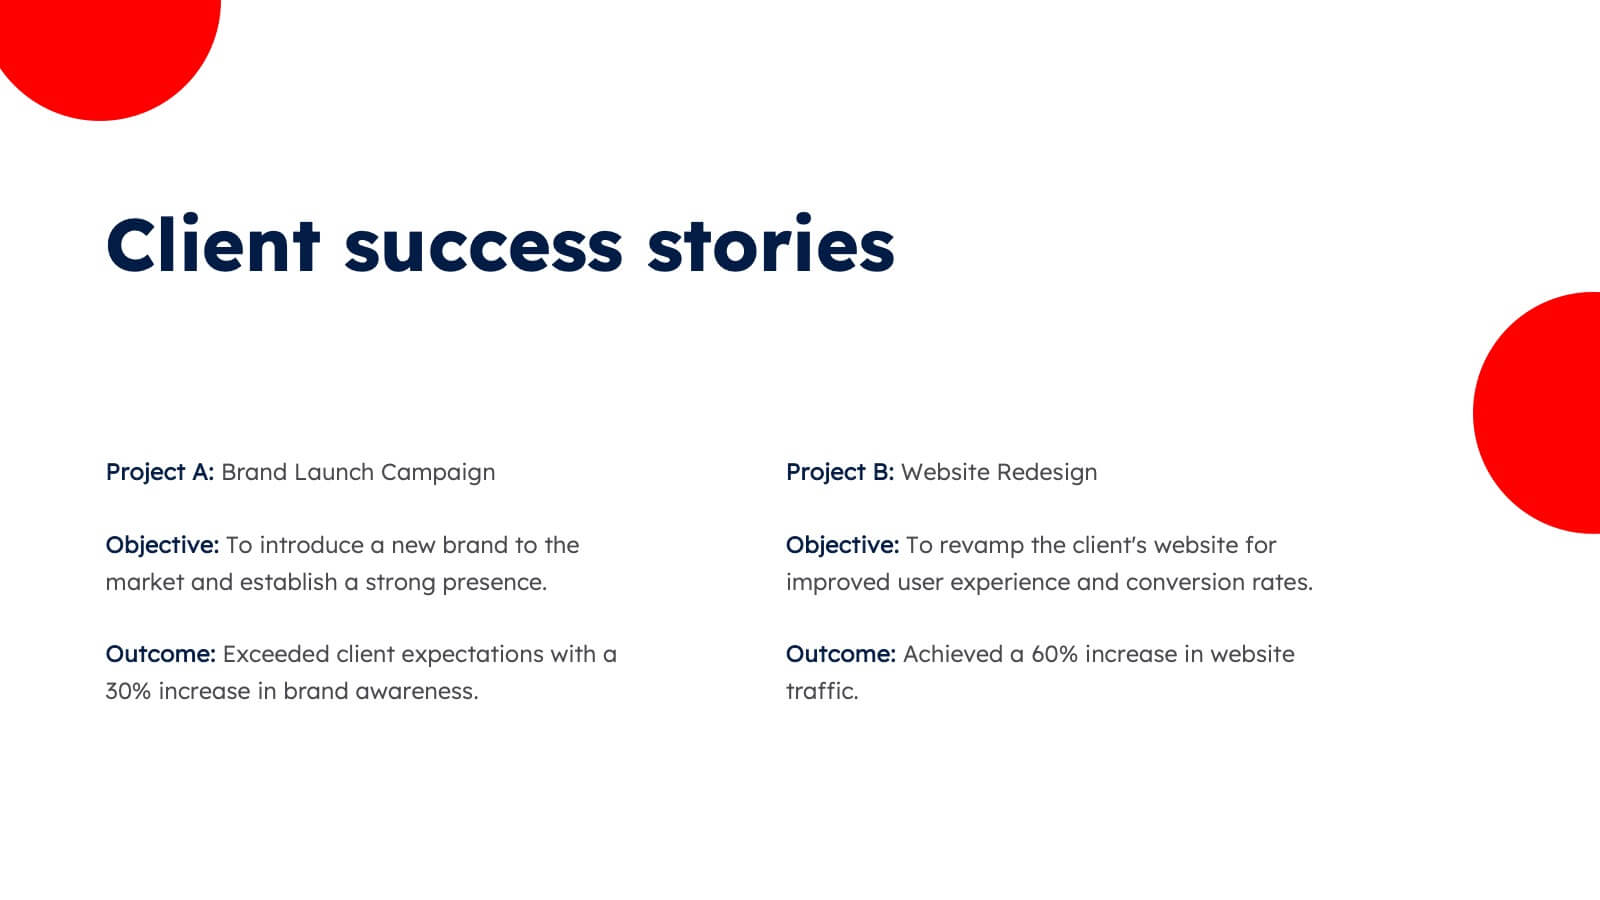
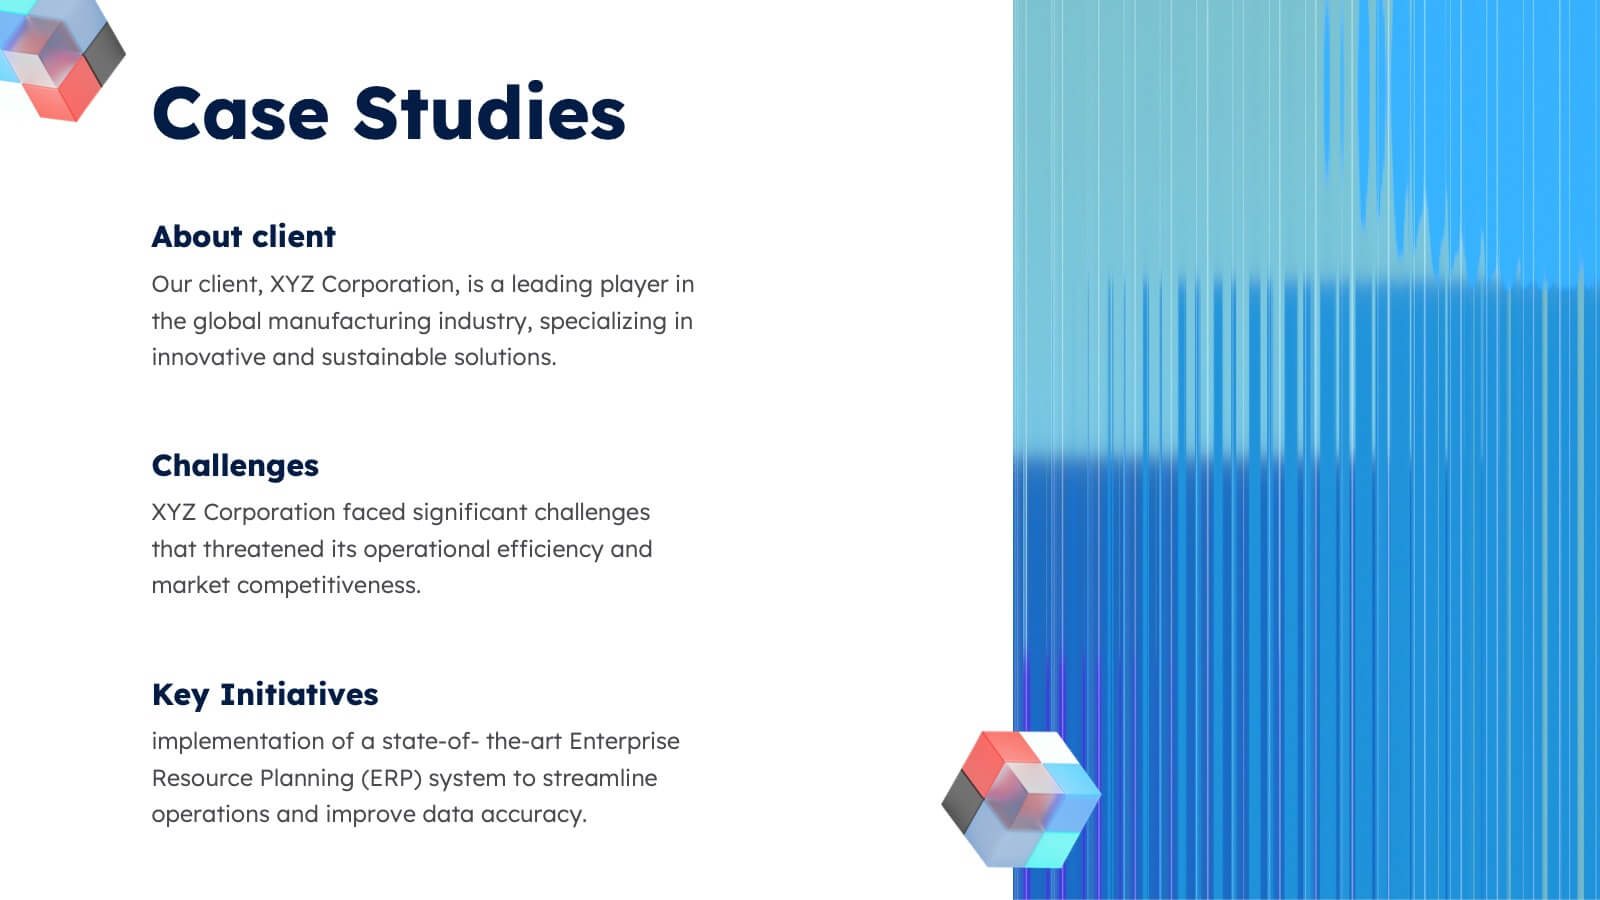
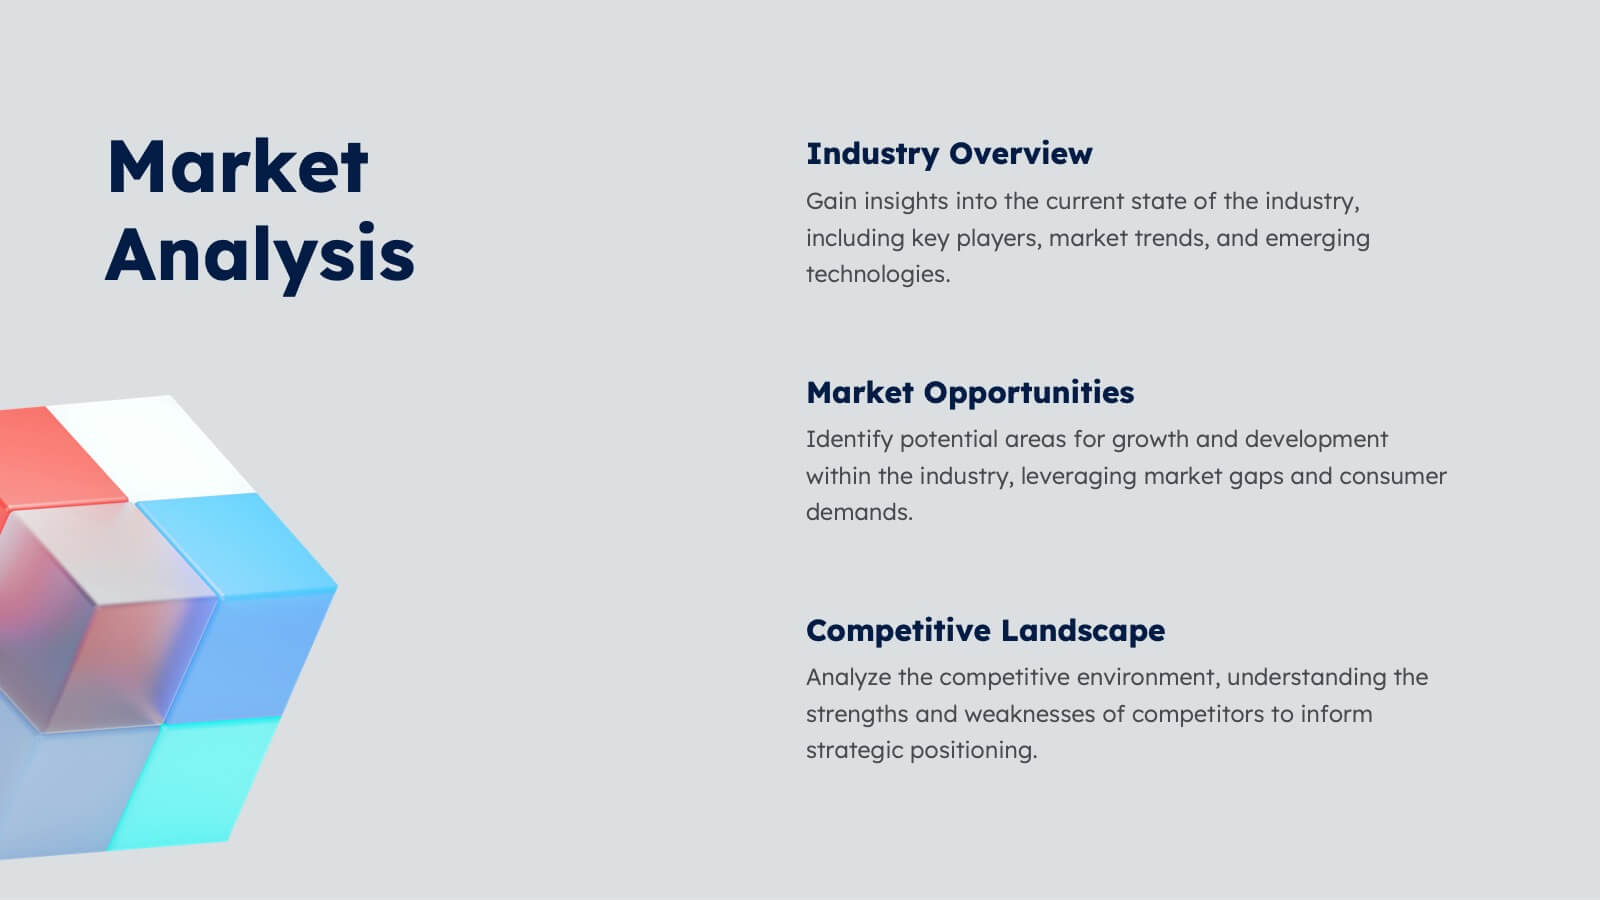
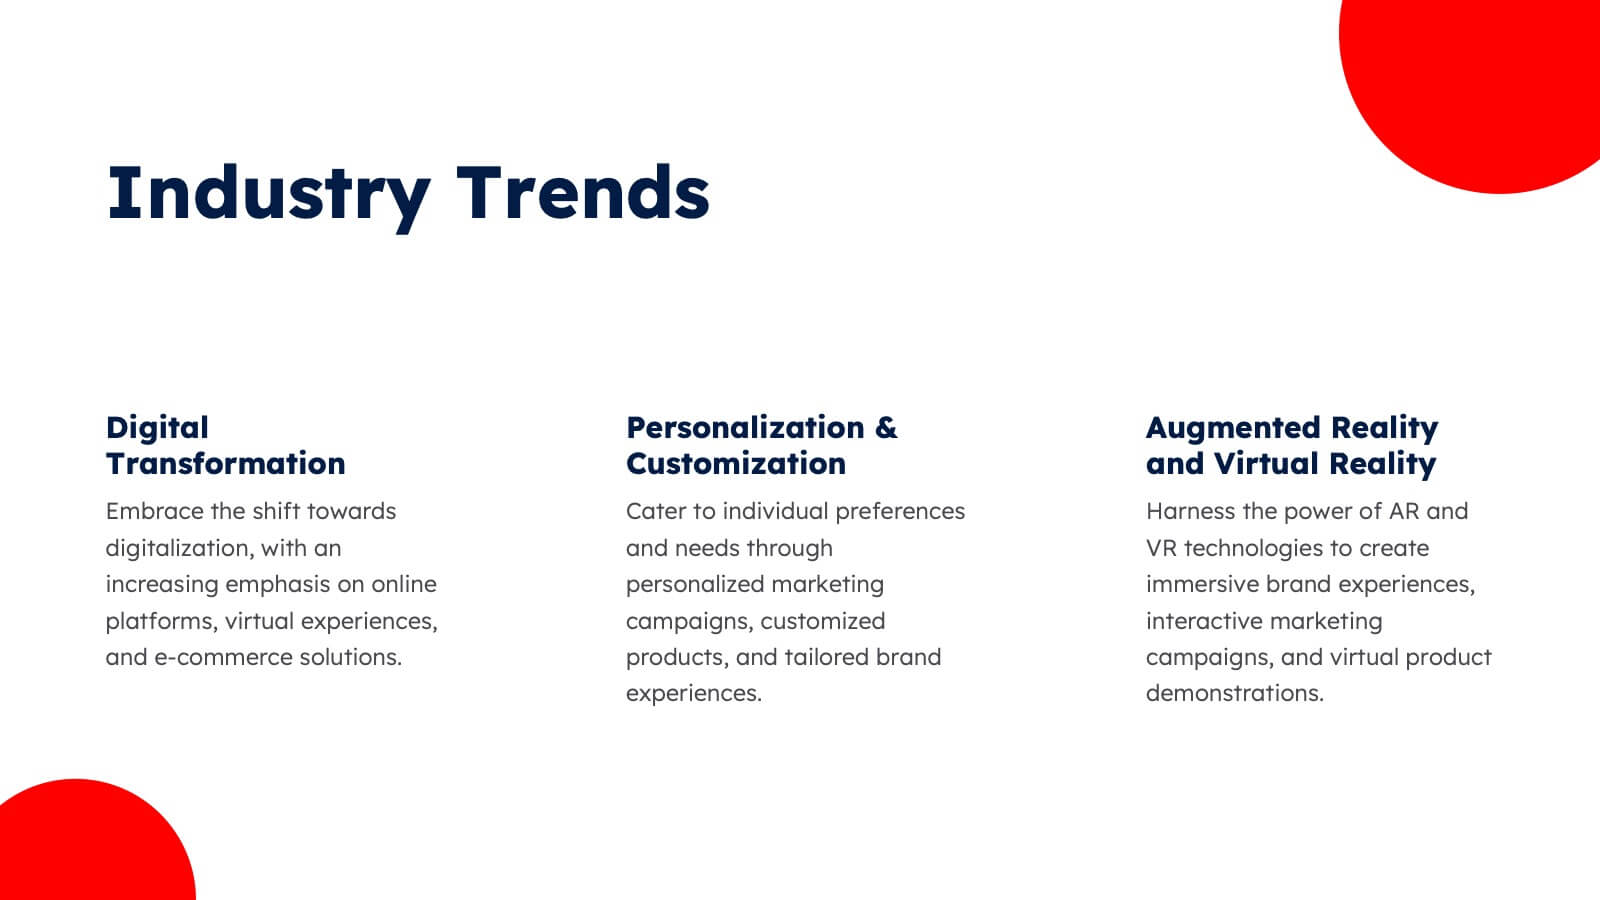
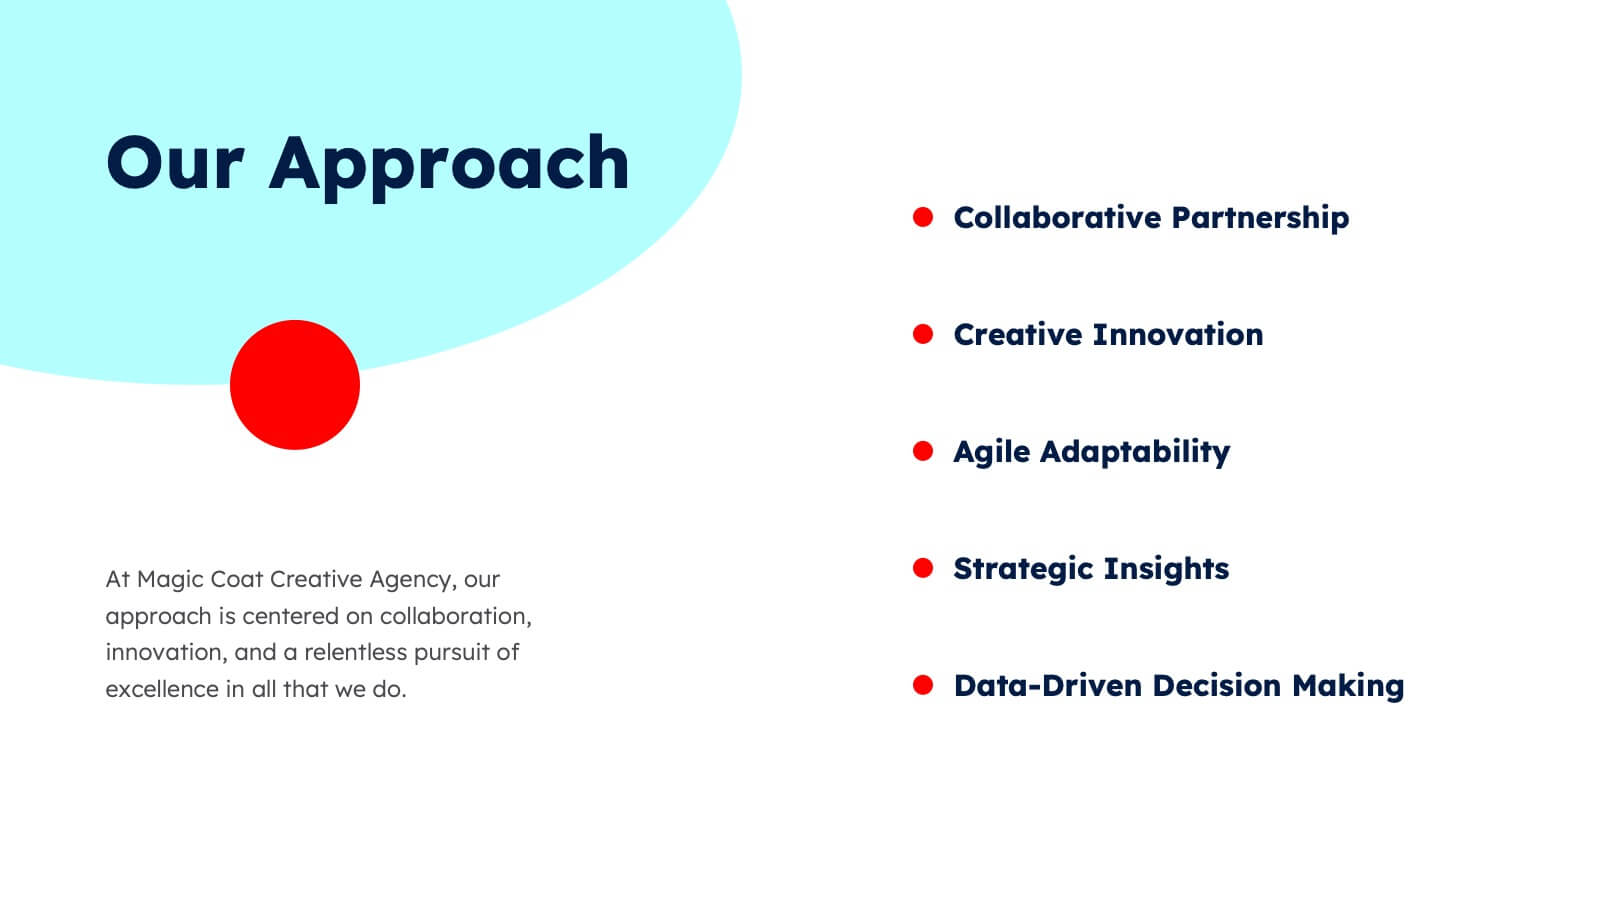
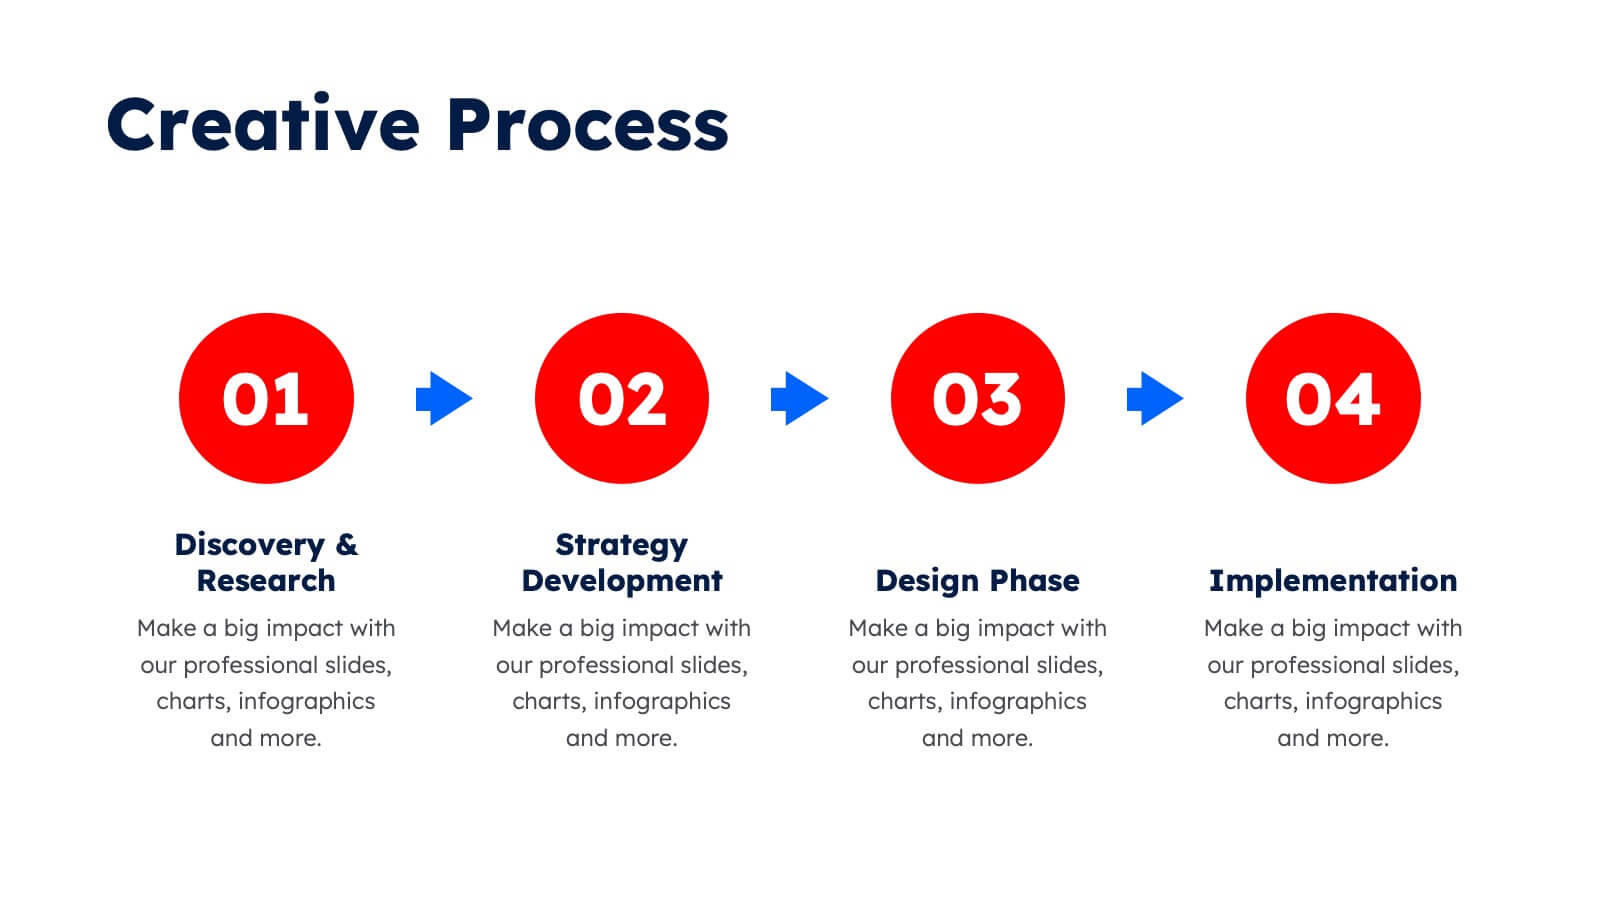
Aura Agency Portfolio Presentation
Showcase your agency's brilliance with this vibrant portfolio presentation template! Ideal for highlighting your mission, vision, case studies, and market analysis, it brings your achievements to life with colorful, engaging slides. Impress clients and partners with a well-structured, visually appealing narrative. Compatible with PowerPoint, Keynote, and Google Slides for easy use on any platform.


26 diapositivas
Strategic Partnership Building Presentation
Forge ahead into the world of collaboration with a presentation template designed to underscore the power of strategic partnerships. This suite of slides is the perfect toolkit for professionals seeking to illustrate the synergy between entities and the innovative outcomes of such alliances. The design is both sleek and inviting, with soft curves and a cool color palette that conveys a sense of harmony and cooperation. Highlight your organization's leaders with personalized bio slides, and utilize a range of charts and graphs to demonstrate the mutual benefits and shared objectives of your partnerships. Whether mapping out the journey of a collaboration, detailing the process of integration, or sharing success stories, these slides are created to facilitate clear and impactful communication. The template is thoughtfully adaptable to Keynote, Google Slides, and PowerPoint, ensuring your message of unity and cooperative success resonates across any platform.


4 diapositivas
Oceania Region Editable Map Slide Presentation
Highlight your insights across Australia and the Pacific with a clean, modern map layout designed for clarity and engagement. Ideal for visualizing market regions, travel data, or geographic comparisons, this slide combines style with precision. Fully compatible with PowerPoint, Keynote, and Google Slides for effortless customization and presentation.


4 diapositivas
Customer Market Segmentation Analysis Presentation
Understand your audience with clear and effective segmentation analysis. This Customer Market Segmentation Analysis template provides a professional visual representation of audience groups, helping businesses target the right demographics. Ideal for marketers, business strategists, and sales teams. Fully editable and compatible with PowerPoint, Keynote, and Google Slides for seamless customization.


7 diapositivas
Business People Networking Infographic
Networking is the lifeblood of any thriving business. Our business people networking infographic, designed in a pristine white backdrop with striking orange highlights and sophisticated black nuances, encapsulates the essence of professional connections and collaborations. It provides a visual representation of how relationships can foster growth, open opportunities, and catalyze success. Tailored for business leaders, conference organizers, and networking event planners, this template offers a compelling narrative of networking's power. Fully optimized, it's compatible with leading presentation platforms: PowerPoint, Keynote, and Google Slides.


26 diapositivas
Flowers Bold Company Profile Presentation
Step into the enchanting garden of happy flowers, where petals dance and colors sing. Our template, awash in sunlit shades of pink, yellow, orange, and blue, encapsulates the very essence of floral joy. Bursting with vibrant graphics, whimsical icons, and cheerful image placeholders, it's a bouquet of design brilliance. Crafted to perfection for Powerpoint, Keynote, or Google Slides. A delightful pick for florists, garden enthusiasts, event planners, or anyone looking to infuse their presentation with a touch of nature's merriment. Blossom your ideas; let your presentations bloom with happiness.


6 diapositivas
Historical Events Timeline Presentation
Chronicle significant moments with the Historical Events Timeline Diagram. This visually engaging template allows you to map key milestones, highlight crucial dates, and present historical progressions with clarity. Ideal for educators, researchers, and business professionals, this timeline ensures a structured and impactful storytelling experience. Fully customizable and compatible with PowerPoint, Keynote, and Google Slides.


5 diapositivas
Suicide Awareness Stats Infographics
Navigate the sensitive topic of suicide with the suicide awareness stats infographics template. Crafted with care in shades of blue, white, and purple, this vertical, informative infographic serves as a profound educational tool. It is essential for mental health advocates, educational institutions, and community outreach programs, offering a respectful yet impactful way of presenting statistics and information. The template includes thoughtfully designed graphics, relevant icons, and placeholders for real-world images, ensuring the data speaks volumes in raising awareness, promoting prevention, and supporting life-affirming actions within various communities.


7 diapositivas
Marketing Team Infographic
This collection showcases a series of slides dedicated to optimizing marketing team operations and strategies. Each template is designed to cater to various facets of marketing planning and execution, featuring layouts that help articulate team roles, campaign timelines, budget allocations, and performance metrics. The slides incorporate diverse visual elements, such as hierarchical diagrams, flow charts, and graphs, to ensure complex information is accessible and engaging. Customizable color palettes and design elements allow for seamless integration into existing corporate branding, making these templates not only functional but also aesthetically aligned with company standards. Ideal for marketing strategy presentations, team meetings, and stakeholder briefings, these slides facilitate a comprehensive overview of marketing efforts, pinpointing achievements and areas for improvement. The adaptability of these templates makes them an essential tool for marketing professionals aiming to communicate effectively and drive results.


4 diapositivas
Decision Analysis Framework Presentation
Make every choice smarter with this structured and visually balanced template designed to showcase options, outcomes, and key insights. Ideal for strategy meetings or data-driven reports, it helps you present decisions with confidence and clarity. Fully editable and compatible with PowerPoint, Keynote, and Google Slides for seamless customization.


7 diapositivas
Annual Report Infographics Presentation Template
Annual reports are comprehensive documents designed to provide readers with information about a company's performance in the preceding year with a focus on all major aspects of its operations. They help investors, competitors and other stakeholders understand how well a business is performing. This template is designed to help users produce annual reports for their company. Annual reports provide insights into the company's direction in the preceding year. This template includes many features to make your document as professional as possible and includes various charts and graphs.