


Características


¿Tienes alguna pregunta?
Recomendar


5 diapositivas
SEO Strategies Infographics
Immerse yourself in the dynamic world of digital marketing with our SEO strategies infographics. Rendered in bold black, vibrant orange, and various eye-catching colors, this creative and vertical template serves as a beacon for marketing professionals, digital strategists, and entrepreneurs who aim to conquer the digital space. Each element, from engaging graphics to interpretative icons, is specifically tailored to present SEO methodologies with clarity and charisma. This infographic template is not only a visual treat but a reservoir of insights, facilitating users to communicate influential SEO tactics effectively and drive their brand's online visibility forward.


7 diapositivas
Mockup Infographic
Elevate your presentation game with this versatile collection of mockup templates, designed to showcase your digital projects in a sleek, professional manner. Each template features a clean and modern design, highlighting your work on various digital devices including smartphones, tablets, and computer screens. With a focus on simplicity and visual appeal, these mockups provide the perfect canvas for demonstrating websites, apps, and other digital products. The well-organized layouts allow for easy customization, letting you quickly insert your own images and text to match your project’s needs. Ideal for professionals in web development, app design, or digital marketing, this collection helps convey the functionality and aesthetics of your digital creations effectively. Utilize these mockups in client presentations, marketing materials, or portfolio showcases to give your audience a realistic preview of your digital solutions.


7 diapositivas
Progress Infographic Presentation Template
Our Progress template is designed with a simple layout for presenting your infographic with flow charts and progress bars. This layout is made to be used as a presentation layer so that you can easily change text and images from one slide to the next. It comes with useful icons and illustrations to help you create a more informative presentation. This is a well-organized template for PowerPoint presentations. It allows you to present important information with clear and concise structure. With its useful design and features, you can create an engaging presentation in just minutes.


5 diapositivas
Information Technology Uses Infographics
Navigate the digital era with our information technology uses infographics, a synthesis of design and functionality. Presented in the trustworthy shades of blue and the vibrant hues of green, this template captures the essence of IT applications across spectrums. Whether you're an educator or tech enthusiast, these vertical, creatively designed infographics serve as a conduit to explain the intricacies of contemporary tech use. Compatible with Powerpoint, Keynote, and Google Slides. Complete with expressive icons and customizable image placeholders, this visual aid is crafted for clarity, making complex IT concepts engaging for audiences.


4 diapositivas
Environmental Impact Assessment Presentation
Bring your audience into a greener future with a clean, leaf-inspired design that makes complex sustainability insights feel clear and approachable. This presentation helps you break down key environmental factors, impact areas, and responsible planning in a simple visual flow. Fully editable and compatible with PowerPoint, Keynote, and Google Slides.


20 diapositivas
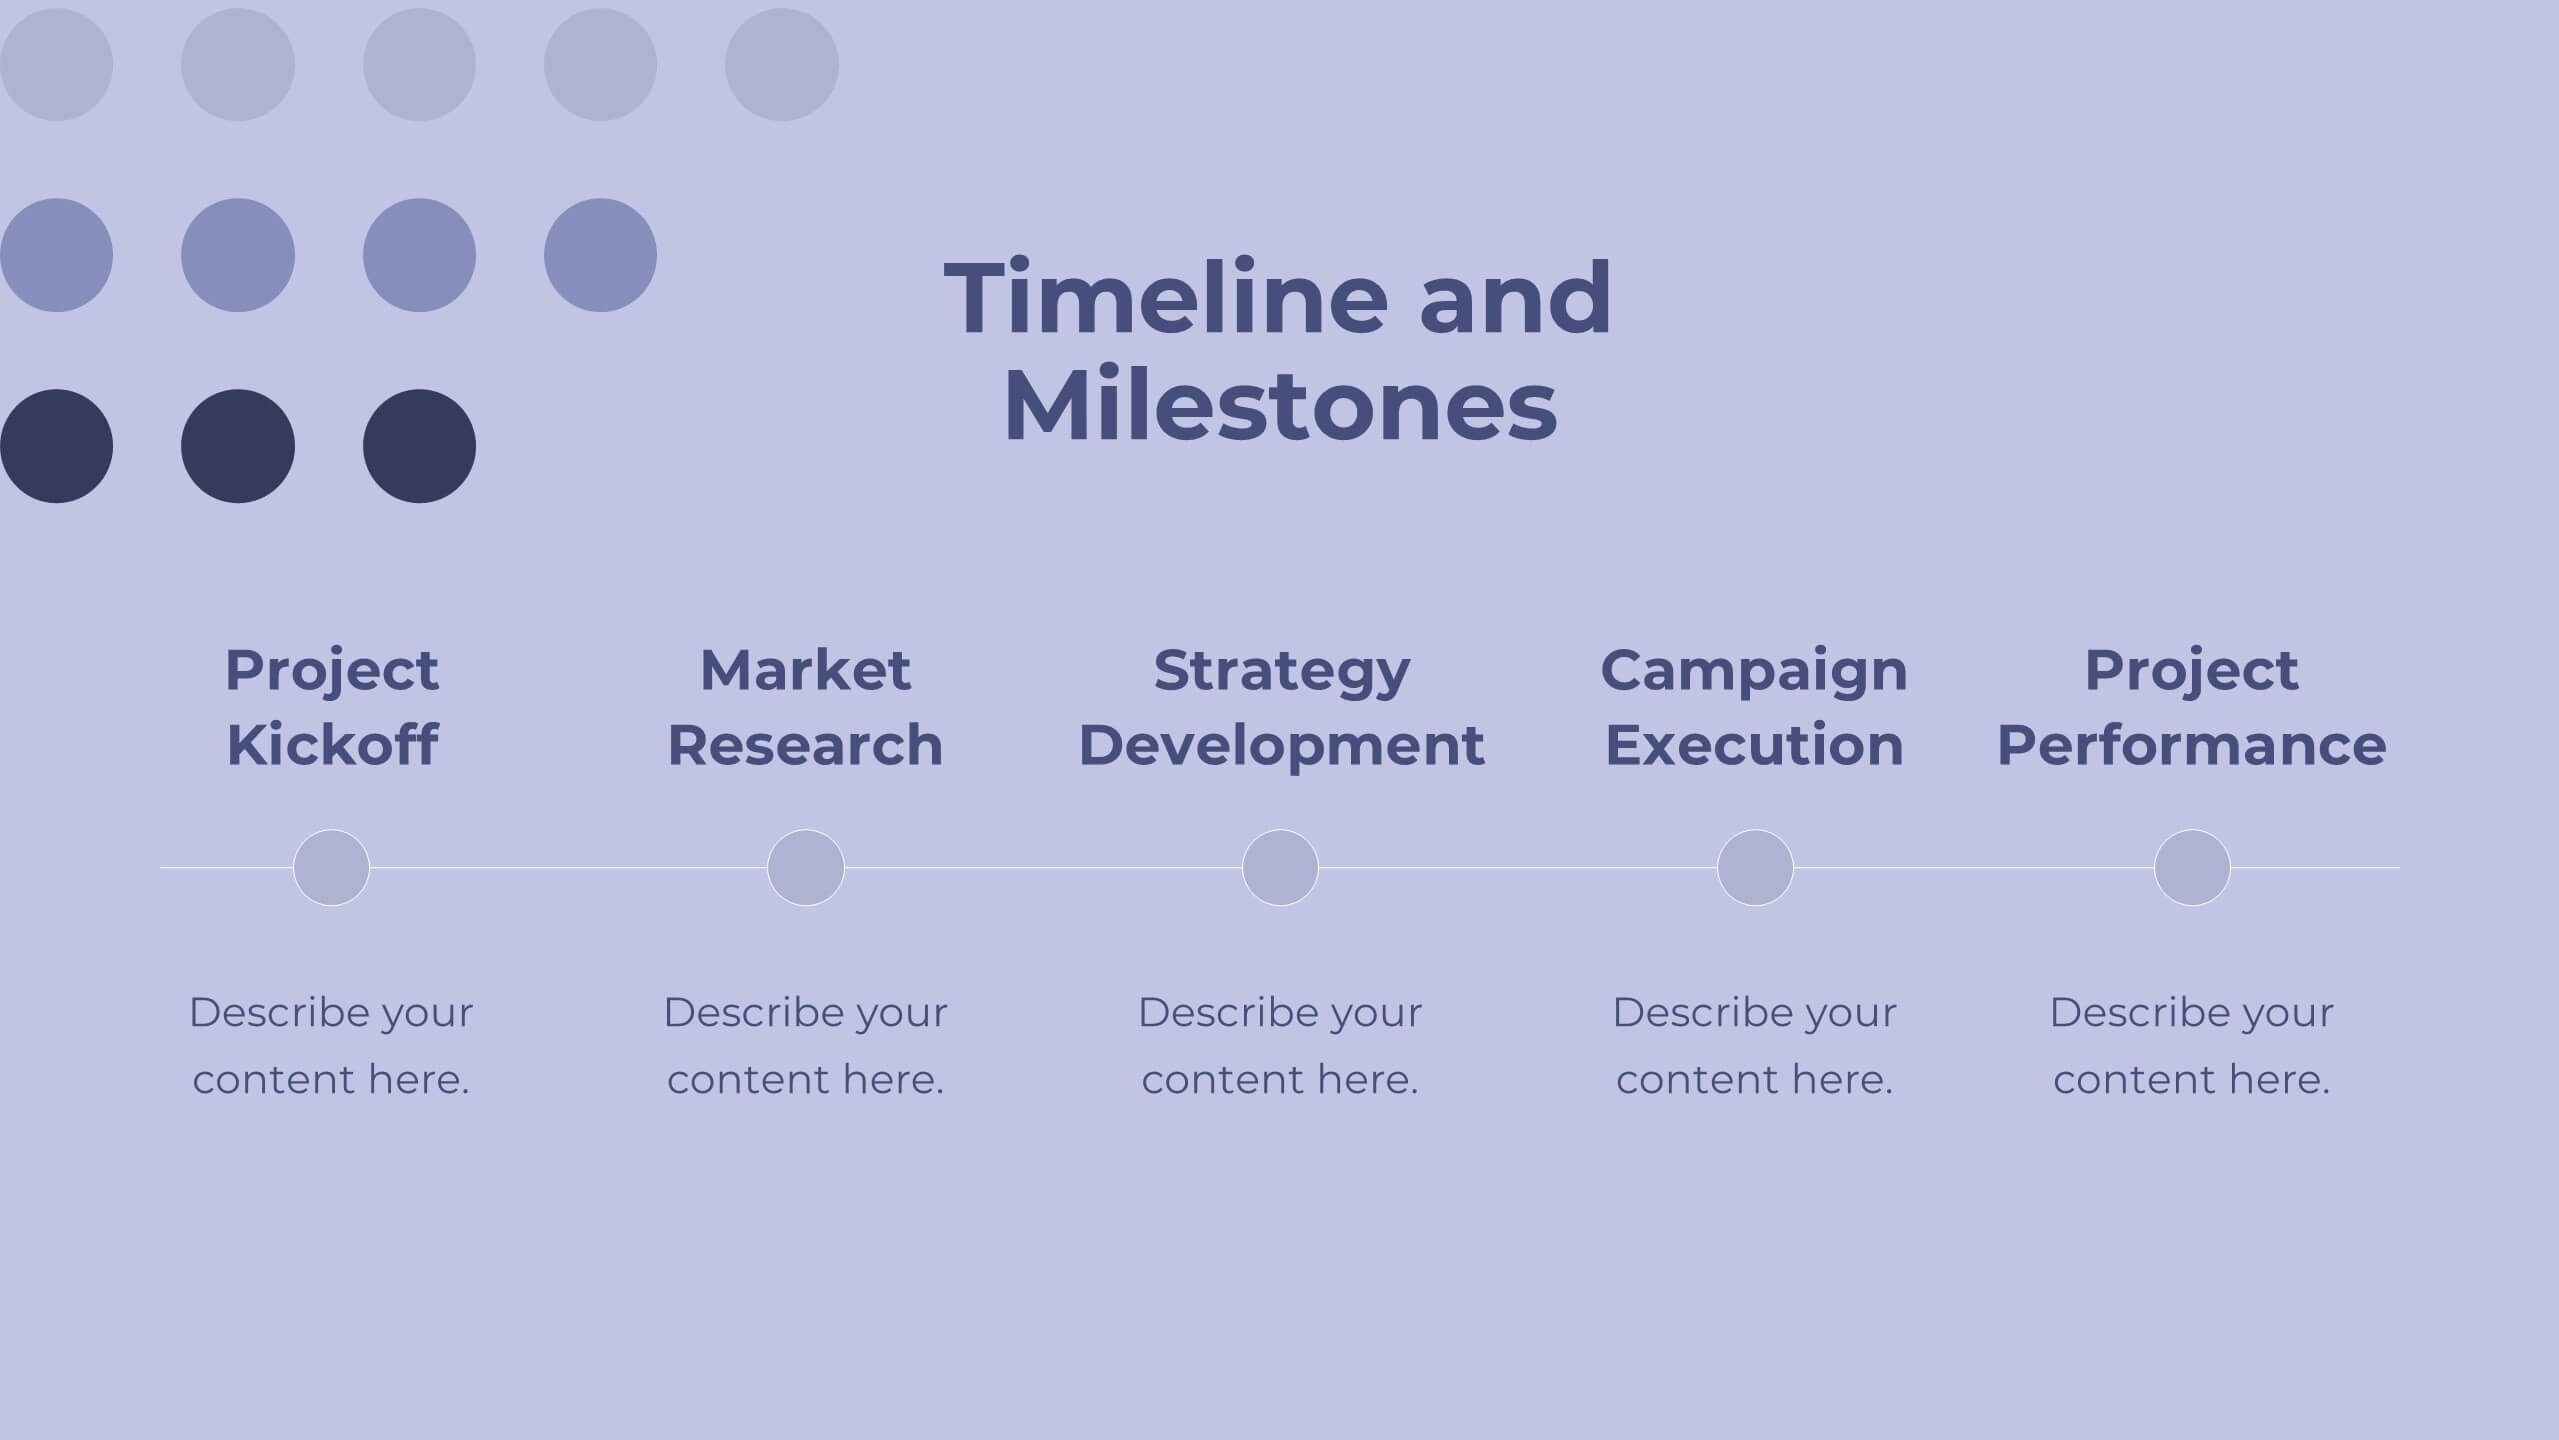
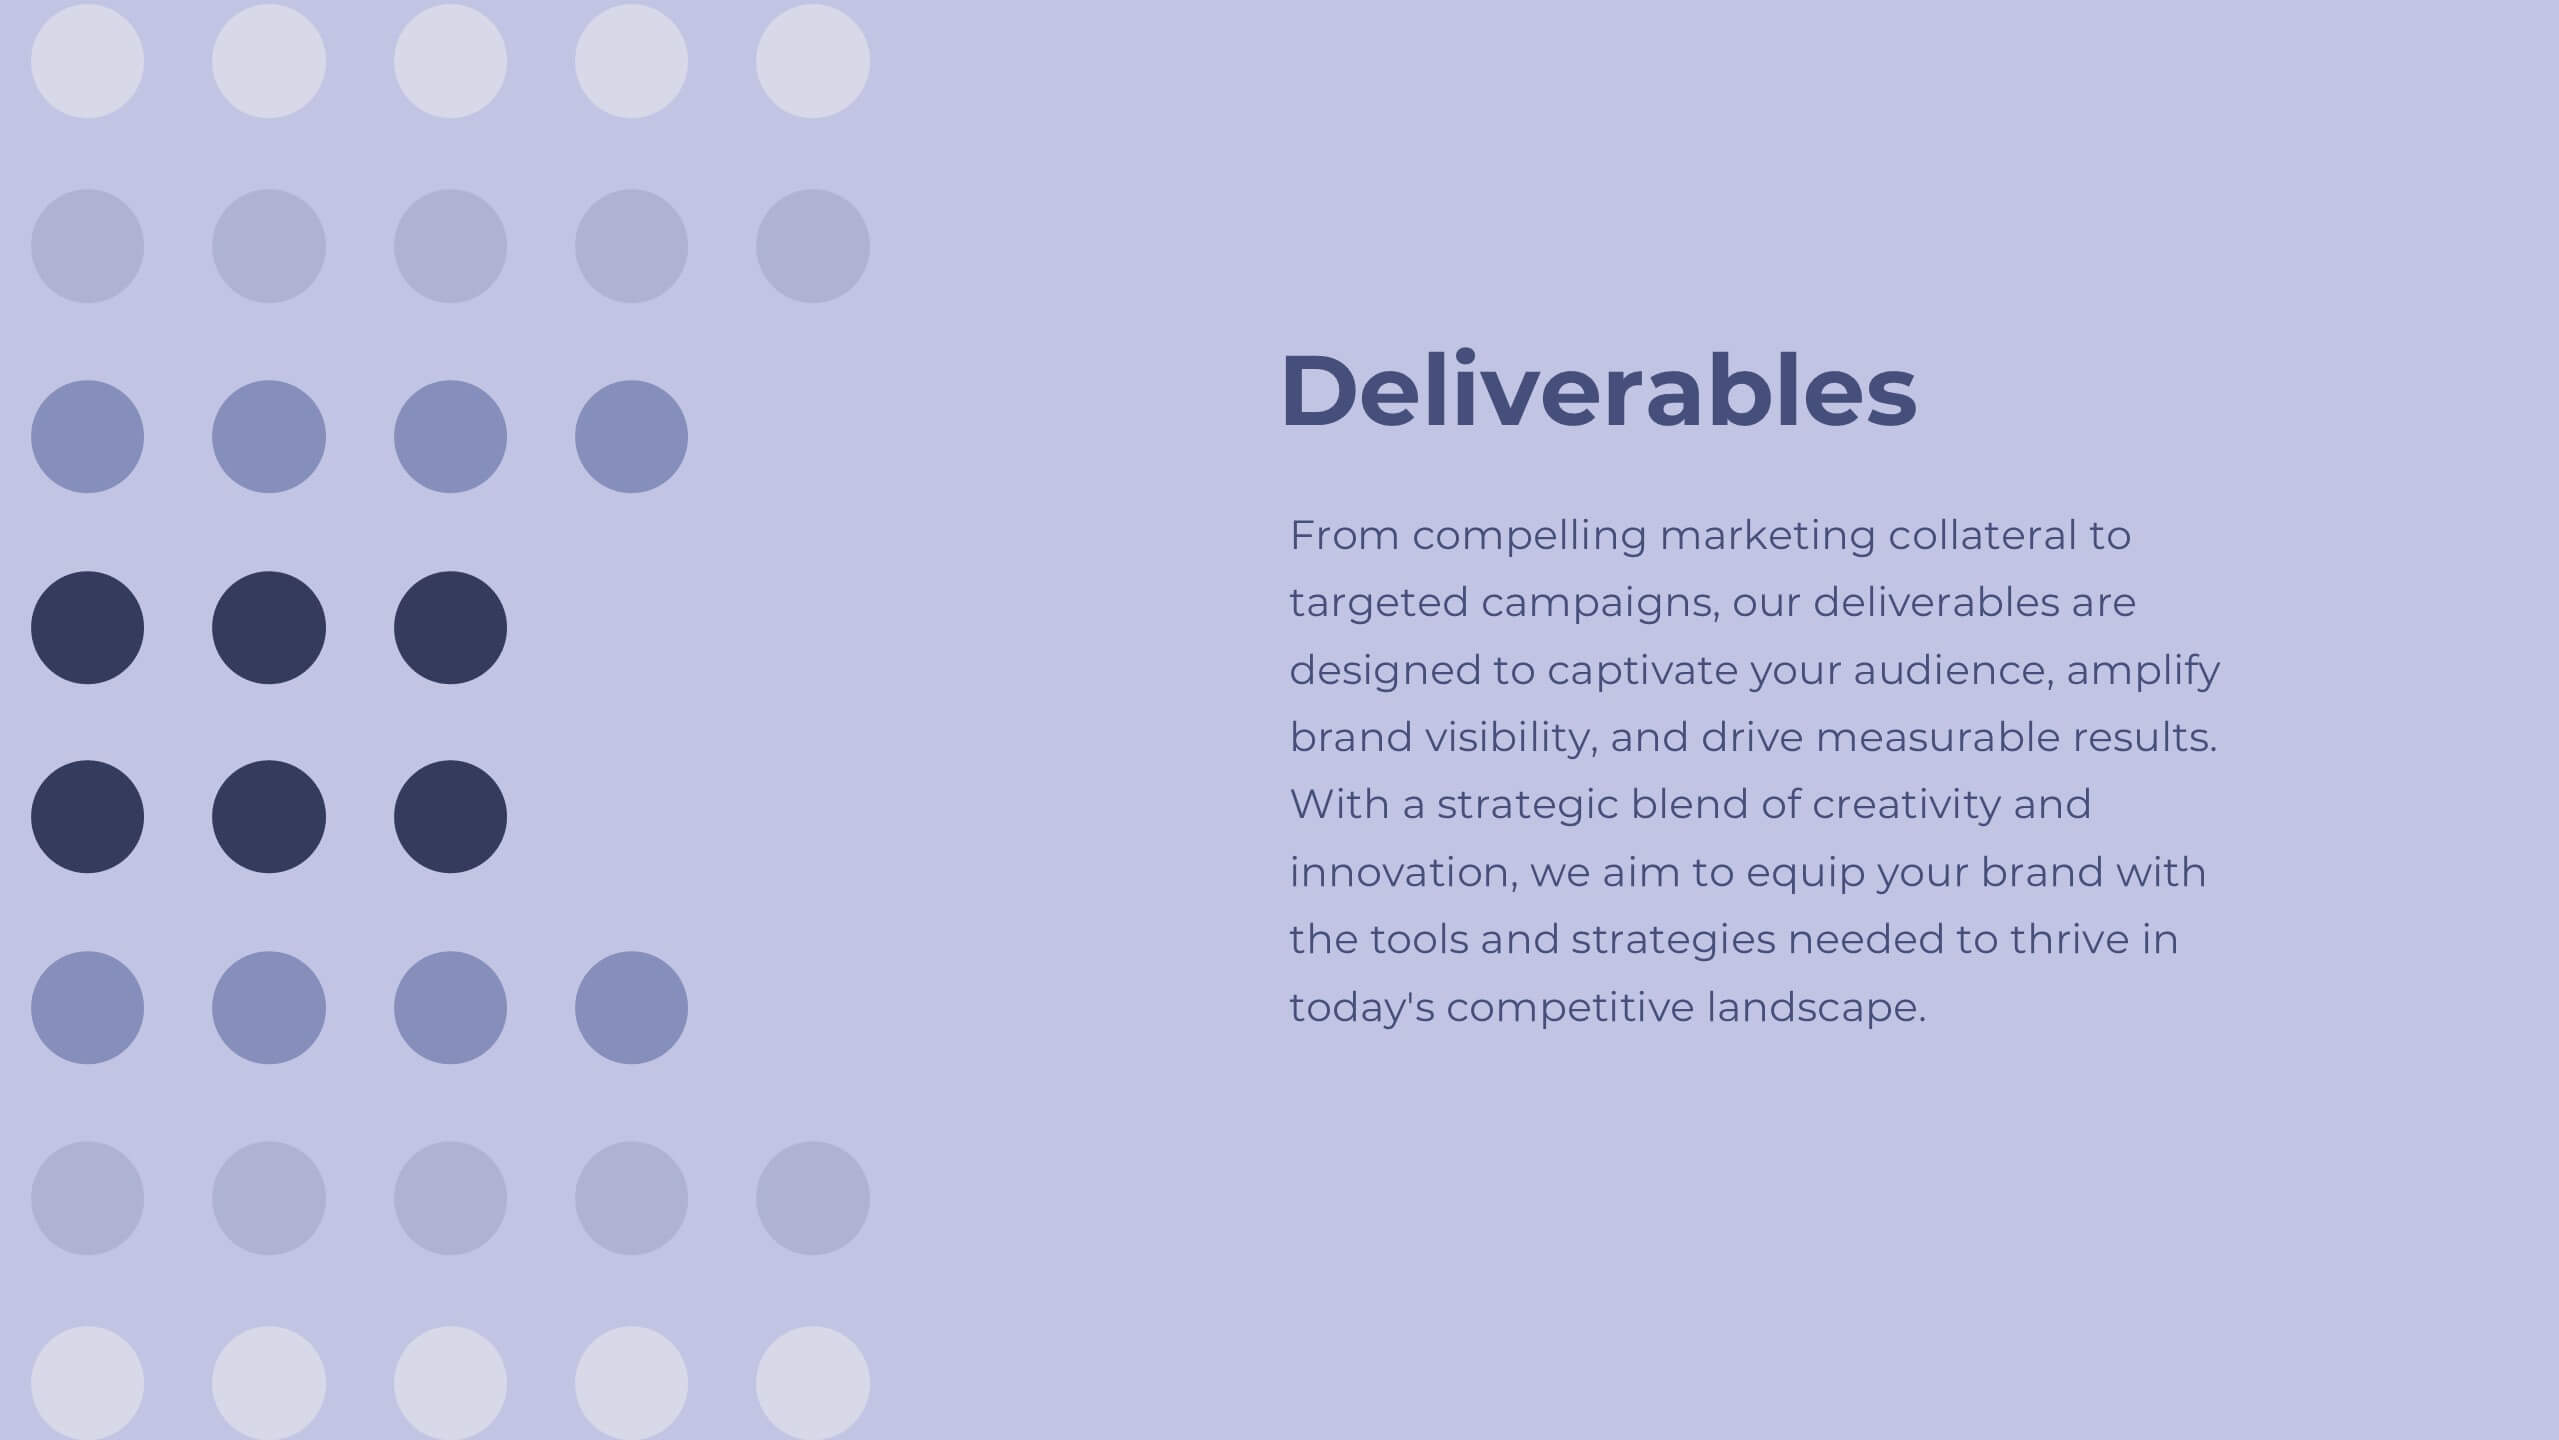
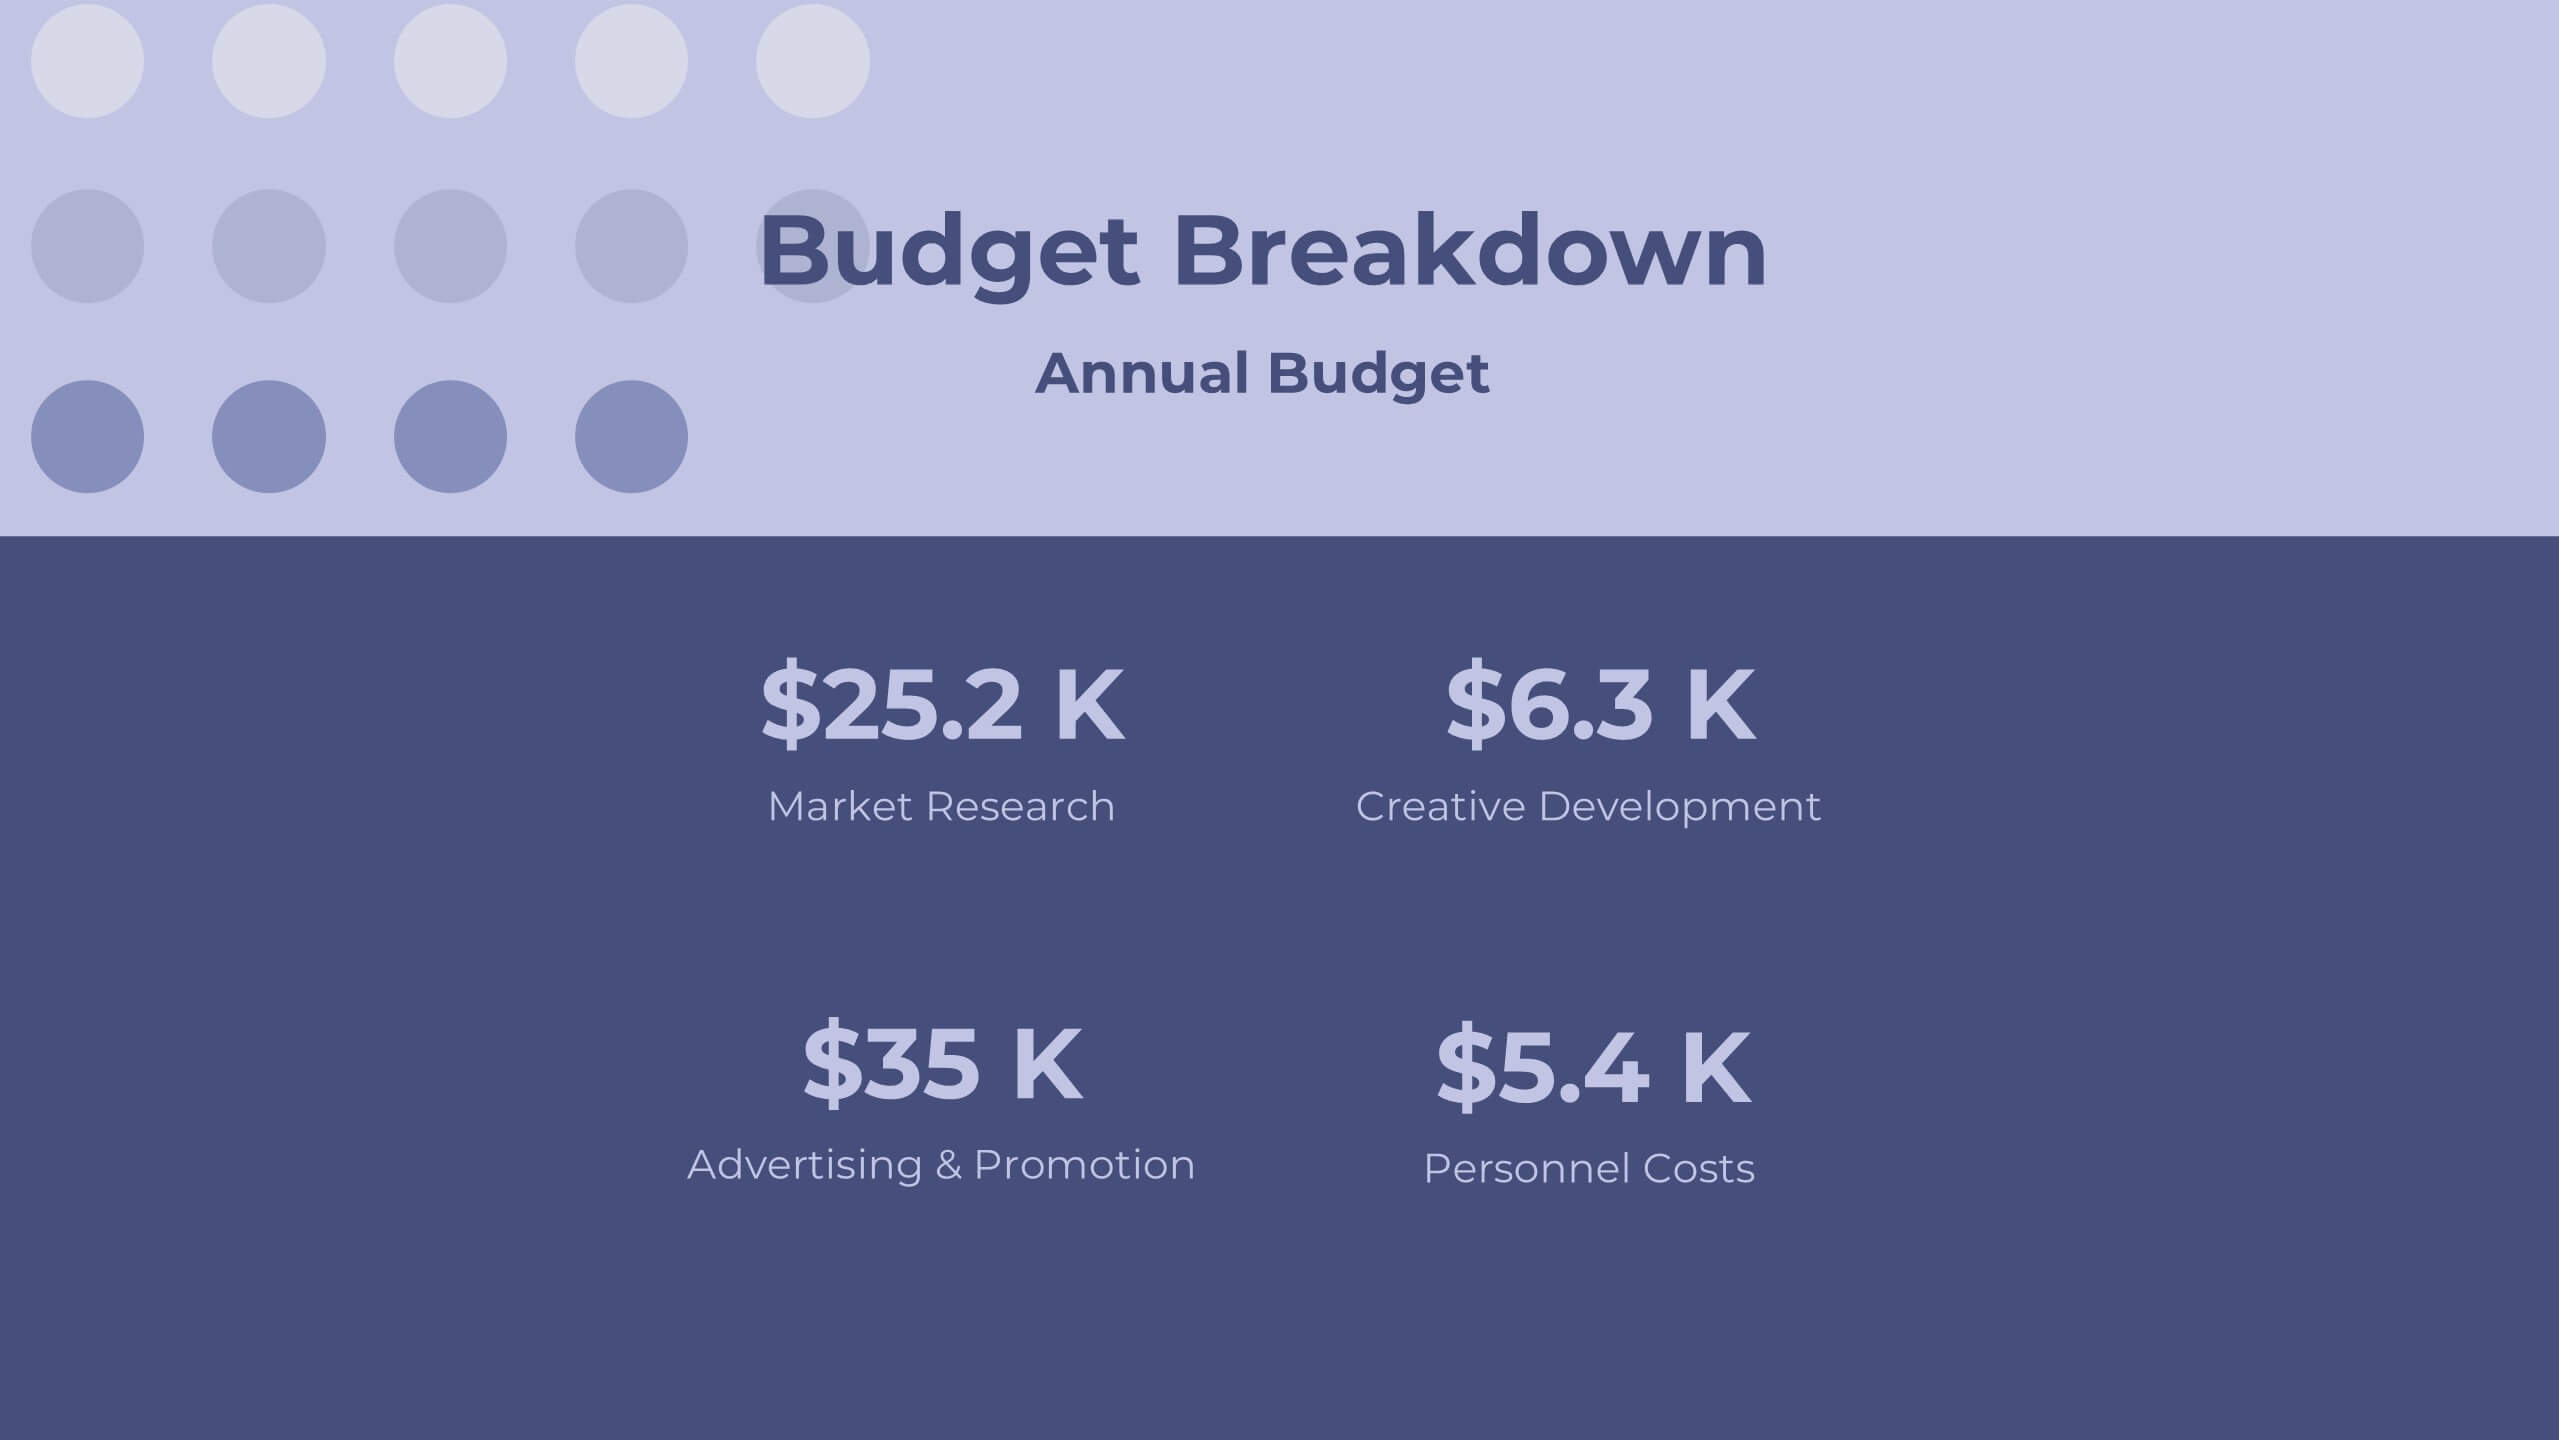
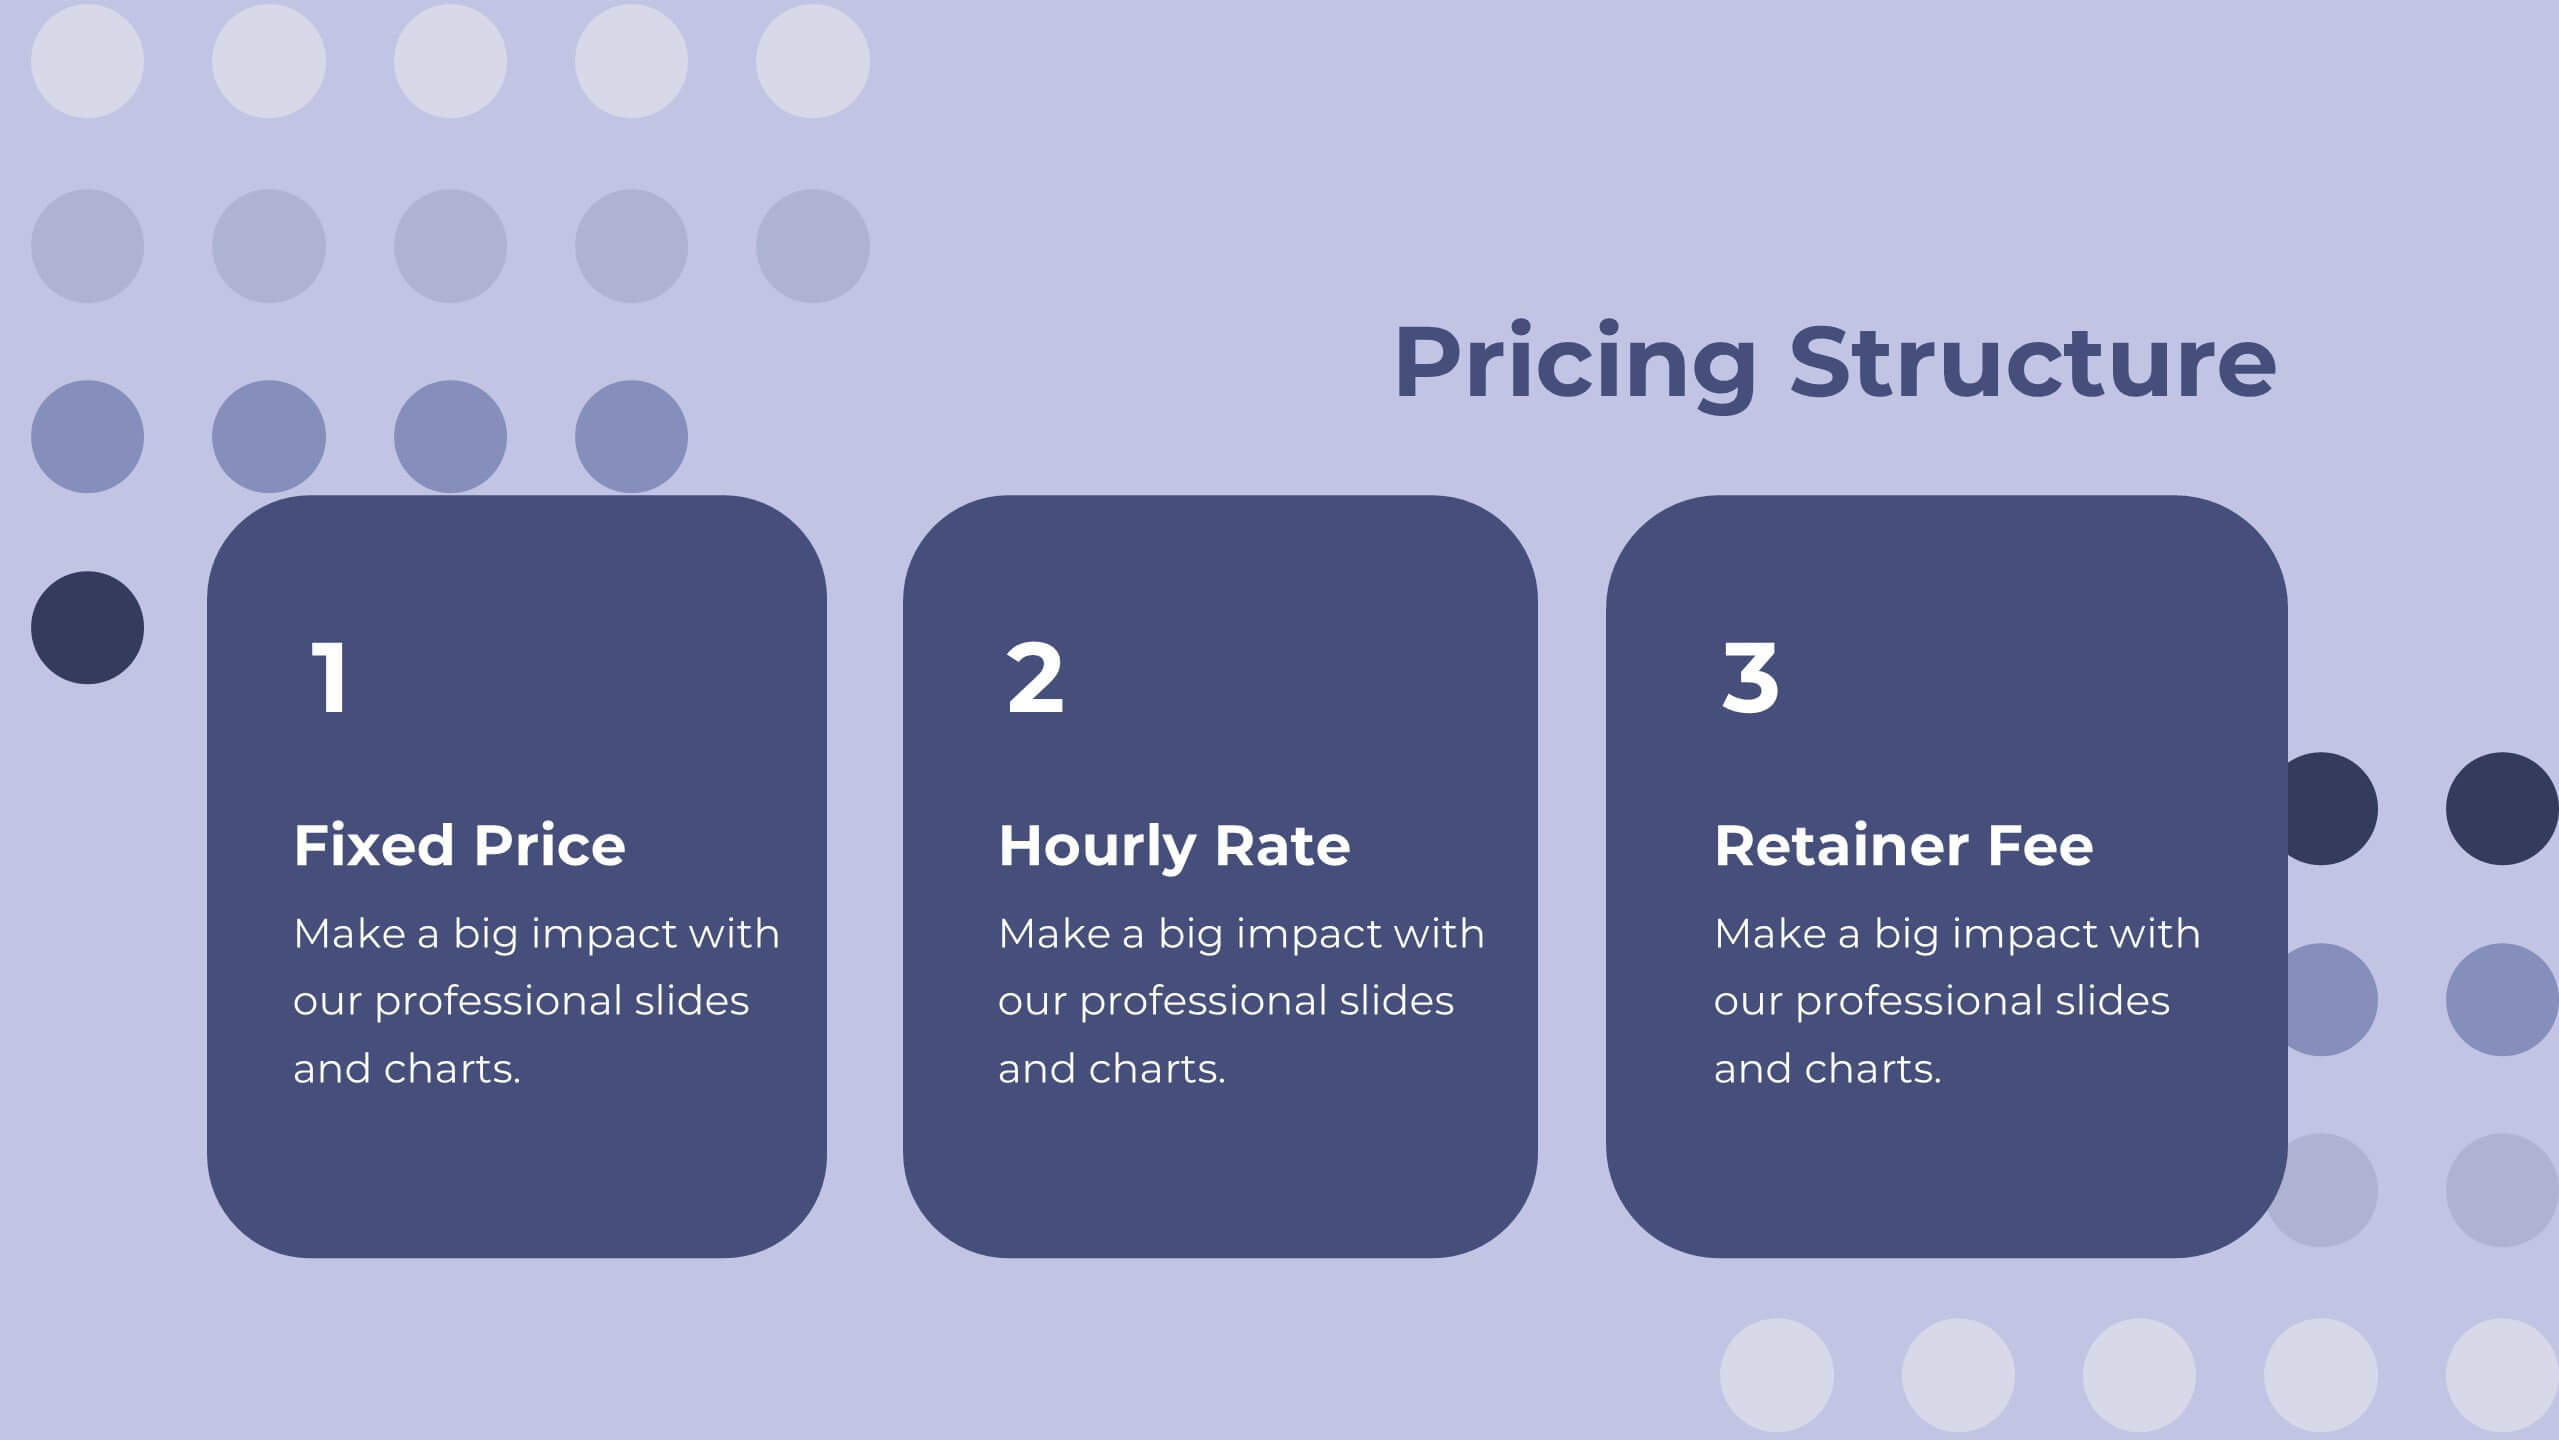
Labyrinth Project Proposal Presentation
Present your project proposal with this clean and professional template! Covering sections such as objectives, scope of work, timeline, and budget breakdown, it helps you convey your plan clearly and effectively. Fully customizable and compatible with PowerPoint, Keynote, and Google Slides, it’s perfect for delivering impactful proposals to clients.


6 diapositivas
Execution Strategy and Action Plan Breakdown Presentation
Clarify your business roadmap with the Execution Strategy and Action Plan Breakdown Presentation. This template helps visualize each strategic step using a clean, linear layout with colorful icons. Perfect for outlining processes, task flows, or operational plans. Easily editable in Canva, PowerPoint, and Google Slides for maximum flexibility.


5 diapositivas
Regional Overview North America Map Presentation
Bring your data to life with a vibrant visual layout that breaks down key insights across different North American regions. This professional design helps you compare performance, track growth, or present market summaries clearly and effectively. Fully compatible with PowerPoint, Keynote, and Google Slides for easy customization and use.


8 diapositivas
Customer Feedback and Review
Highlight real user opinions with this Customer Feedback and Review presentation. Designed to showcase testimonials, star ratings, and satisfaction percentages, each slide offers a clean, card-style layout perfect for product reviews, client testimonials, or user surveys. Fully customizable in PowerPoint, Keynote, and Google Slides.


20 diapositivas
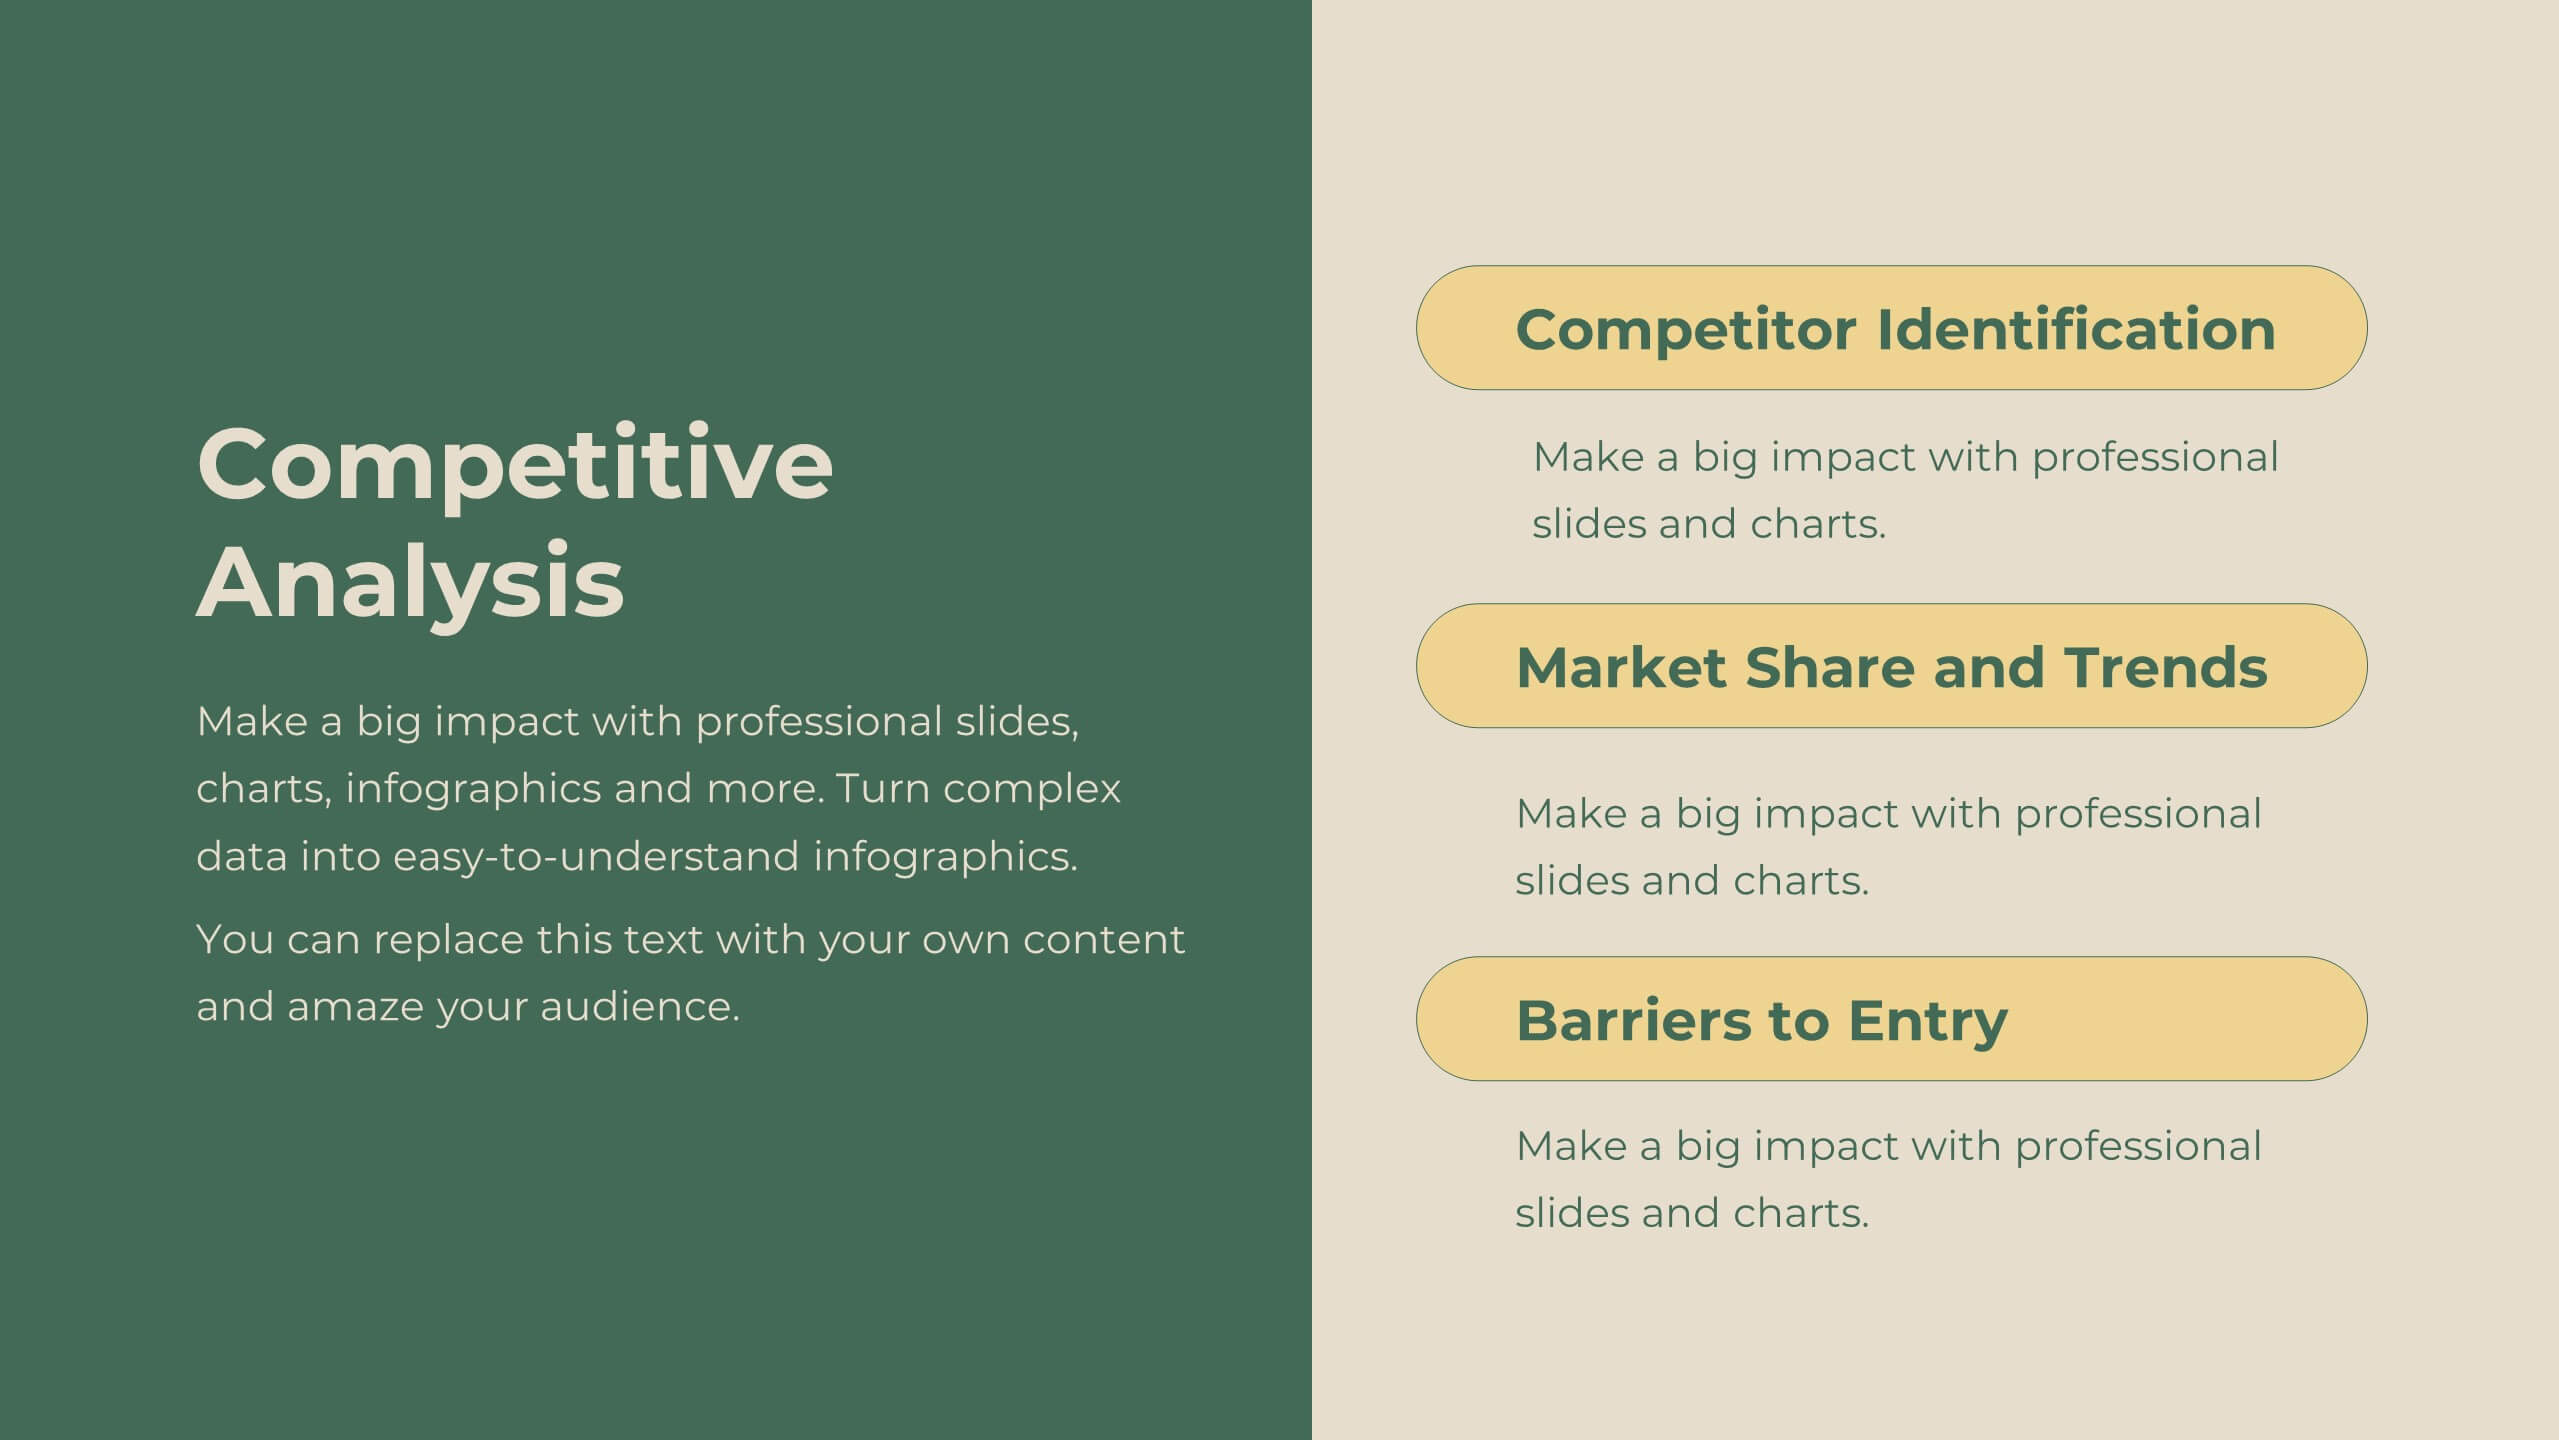
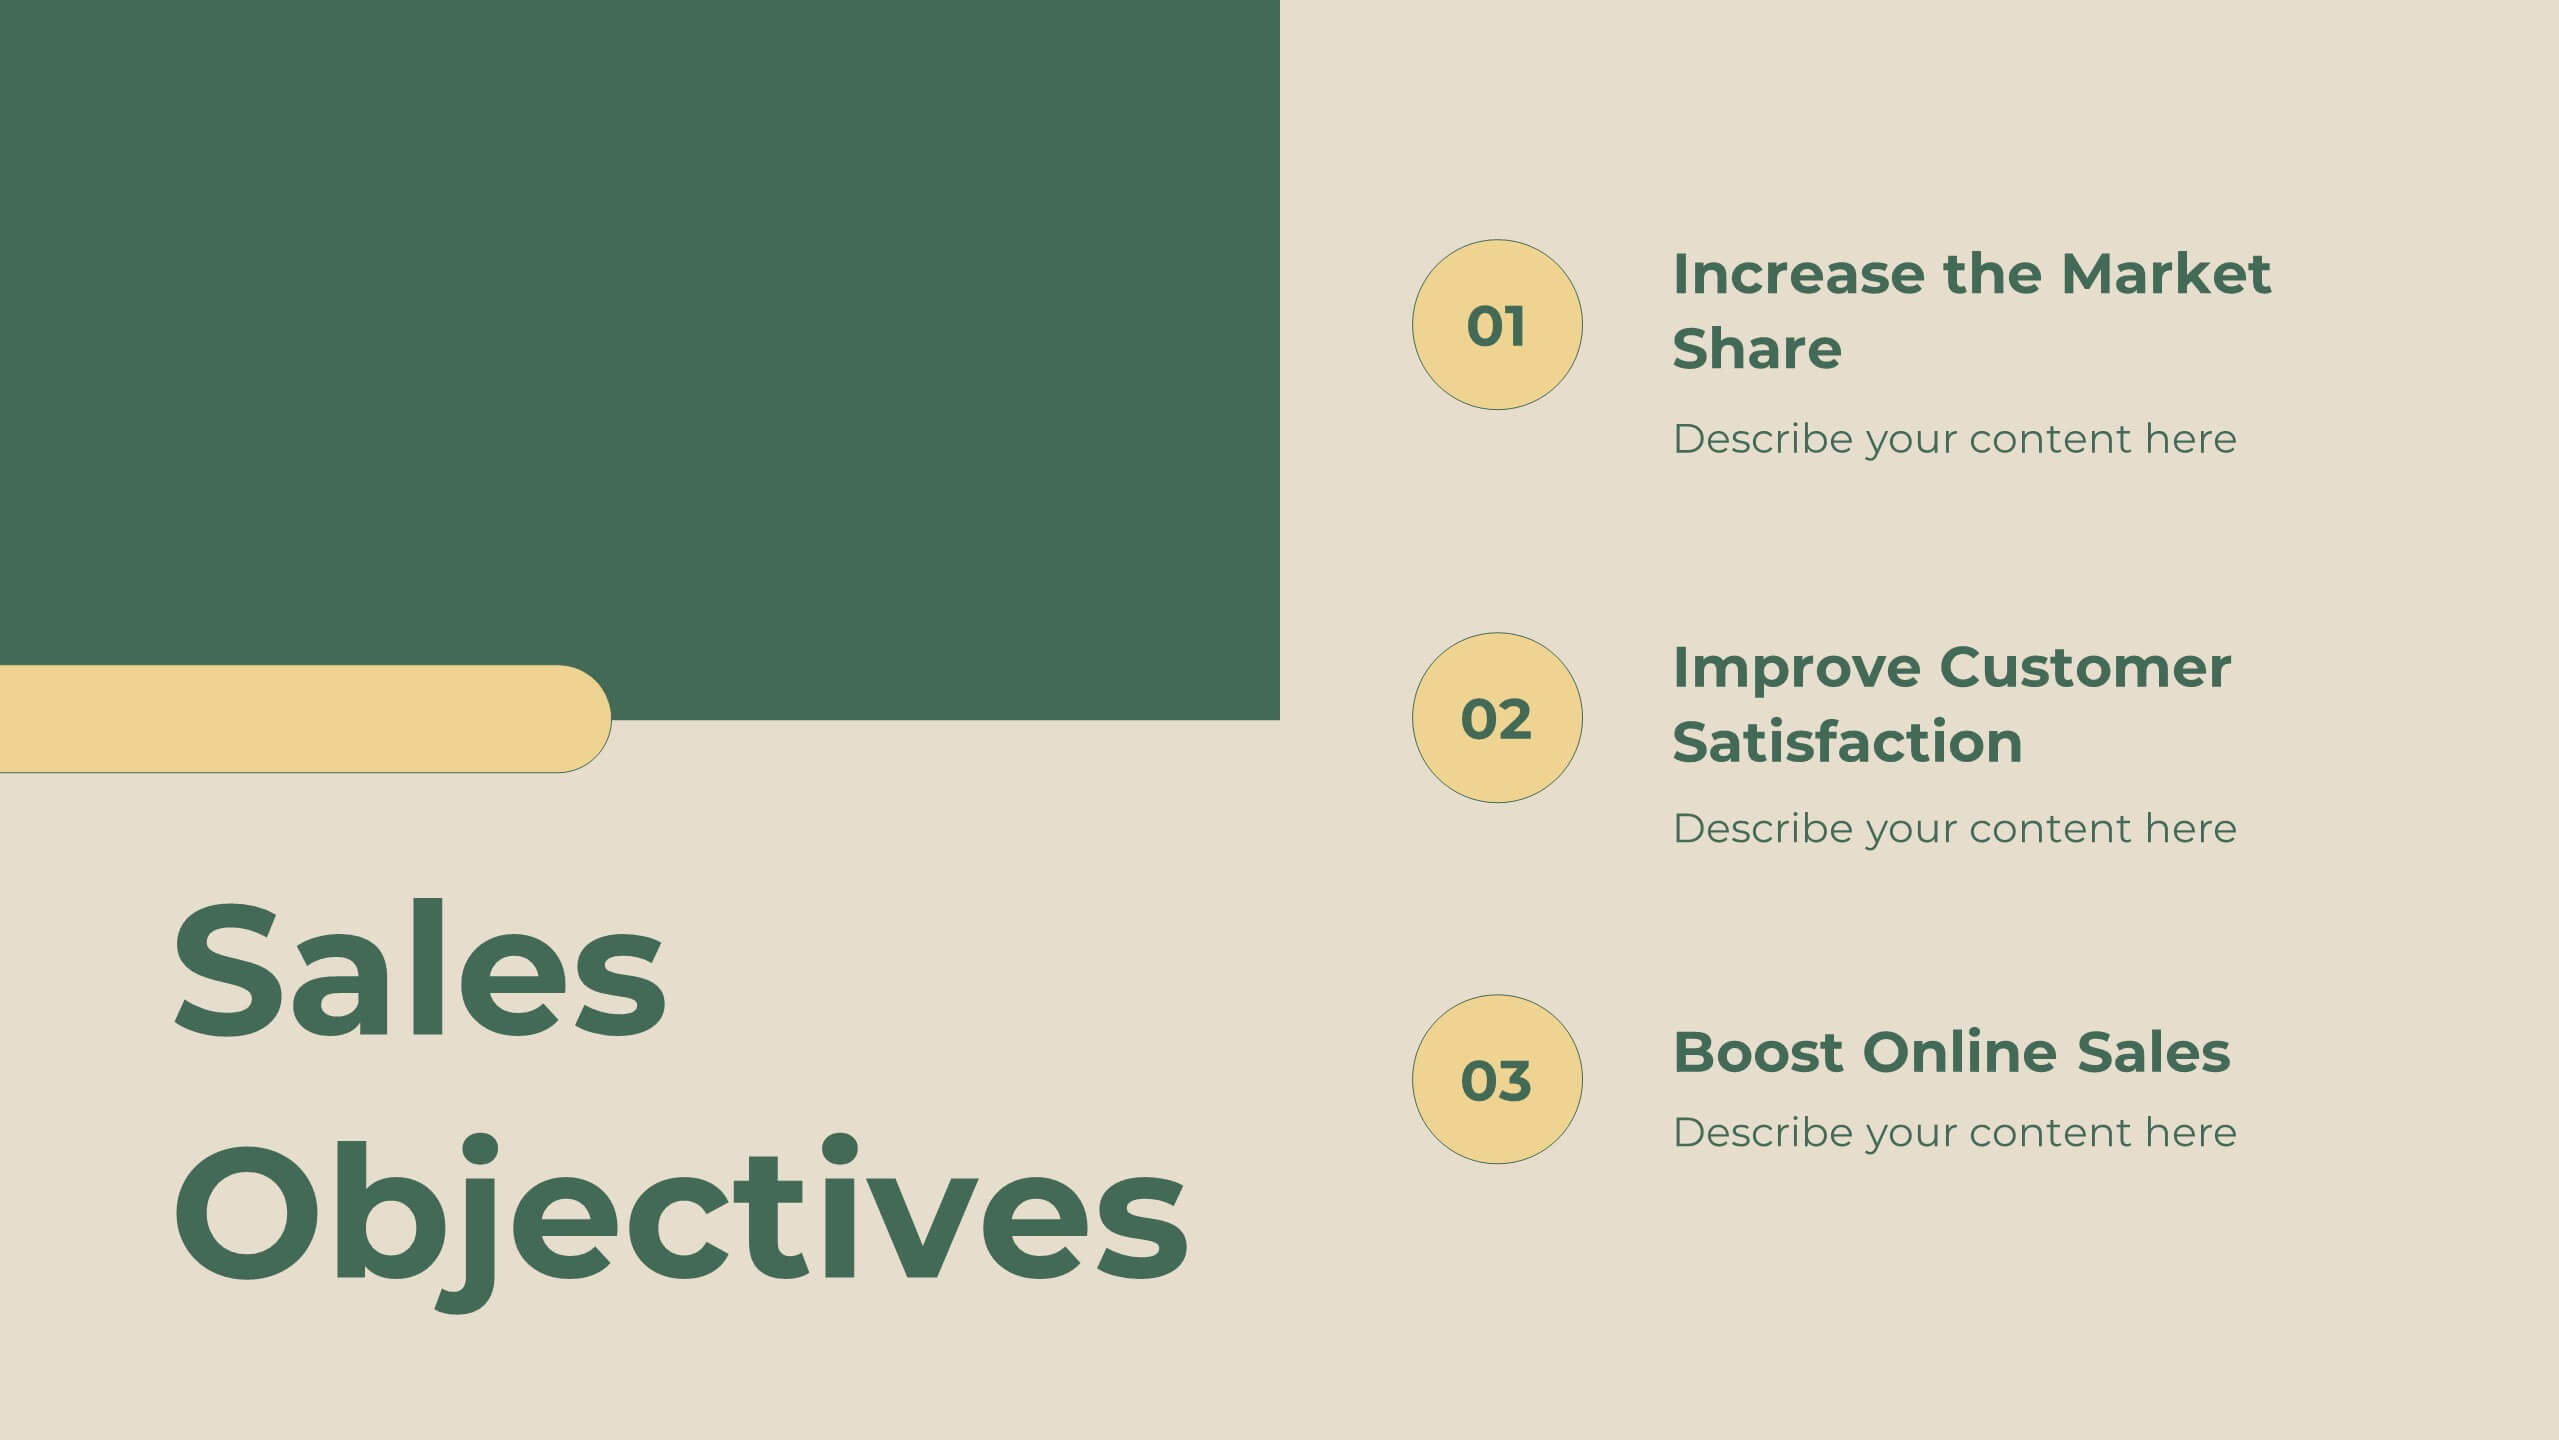
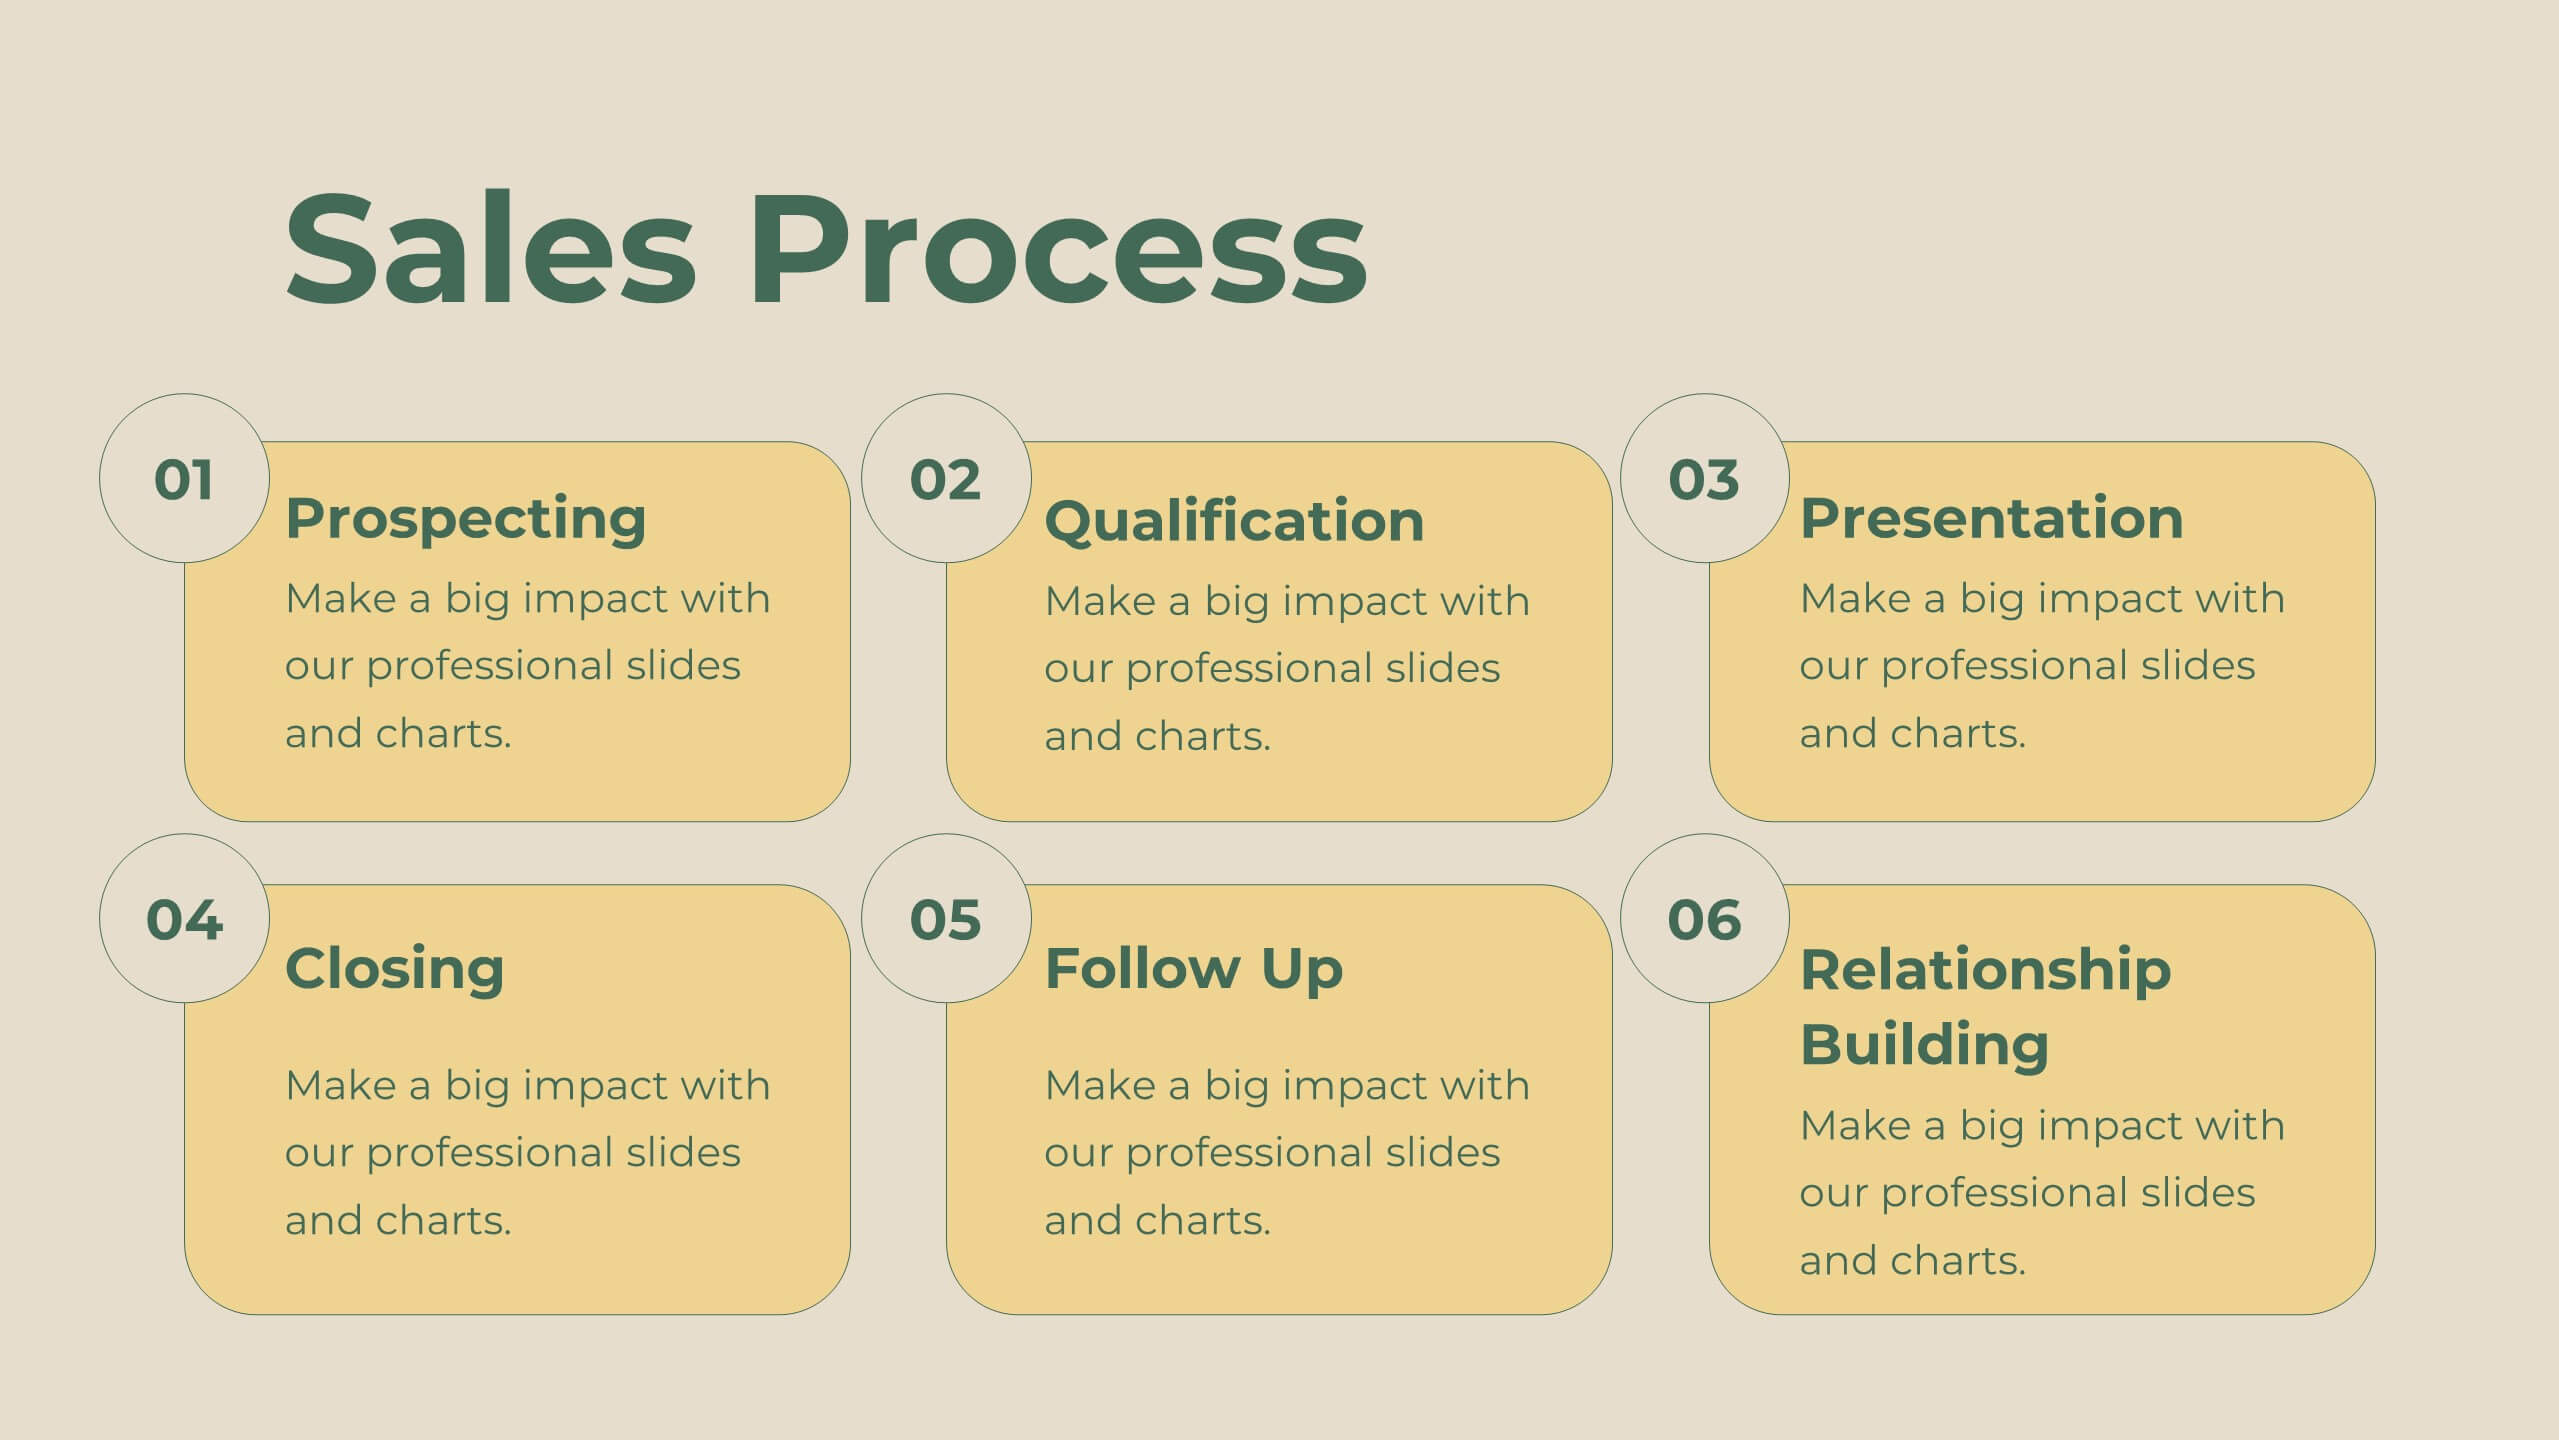
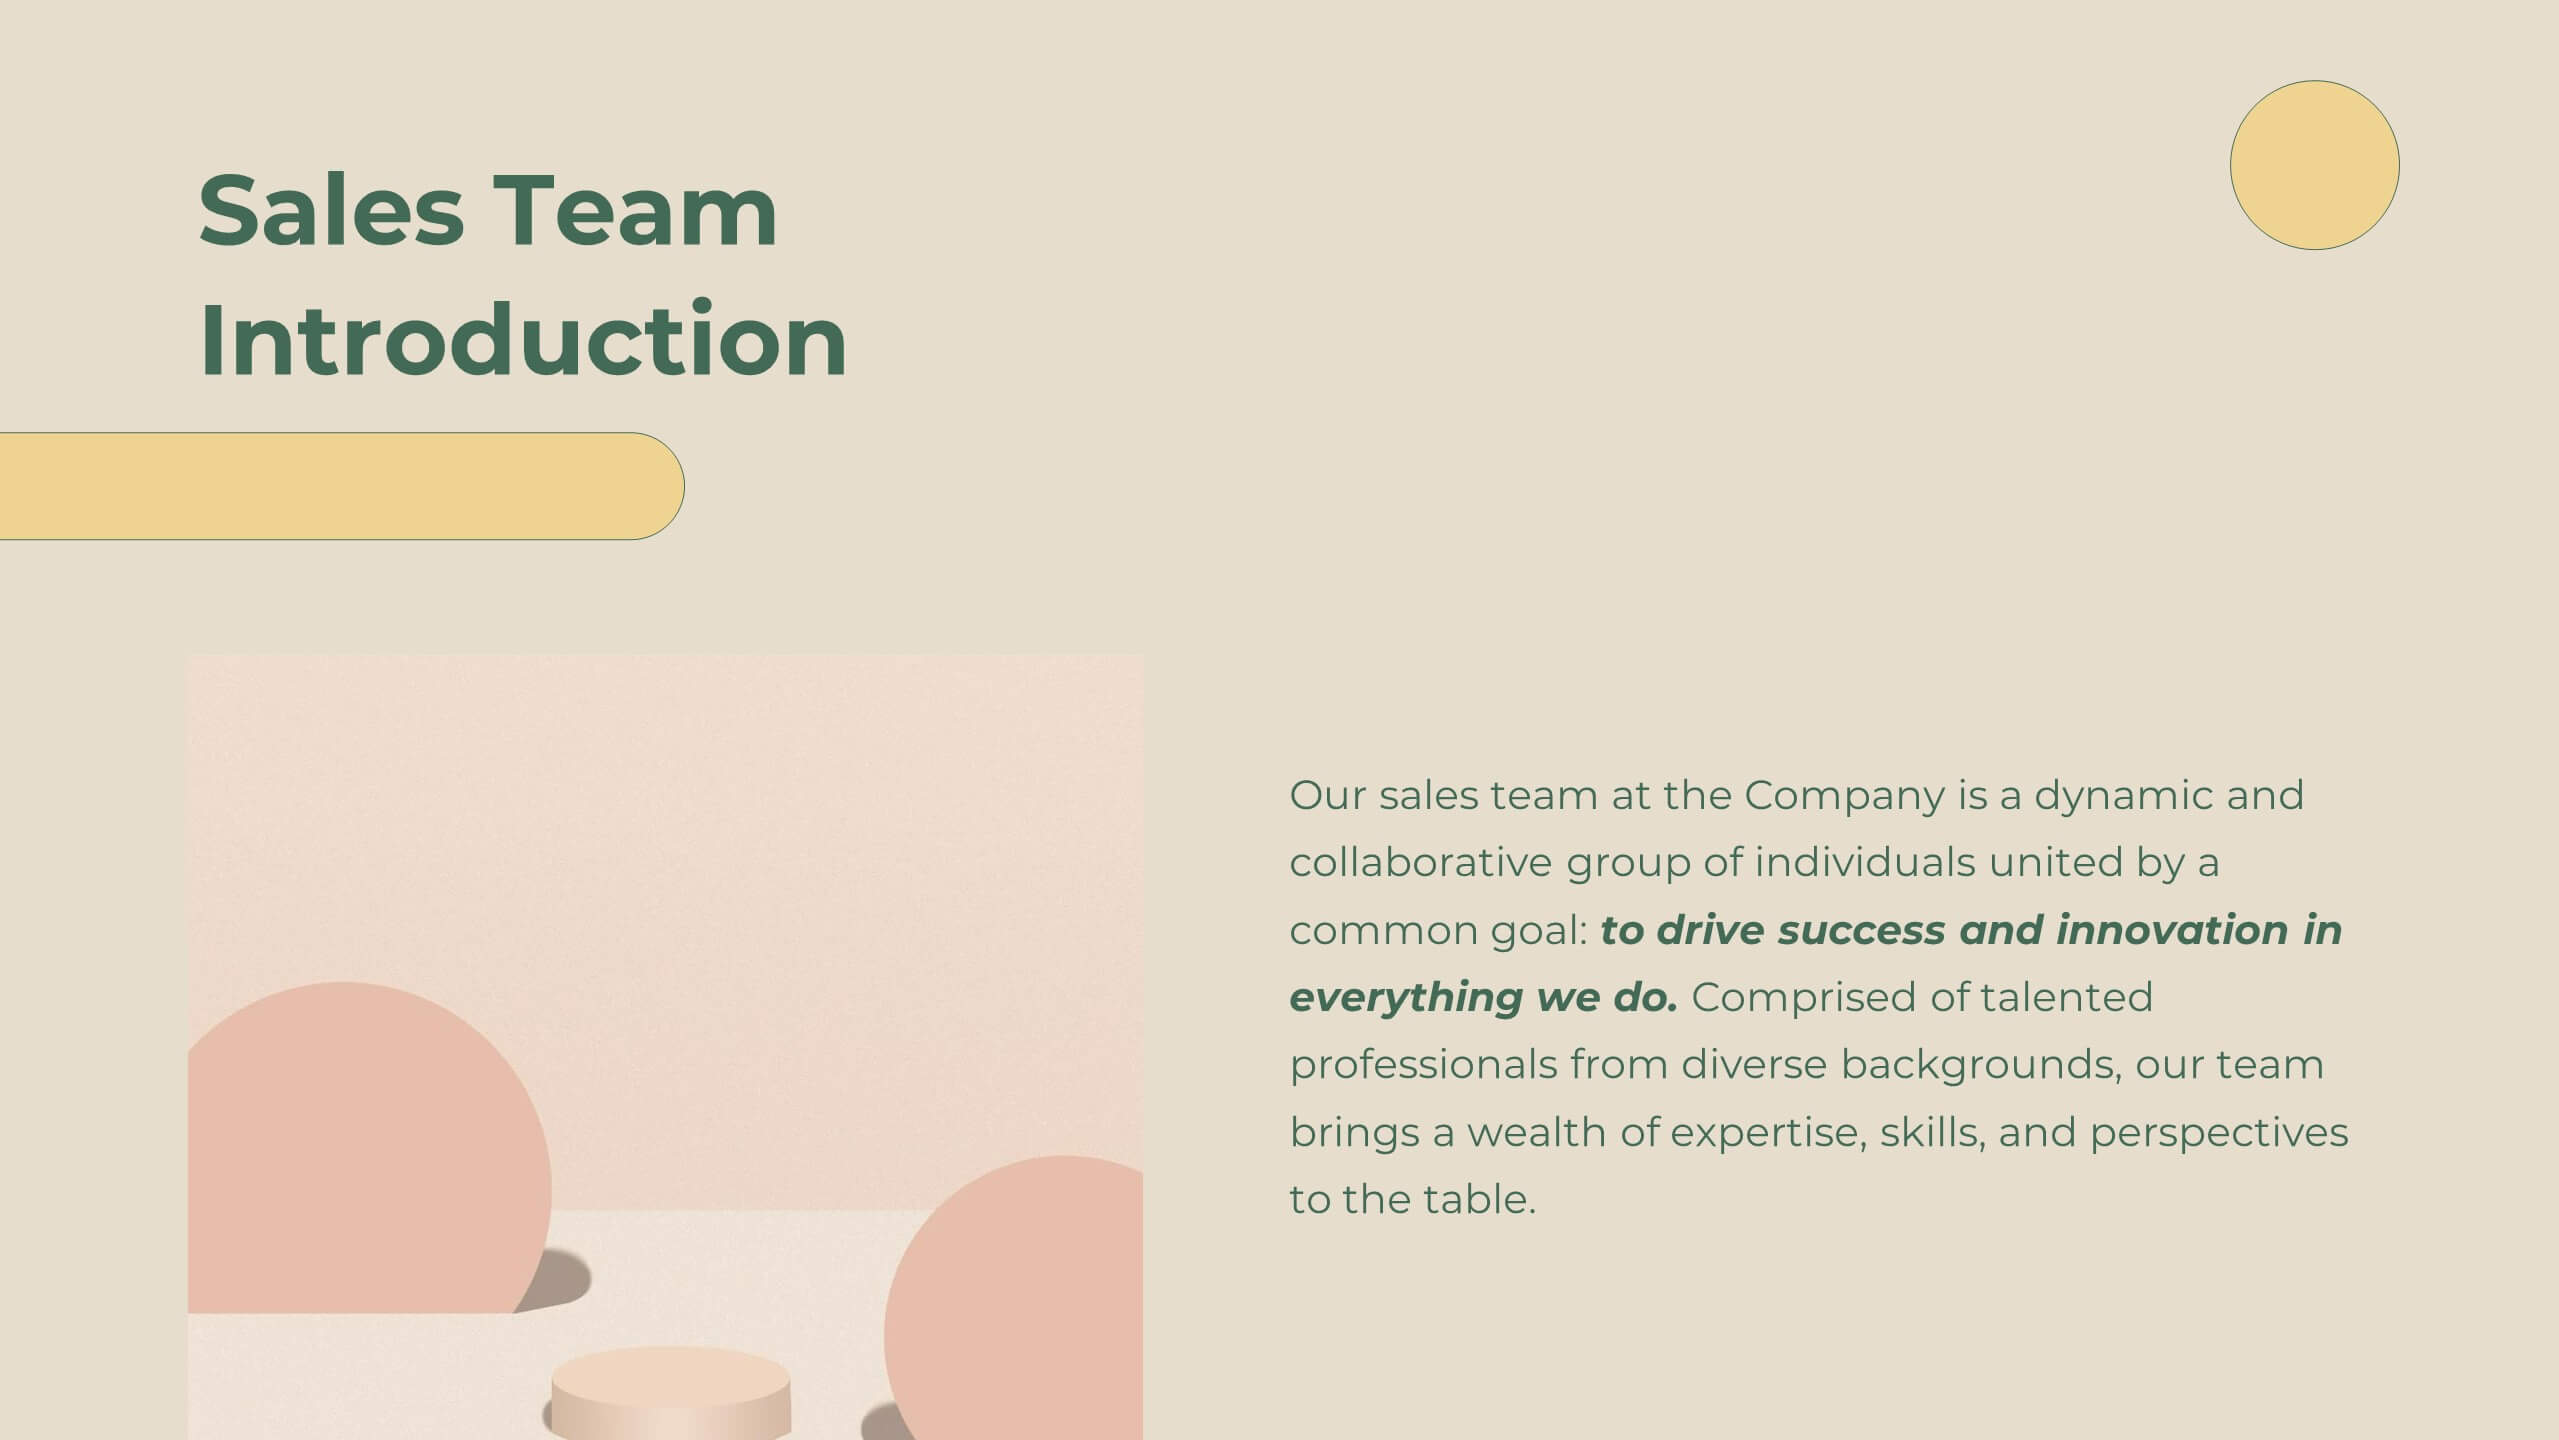
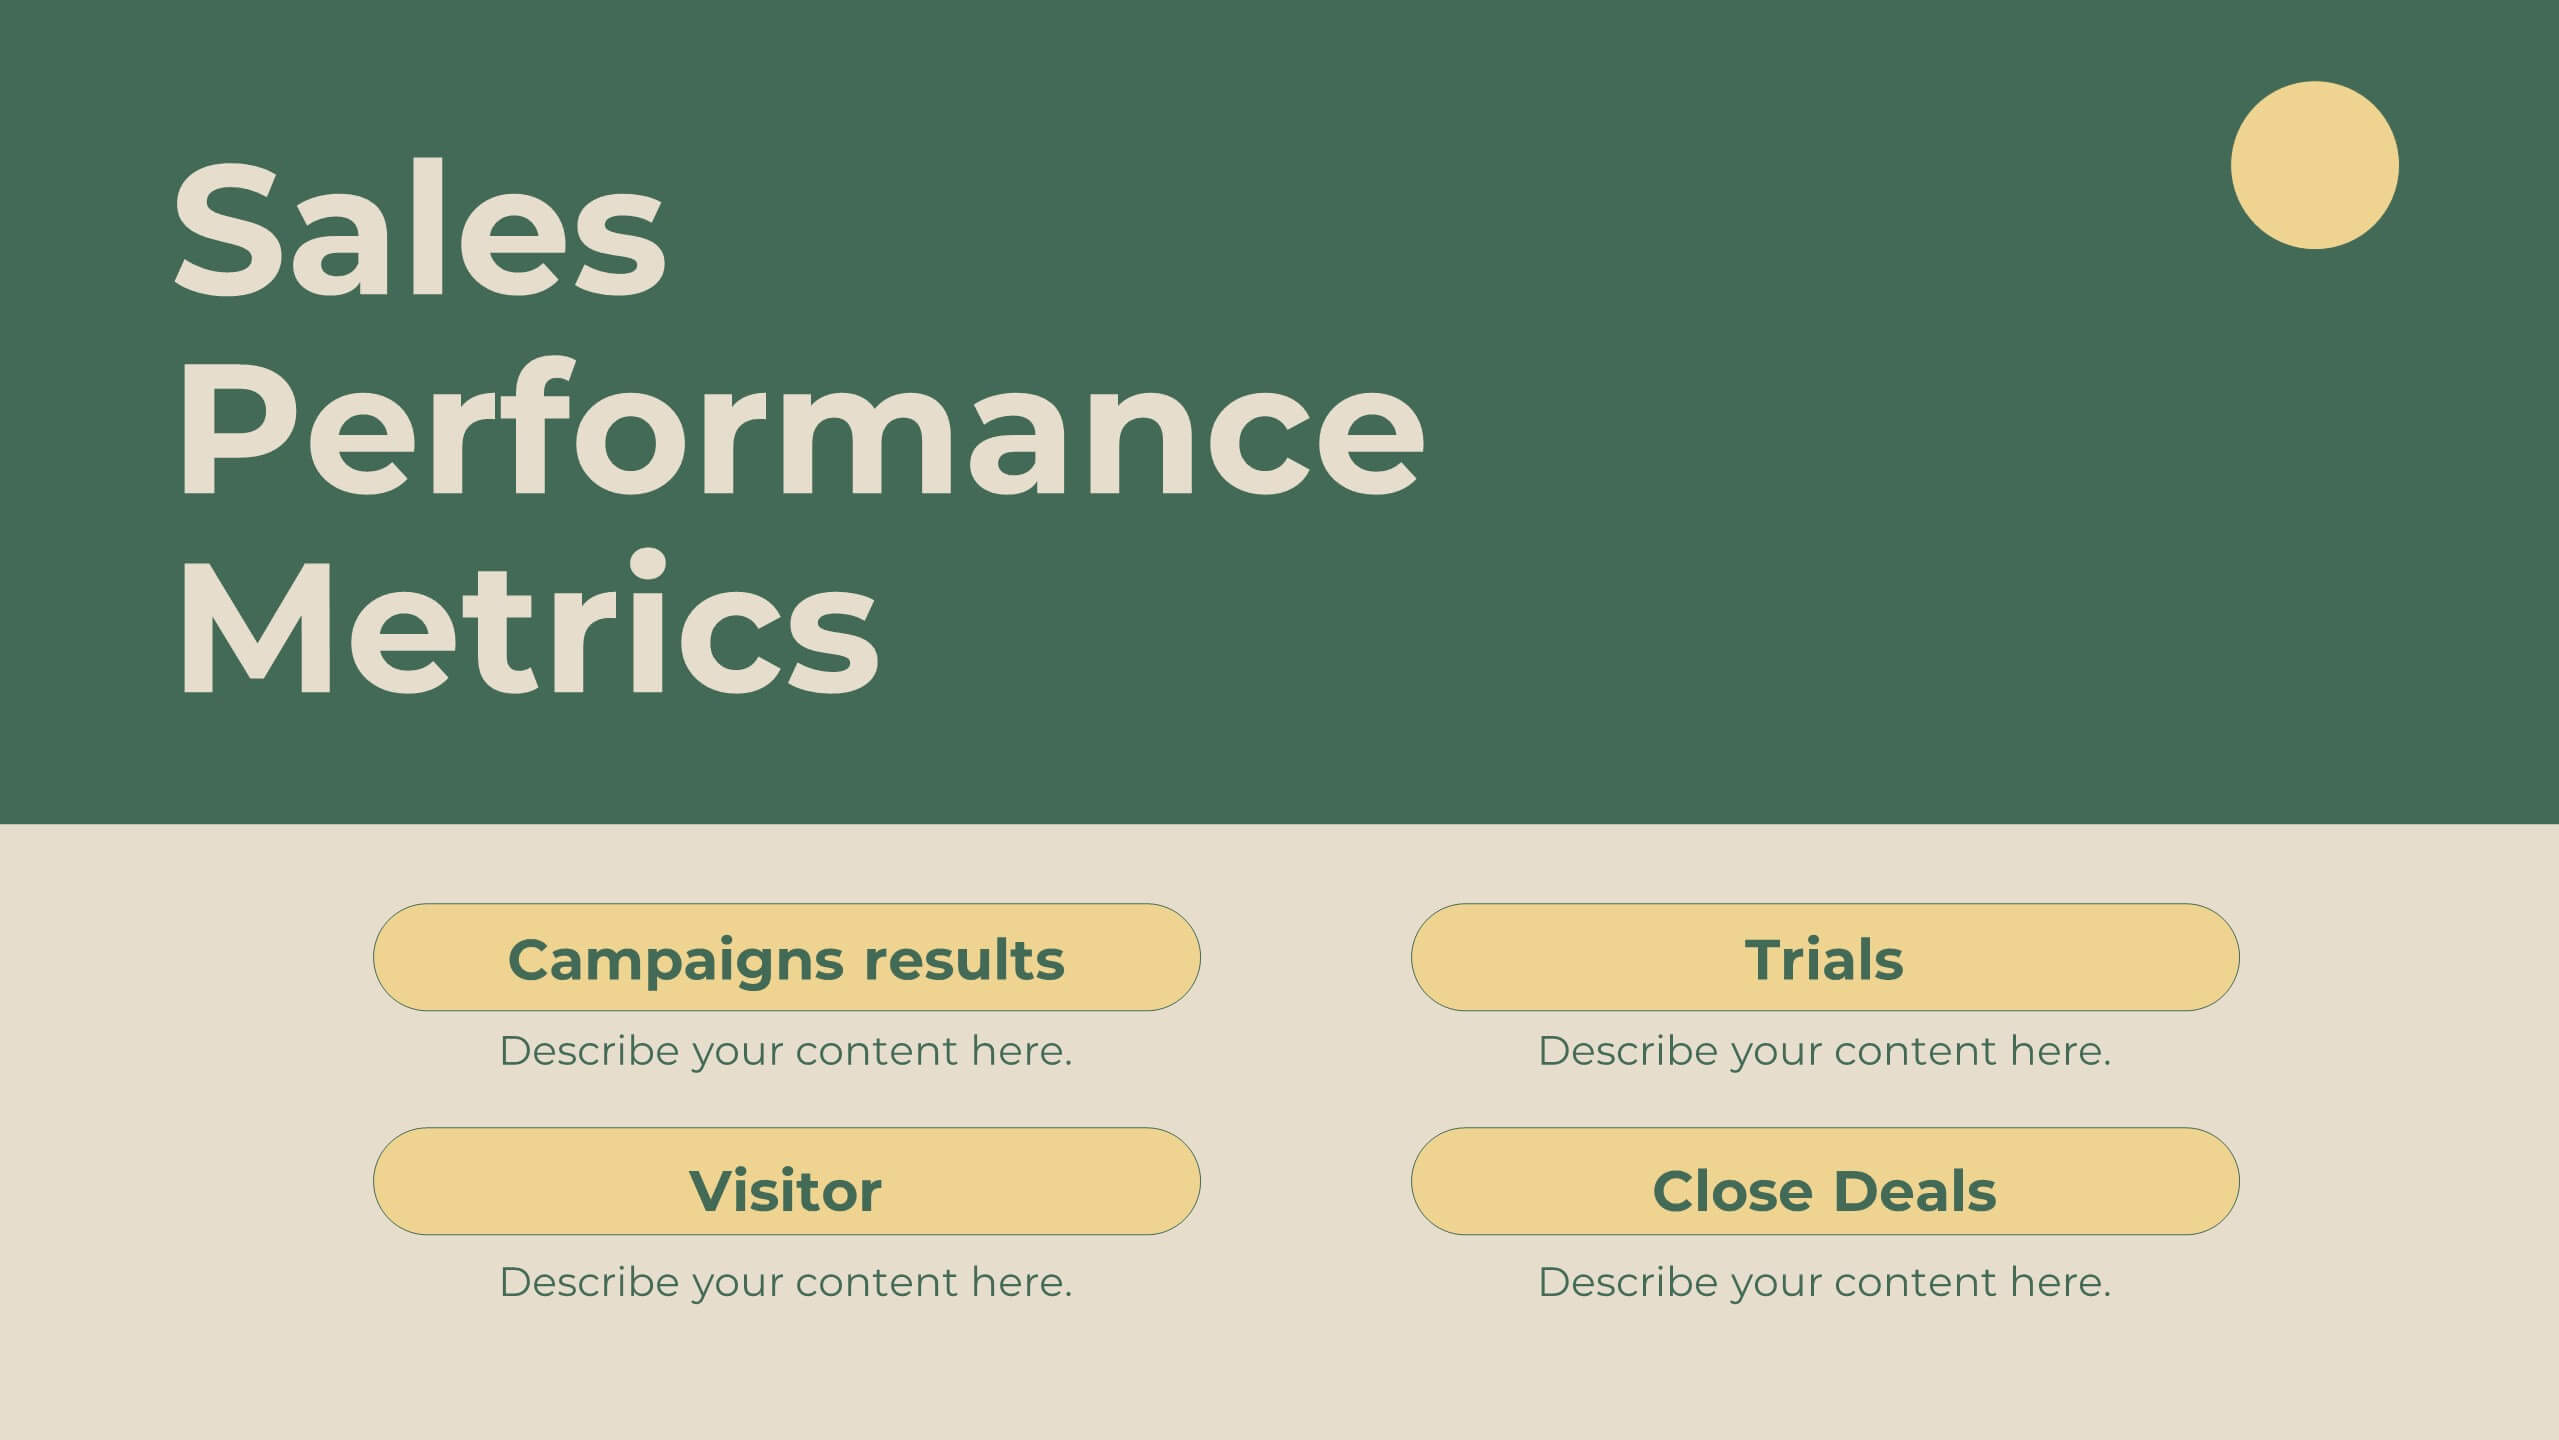
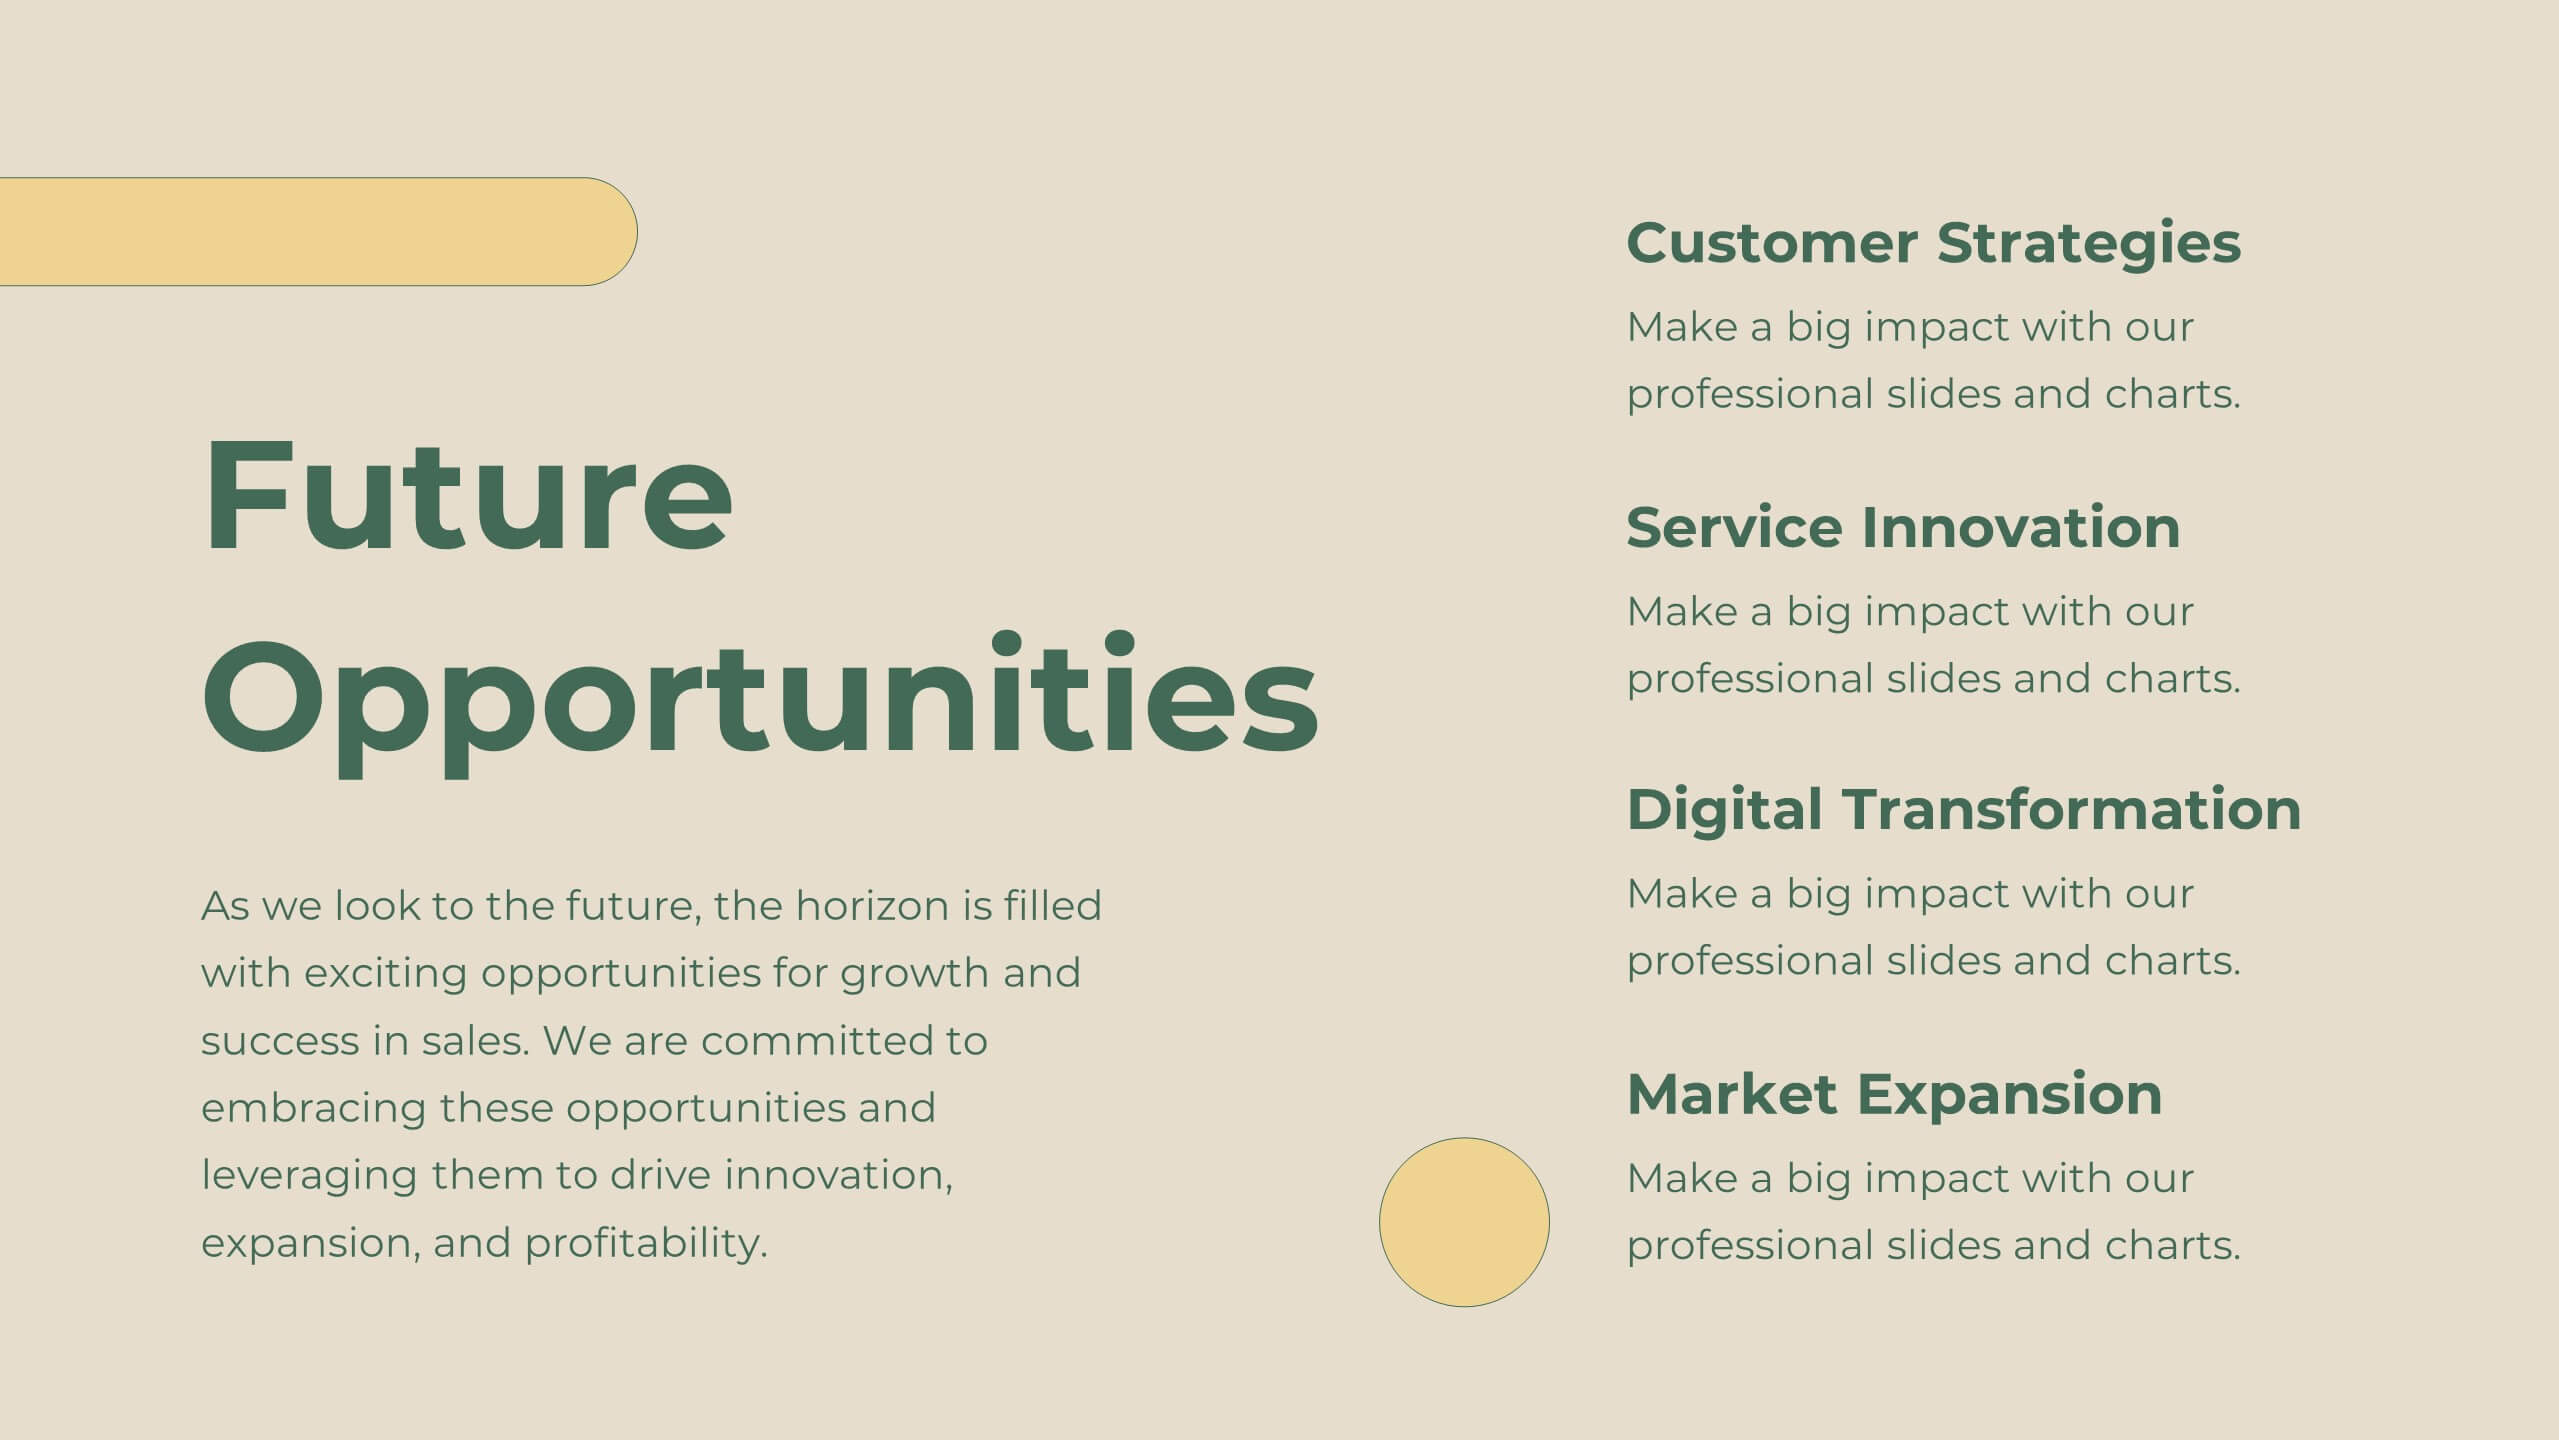
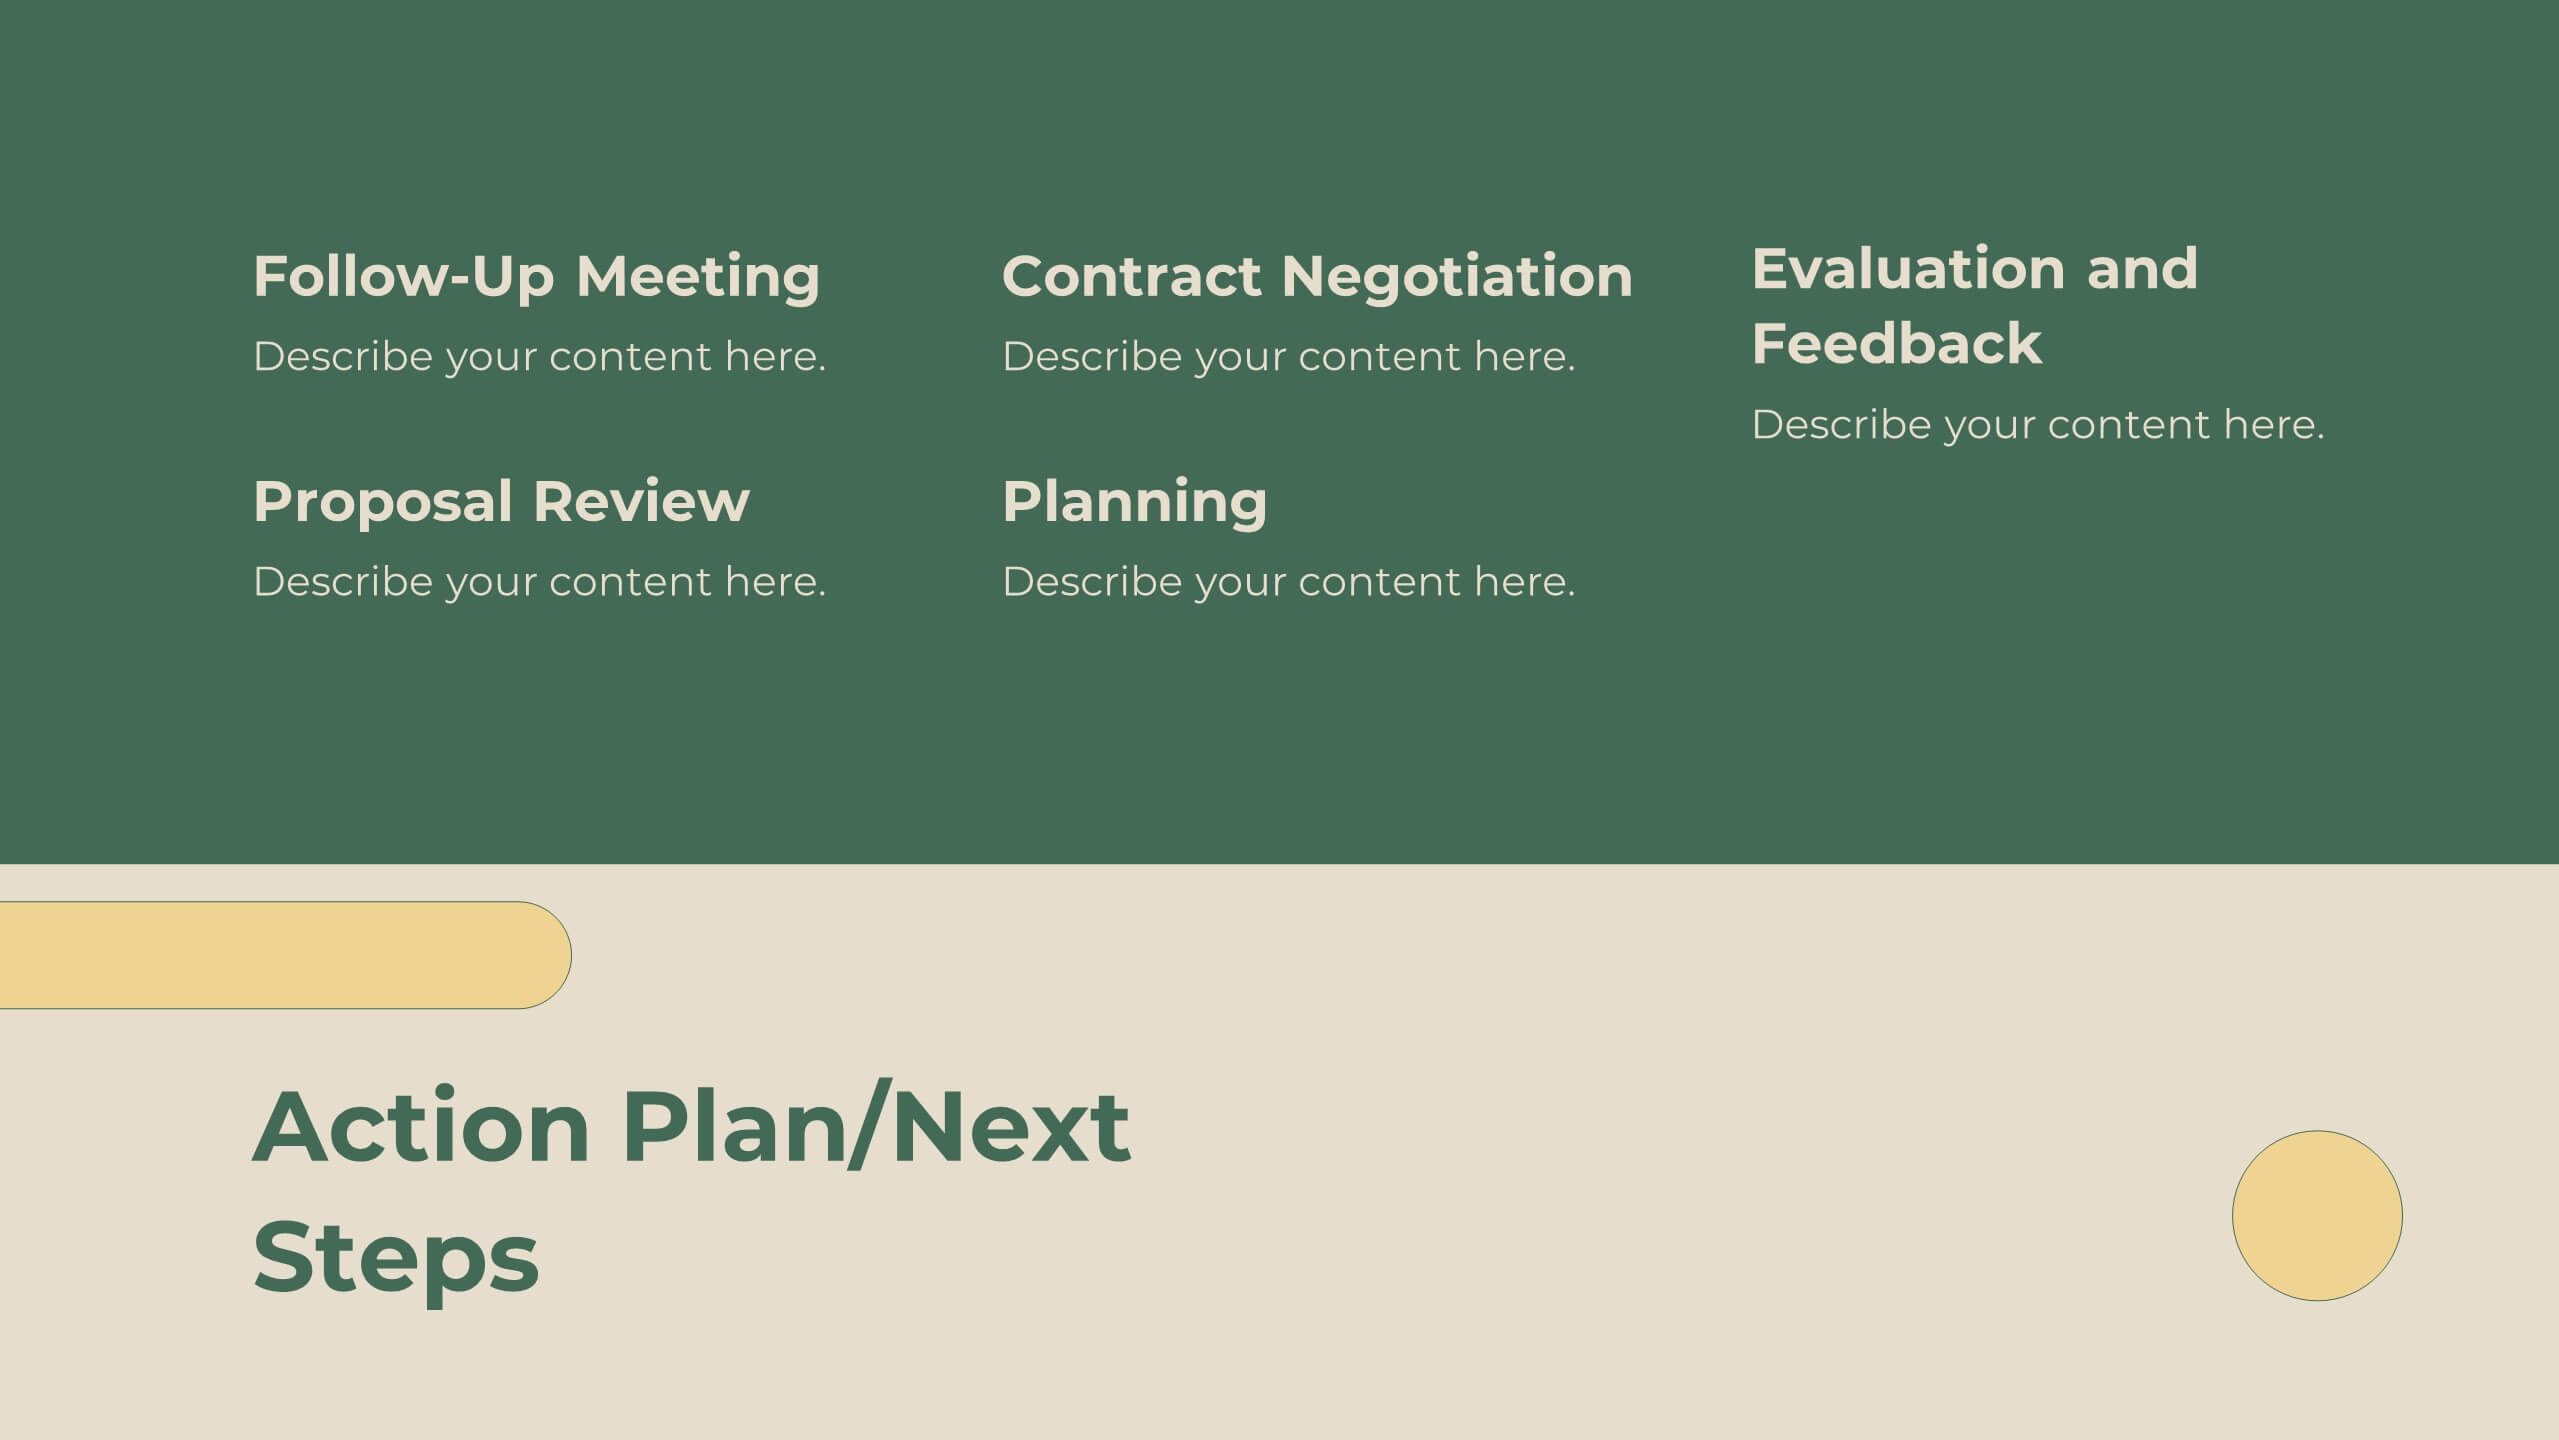
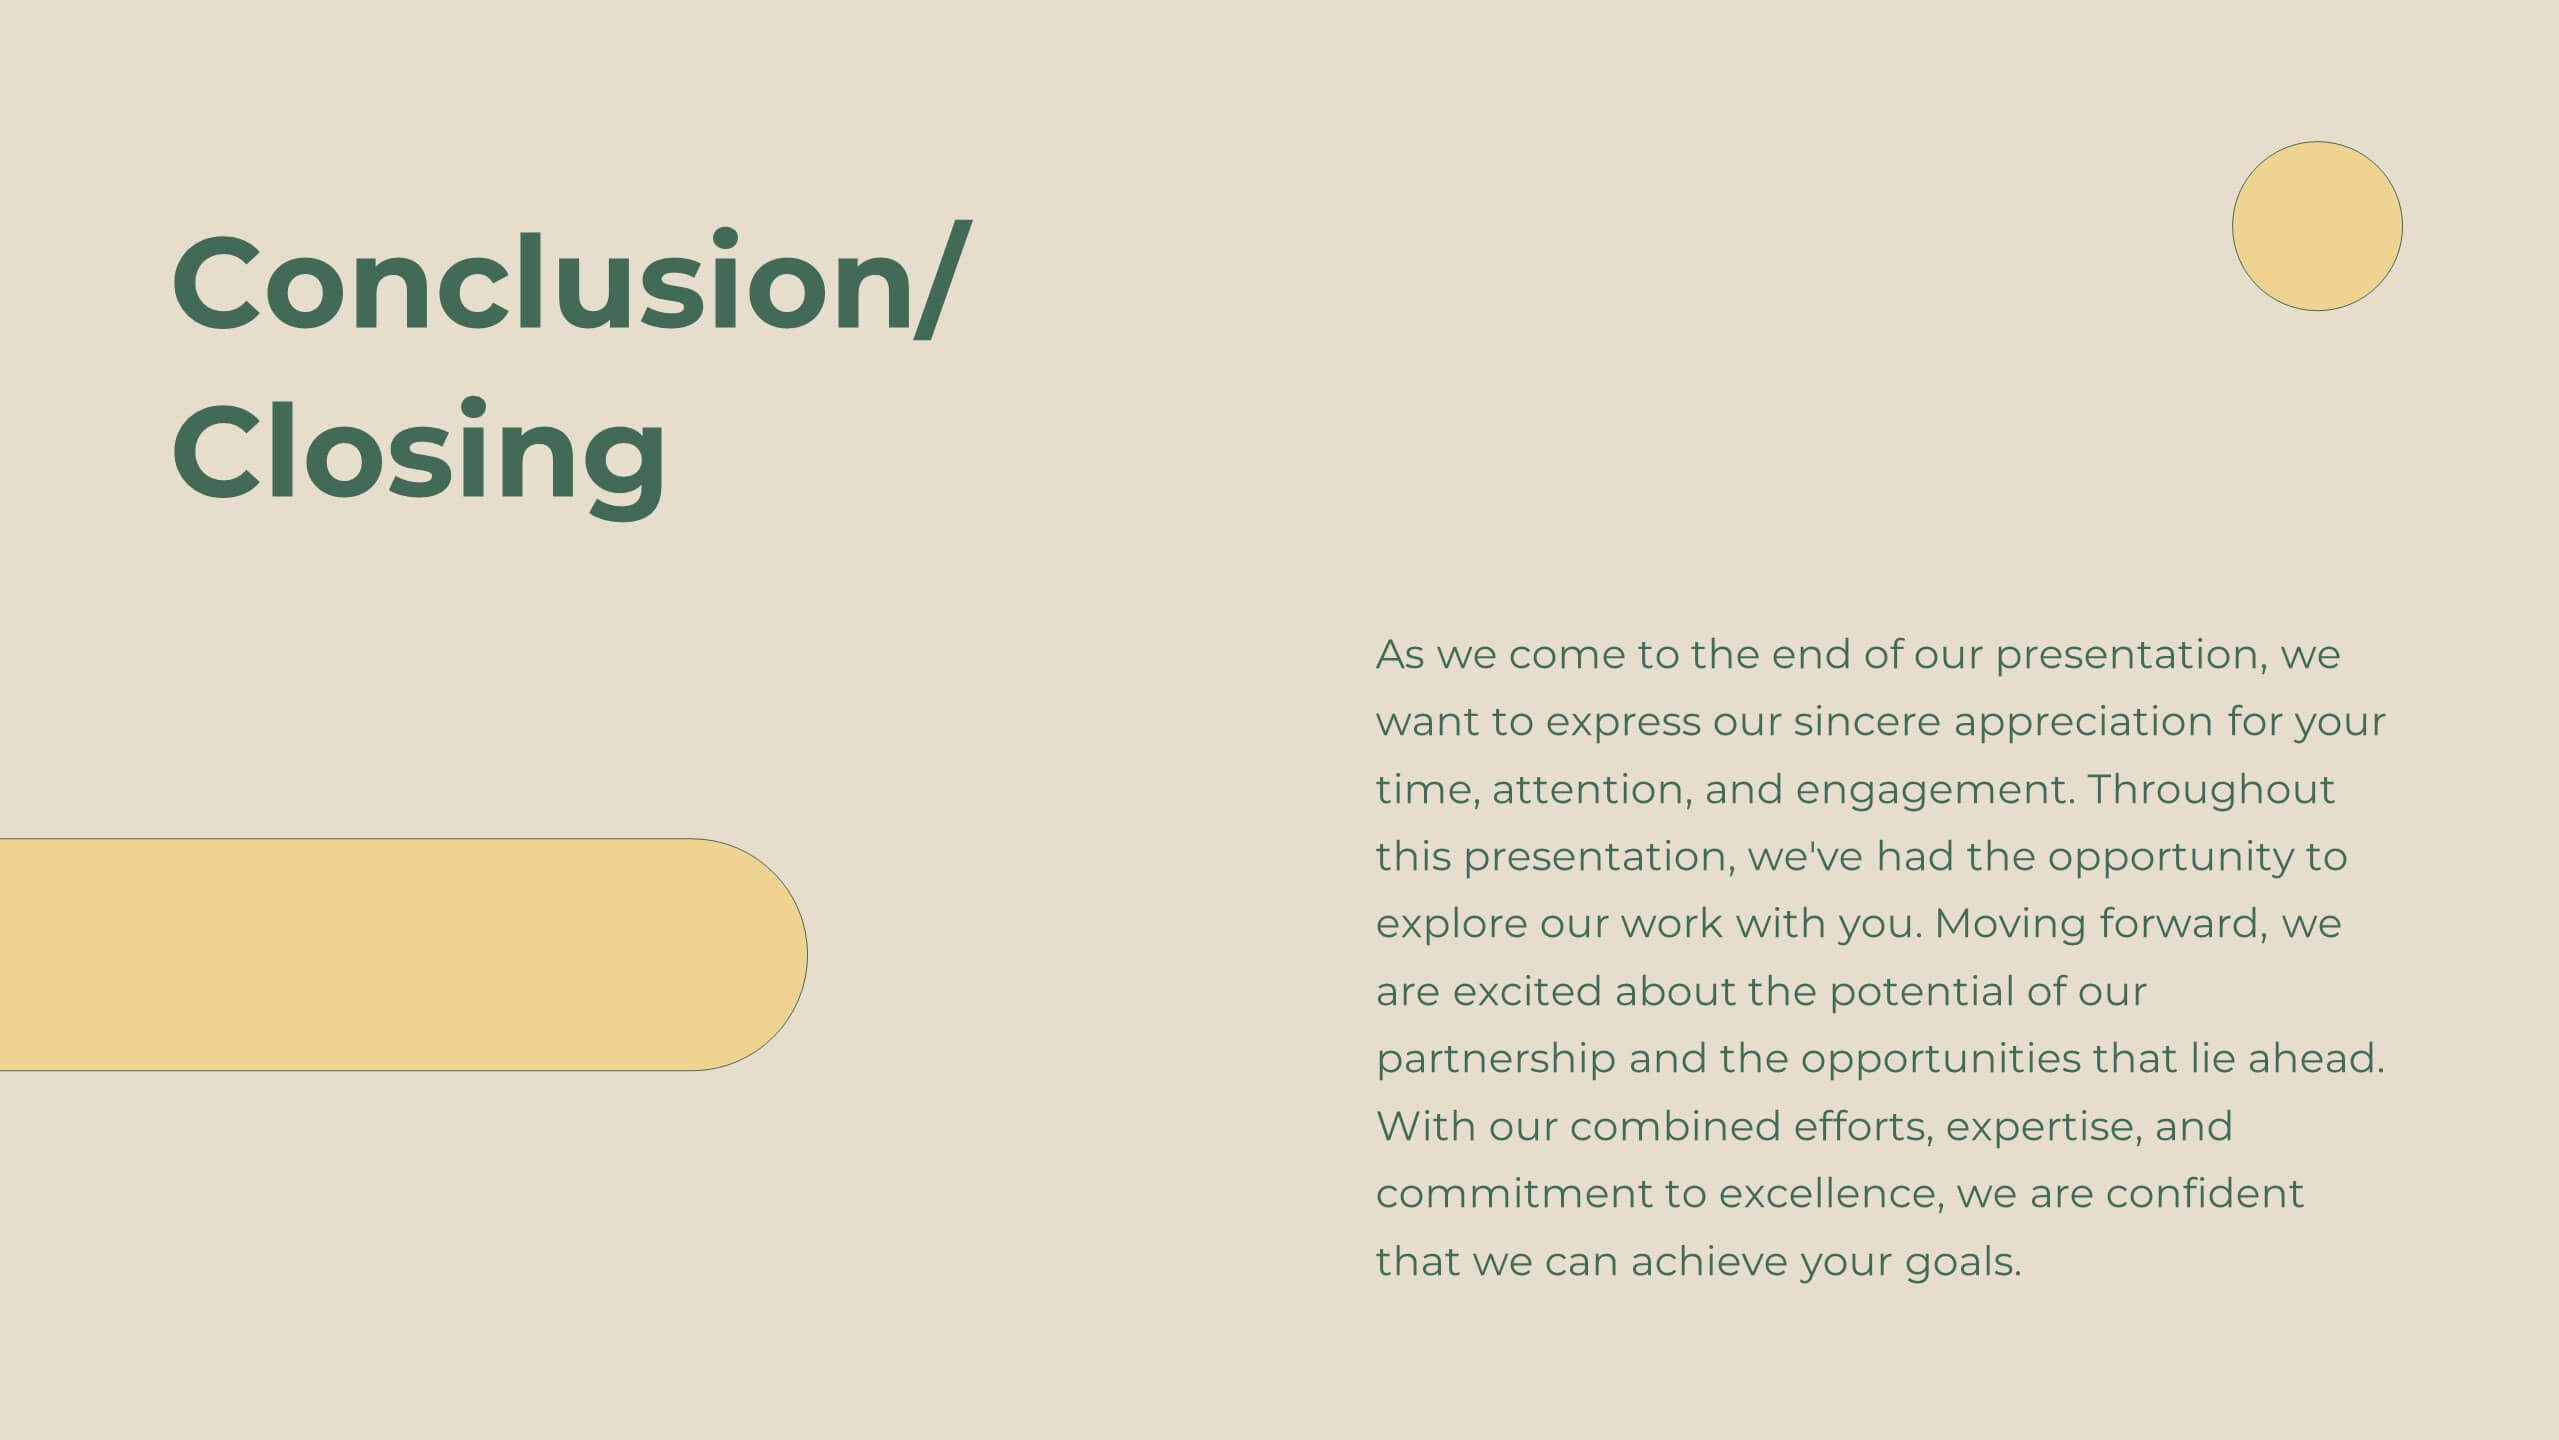
Legacy Sales Strategy Presentation
Boost your sales presentations with this modern template! It features sections for objectives, process, team introduction, customer testimonials, and performance metrics. Ideal for outlining strategies, opportunities, and pricing. Engage your audience with a professional, clean design. Compatible with PowerPoint, Keynote, and Google Slides for seamless integration. Make your sales strategy stand out!


6 diapositivas
Sales Associate Infographic
A sales associate, also known as a sales representative or salesperson, is an individual who is responsible for selling products or services to customers. This infographic template is designed to highlight the key roles, skills, and responsibilities of a sales associate. It provides an informative and engaging overview of the sales associate's role within a company or organization, showcasing their contribution to sales and customer satisfaction. This template is suitable for various industries and can be customized to fit specific company or organizational contexts. Compatible with Powerpoint, Keynote, and Google Slides, this is easily customizable.


20 diapositivas
Aurorium Sales Proposal Presentation
Win over clients with confidence using this sleek and modern sales proposal presentation. Designed to highlight key business strategies, pricing plans, competitive analysis, and future opportunities, this template helps you communicate your value with clarity and impact. Fully customizable and compatible with PowerPoint, Keynote, and Google Slides for seamless presentations.


7 diapositivas
Inversion Table Infographic
A table infographic is a visual representation of data or information presented in a tabular format, using a combination of text, numbers, and visual elements to make the information more engaging and easily understandable. This infographic template is great for comparing two or more variables and is a powerful way to convey your data. This infographic is designed to show your audience the key points of your data in a visually appealing way. This template is a good option if you want to present your information as an easy-to-read table with labels and numbers. The bright colors and fun design make it easy to see at a glance.


6 diapositivas
Cloud Computing Infographic
Cloud Computing refers to the delivery of computing services over the internet, allowing users to access and use resources such as storage, applications, and processing power on-demand. This infographic template is designed to provide an overview of cloud computing technology. It aims to explain the concept of cloud computing, its benefits, and its impact on various industries and everyday life. This can be used as valuable resource for individuals and organizations seeking to understand the fundamentals and benefits of cloud computing. Compatible with Powerpoint, Keynote, and Google Slide.


10 diapositivas
Startup Executive Overview Template Presentation
Bring your startup’s big picture to life in one smart, visual swoop! This infographic presentation template helps you map out key insights and milestones in a clean, modern layout. Ideal for pitching ideas, aligning teams, or showcasing growth strategies. Fully compatible with PowerPoint, Keynote, and Google Slides for easy editing.


5 diapositivas
RAPID Decision-Making Roles Overview Presentation
Clarify accountability and streamline decisions with the RAPID Decision-Making Roles Overview Presentation. This visual layout breaks down the five essential roles—Recommend, Agree, Perform, Input, and Decide—into a clear quadrant diagram. Ideal for project teams, leadership alignment, or decision-making workshops. Fully editable in PowerPoint, Google Slides, Keynote, and Canva.


7 diapositivas
Competitive Advantage Through Value Chain
Make your value chain comparison stand out with this bold, visual slide that maps two sides head-to-head. Perfect for highlighting competitive advantages, strategic differences, and operational gaps. This template is clear, customizable, and ready to plug into PowerPoint, Keynote, or Google Slides.