


Características


¿Tienes alguna pregunta?
Recomendar


5 diapositivas
Mission and Values Alignment
Align your purpose with progress using this clean, directional layout that maps your mission, core values, and strategic focus in a unified flow. Perfect for internal briefings or culture decks, this slide visually connects each value to your organizational journey. Fully compatible with PowerPoint, Keynote, and Google Slides.


21 diapositivas
Planetar Startup Strategy Presentation
This Startup Strategy Presentation offers a modern and structured layout to showcase your startup’s mission, vision, market analysis, and financial projections. Designed for entrepreneurs and investors, it includes sections on customer needs, growth plans, and milestones. Fully customizable and compatible with PowerPoint, Keynote, and Google Slides.


5 diapositivas
Data Distribution with Pie Chart Visuals Presentation
Visualize complex metrics with ease using the Data Distribution with Pie Chart Visuals Presentation. This slide design integrates a clean side-by-side layout of a colorful pie chart and a five-point legend, making it ideal for showcasing proportions, segments, or performance breakdowns. Each item features an icon and customizable text to clearly label your data points. Perfect for business analysts, marketers, and financial teams, the slide is editable in PowerPoint, Keynote, and Google Slides. It’s a great choice for delivering data-driven insights in a simple, visual format.


7 diapositivas
Finance Dashboard Infographic
A finance dashboard is a visual representation of financial data and key performance indicators (KPIs) that provides an overview of an organization's financial health and performance. This infographic template is a tool that allows users to monitor and analyze financial data in a clear and concise manner. This offers a comprehensive overview of financial performance, budgeting, and forecasting for individuals or businesses. The template features a clean and modern design with a professional color scheme, easy-to-read fonts, and intuitive layout. The visuals are thoughtfully organized to convey financial information effectively and engage the audience.


21 diapositivas
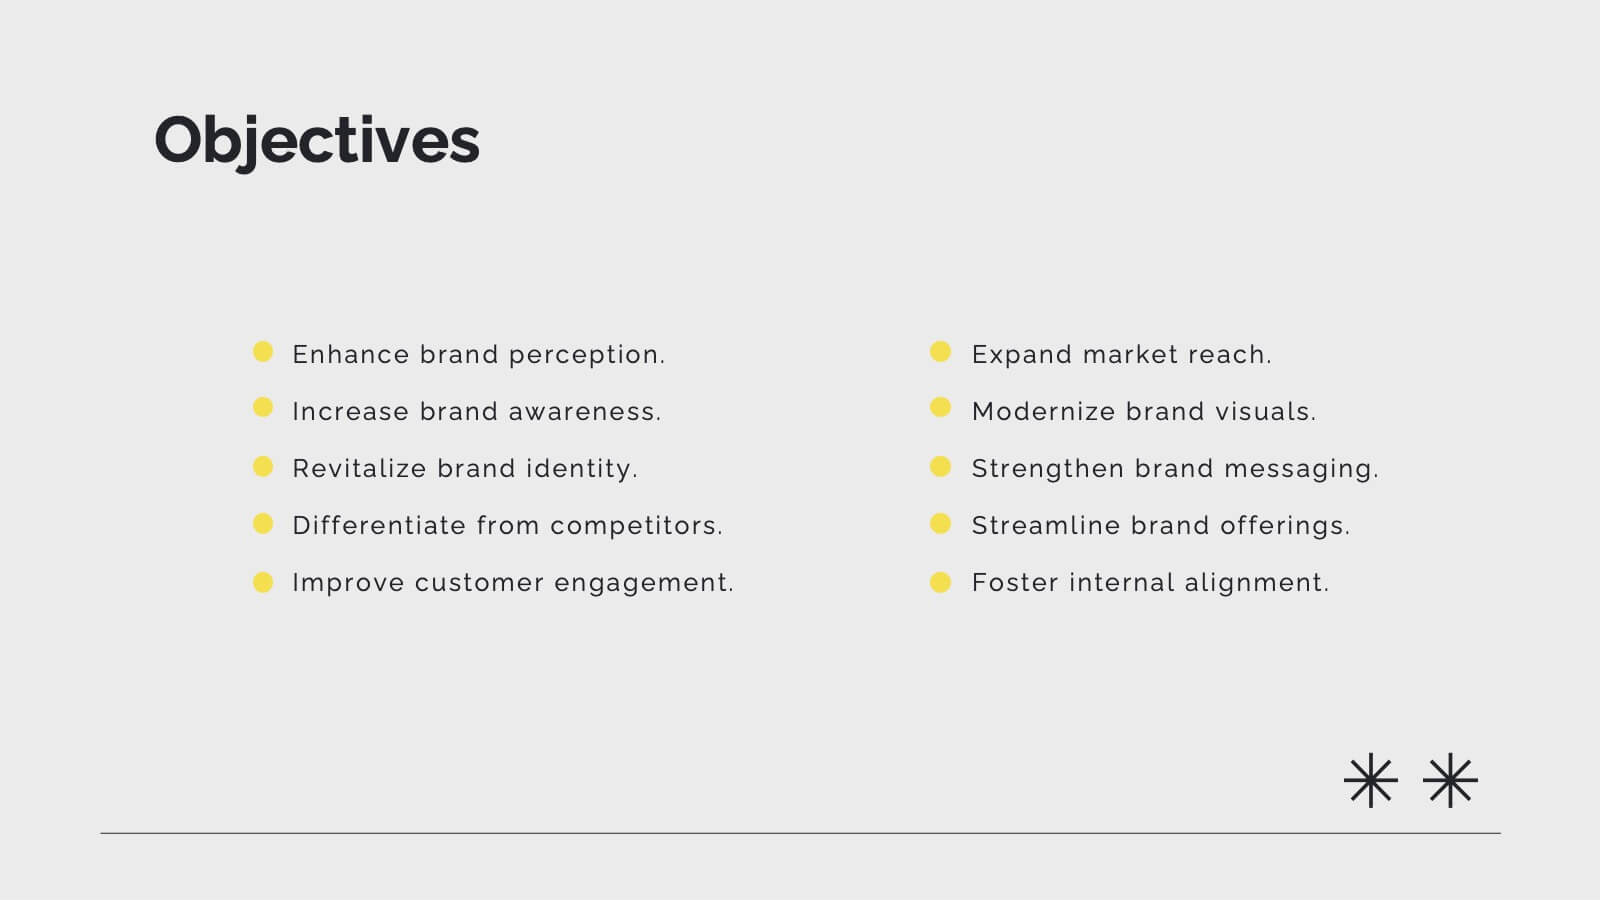
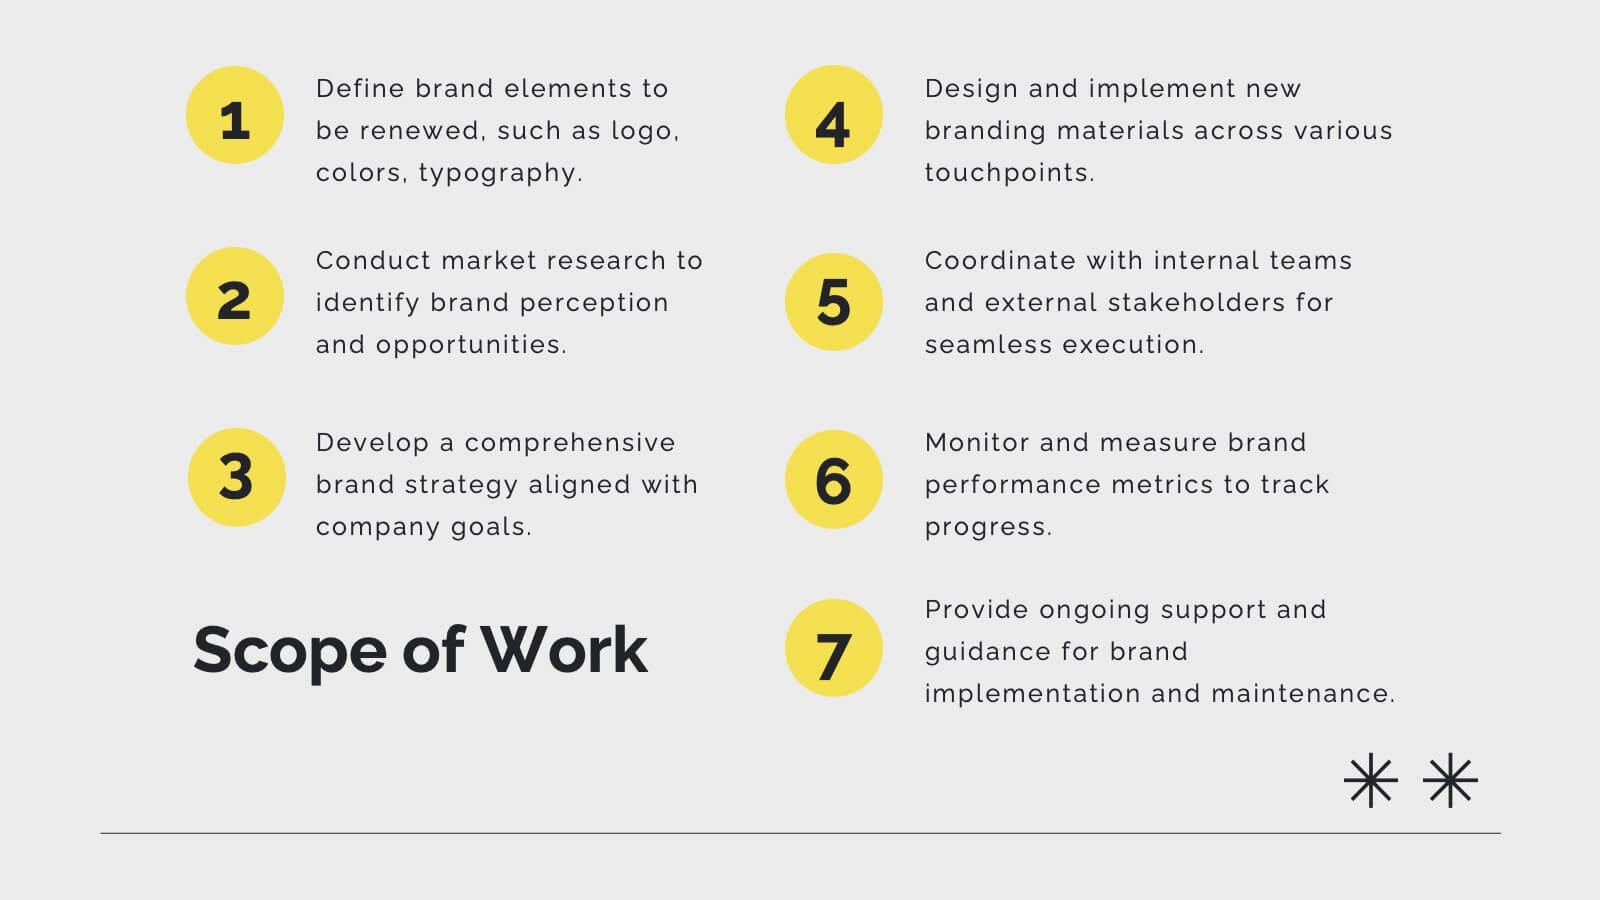
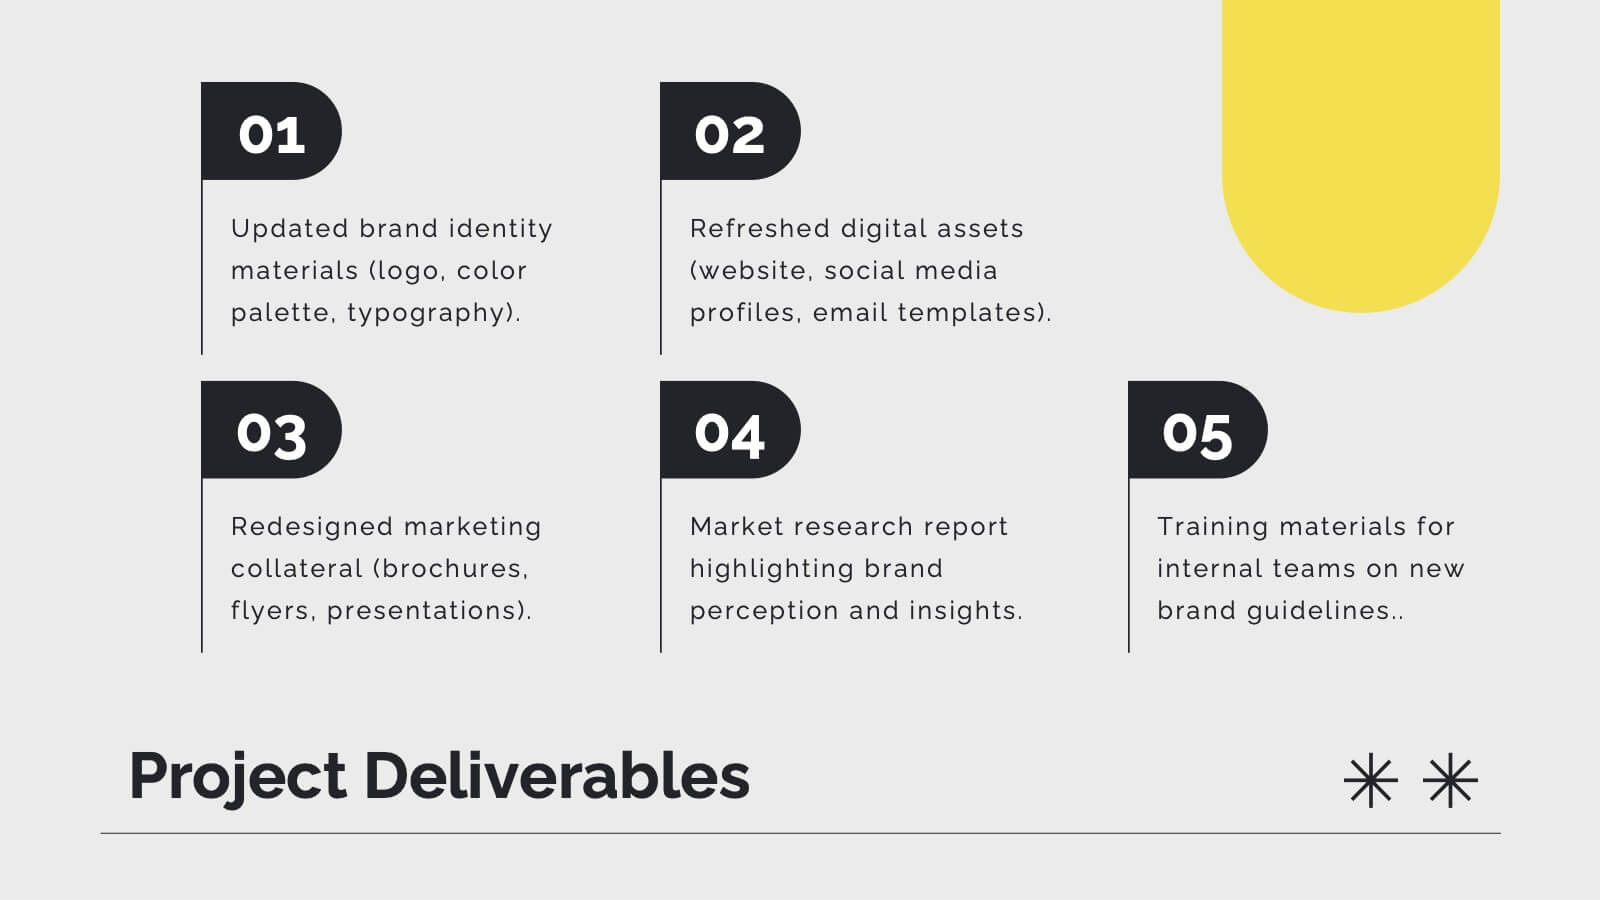
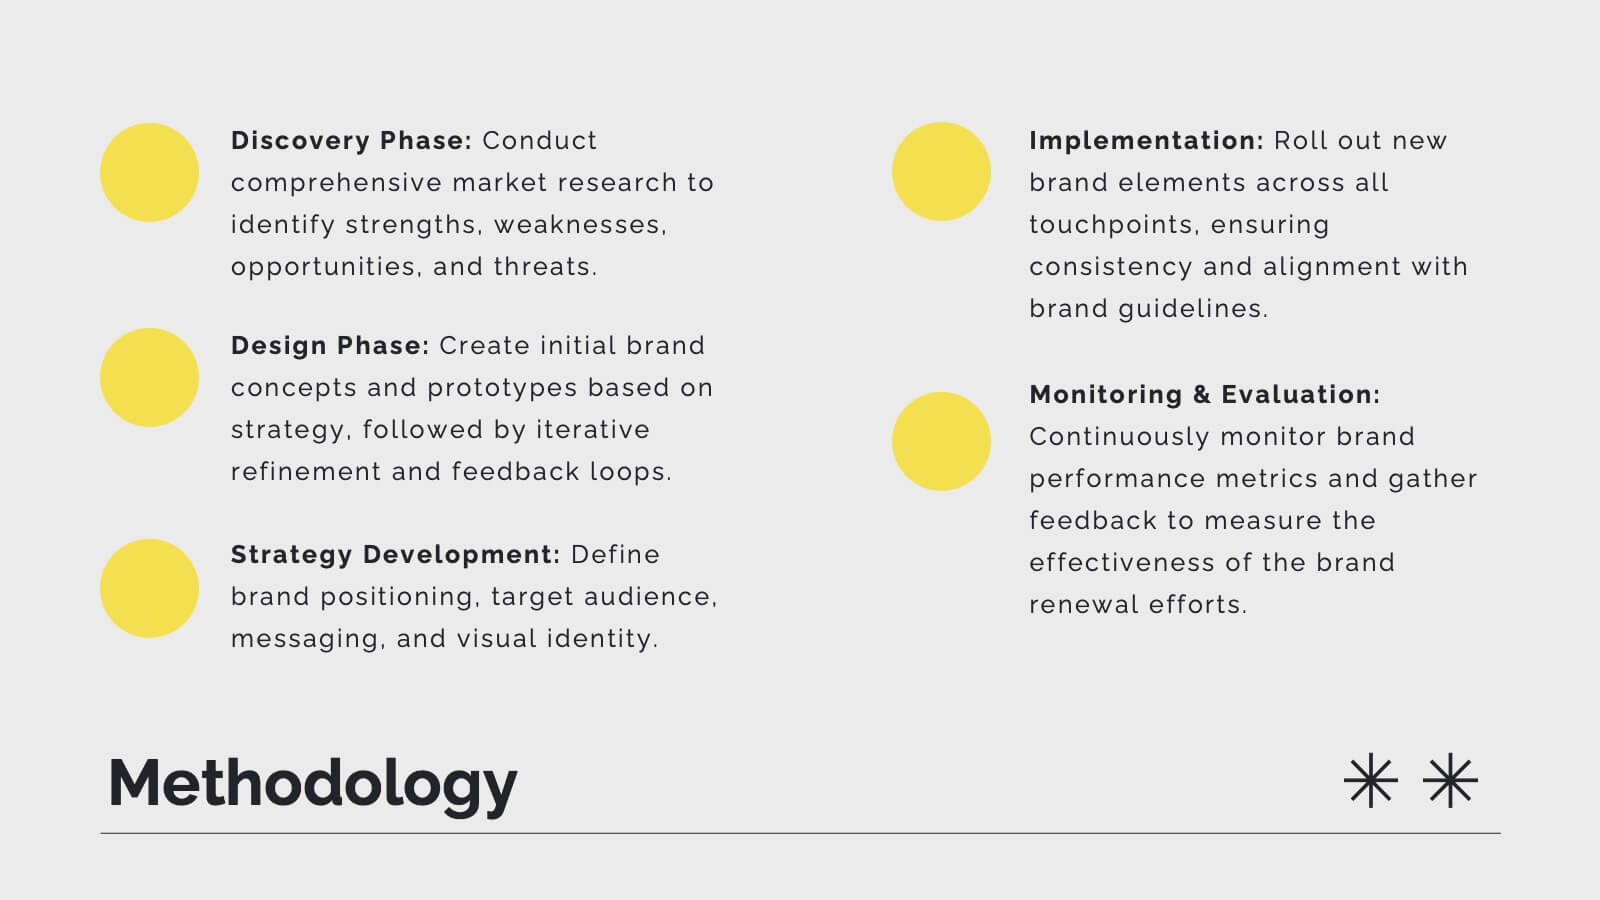
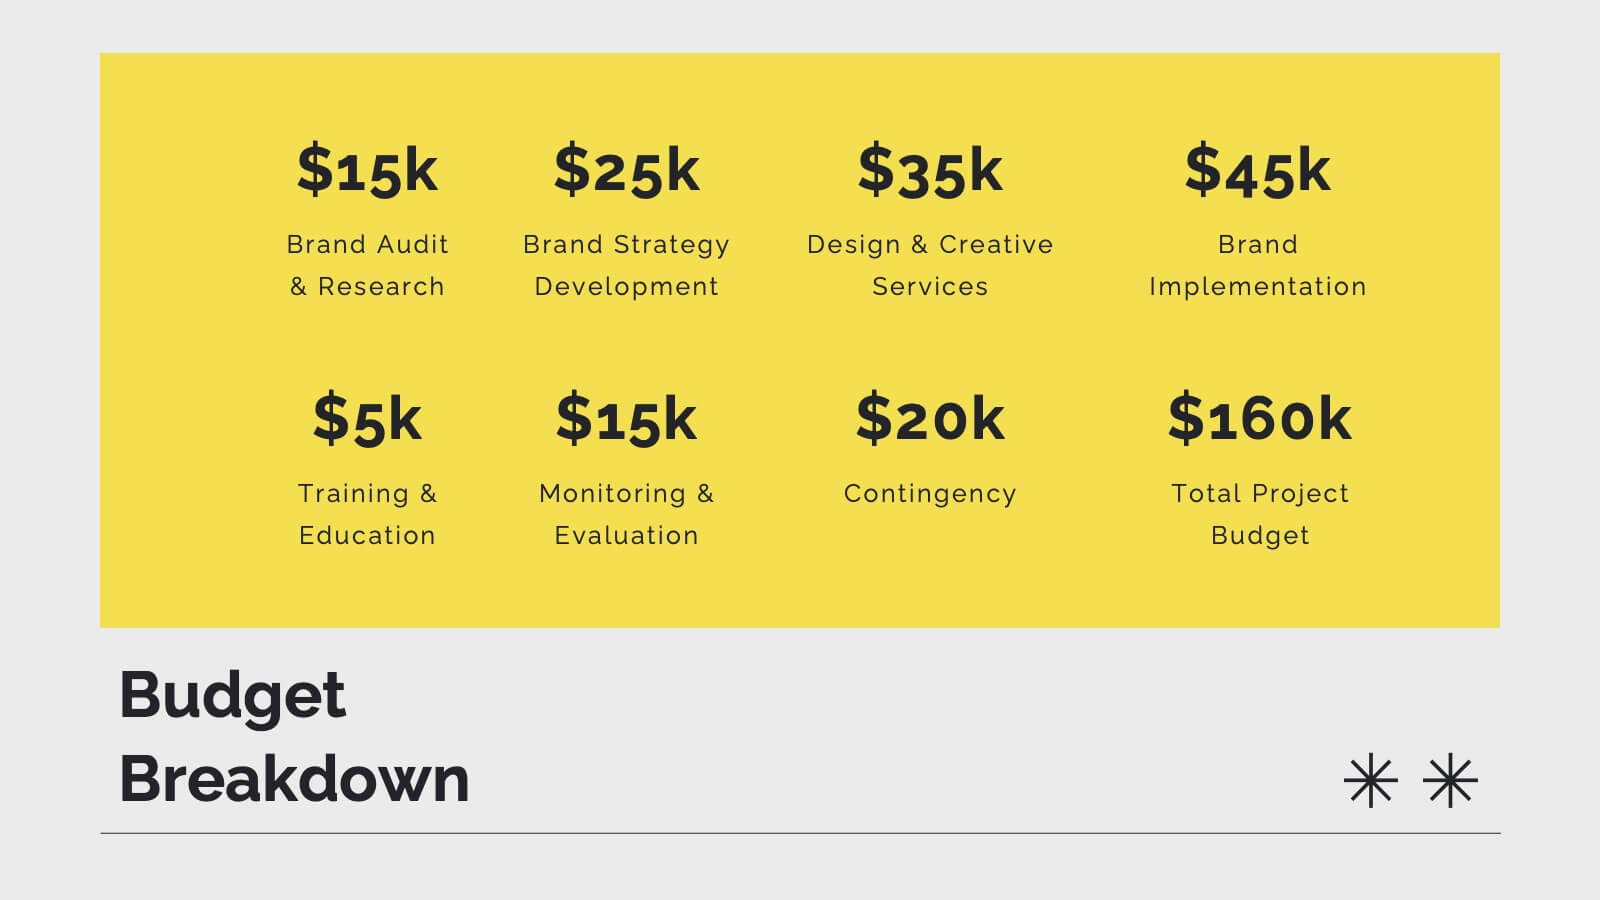
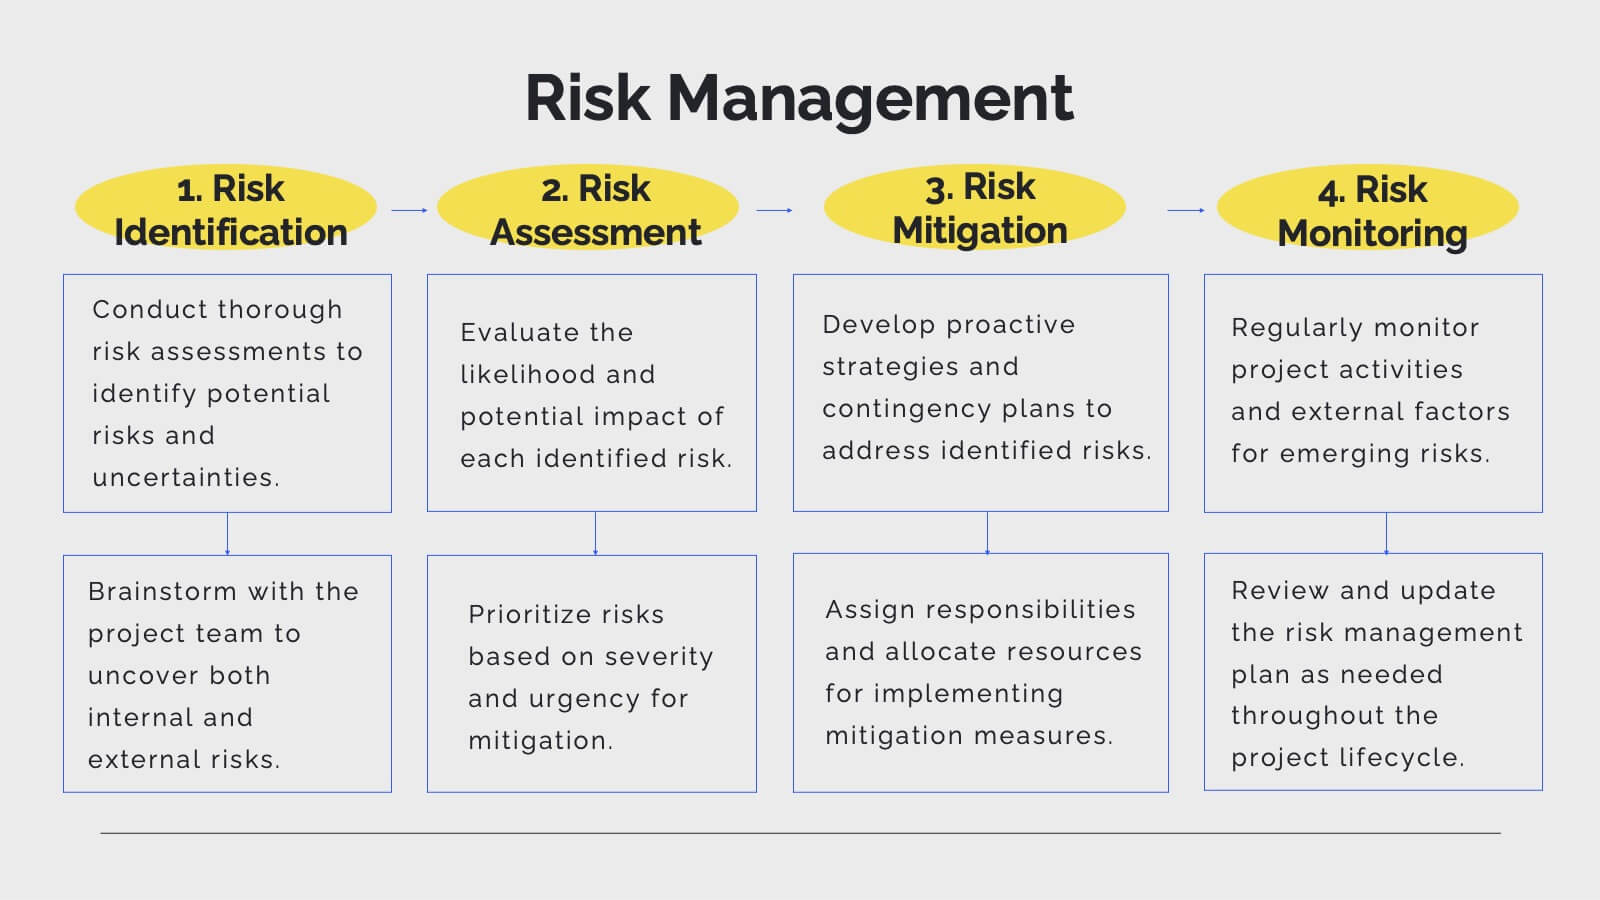
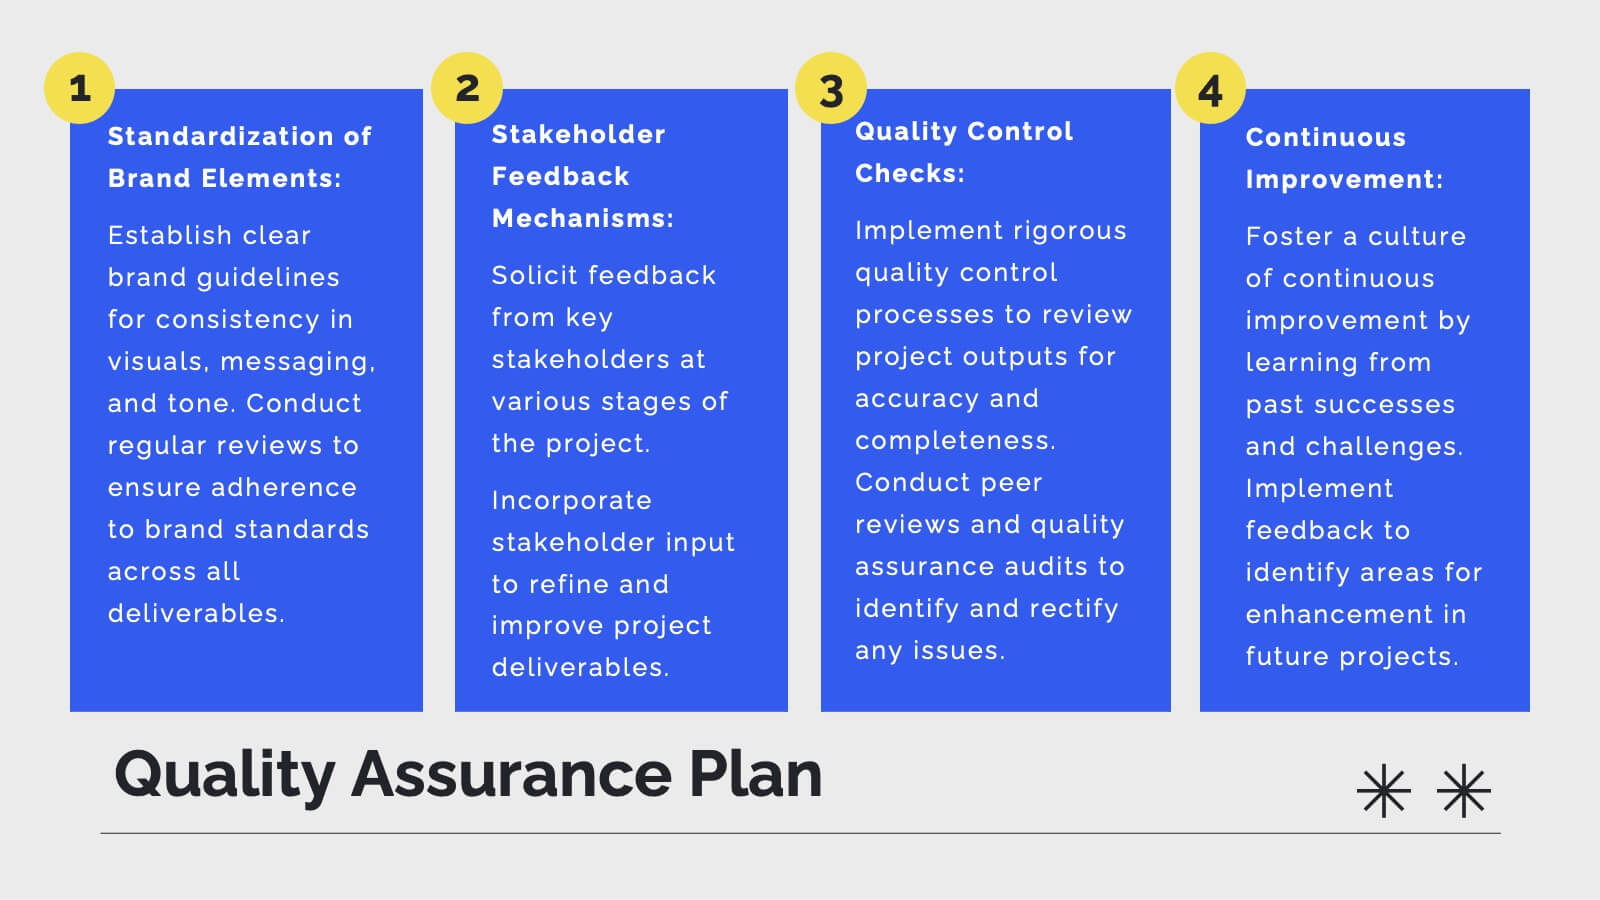
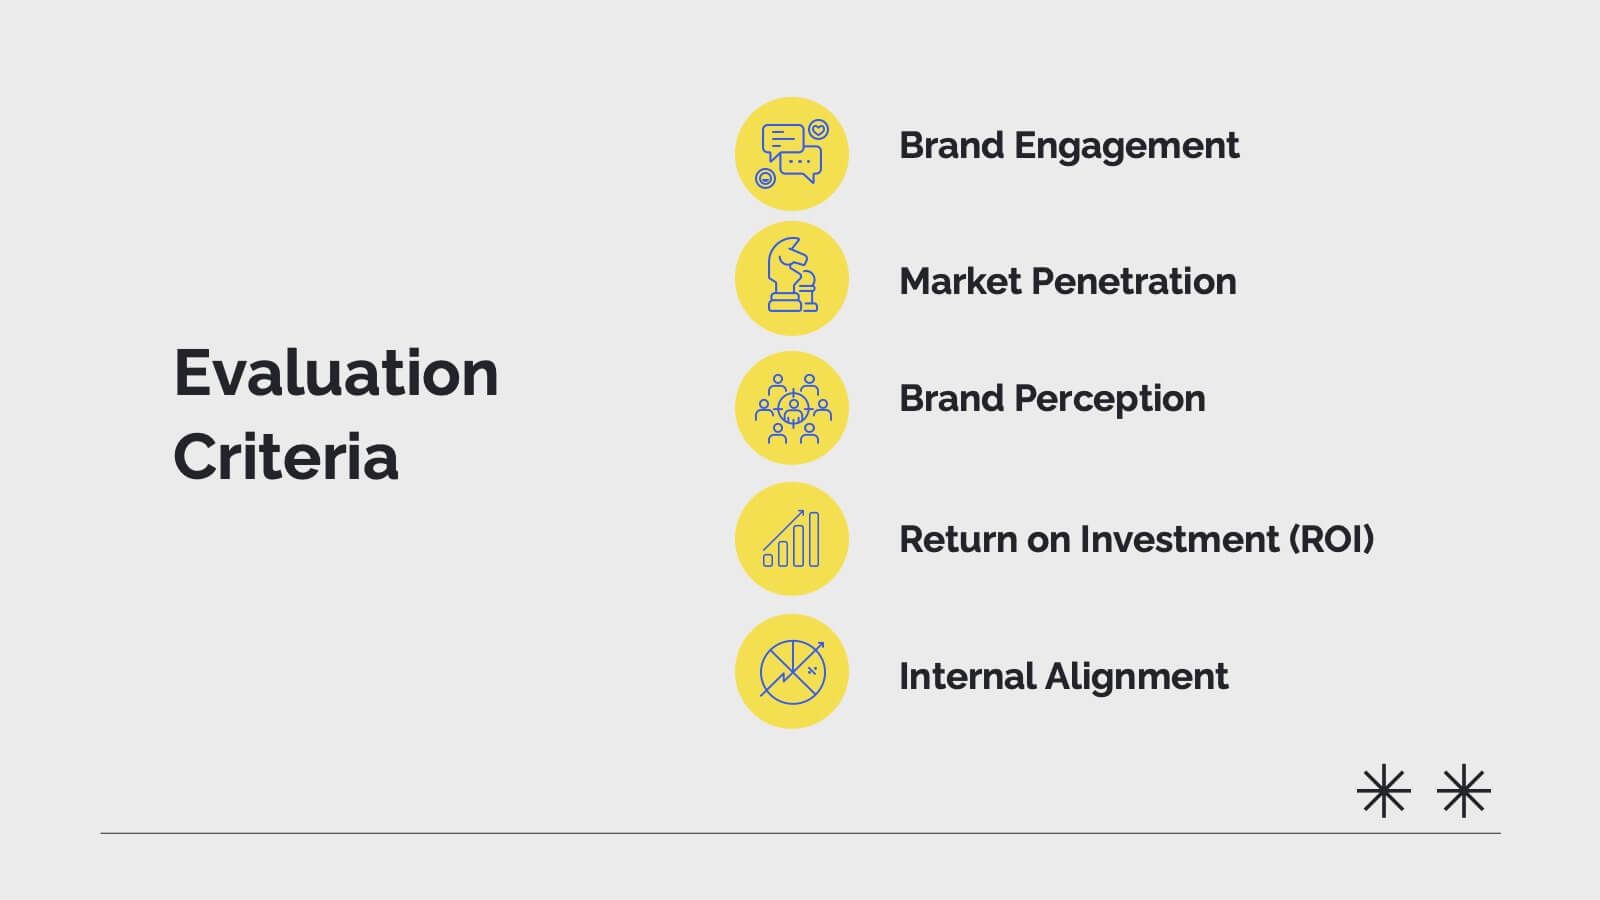
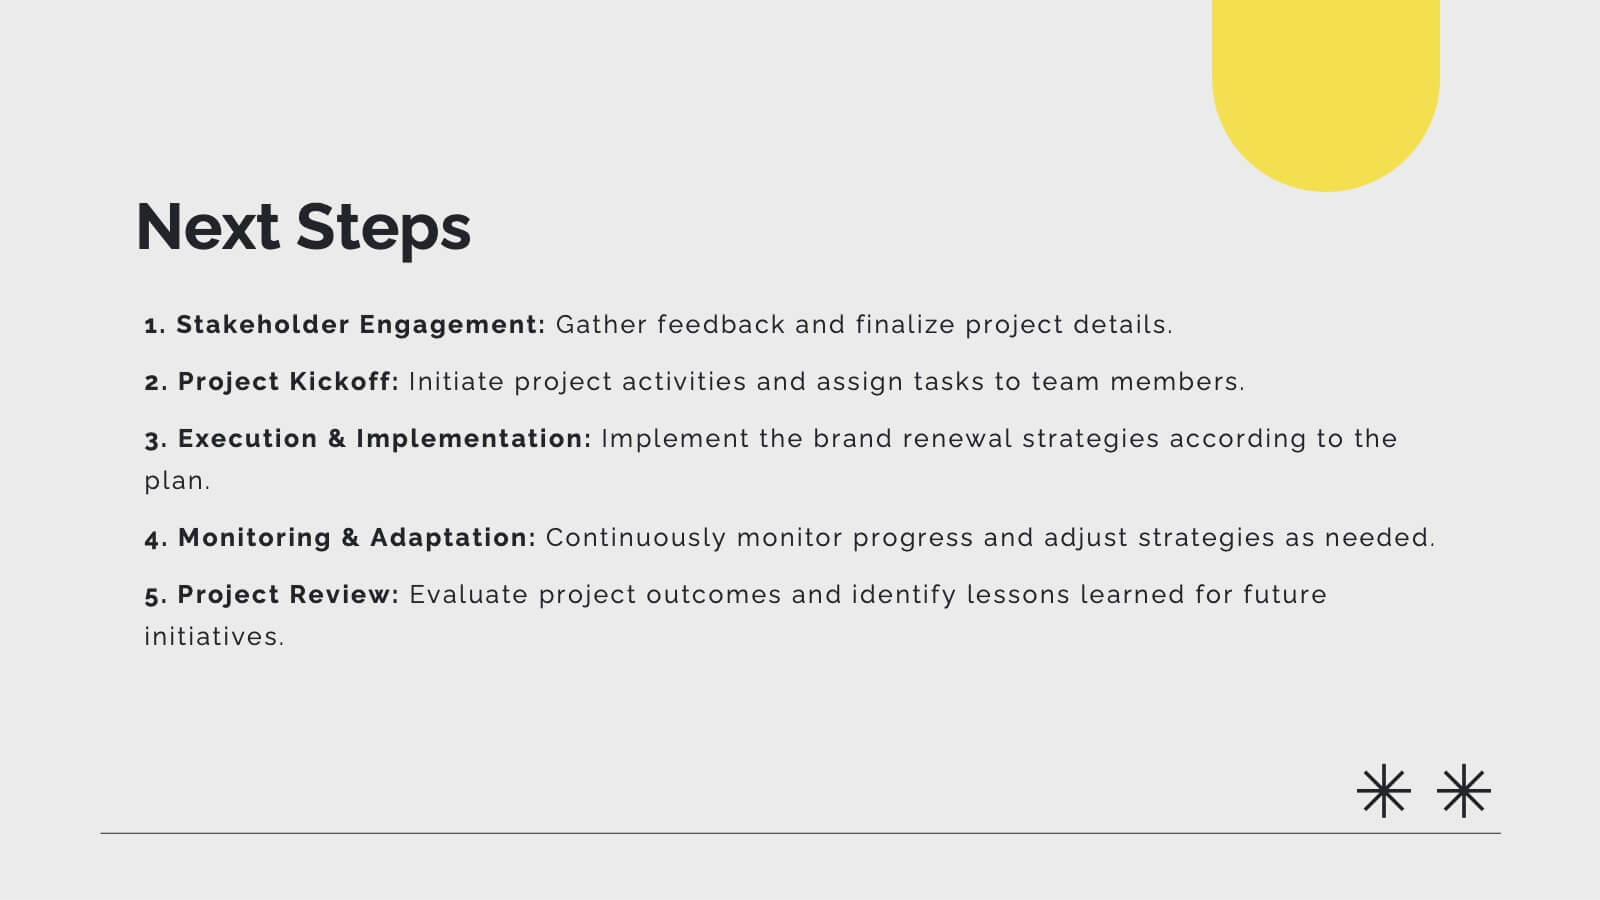
Pulse Project Management Plan Presentation
Streamline your project management with this vibrant template. It covers project overview, objectives, deliverables, methodology, timeline, budget, and risk management. Perfect for clear and engaging presentations. Compatible with PowerPoint, Keynote, and Google Slides for seamless customization.


6 diapositivas
Human Resources Project Infographics
This series of infographics from a Human Resources (HR) presentation provides a visual breakdown of key HR functions and strategies. The slides encompass various elements critical to effective HR management: Adoption & Integration: Showcases the initial stages of HR processes, including adoption rates and integration strategies for new systems or policies. Training & Development: Highlights the importance of ongoing employee development through training programs, critical for fostering employee skills and organizational growth. Retention & Maintenance: Focuses on strategies to retain talent within the organization, such as engagement initiatives and competitive compensation structures. Performance & Evaluation: Details the methods for assessing employee performance and the criteria used for evaluations, ensuring alignment with organizational goals. Recruitment to Retirement: Outlines the employee lifecycle from recruitment to retirement, showing the comprehensive approach of HR in managing employee journeys. Each slide utilizes charts, process diagrams, and bullet points to clearly communicate the steps and processes involved, making it easier for the audience to grasp complex HR activities. These visuals are crucial for HR professionals aiming to improve workplace efficiency and employee satisfaction.


6 diapositivas
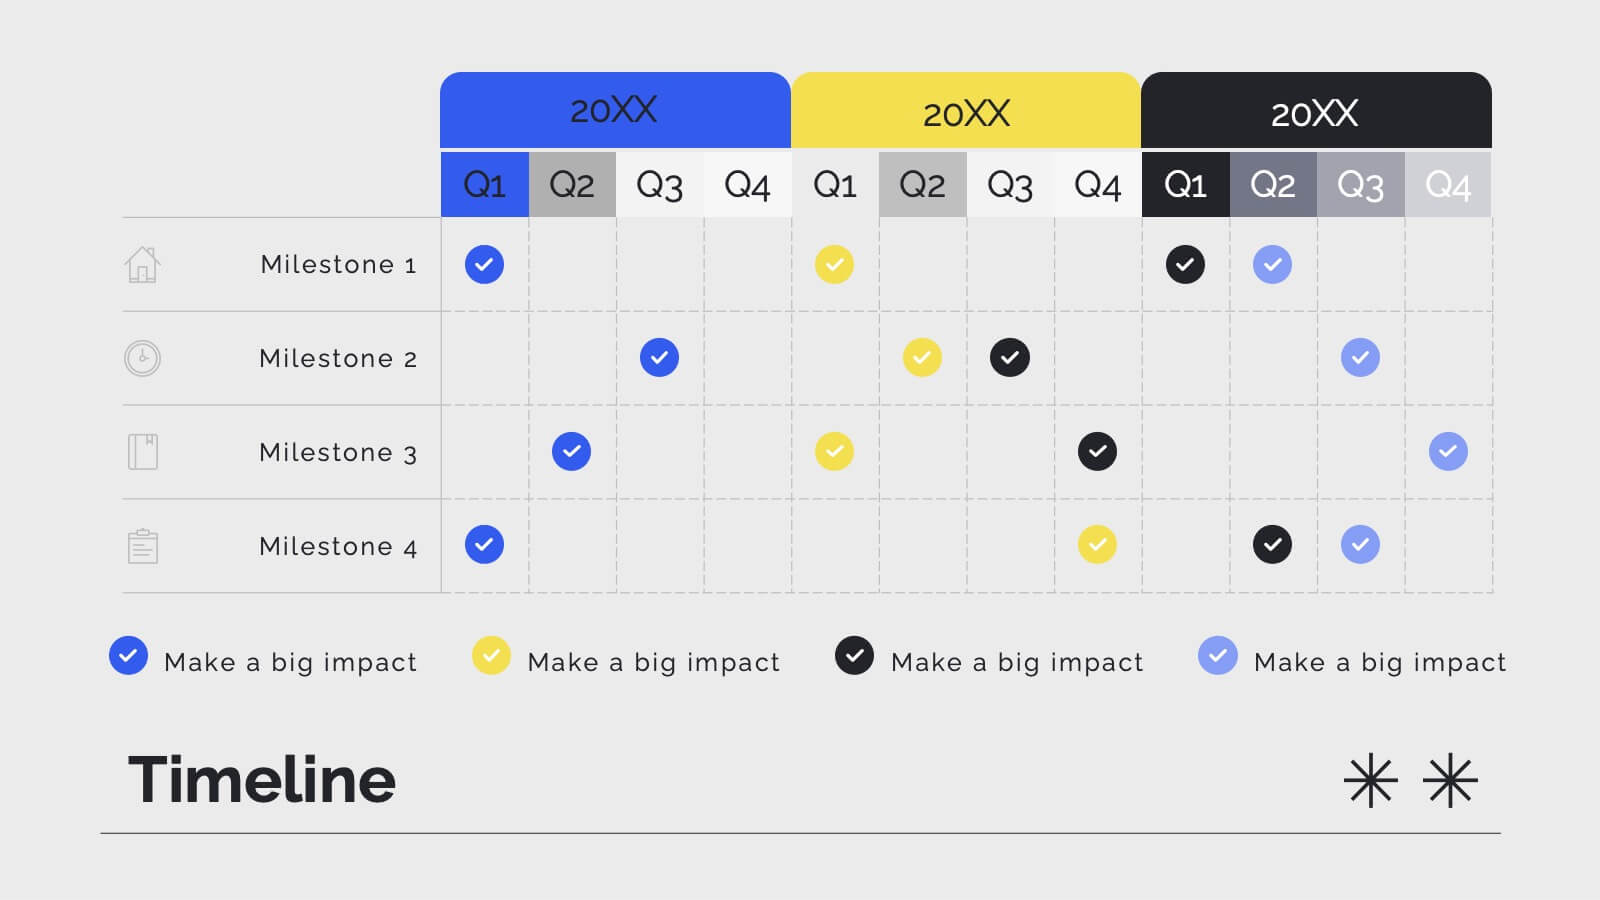
Product Launch Milestone Plan Presentation
Turn your big idea into a successful launch with this bold and structured presentation design. Perfect for outlining goals, tracking phases, and measuring progress, it keeps your product roadmap clear and engaging. Easily editable and compatible with PowerPoint, Keynote, and Google Slides for seamless presentation creation.


7 diapositivas
Cloud Infographic Presentation Template
This Cloud infographic, is a versatile and professional template designed for corporate presentations. This is perfect for businesses and organizations in the technology and IT field, as well as any company looking to showcase their data and information in a visually appealing way. This template features a corporate style with a blue theme, which gives it a professional look and feel. The slides are filled with icons, and other visual elements that will help you communicate your message in an effective way. This template has everything you need to create an engaging and informative presentation.


6 diapositivas
Pyramid-Triangle Visual Logic Presentation
Present interconnected concepts with clarity using the Pyramid-Triangle Visual Logic Presentation. This layout uses a hexagonal pyramid structure to show relationships between six ideas or categories, making it ideal for strategy models, balanced frameworks, or multi-step solutions. Each section includes a title, icon, and editable content block to ensure clarity and customization. Compatible with PowerPoint, Keynote, and Google Slides.


4 diapositivas
Neuroscience-Inspired Concept Mapping Presentation
Visualize abstract ideas with clarity using the Neuroscience-Inspired Concept Mapping Presentation. Featuring a head silhouette and four labeled concept nodes, this layout is perfect for connecting ideas, frameworks, or steps in a thought process. Fully editable in PowerPoint, Canva, and Google Slides for seamless customization and presentation.


5 diapositivas
Real Estate Requirements Infographics
Real Estate Infographics can be an effective way to convey information about the real estate industry in a visually appealing and simple manner. This infographic template is perfect to showcase market trends, statistics, and data in a clear and concise way, making it easier for your audience to interpret the information. As well as educating and informing your clients, investors, and other stakeholders about various aspects of the real estate market. Overall, these infographic will help you communicate information about the real estate industry and help your clients make informed decisions about buying, selling, or investing in property.


5 diapositivas
Productivity and Time Optimization Presentation
Visualize time-saving strategies and workflow efficiency with this hourglass-themed productivity template. Ideal for illustrating phased progress, deadlines, or time distribution, this design breaks your message into four clear sections with engaging visuals. Fully editable in PowerPoint, Keynote, and Google Slides.


5 diapositivas
Annual Achievements and Highlights Presentation
Celebrate your progress with the Annual Achievements and Highlights Presentation. This timeline-style layout guides viewers along a visual path of milestones year by year. Each pin represents a key accomplishment, backed by icons and editable text for context. Perfect for end-of-year reviews or company retrospectives. Compatible with PowerPoint, Google Slides, and Canva.


26 diapositivas
Dante Presentation Template
Featuring our new Dante Sportswear template this is a great way to present your products and ideas in an attractive, easy-to-read and easily understanding presentation. It includes all the elements you need to create a marketing presentation with style that will stand out. This template has plenty of space for displaying statistics and other data with images that complement your product/service information. You can use this template for valuable sportswear content or information to educate or entertain your audience. This template is fully and easily editable in powerpoint as well!


21 diapositivas
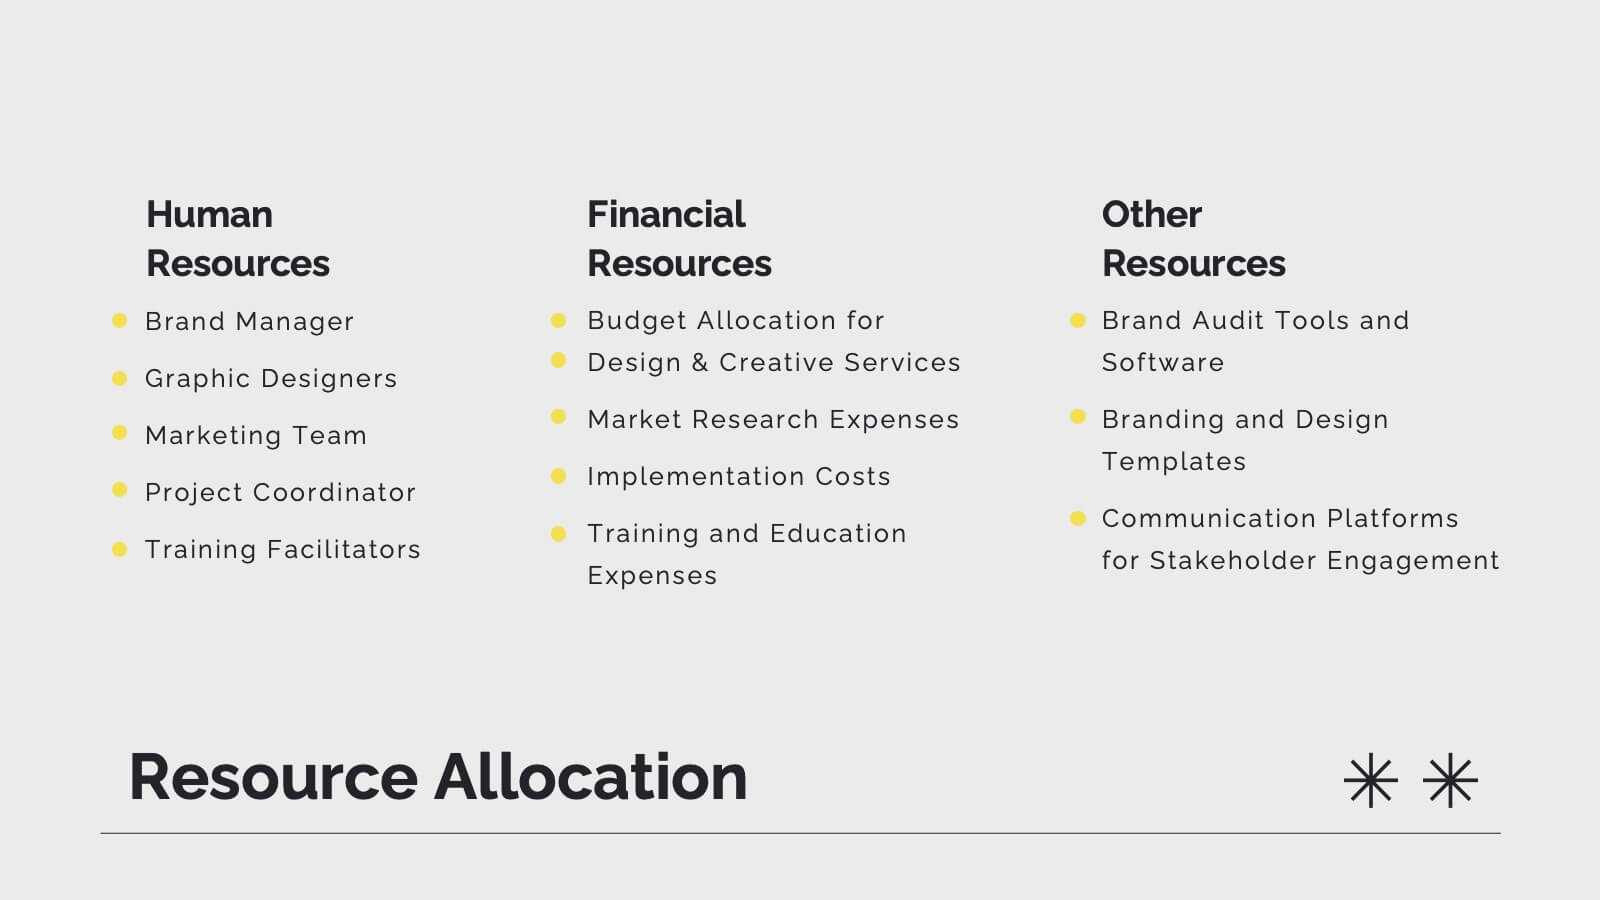
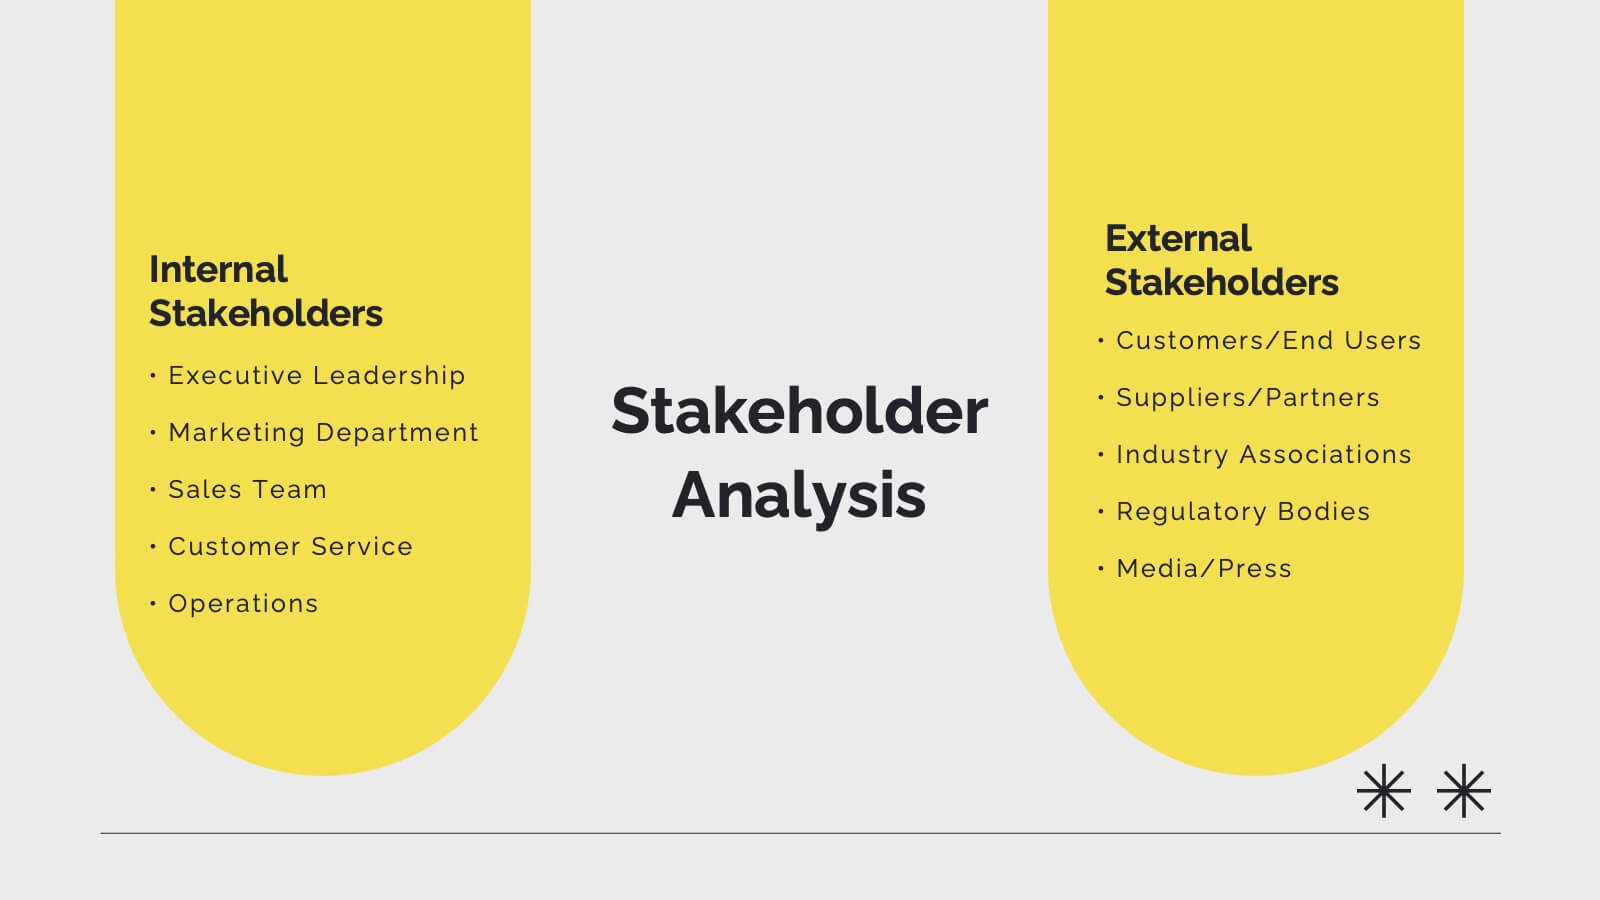
Moonshade Strategic Planning Report Presentation
This strategic planning template provides a comprehensive framework to align your business objectives with actionable plans. With sections for SWOT analysis, resource allocation, key metrics, and growth opportunities, it ensures that every element is covered for successful execution. Customizable in PowerPoint, Keynote, and Google Slides, it's perfect for building focused, strategic initiatives.


5 diapositivas
Leadership and Workforce Culture
Inspire growth from the ground up with this bold, step-by-step visual that captures the journey of leadership and team development. From culture-building to individual progress, this layout helps you illustrate each stage clearly and confidently. Fully compatible with PowerPoint, Keynote, and Google Slides.


4 diapositivas
Emerging AI Applications in Business
Showcase innovation with clarity using the Emerging AI Applications in Business Presentation. This sleek 4-step layout features modern icons and a profile-style AI illustration, perfect for outlining use cases such as automation, data insights, machine learning, or cloud-based AI solutions. Ideal for tech-driven strategy decks, startup pitches, or digital transformation briefings. Fully editable in PowerPoint, Keynote, and Google Slides.