


Características


¿Tienes alguna pregunta?
Recomendar


6 diapositivas
Corporate Sustainability Management Presentation
Step into the future of business with our Corporate Sustainability Management Presentation template. Perfect for strategists seeking to integrate eco-friendly practices, this template facilitates effective communication of sustainability goals and initiatives. It’s a powerful tool for illustrating how environmental strategies can be interwoven with business objectives to foster long-term growth. Tailored for presentations on PowerPoint, Keynote, and Google Slides, it helps leaders inspire action and commitment to sustainability across their organizations.


21 diapositivas
Shadowrise Product Roadmap Presentation
Plan and present your product journey effectively with this detailed roadmap presentation! It covers key areas like market analysis, product features, use cases, pricing strategies, and distribution channels, ensuring a clear path to success. Perfect for product teams, stakeholders, or investor meetings, this template is fully compatible with PowerPoint, Keynote, and Google Slides.


5 diapositivas
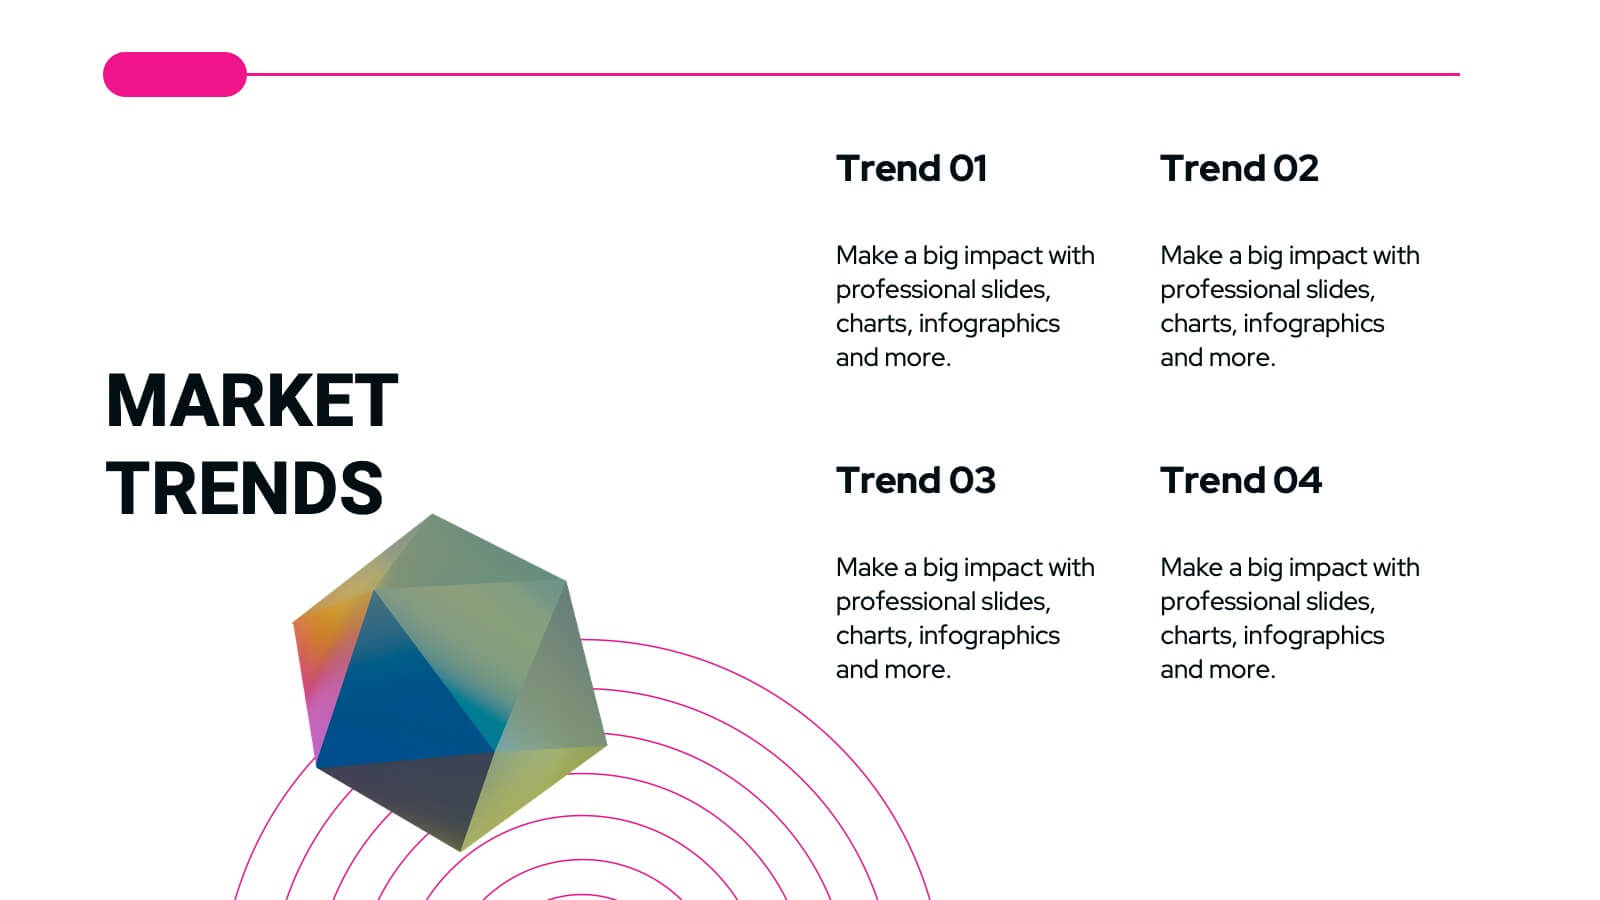
Market Positioning and SWOT of Rivals Presentation
Clearly define your competitive edge with the Market Positioning and SWOT of Rivals Presentation. This layout helps you showcase strengths, weaknesses, opportunities, and threats across key market players using a unique interlinked format. Easy to edit in Canva, PowerPoint, Keynote, and Google Slides—perfect for strategic business overviews.


5 diapositivas
Workflow Management Diagram Presentation
Simplify your process visuals with a clean, modern layout designed to clarify every step. This presentation helps you map workflows, define responsibilities, and streamline communication across teams. Perfect for project planning and operations, it’s fully compatible with PowerPoint, Keynote, and Google Slides for effortless customization and professional presentation delivery.


6 diapositivas
Search Engine Optimization Campaign Overview Presentation
Kick off your digital strategy with a clean, modern layout that makes every key insight feel connected and actionable. This presentation helps you explain campaign goals, highlight SEO priorities, and break down essential tasks in a structured, visual flow. Fully compatible with PowerPoint, Keynote, and Google Slides.


23 diapositivas
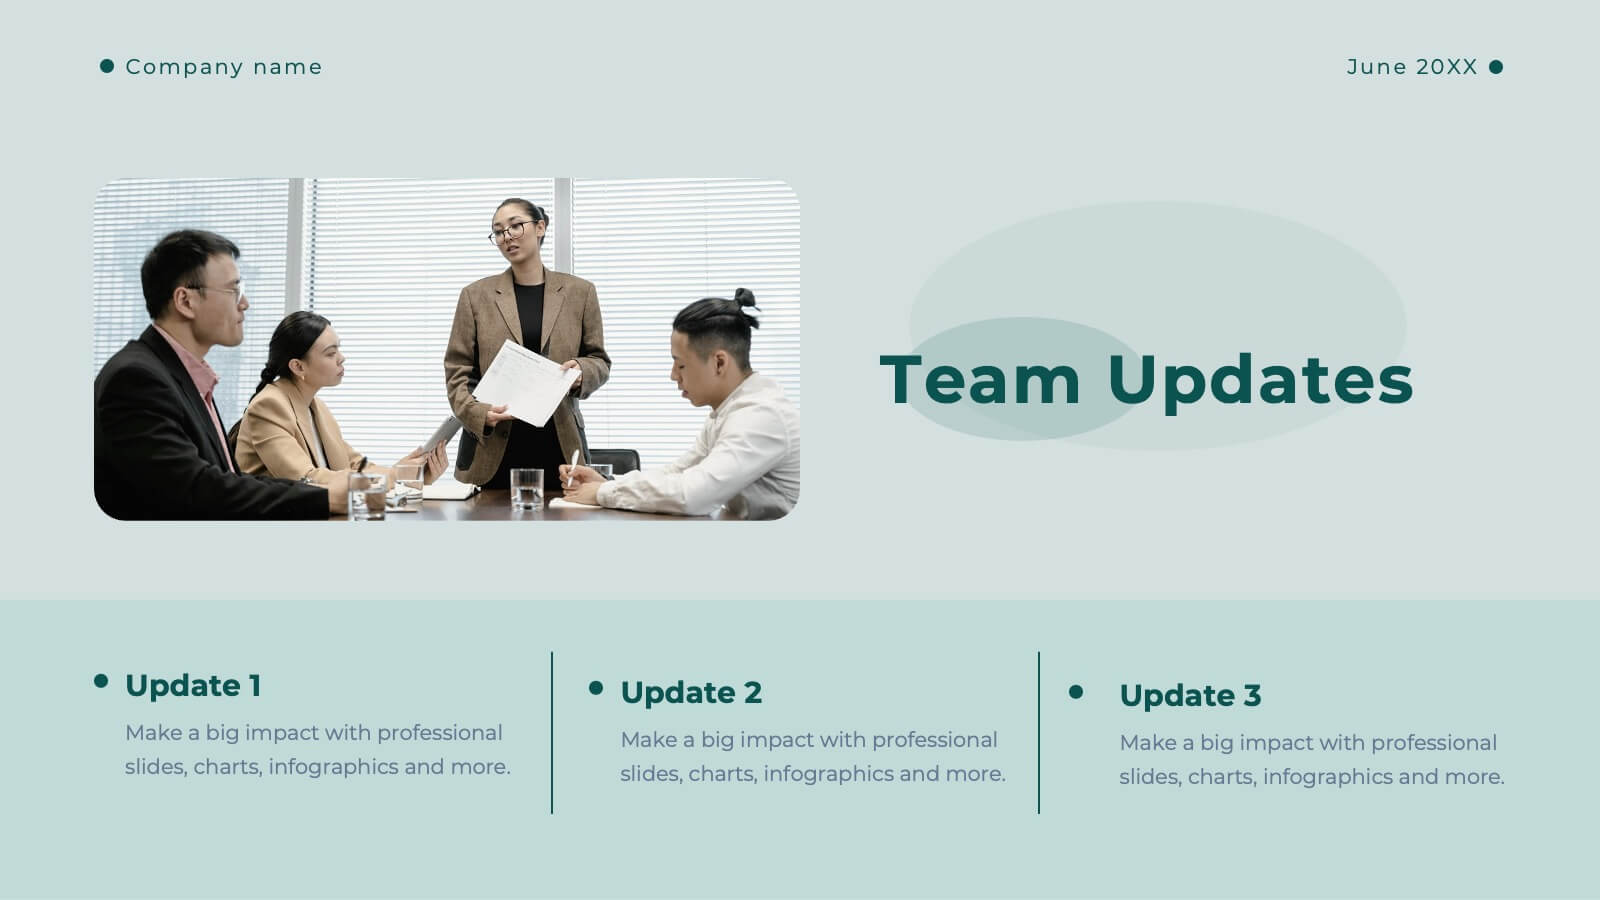
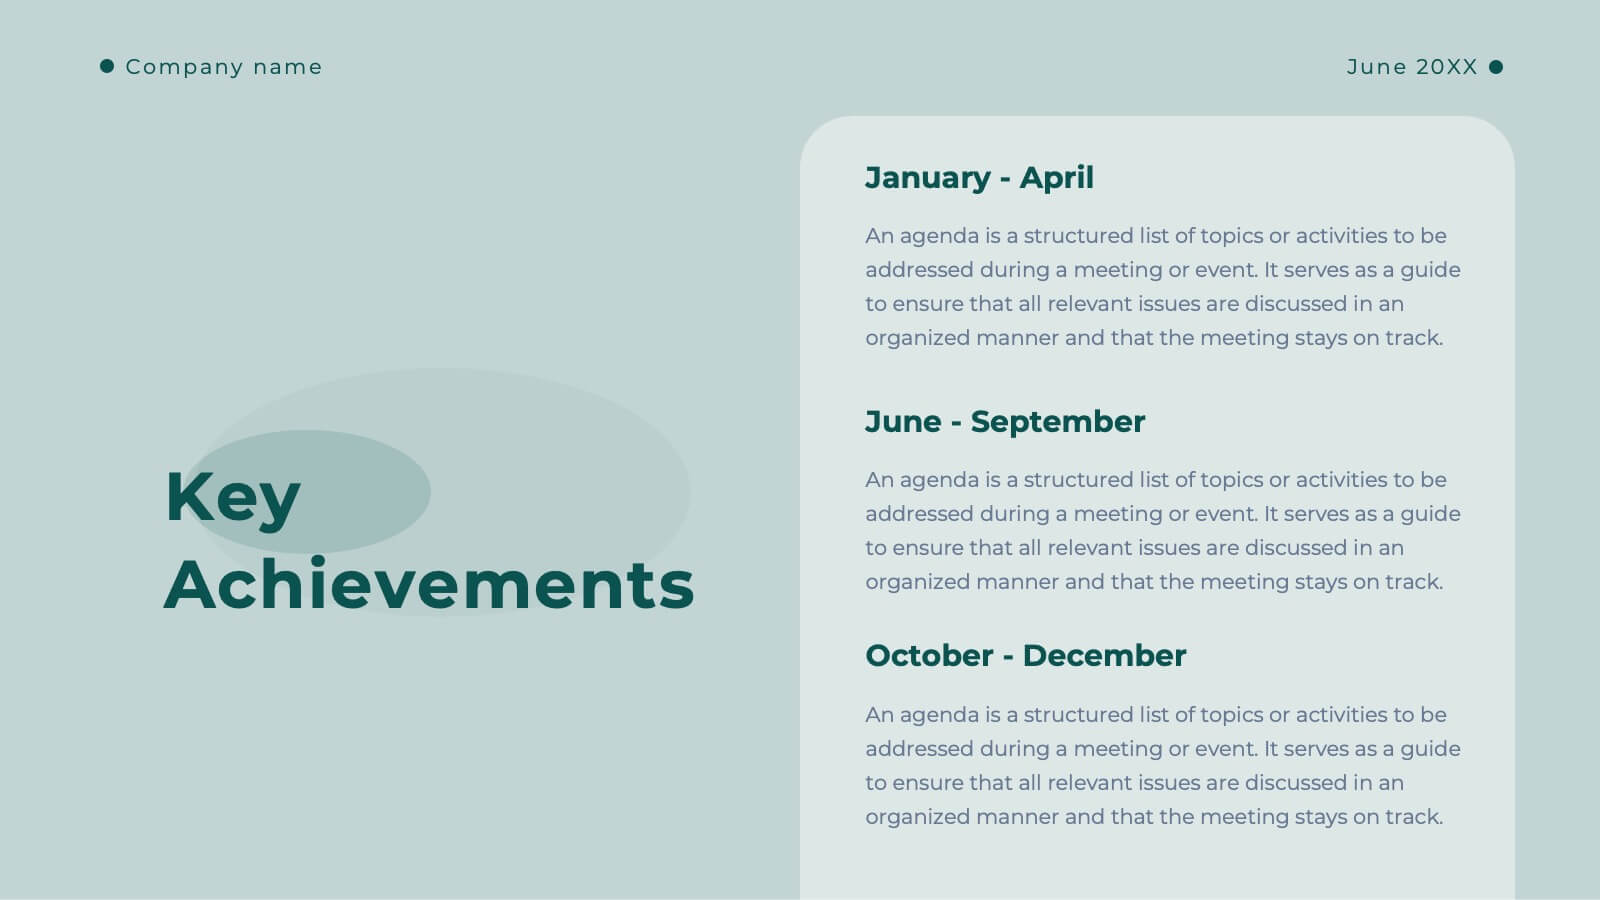
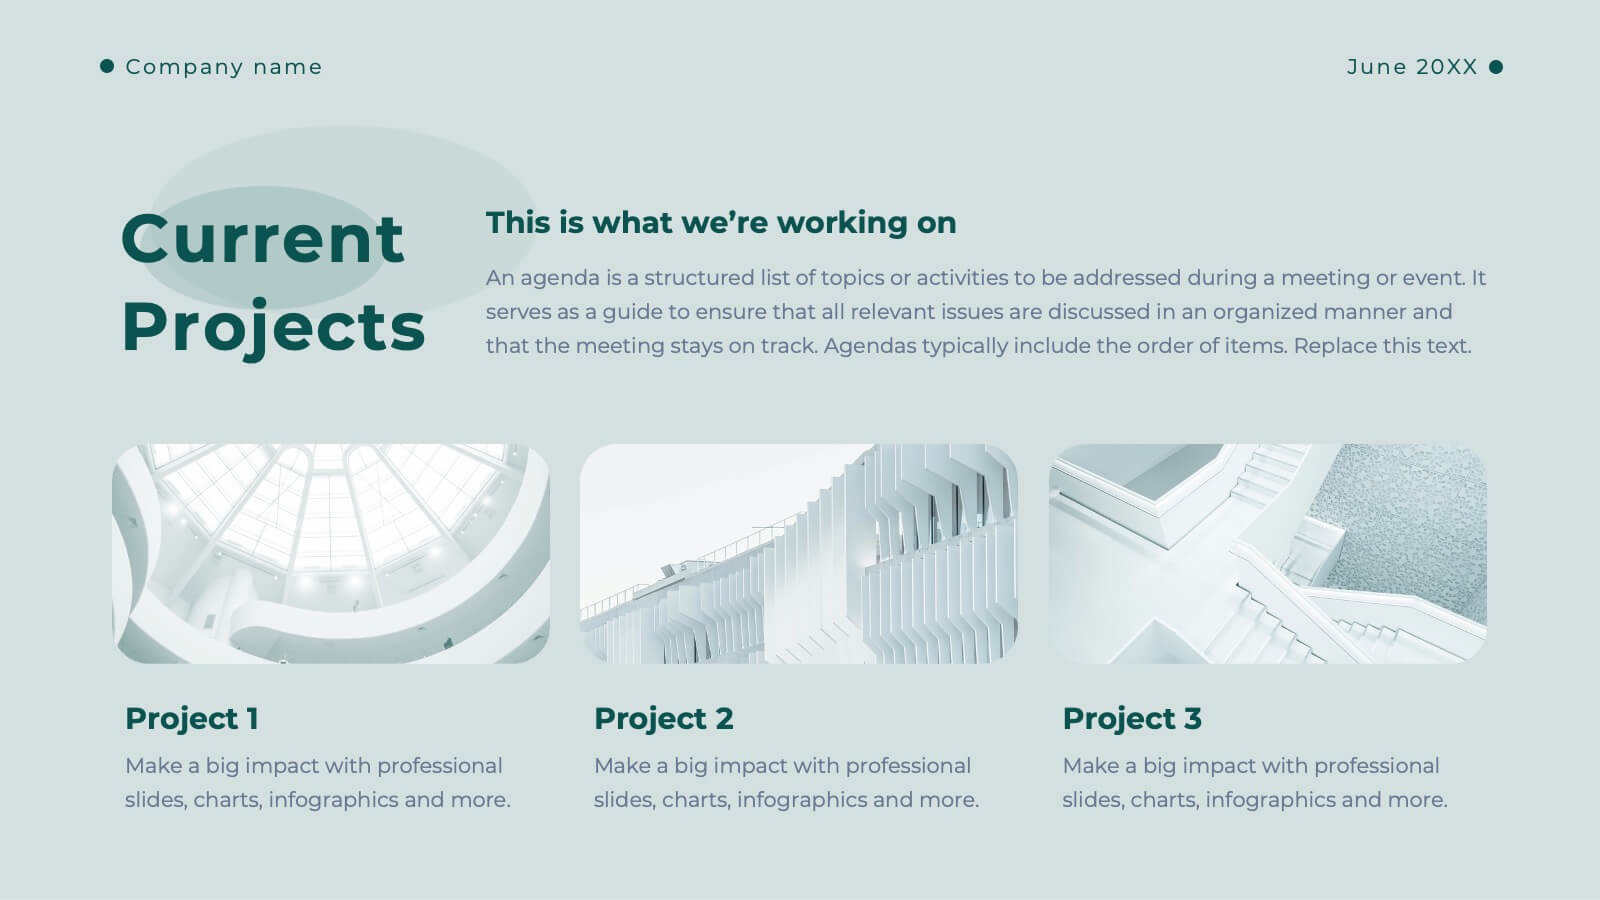
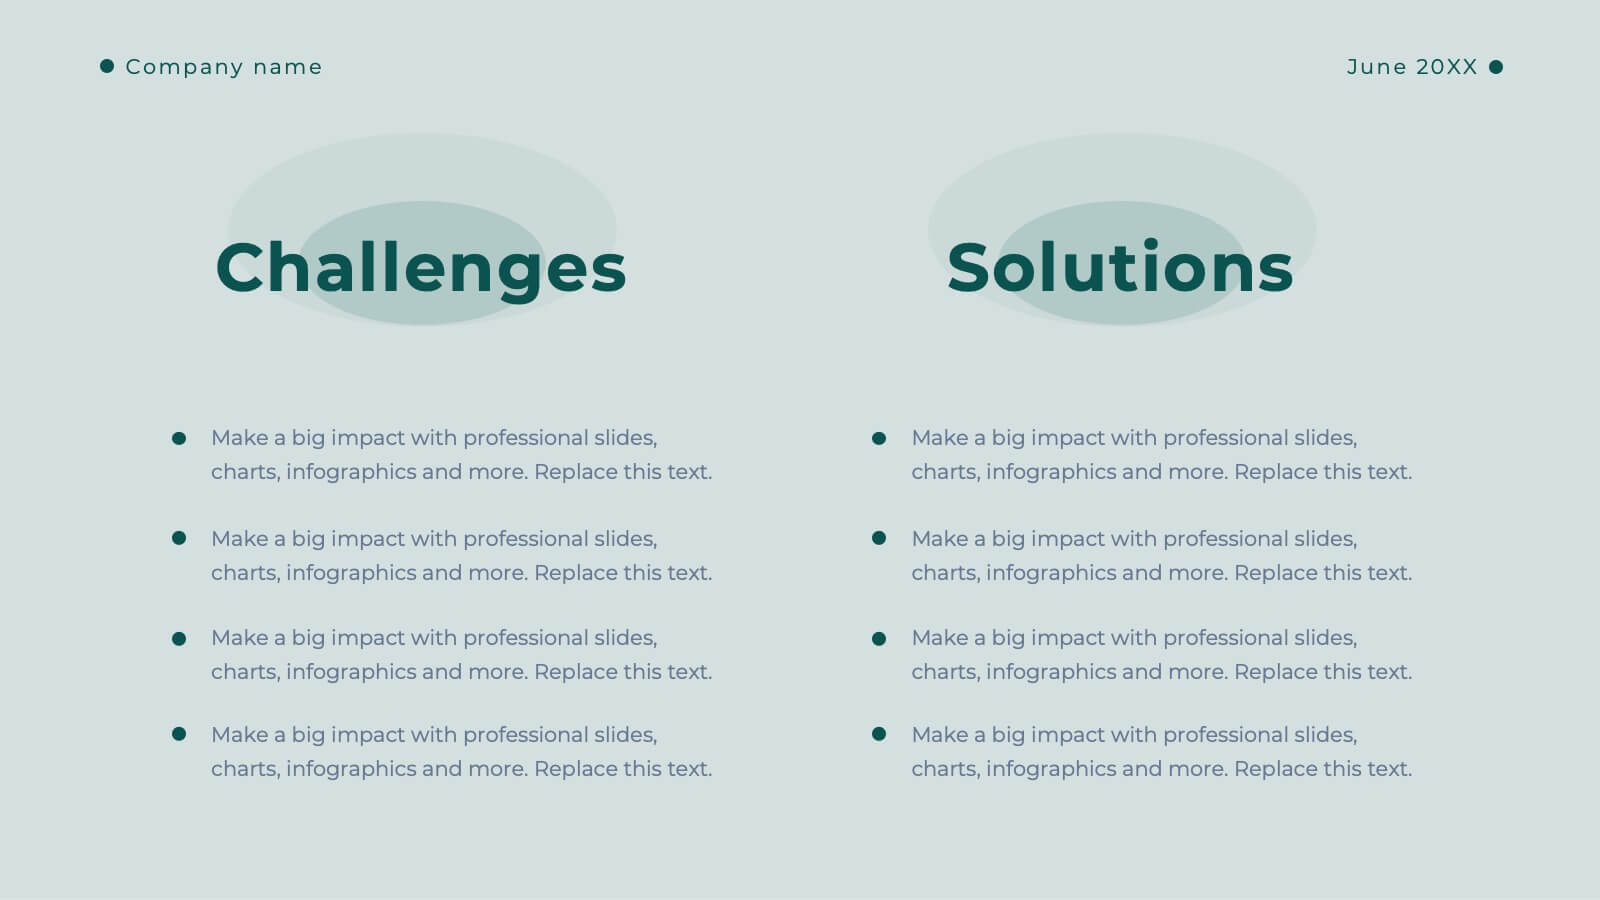
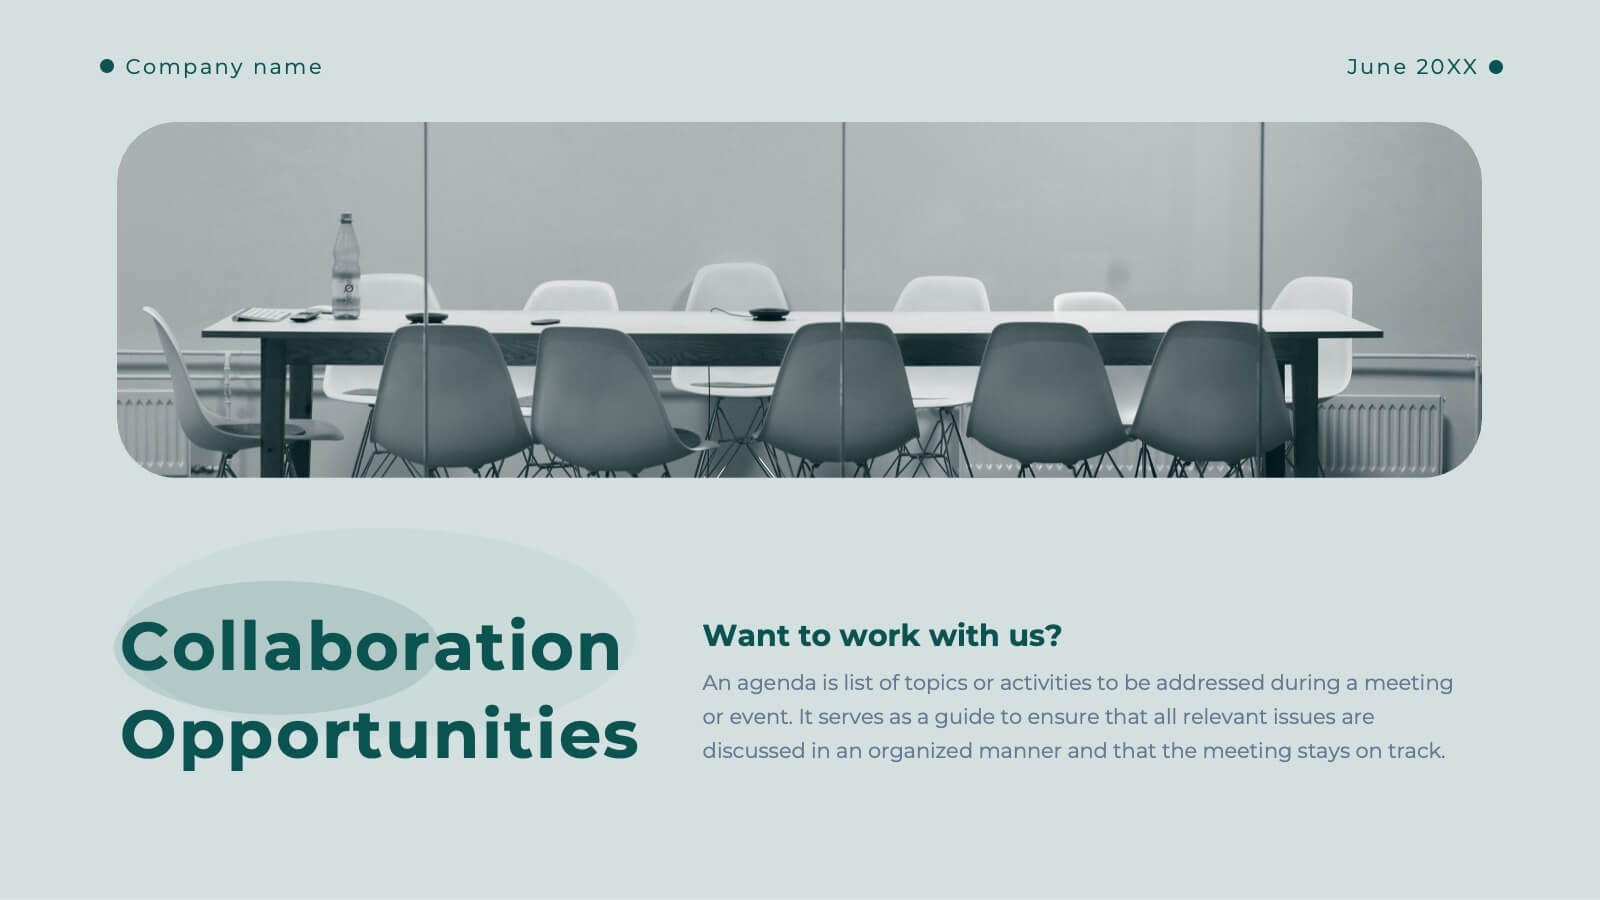
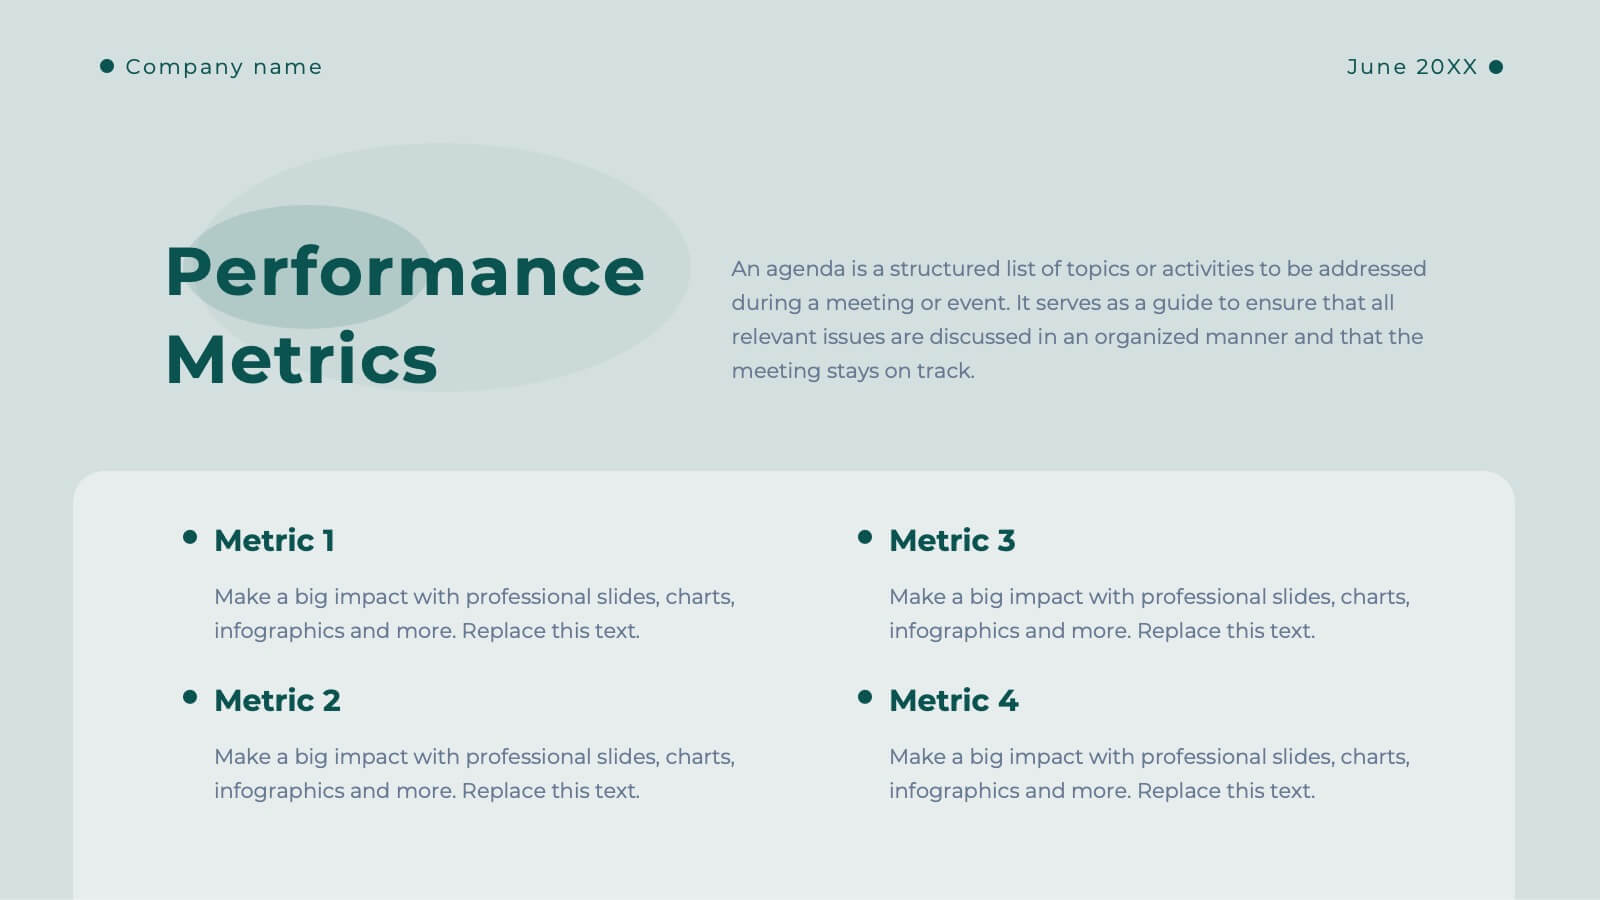
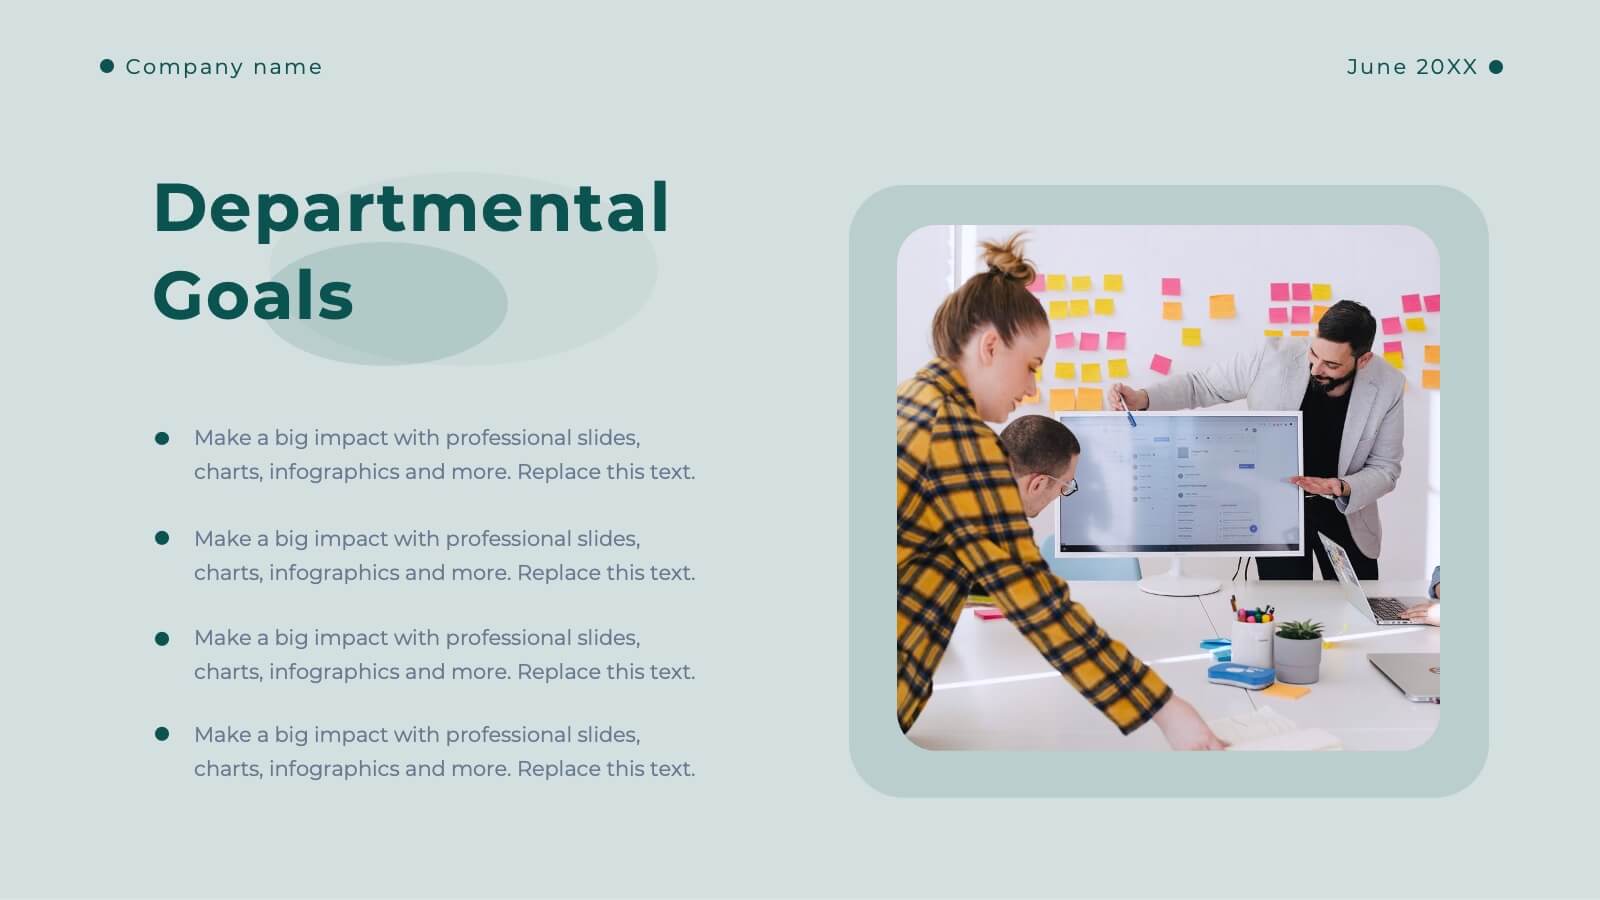
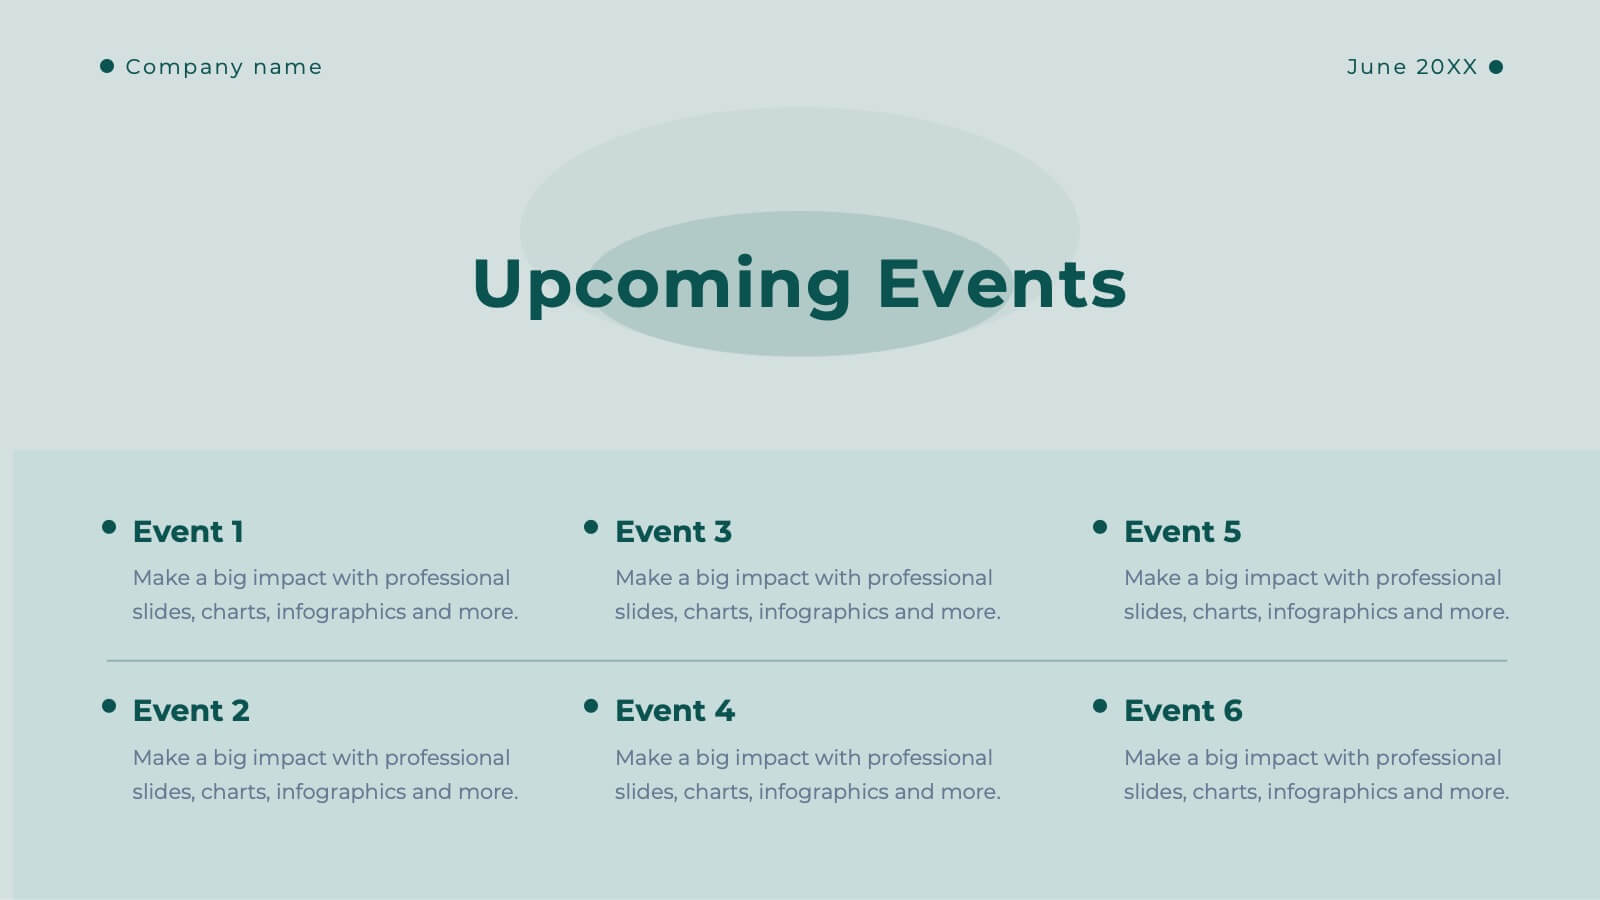
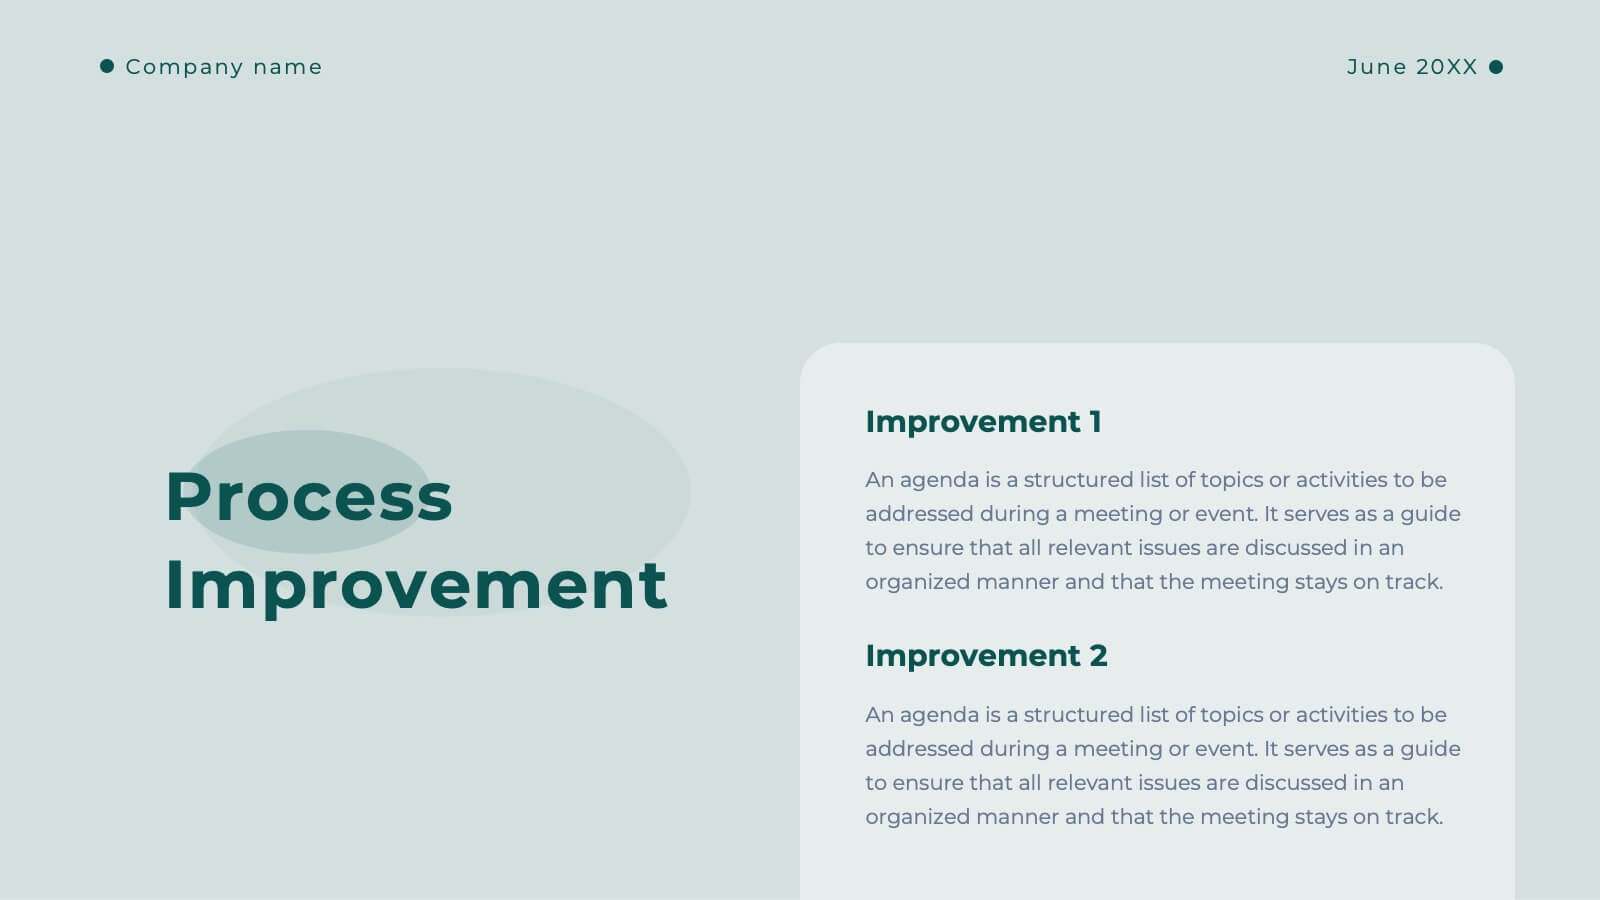
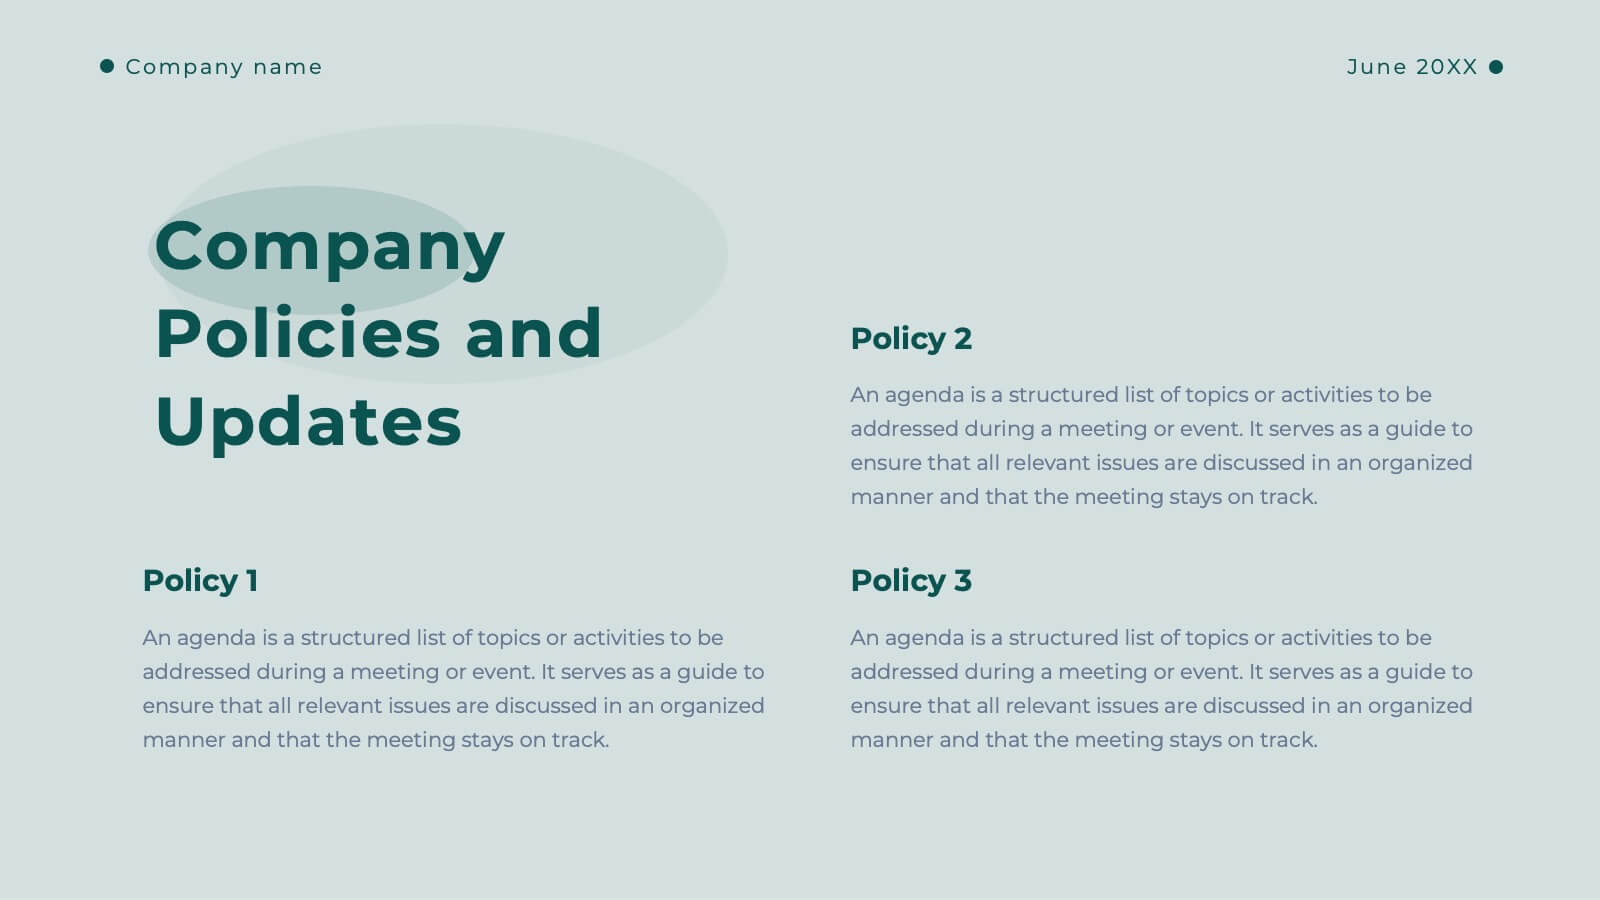
Clarity Business Operations Plan Presentation
Optimize your business operations with this sleek presentation template! Perfect for outlining team updates, key achievements, and performance metrics, it includes slides for departmental goals, process improvements, and upcoming events. Engage your team with clear visuals and detailed content. Compatible with PowerPoint, Keynote, and Google Slides for seamless presentations on any platform.


7 diapositivas
Geographic Global Data Presentation
Bring worldwide insights to life with a crisp, modern layout designed to make global trends easy to understand. This presentation highlights regional metrics, geographic comparisons, and key data points in a clean, visual format perfect for business or research reporting. Fully compatible with PowerPoint, Keynote, and Google Slides.


24 diapositivas
Spireflow Corporate Strategy Report Presentation
Showcase your business insights with this modern, dynamic presentation template designed to communicate strategic goals and objectives effectively. From SWOT analysis to sales strategy and financial performance, each slide is tailored to enhance clarity and engagement. Perfect for business strategists and teams, this template is compatible with PowerPoint, Keynote, and Google Slides.


5 diapositivas
Yearly Employee Performance Review Presentation
Celebrate your team’s progress with a modern, data-rich design that’s clear, visual, and professional. This template makes it easy to present yearly performance metrics, individual achievements, and growth comparisons through engaging charts and infographics. Perfect for annual reports and reviews. Compatible with PowerPoint, Keynote, and Google Slides for effortless editing.


21 diapositivas
Manticore Financial Report Presentation
This financial report template features a sleek, modern design for presenting key highlights, performance metrics, and financial summaries. It includes sections for market trends, competitor insights, and strategic initiatives. Fully customizable and compatible with PowerPoint, Keynote, and Google Slides, it's perfect for delivering impactful financial presentations with clarity and style.


8 diapositivas
Lean Business Model Canvas Framework Presentation
Visualize your entire business strategy on a single slide with this Lean Business Model Canvas. Ideal for startups or strategic planning, each editable block represents a key area: value propositions, customer segments, revenue, and more. Streamlined and clear, it's perfect for team alignment or investor-ready business model pitches.


2 diapositivas
Stylish Title Cover Presentation for Reports Presentation
Set the tone with a title slide that means business—without being boring. This stylish cover layout gives your report presentations a polished, modern look while keeping the focus clear and professional. Ideal for executive updates or client-facing decks, it’s fully editable and works perfectly in PowerPoint, Keynote, and Google Slides.


5 diapositivas
North America Business Landscape Map Presentation
Explore the business terrain with the "North America Business Landscape Map" template, which delivers a comprehensive visualization of business data across various regions. Designed for strategic presentations, it enables clear communication of market insights and data points, crucial for decision-making. This template is compatible with PowerPoint, Keynote, and Google Slides, enhancing its utility for professionals in diverse fields.


26 diapositivas
Real Estate Company Profile Presentation
Step into the world of real estate, where every brick tells a story and every home harbors a dream. Our warm and bold template, draped in varying shades of brown, encapsulates the essence of properties, from cozy homes to towering skyscrapers. Boasting tailored graphics, detailed icons, and versatile image placeholders, it's more than just a visual aid; it's an experience. Seamless compatibility ensures it's ready for Powerpoint, Keynote, or Google Slides. An invaluable asset for realtors, property managers, housing agencies, or anyone looking to make an impact in the real estate market. Present with confidence; let every property shine.


21 diapositivas
Ruby Startup Funding Proposal Presentation
Get ready to pitch your startup in style with this vibrant and engaging presentation template! Perfect for showcasing your startup’s founding story, business model, market analysis, and financial overview, this template ensures you’ll impress potential investors. Fully customizable and compatible with PowerPoint, Keynote, and Google Slides, it’s ideal for securing funding and support.


5 diapositivas
Harvey Ball Rating System Overview Presentation
Visualize performance ratings or feature comparisons with the Harvey Ball Rating System Overview Presentation. This template uses vertical bar visuals combined with Harvey ball icons to communicate progress, satisfaction, or status across four key areas. Clean, intuitive, and ideal for executive summaries or status dashboards. Fully editable and compatible with PowerPoint, Keynote, and Google Slides.


21 diapositivas
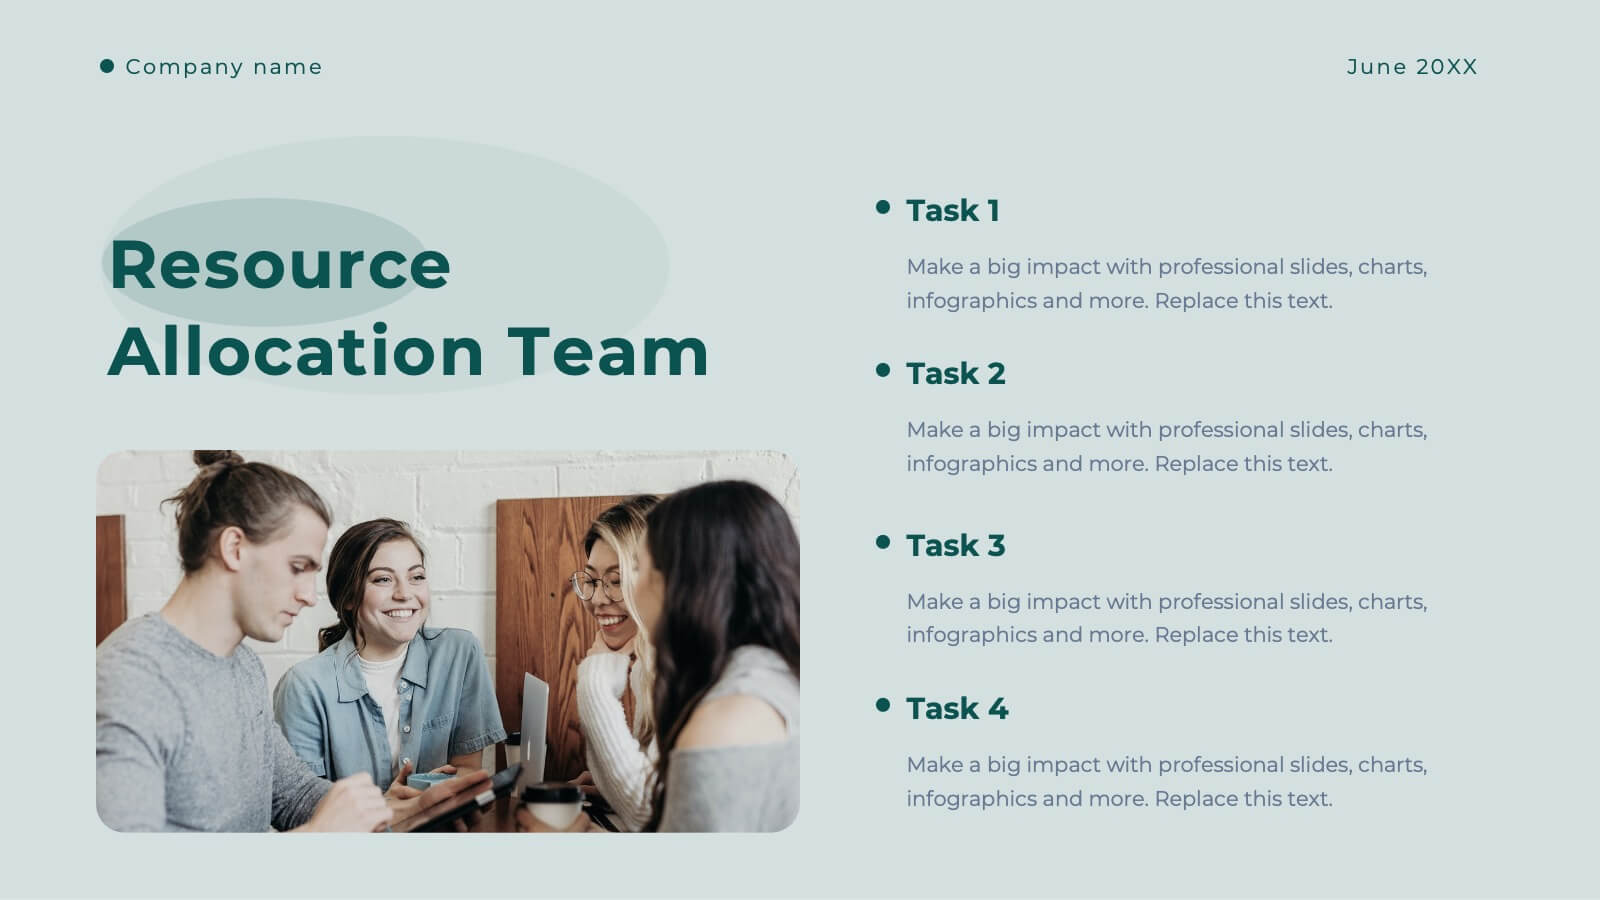
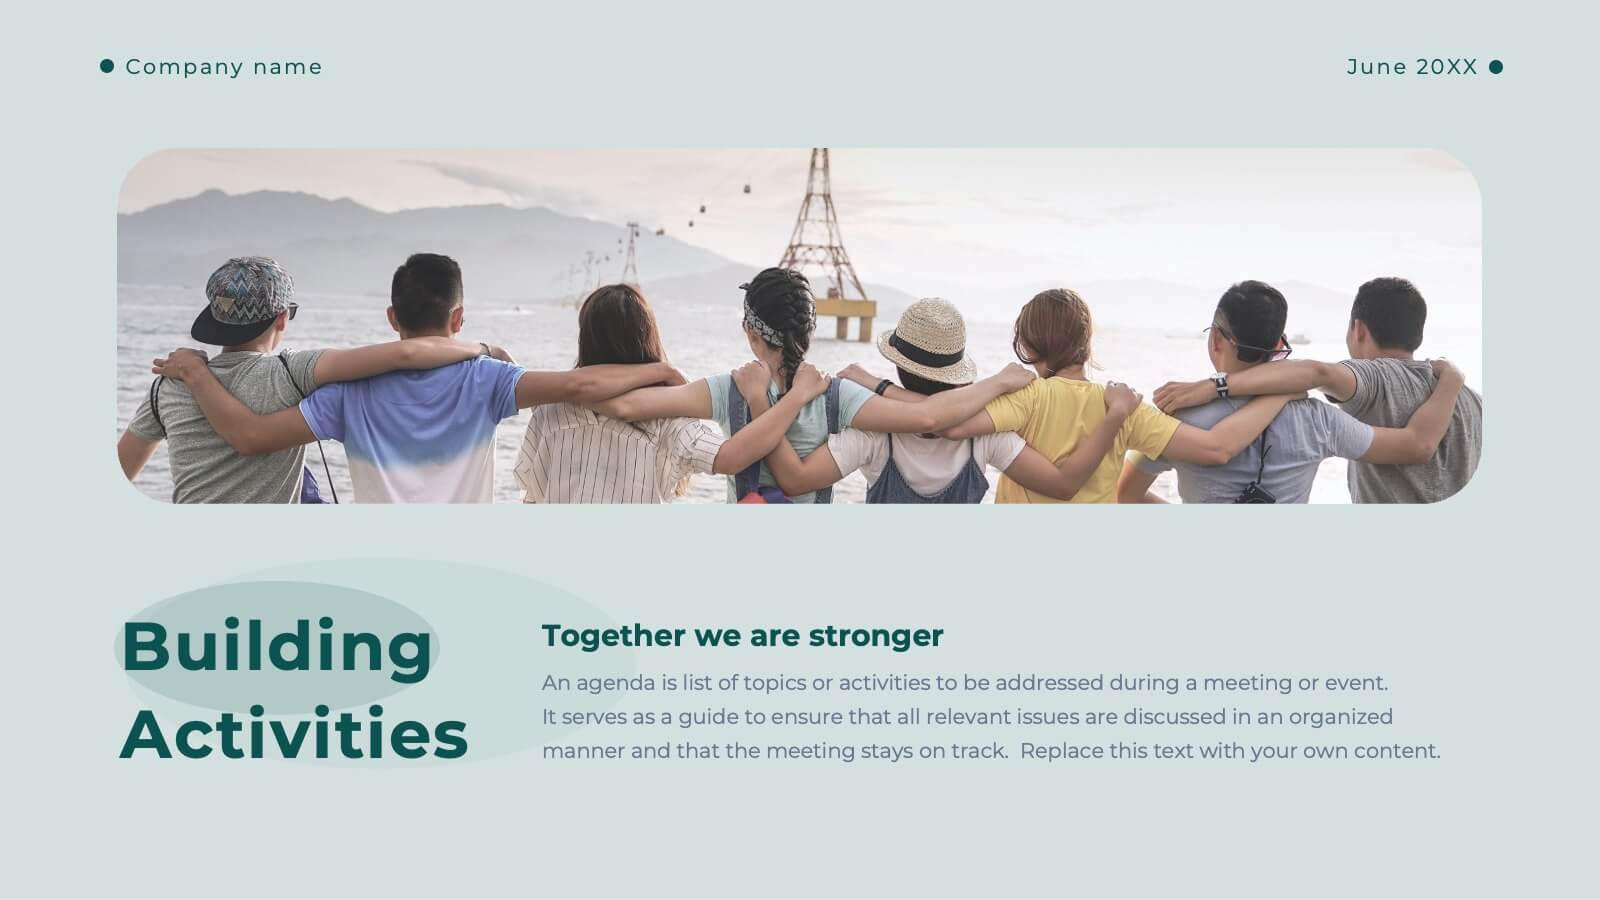
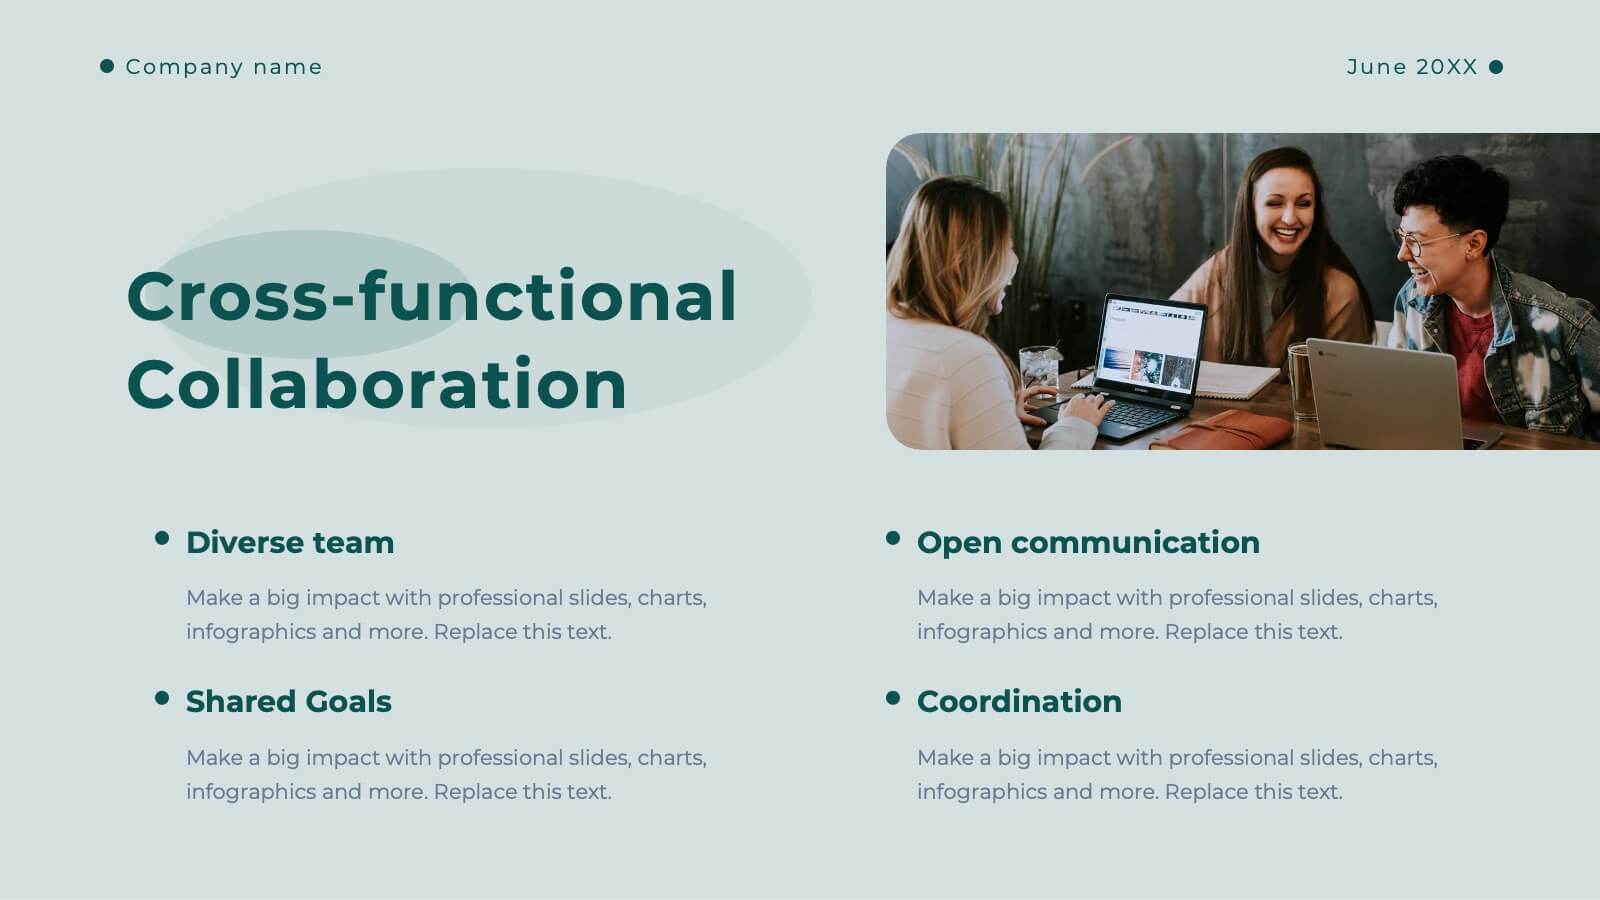
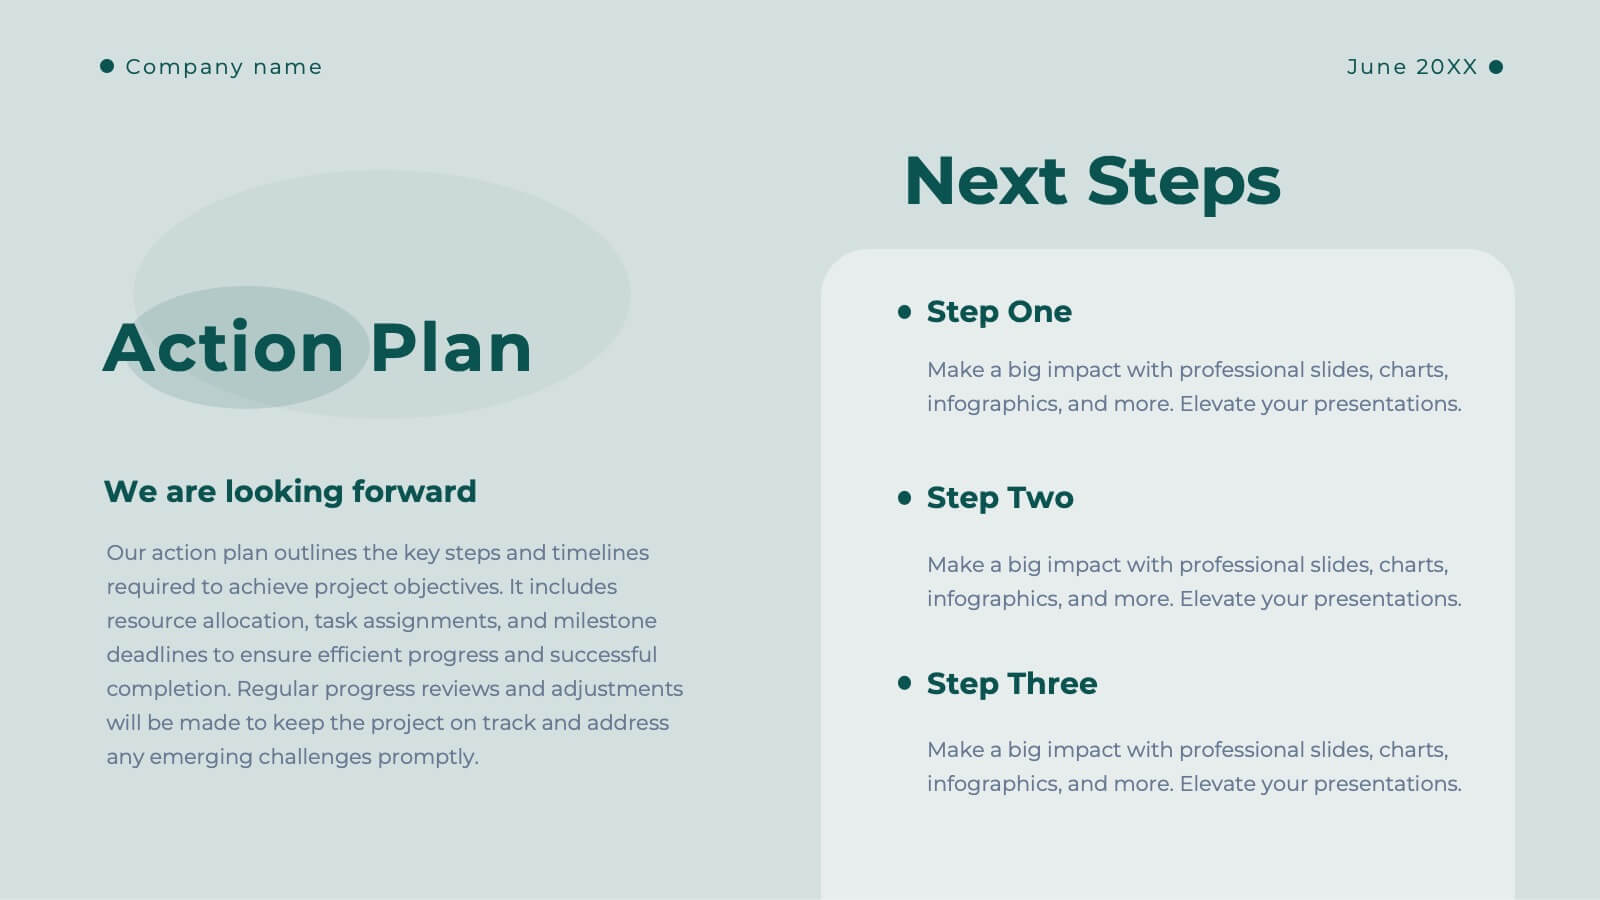
Vespera Project Management Plan Presentation
This Project Management Plan Presentation template is a professional and well-structured tool to outline project goals, scope, timelines, and resources. It covers key elements like deliverables, budget breakdown, risk management, and stakeholder analysis. Fully customizable and compatible with PowerPoint, Keynote, and Google Slides for seamless collaboration.