


Características


¿Tienes alguna pregunta?
Recomendar


5 diapositivas
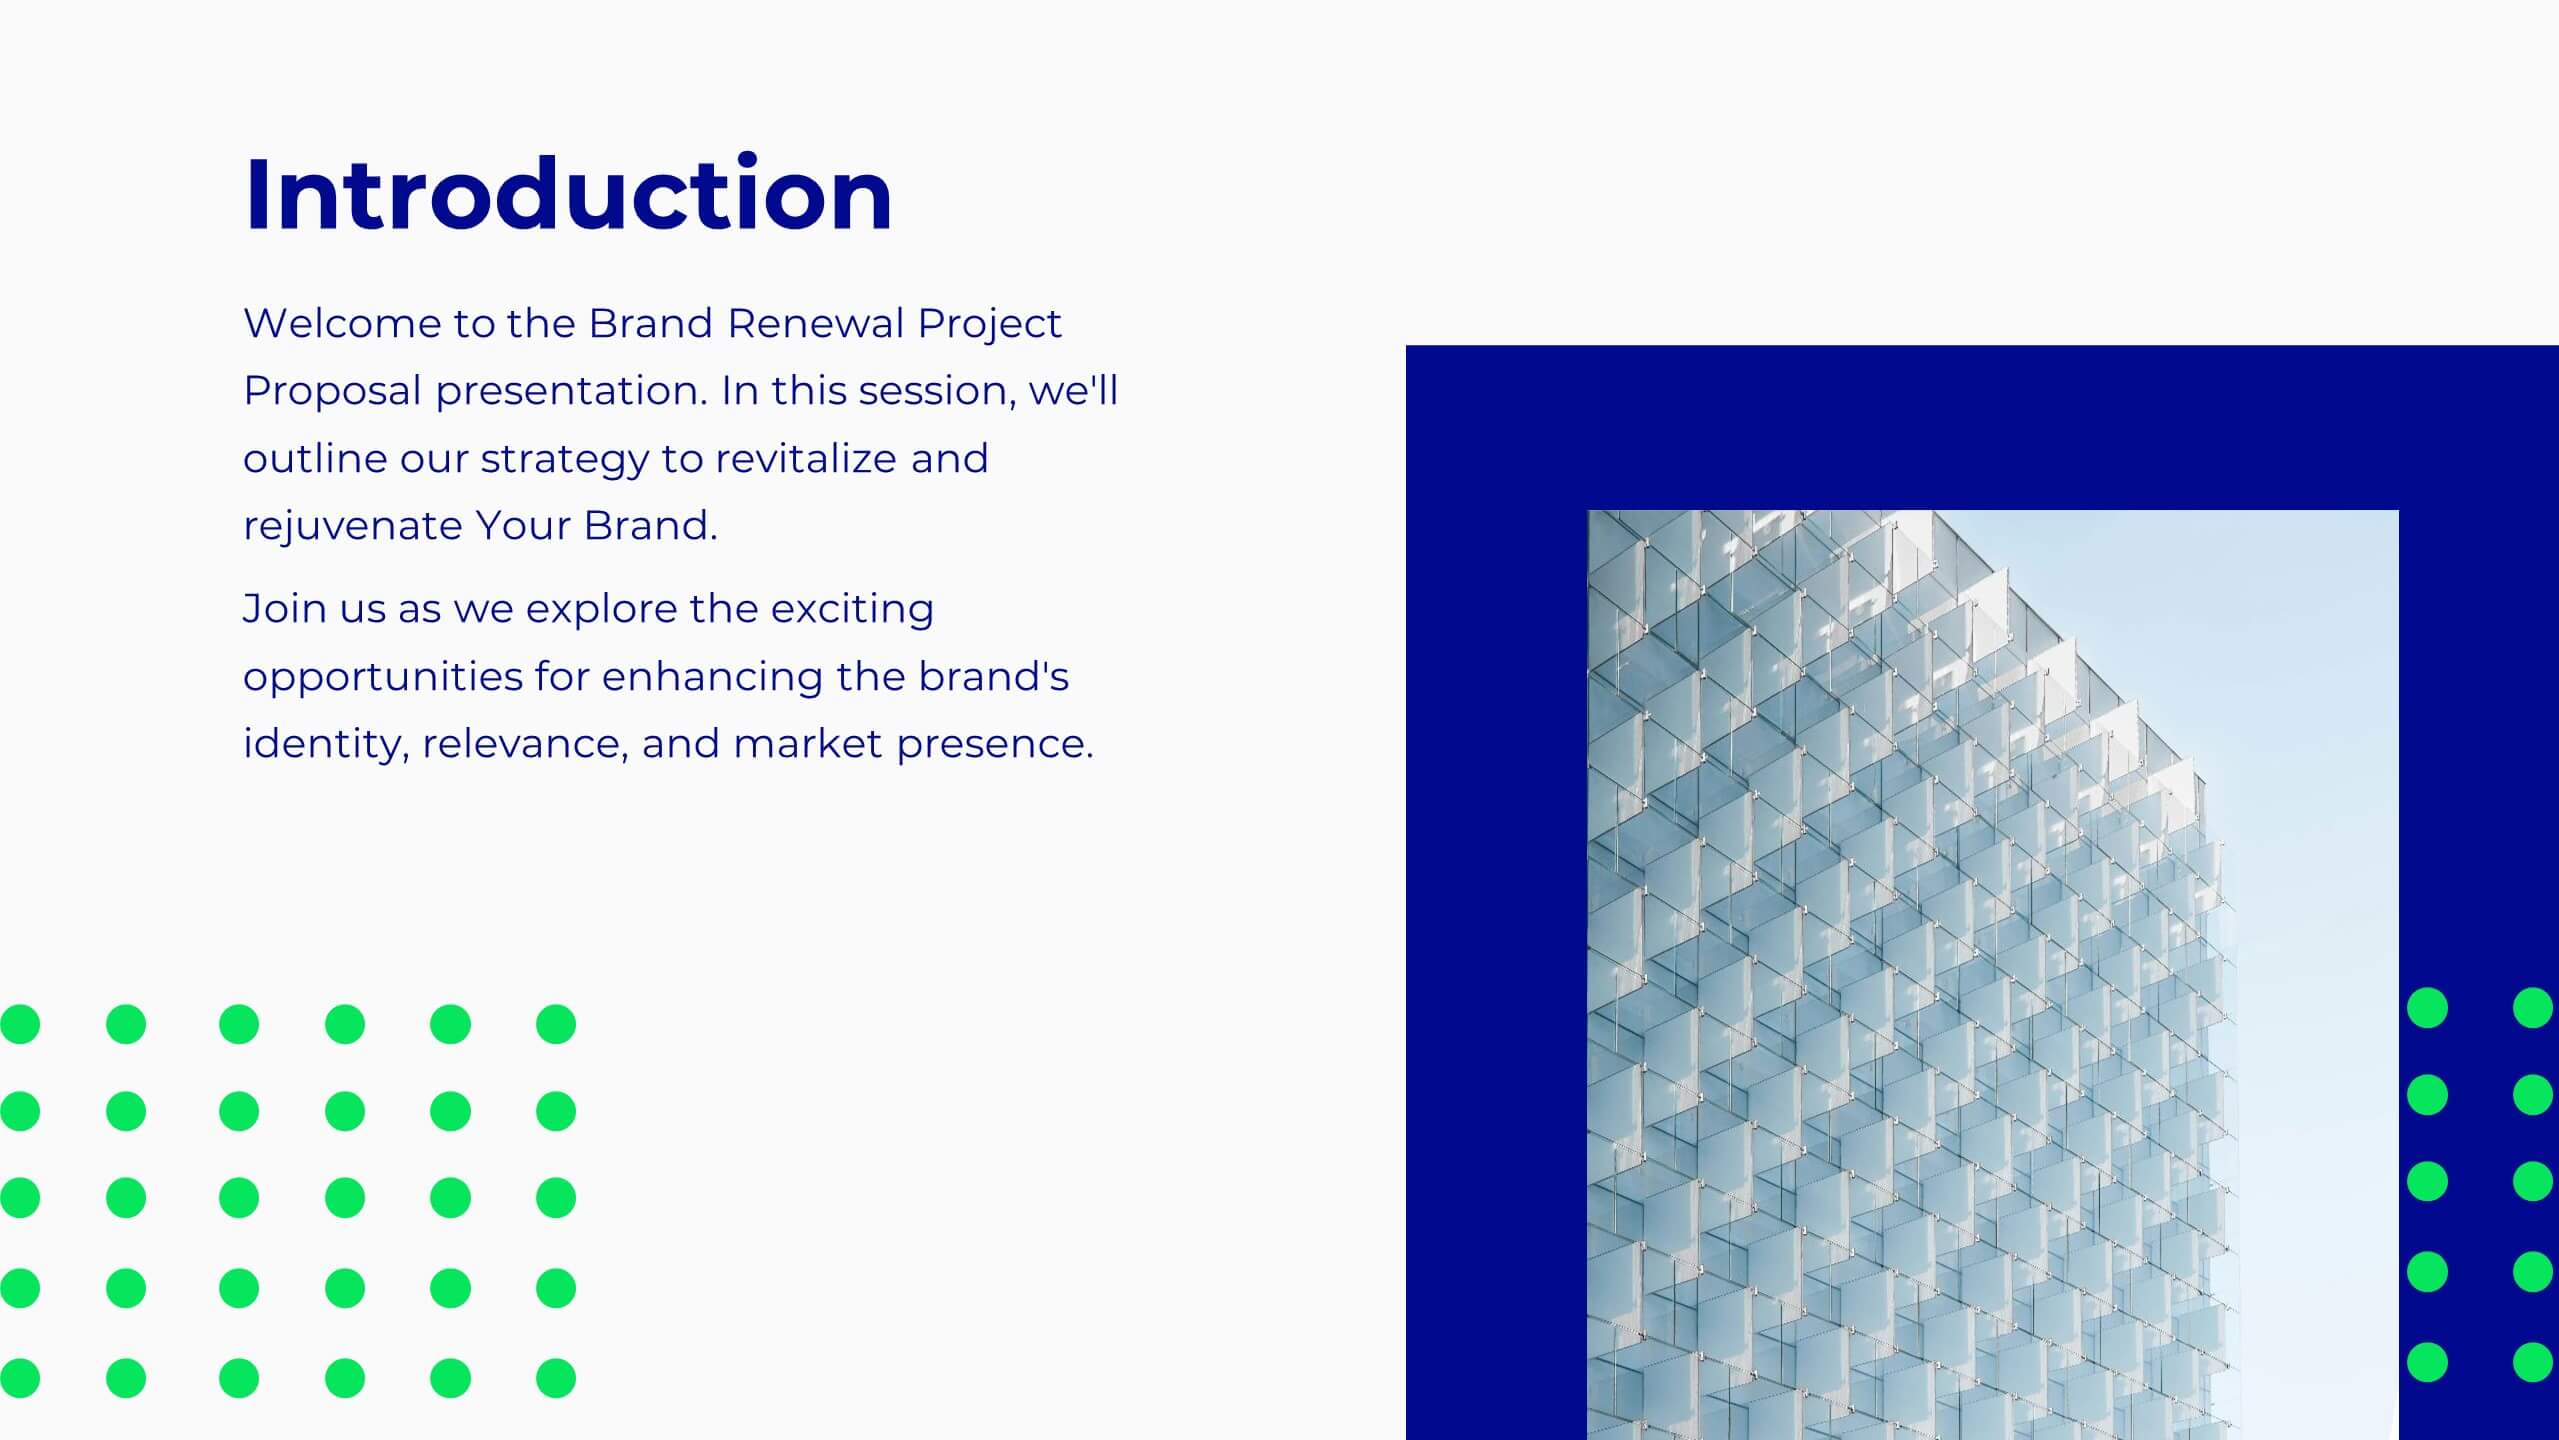
Six Sigma DMAIC Process Flow Presentation
Streamline your process improvement with this Six Sigma DMAIC Flow template. Visually organize each stage—Define, Measure, Analyze, Improve, Control—using clean, professional layouts. Perfect for Lean Six Sigma projects, quality control, and operational excellence. Fully customizable in PowerPoint, Keynote, and Google Slides for versatile team presentations and process reviews.


4 diapositivas
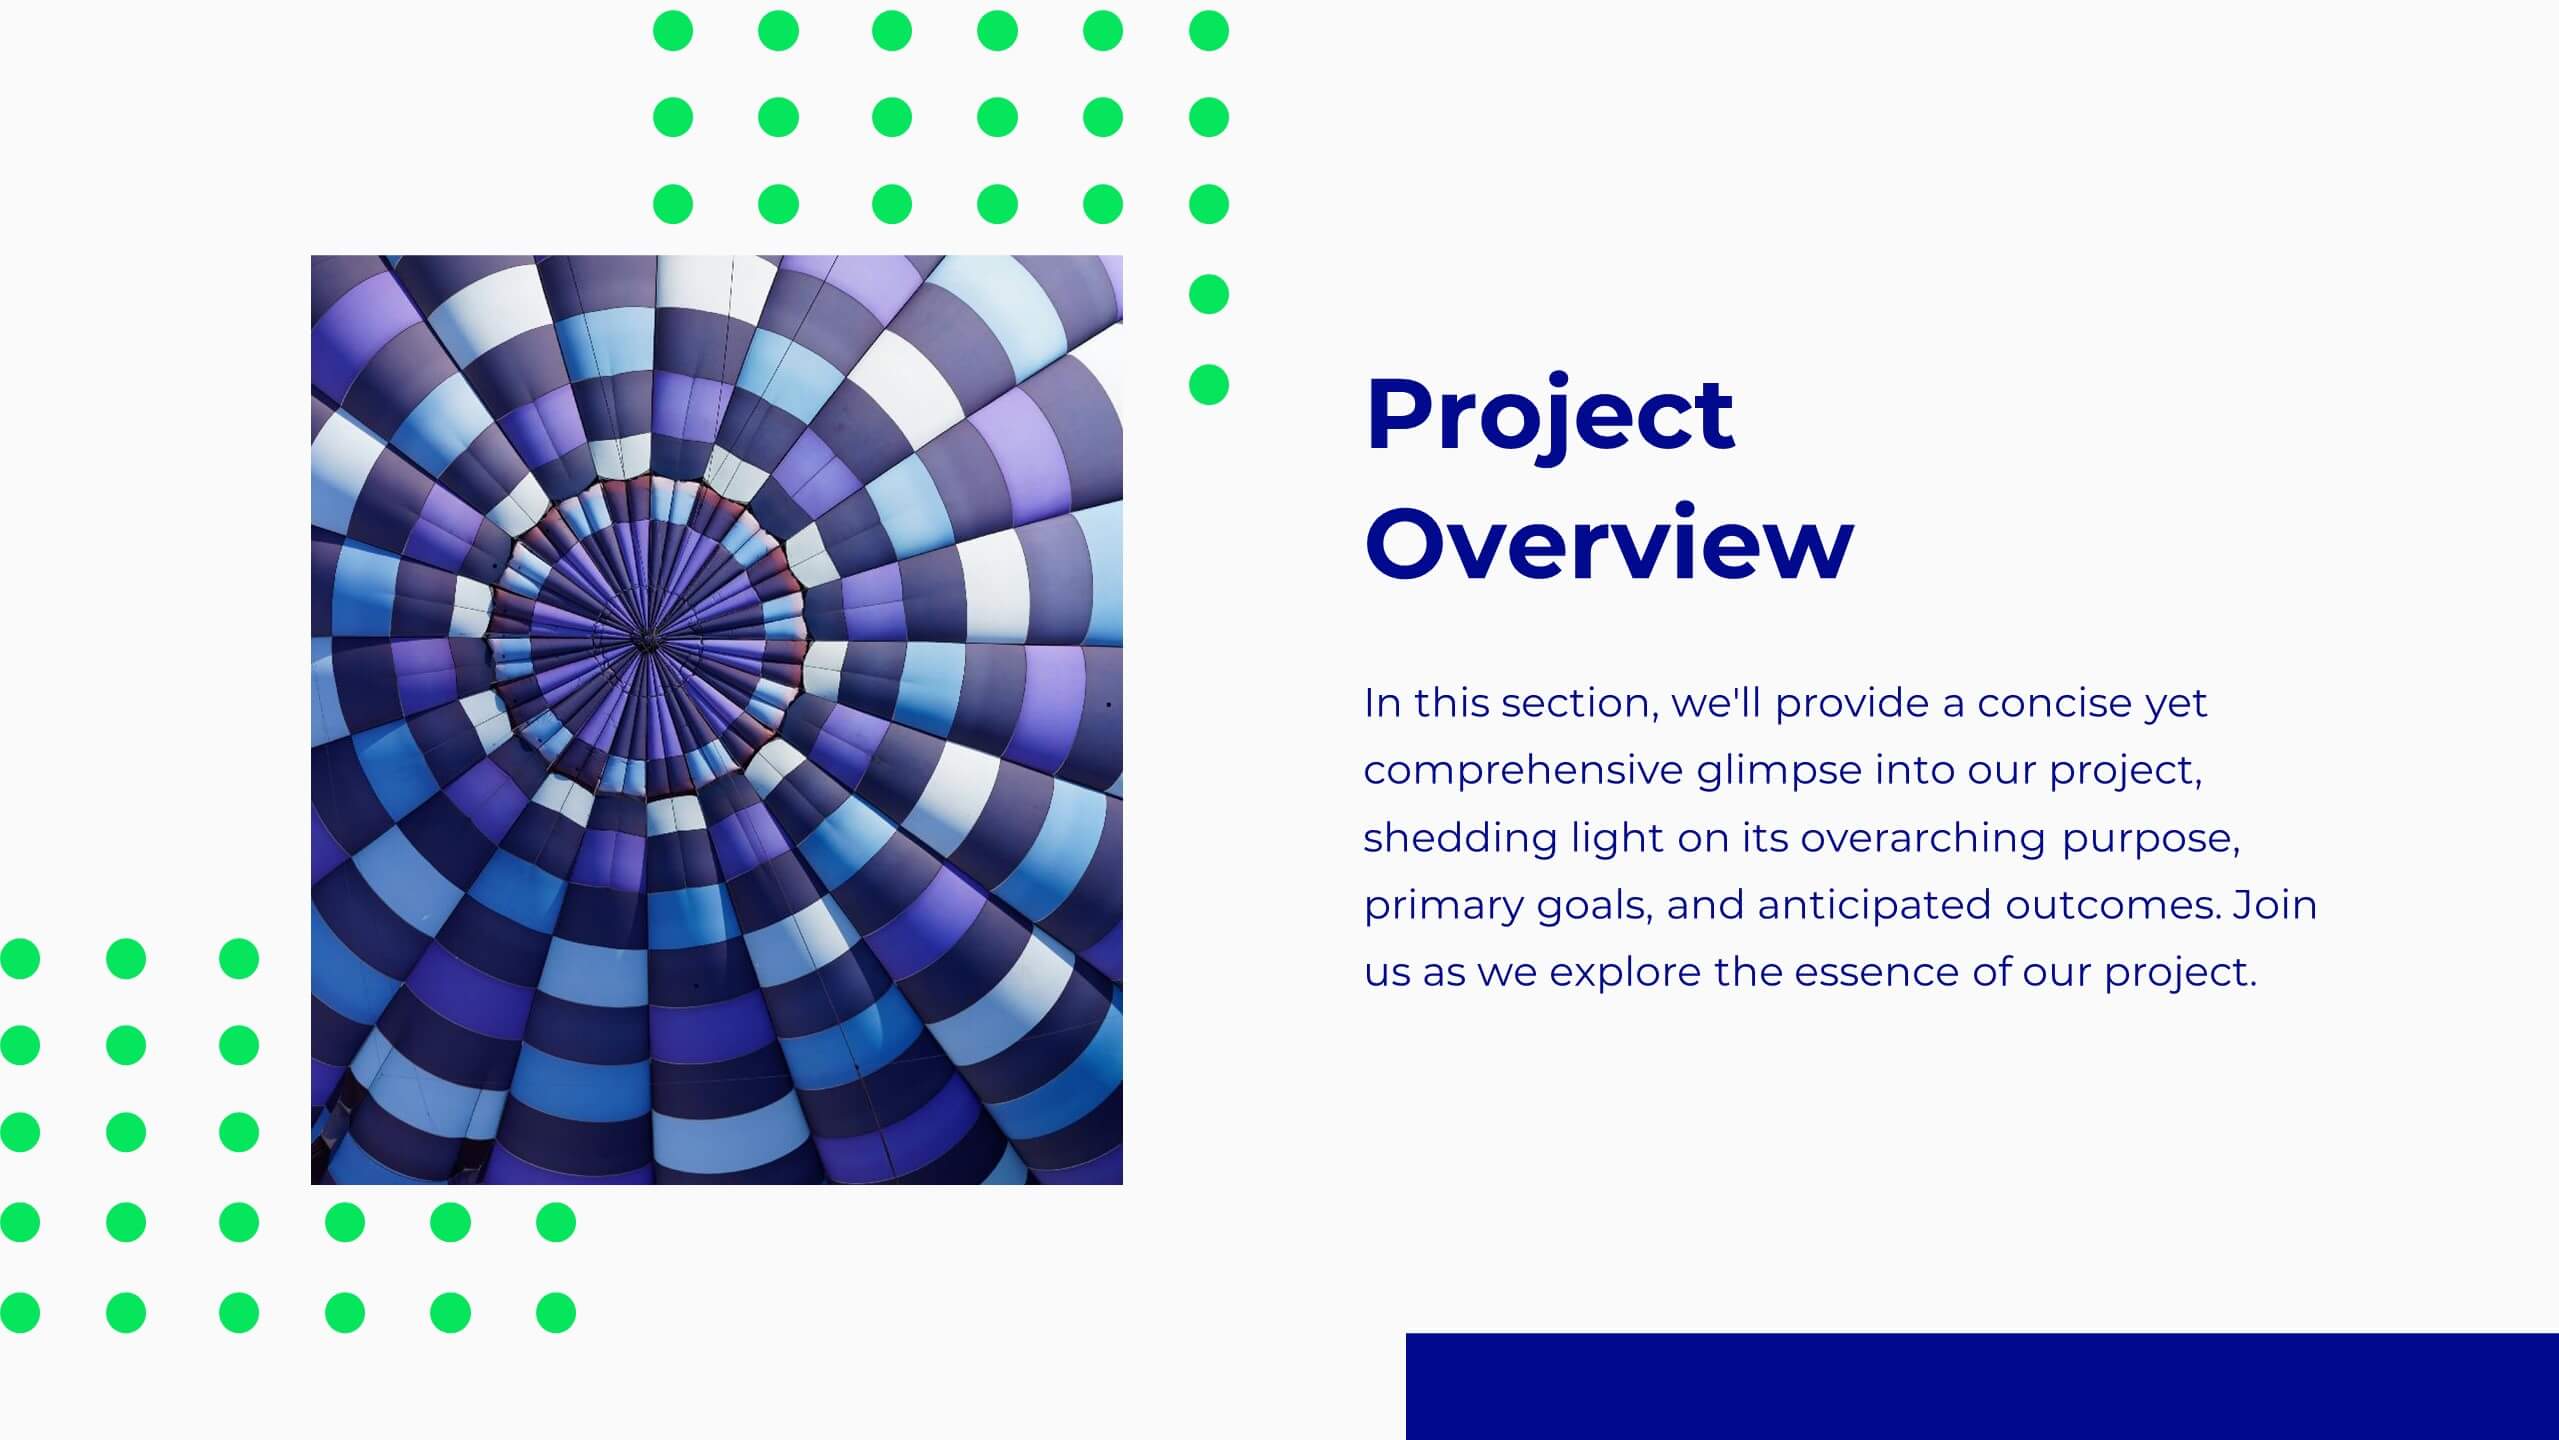
4-Quadrant RACI Chart Slide Presentation
Bring structure and clarity to your workflow with a bold, pyramid-style layout that makes responsibilities instantly understandable. This presentation helps teams outline who leads, supports, approves, and informs across key tasks, turning complex processes into a clean visual map. Fully editable and compatible with PowerPoint, Keynote, and Google Slides.


8 diapositivas
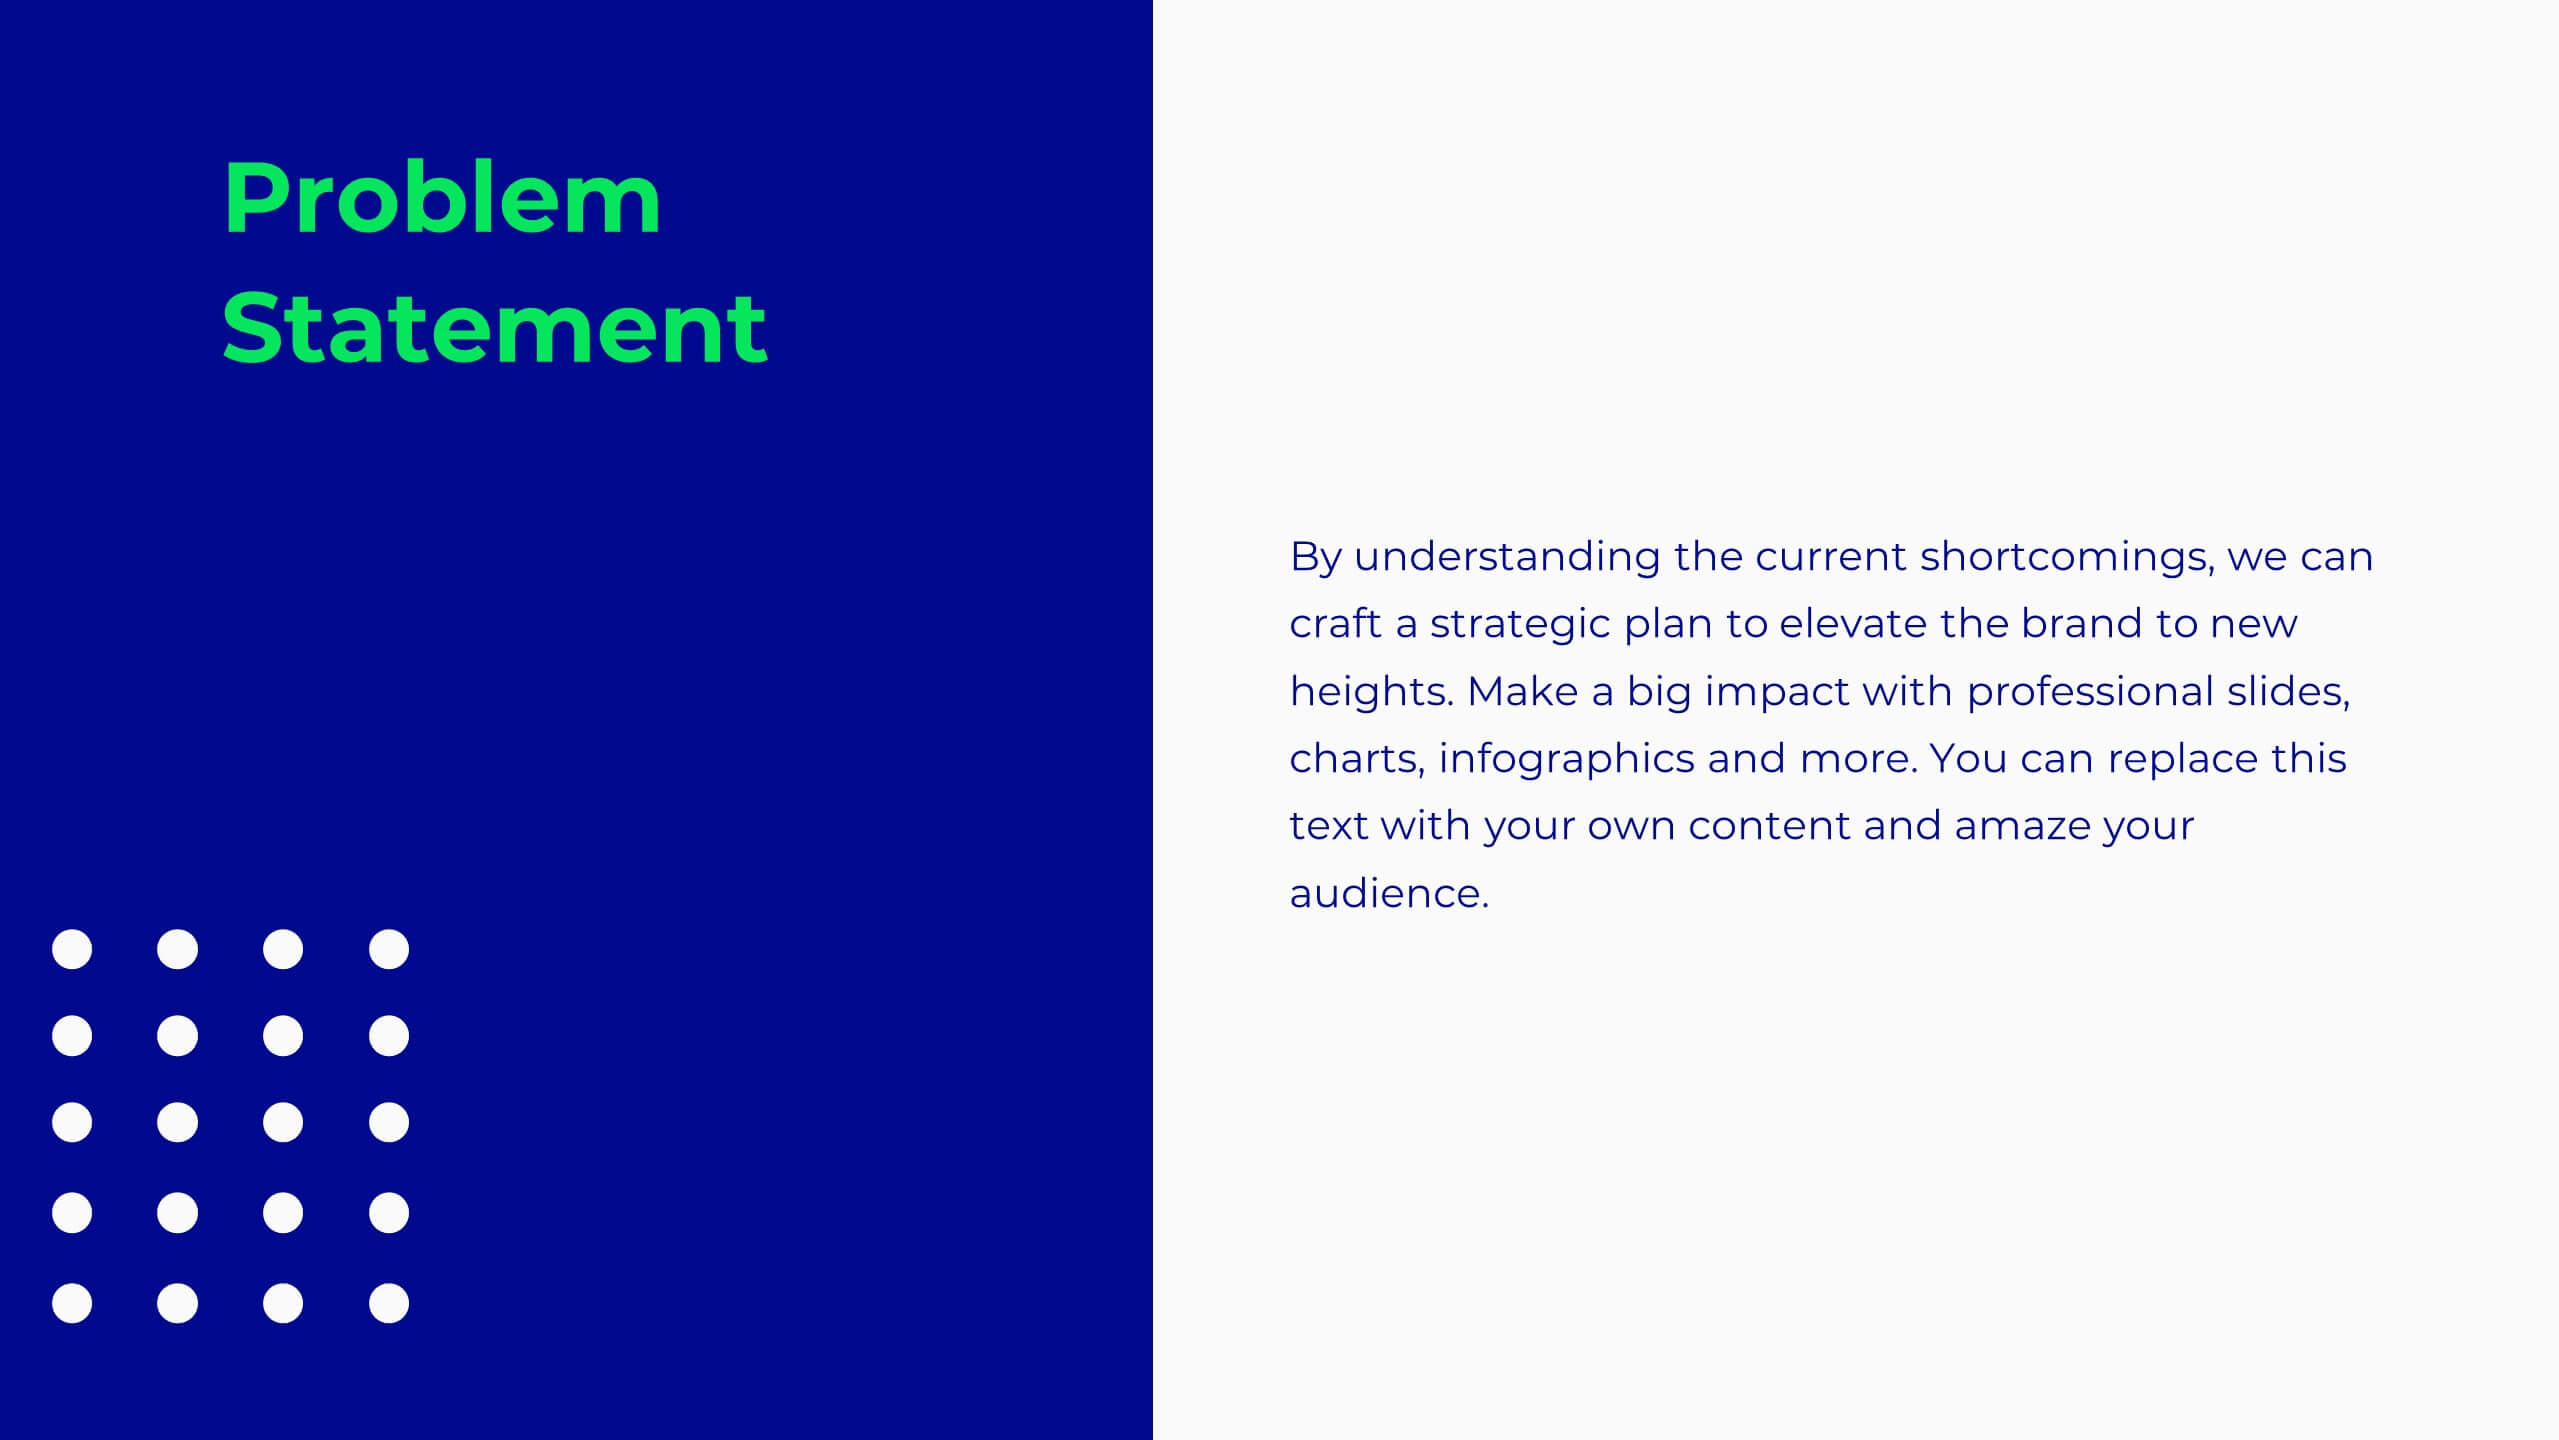
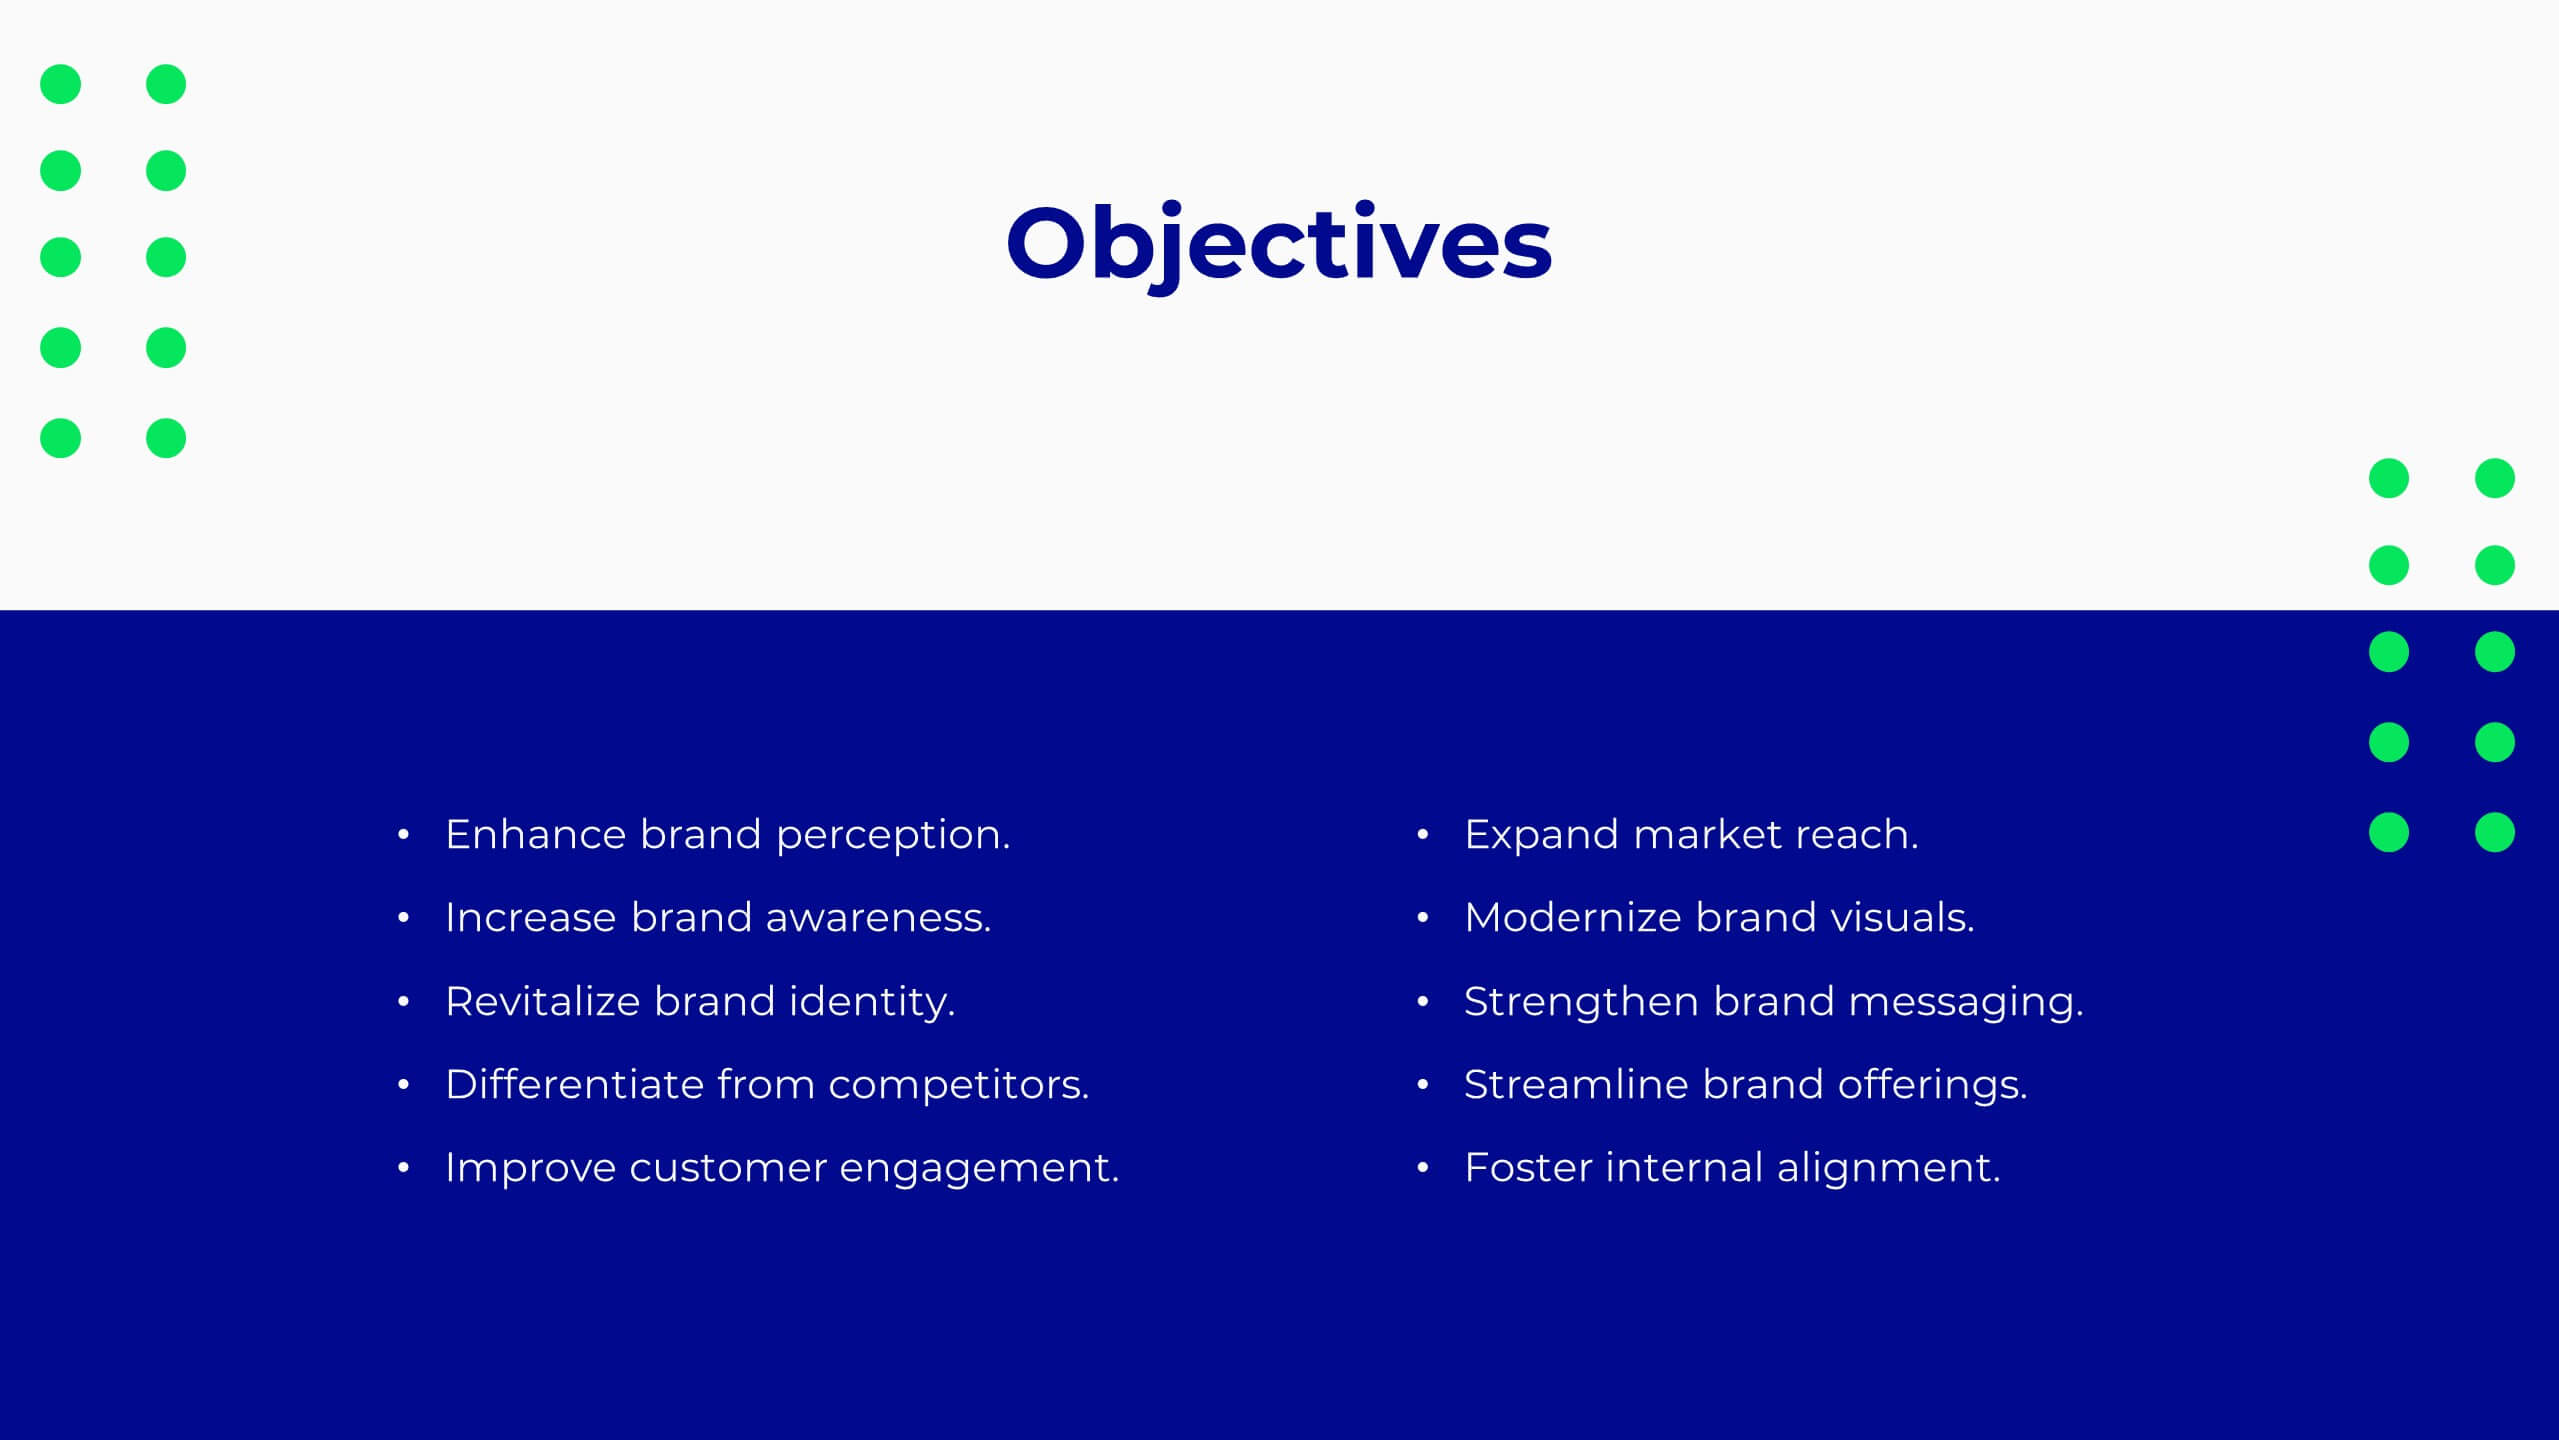
Success Metrics and Performance Presentation
Showcase your Success Metrics and Performance with this data-driven presentation template. Designed with bar-style visualizations and percentage-based highlights, this layout is ideal for business analysts, project managers, and executives looking to present key performance indicators (KPIs) with clarity. Featuring customizable colors, icons, and text placeholders, this template ensures clear and impactful storytelling. Compatible with PowerPoint, Keynote, and Google Slides for easy integration.


4 diapositivas
Workflow Bottleneck Fishbone Analysis
Identify slowdowns and streamline performance with the Workflow Bottleneck Fishbone Analysis Presentation. This diagram features a horizontally aligned fishbone structure with segmented semicircles, ideal for pinpointing process inefficiencies across stages. Fully customizable in PowerPoint, Keynote, and Google Slides for professional workflow diagnostics.


7 diapositivas
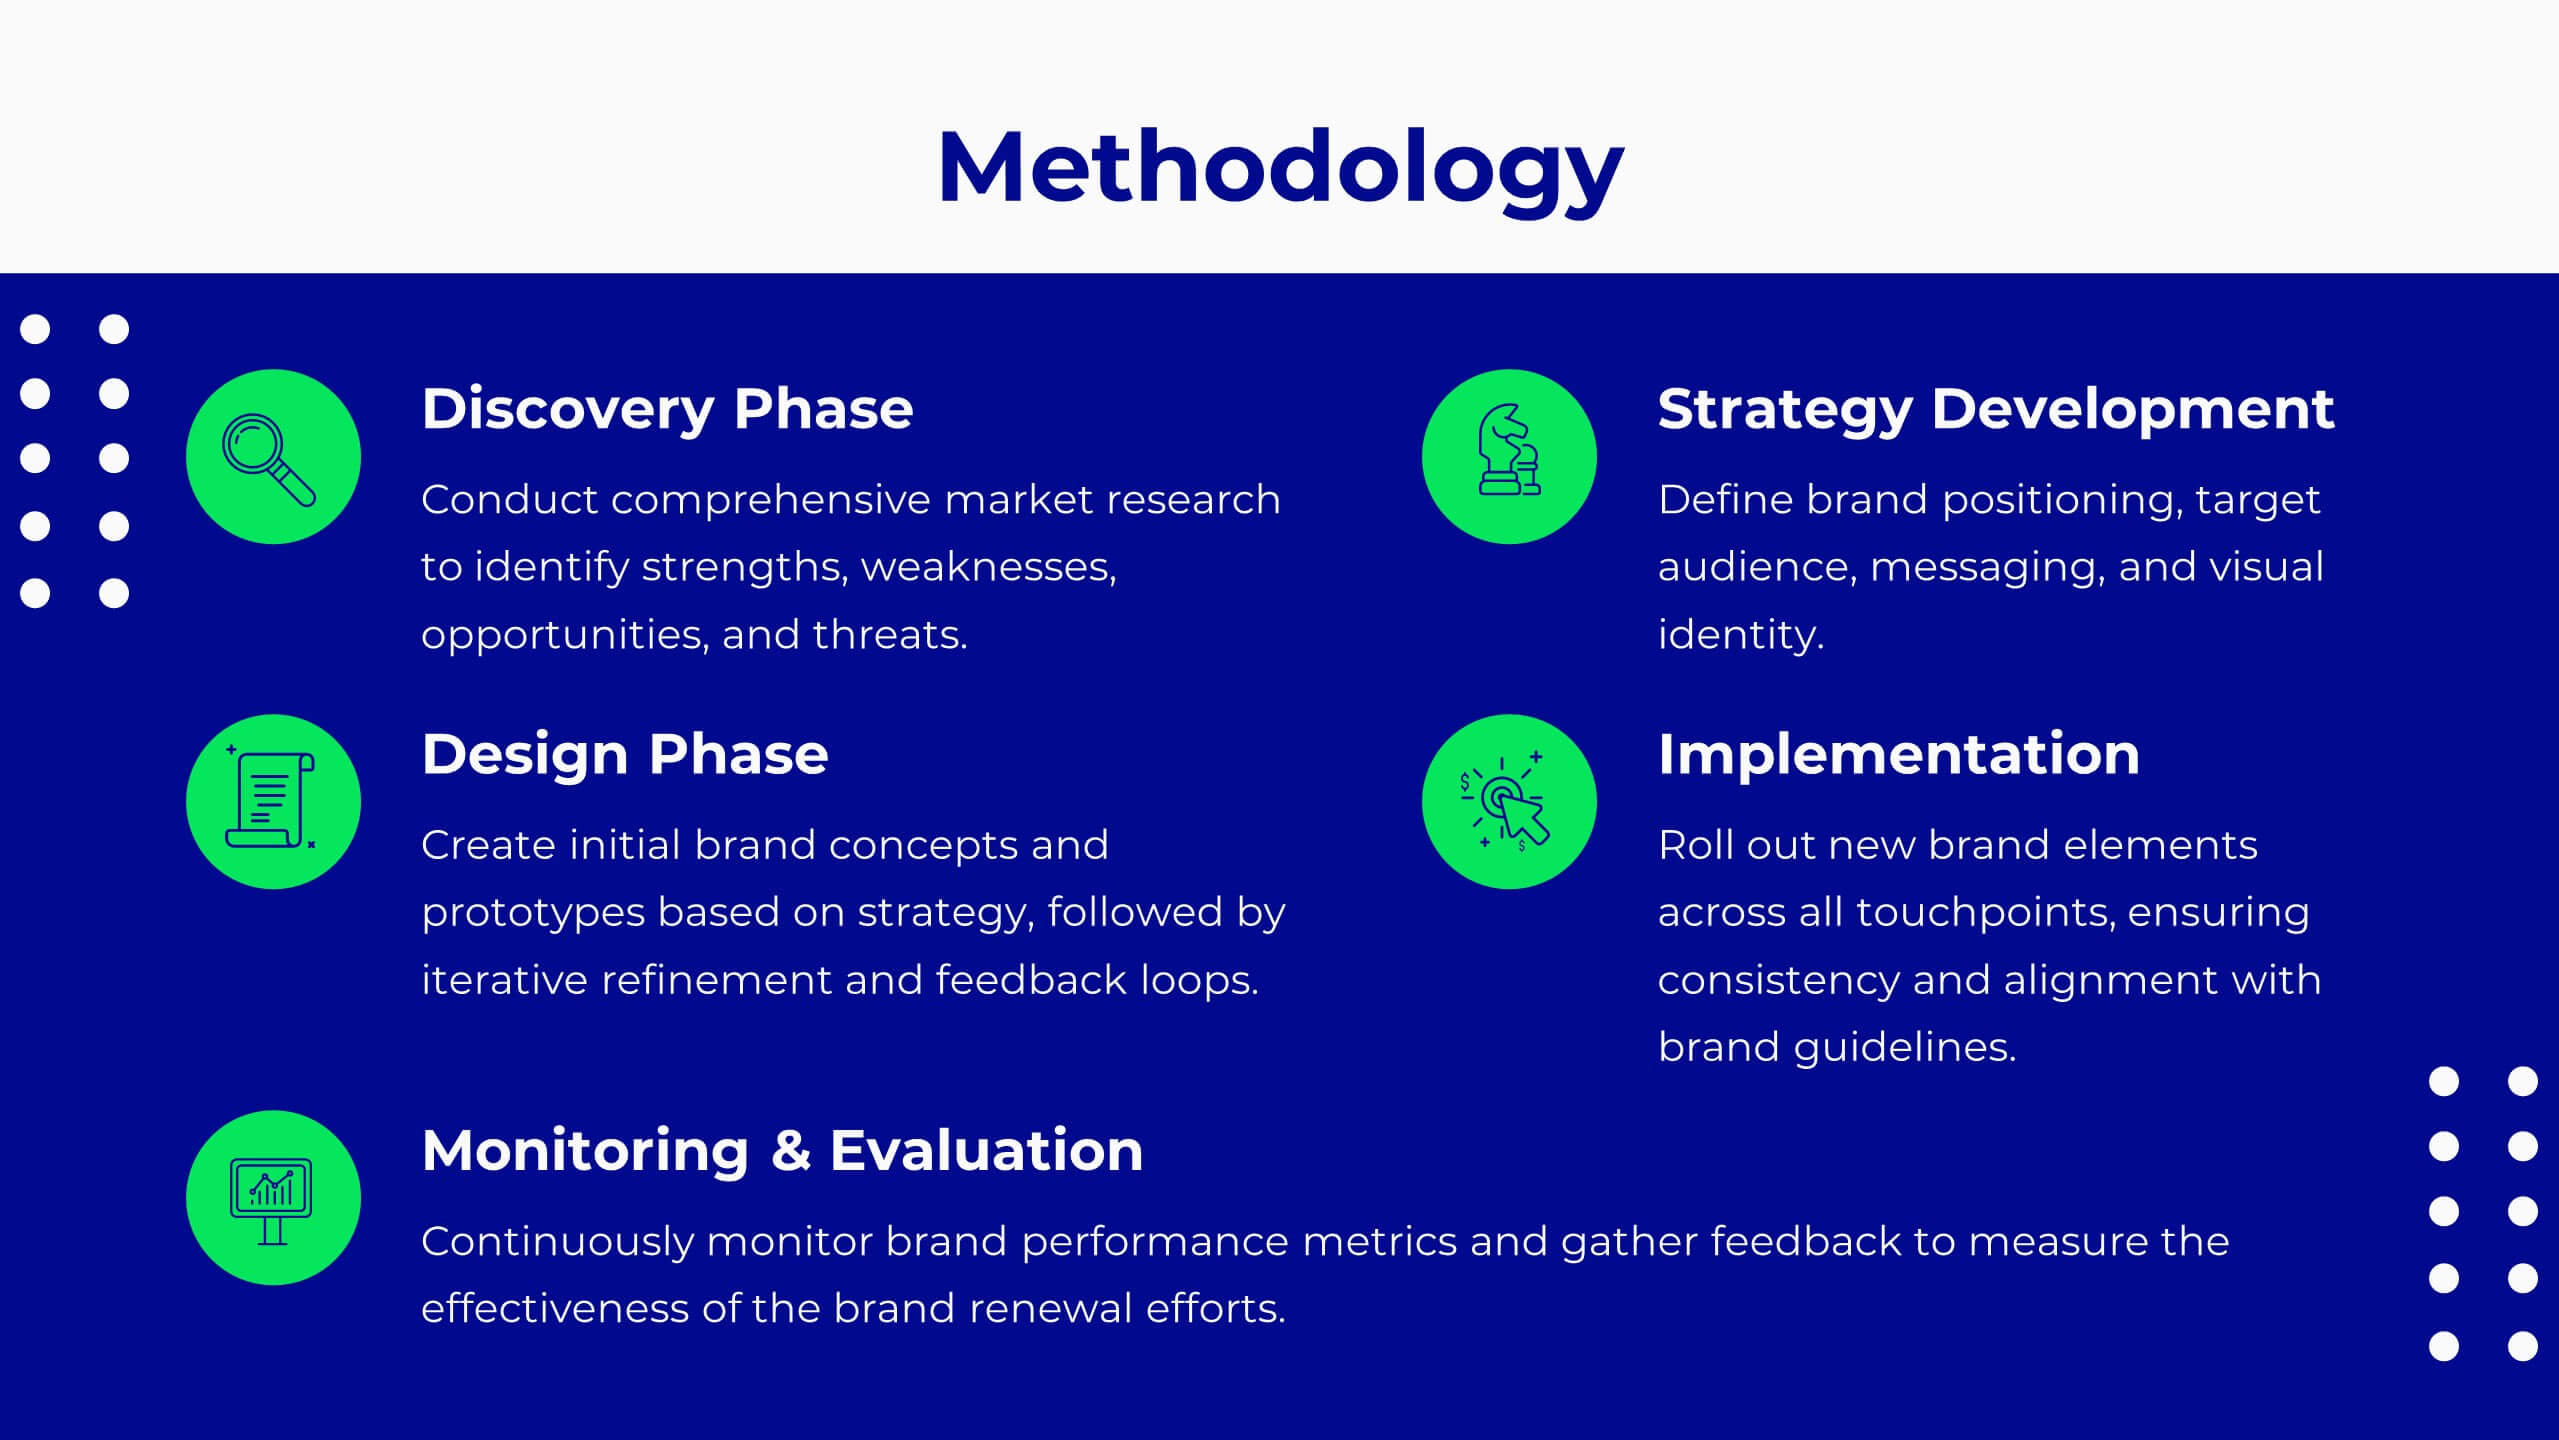
McKinsey 7S Management Infographic Presentation
The McKinsey 7S model is designed to help organizations understand the various components that need to be aligned for effective performance. This Infographic is a visually engaging way to describe the 7S framework. Use it to deliver an informative message and get your ideas across clearly using the well designed graphics. This template is fully customizable to portray your company's key points and challenges in your specific business domain. It has all the elements to make a powerful business presentation and can create engaging templates with Powerpoint, Keynote, Google Slides and more.


26 diapositivas
Premium Finance for Daily Life Presentation
Introducing our Premium Finance for Daily Life Presentation template this is a comprehensive and informative tool to educate individuals about the concept of premium finance and its relevance in everyday life. This presentation aims to provide valuable insights on how premium finance can be utilized to manage and optimize personal finances. The slides are fully customizable and compatible with PowerPoint, Keynote, and Google Slides. It features a professional design with clean layouts, visually appealing graphics, and icons related to finance and daily life activities. The presentation can cover various topics related to premium finance.


4 diapositivas
User Base by Demographic Factors
Understand your audience at a glance with the User Base by Demographic Factors Presentation. This visual template displays gender-based or group-based demographic insights alongside bar chart statistics and percentages, making it ideal for marketing reports, pitch decks, or user research presentations. Fully customizable in PowerPoint, Keynote, and Google Slides.


4 diapositivas
Corporate Finance and Expense Review Presentation
Visualize your company's financial structure with this Corporate Finance and Expense Review Presentation. Featuring a wallet-themed layout with three editable icons and text blocks, this slide helps you clearly present income sources, expenses, and budget allocations. Fully customizable in Canva, PowerPoint, and Google Slides.


5 diapositivas
Chemistry Lessons Infographics
Dive into the fascinating world of chemistry with our chemistry lessons infographics. Set against a backdrop of bold orange, black, and blue, this template captures the vibrant essence of chemical reactions and laboratory experiments. Tailored for educators, students, and science enthusiasts, this collection is perfect for enhancing lesson plans, study materials, or research presentations. Compatible with Powerpoint, Keynote, and Google Slides. With its creative, lab-themed design, each infographic is enriched with striking graphics and icons, providing a visual feast that simplifies complex concepts and promotes the joy of learning chemistry.


6 diapositivas
Workload Distribution and Calendar Plan Presentation
Stay on top of weekly responsibilities with the Workload Distribution and Calendar Plan Presentation. This visual planning template helps teams clearly assign tasks across days of the week, making it easy to organize schedules and boost productivity. Fully editable in PowerPoint, Keynote, and Google Slides.


6 diapositivas
Iceberg Chart Infographic
An iceberg infographic is a visual representation that uses the metaphor of an iceberg to convey information. This infographic template is designed to highlights the idea that only a small portion of the iceberg is visible above the waterline, while the majority of its mass remains hidden beneath the surface. The larger portion of the iceberg, submerged below the waterline, symbolizes the deeper or less obvious aspects of a topic. This can include underlying causes, complexities, challenges, or additional information that may not be immediately apparent. This is fully customizable and compatible with Powerpoint, Keynote, and Google Slides.


5 diapositivas
Key Business Question Breakdown Presentation
Present critical insights with this keyhole-themed layout, perfect for outlining strategic business questions or core decision points. The six-segment format allows you to break down complex topics into clear, actionable areas. Fully customizable in Canva, PowerPoint, or Google Slides—ideal for planning, workshops, or stakeholder presentations.


5 diapositivas
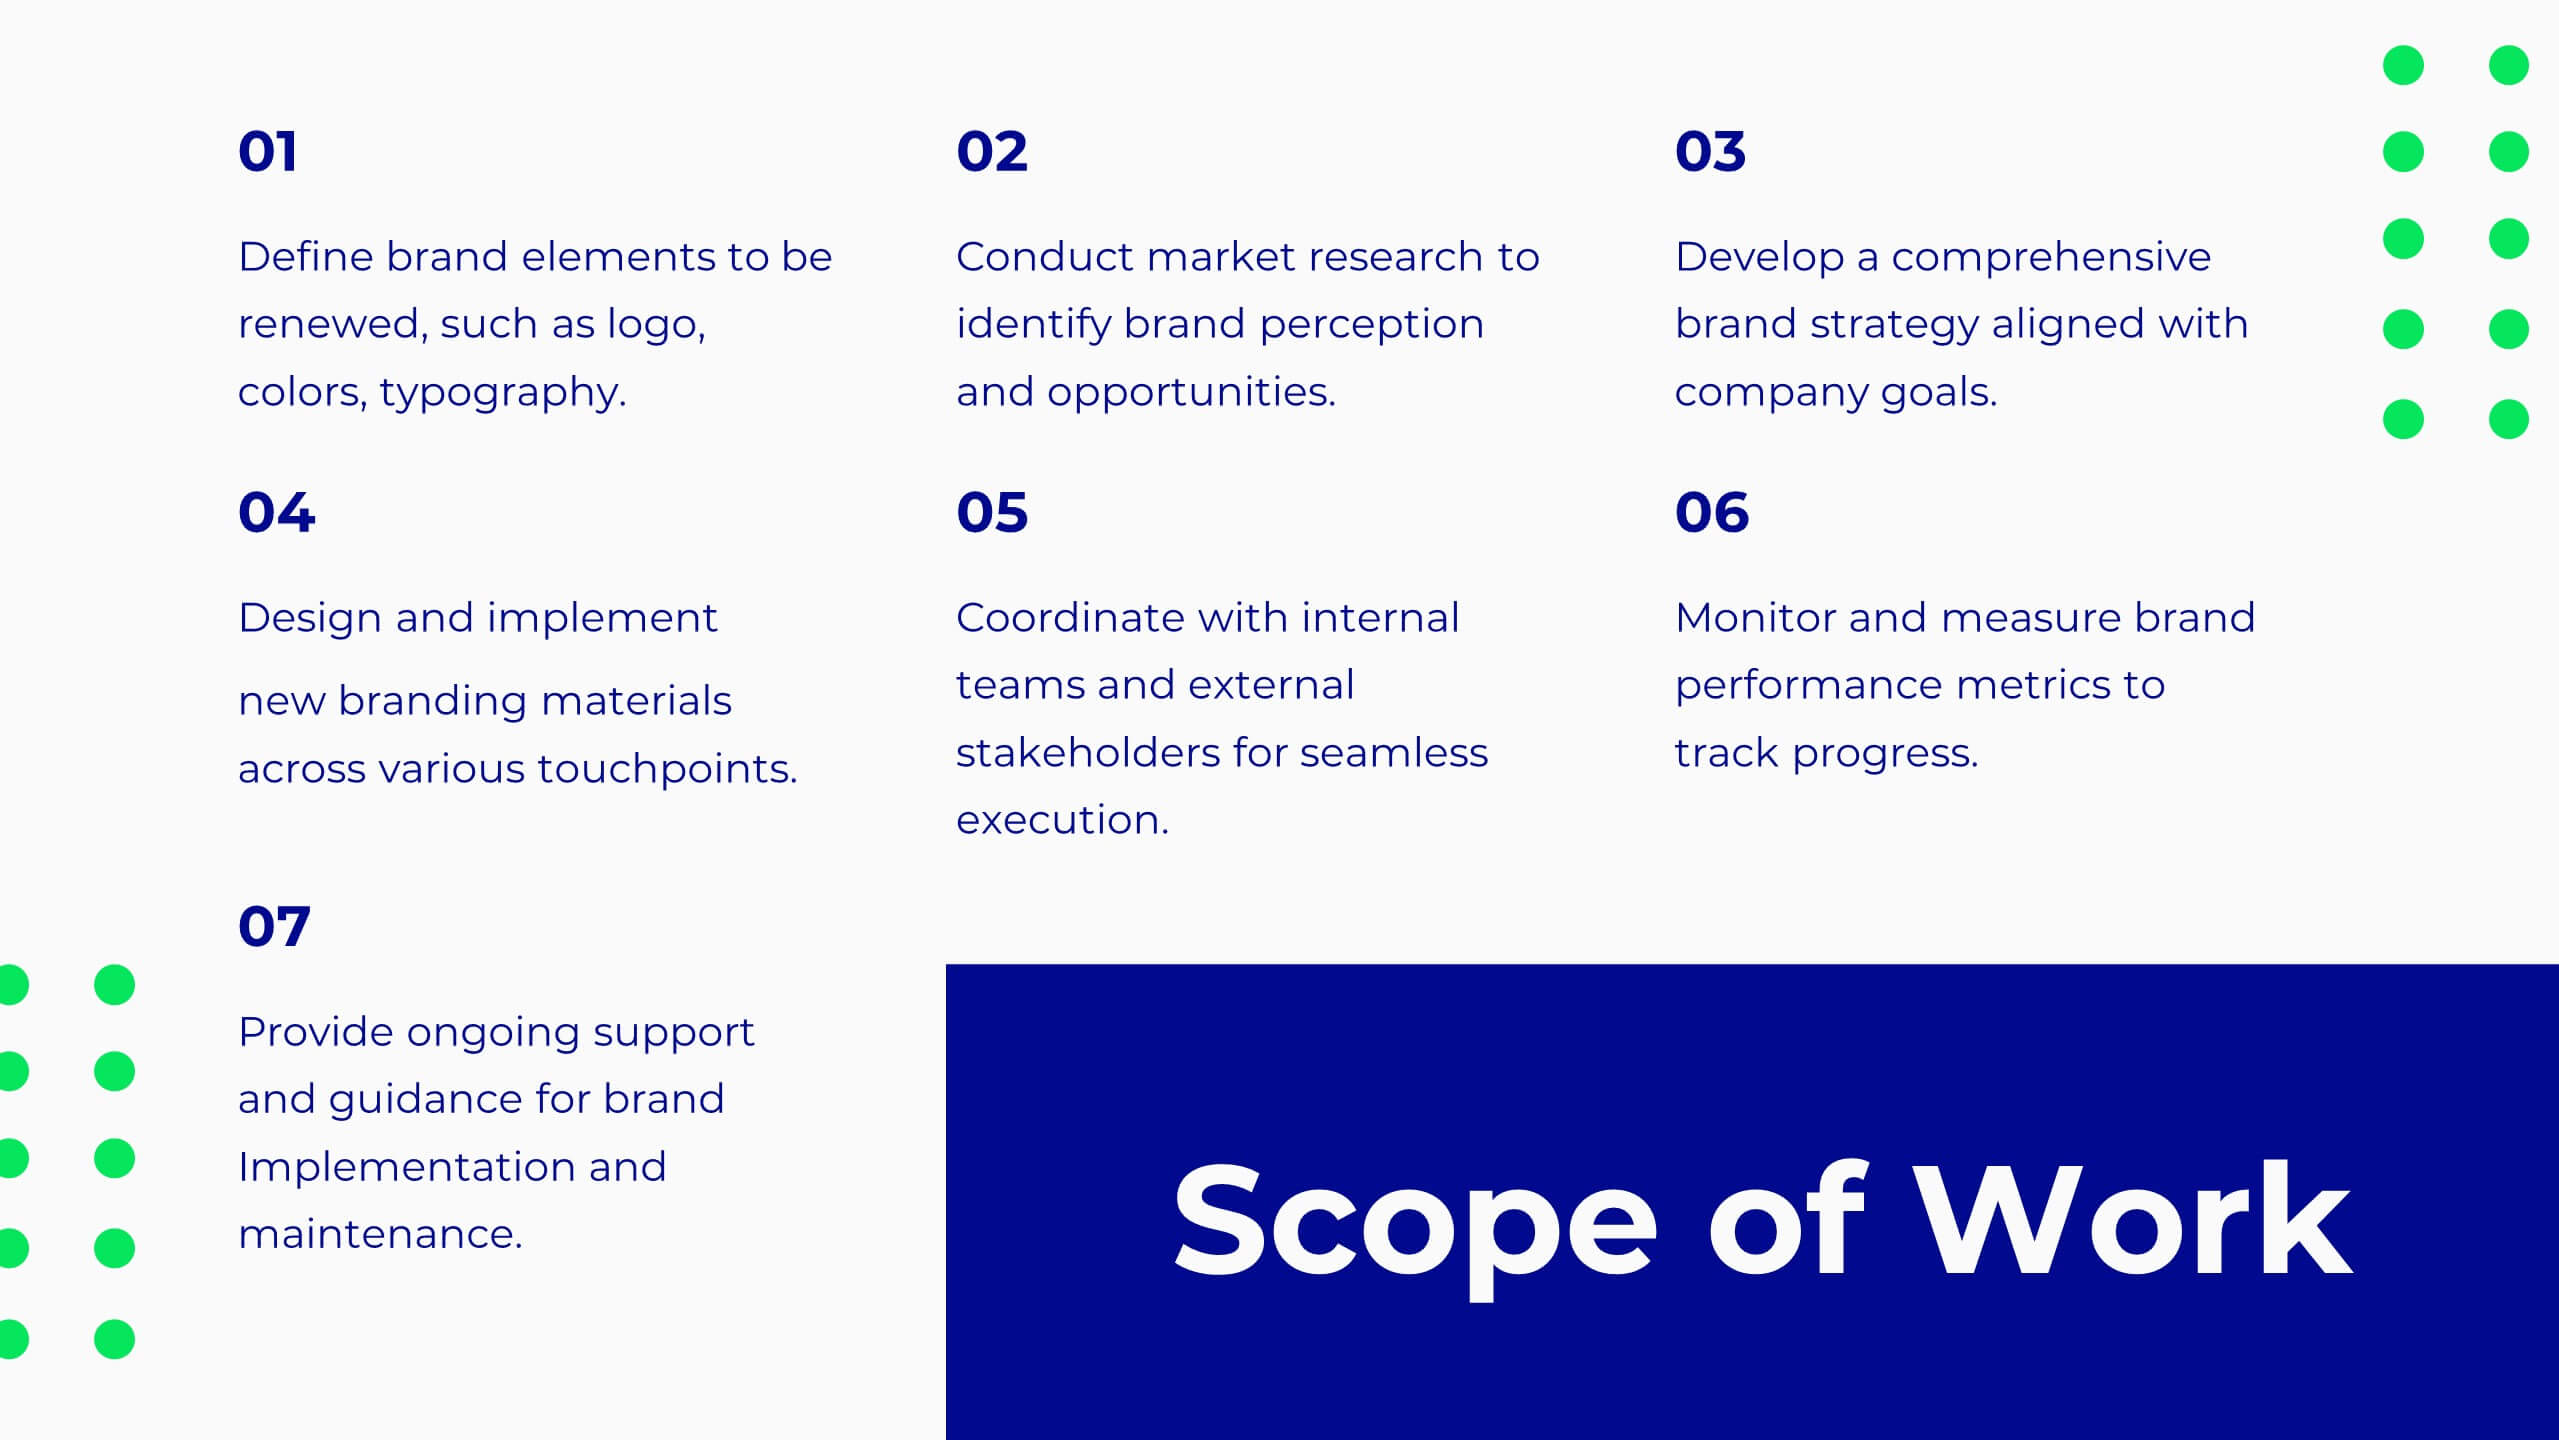
Project Scope Management Structure Presentation
Zoom in on every critical stage with the Project Scope Management Structure Presentation. This visual template uses magnifying glass graphics to represent five key project phases, helping you highlight detailed scope elements clearly. Fully editable in PowerPoint, Keynote, and Google Slides, it's perfect for structured planning and reporting presentations.


21 diapositivas
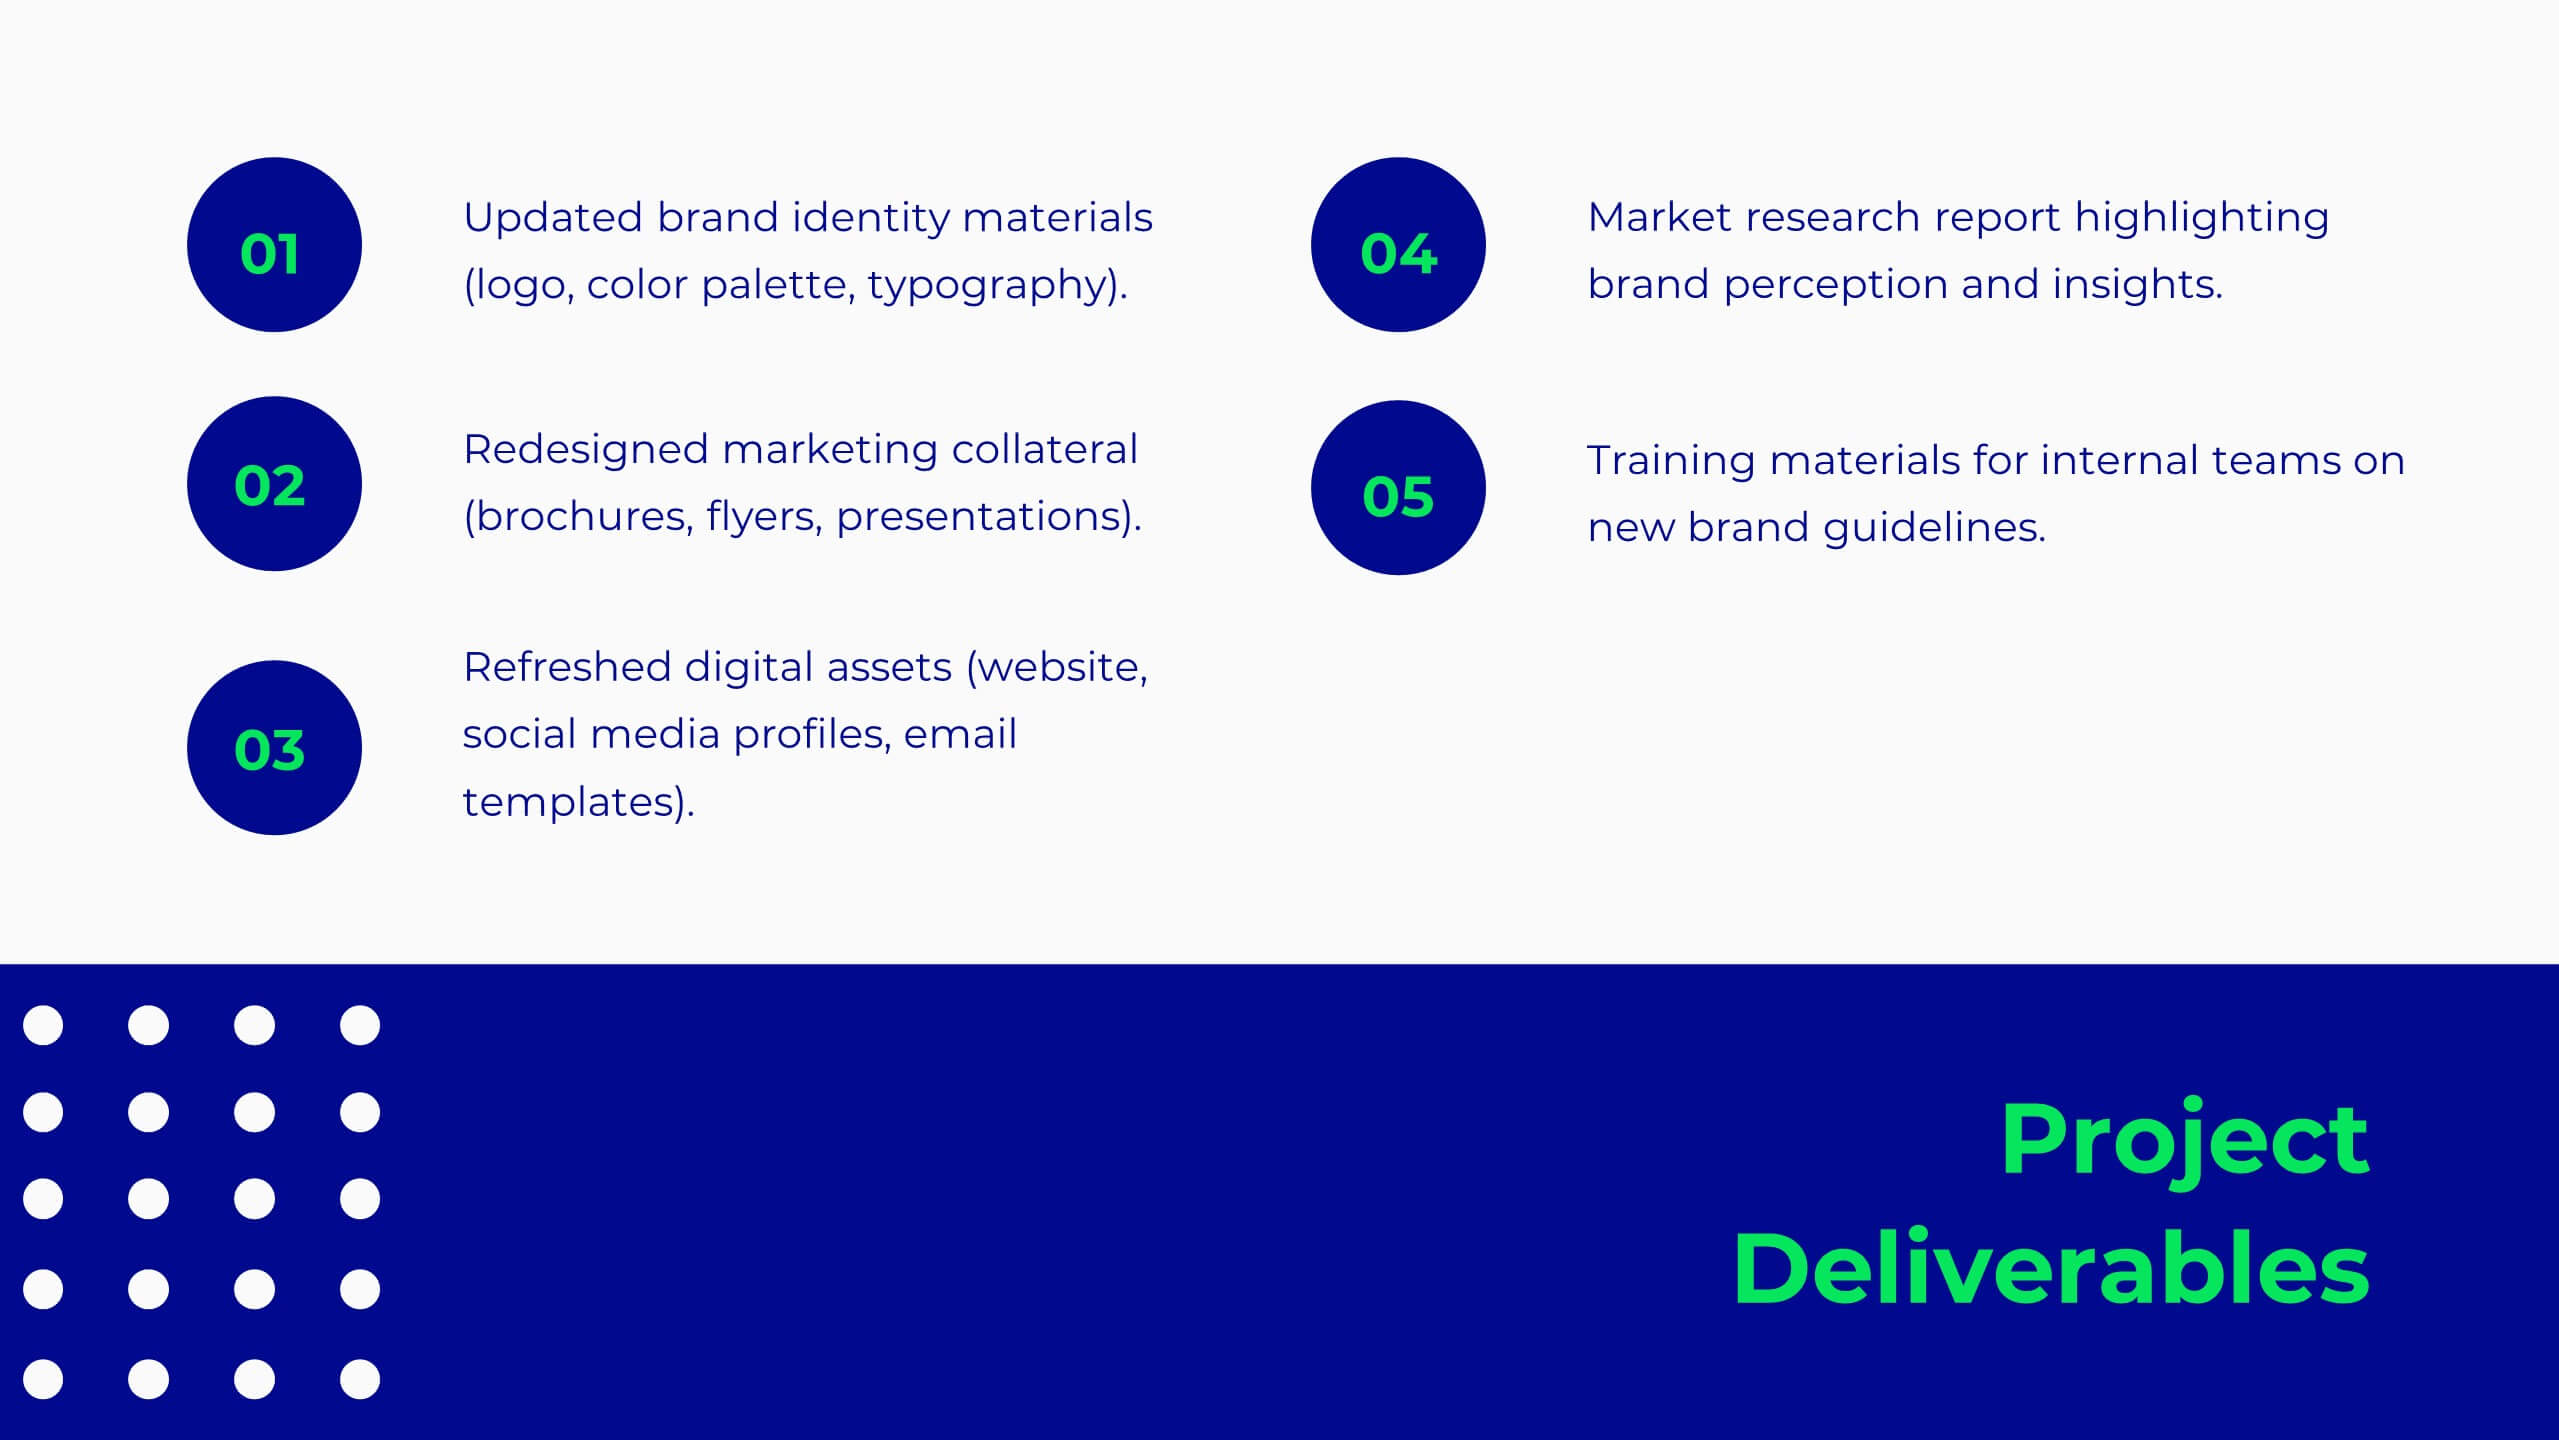
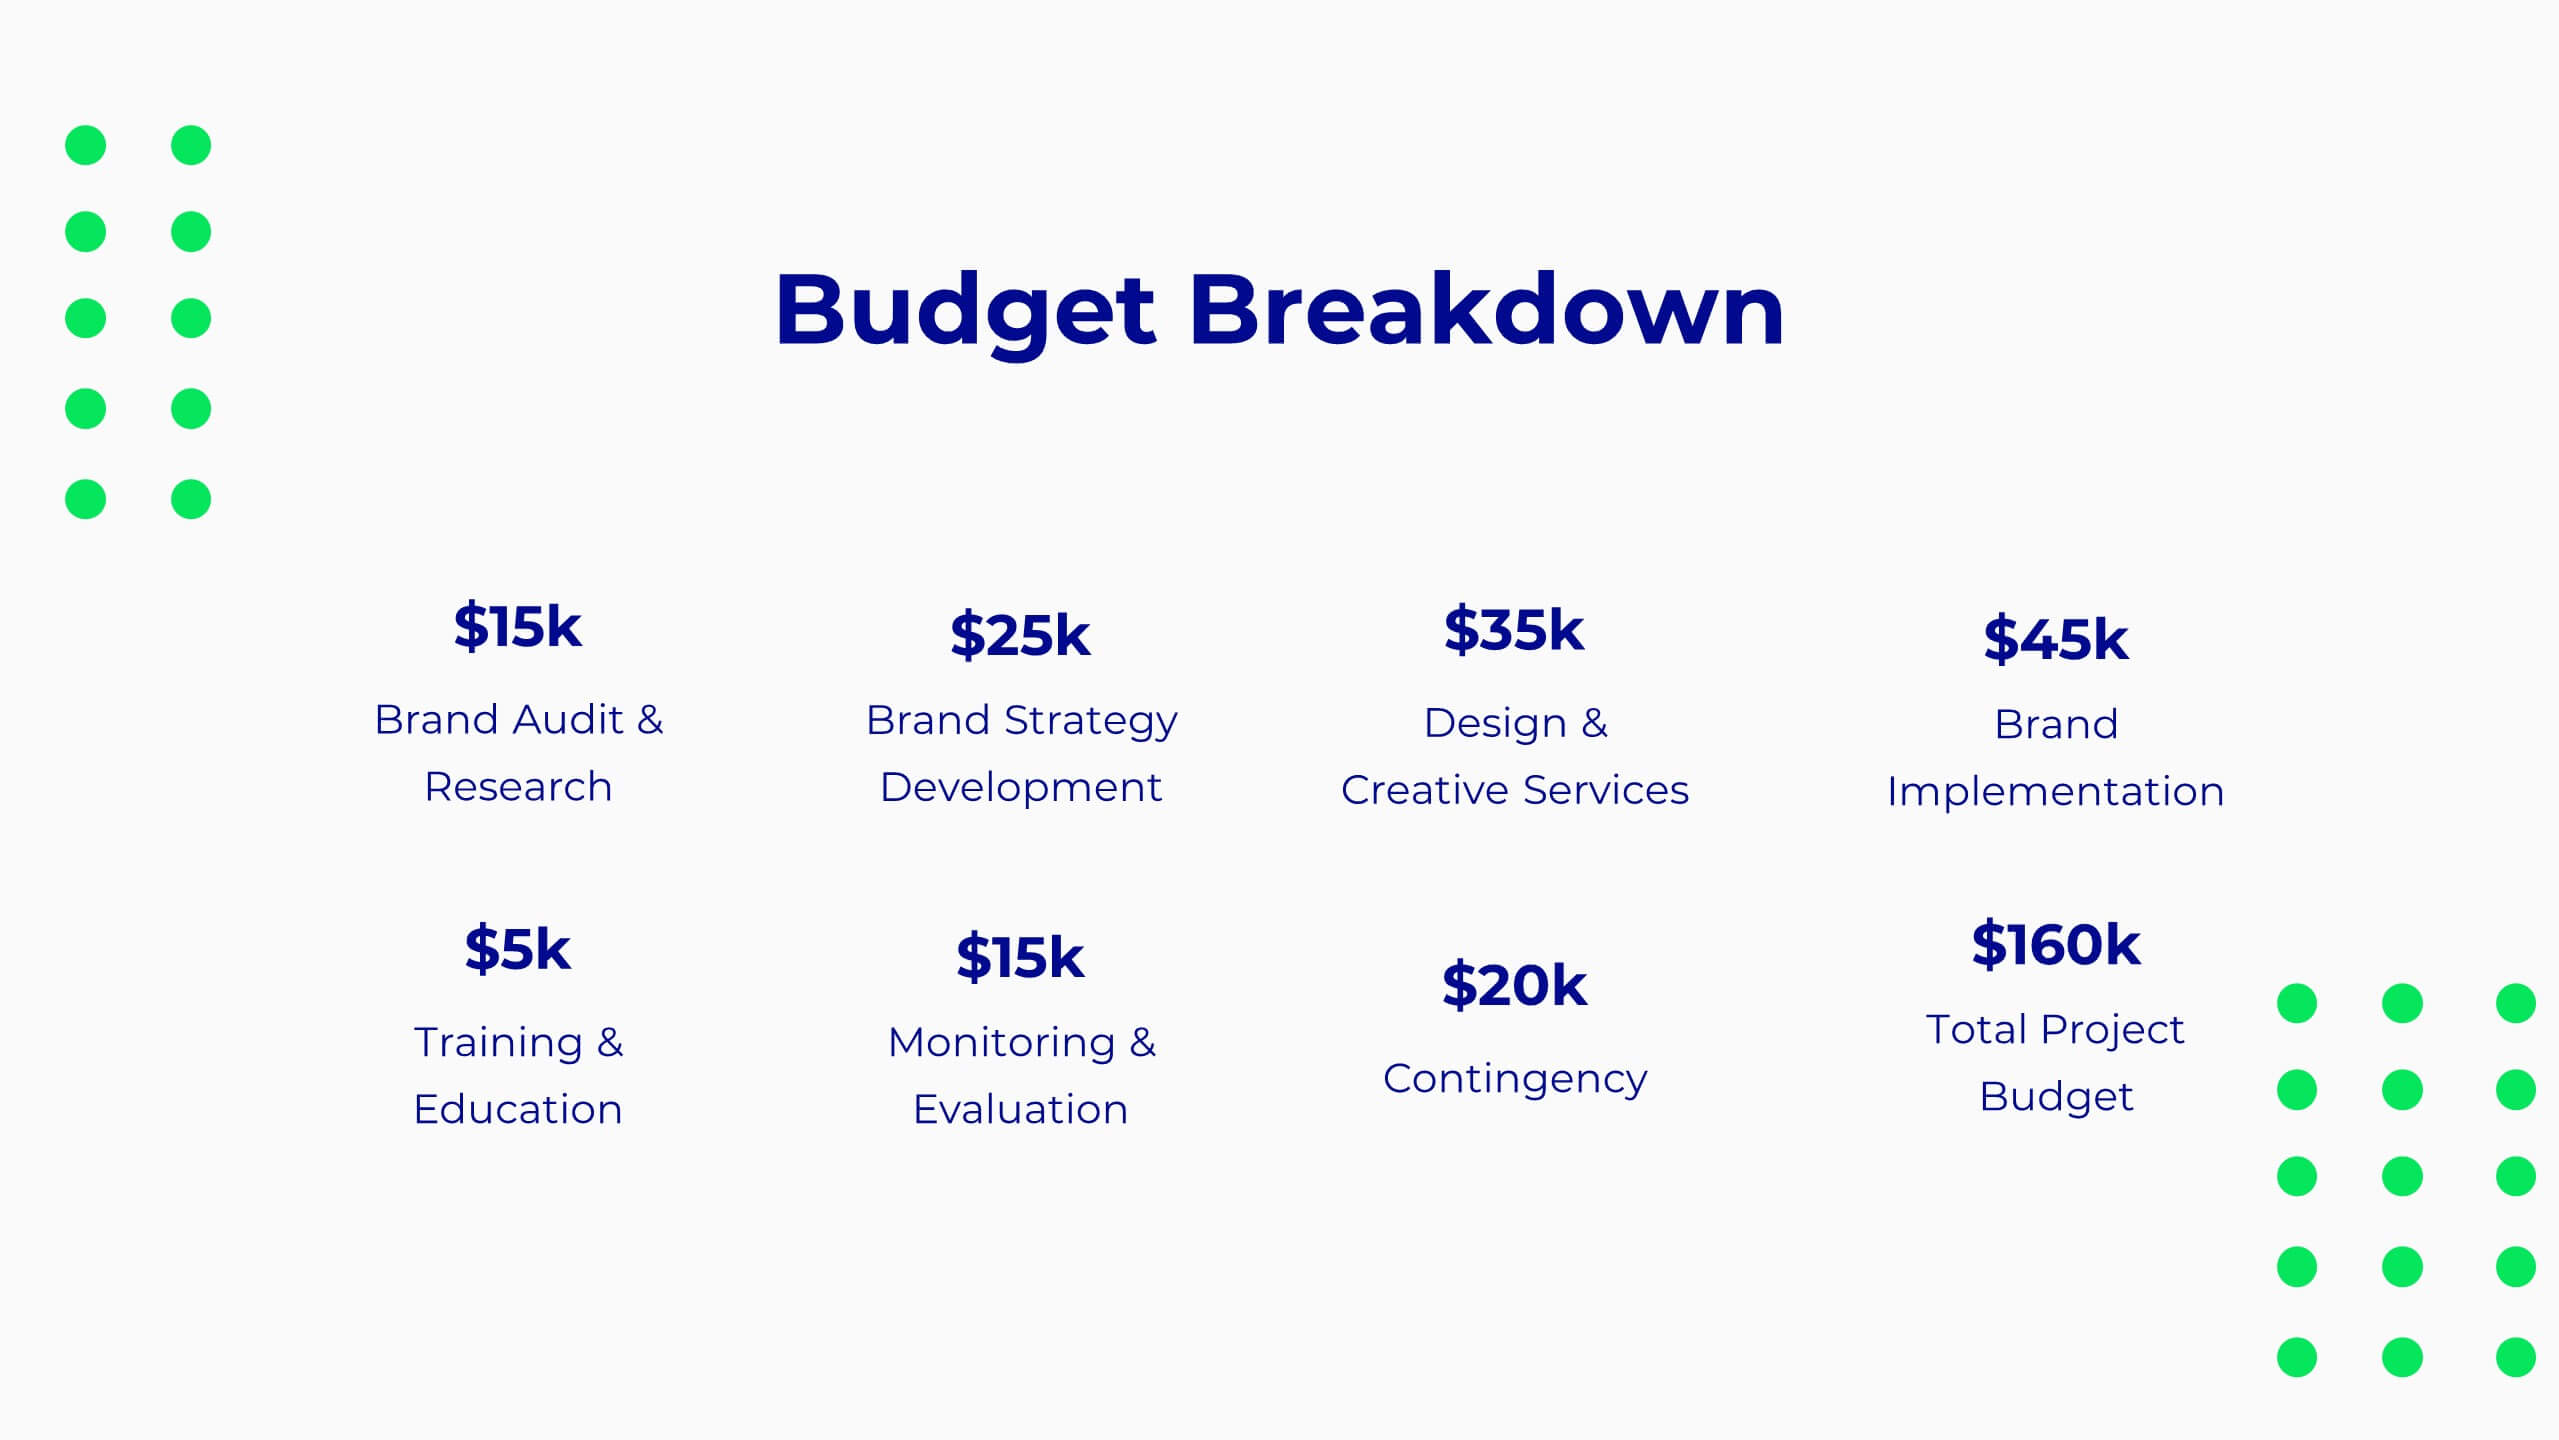
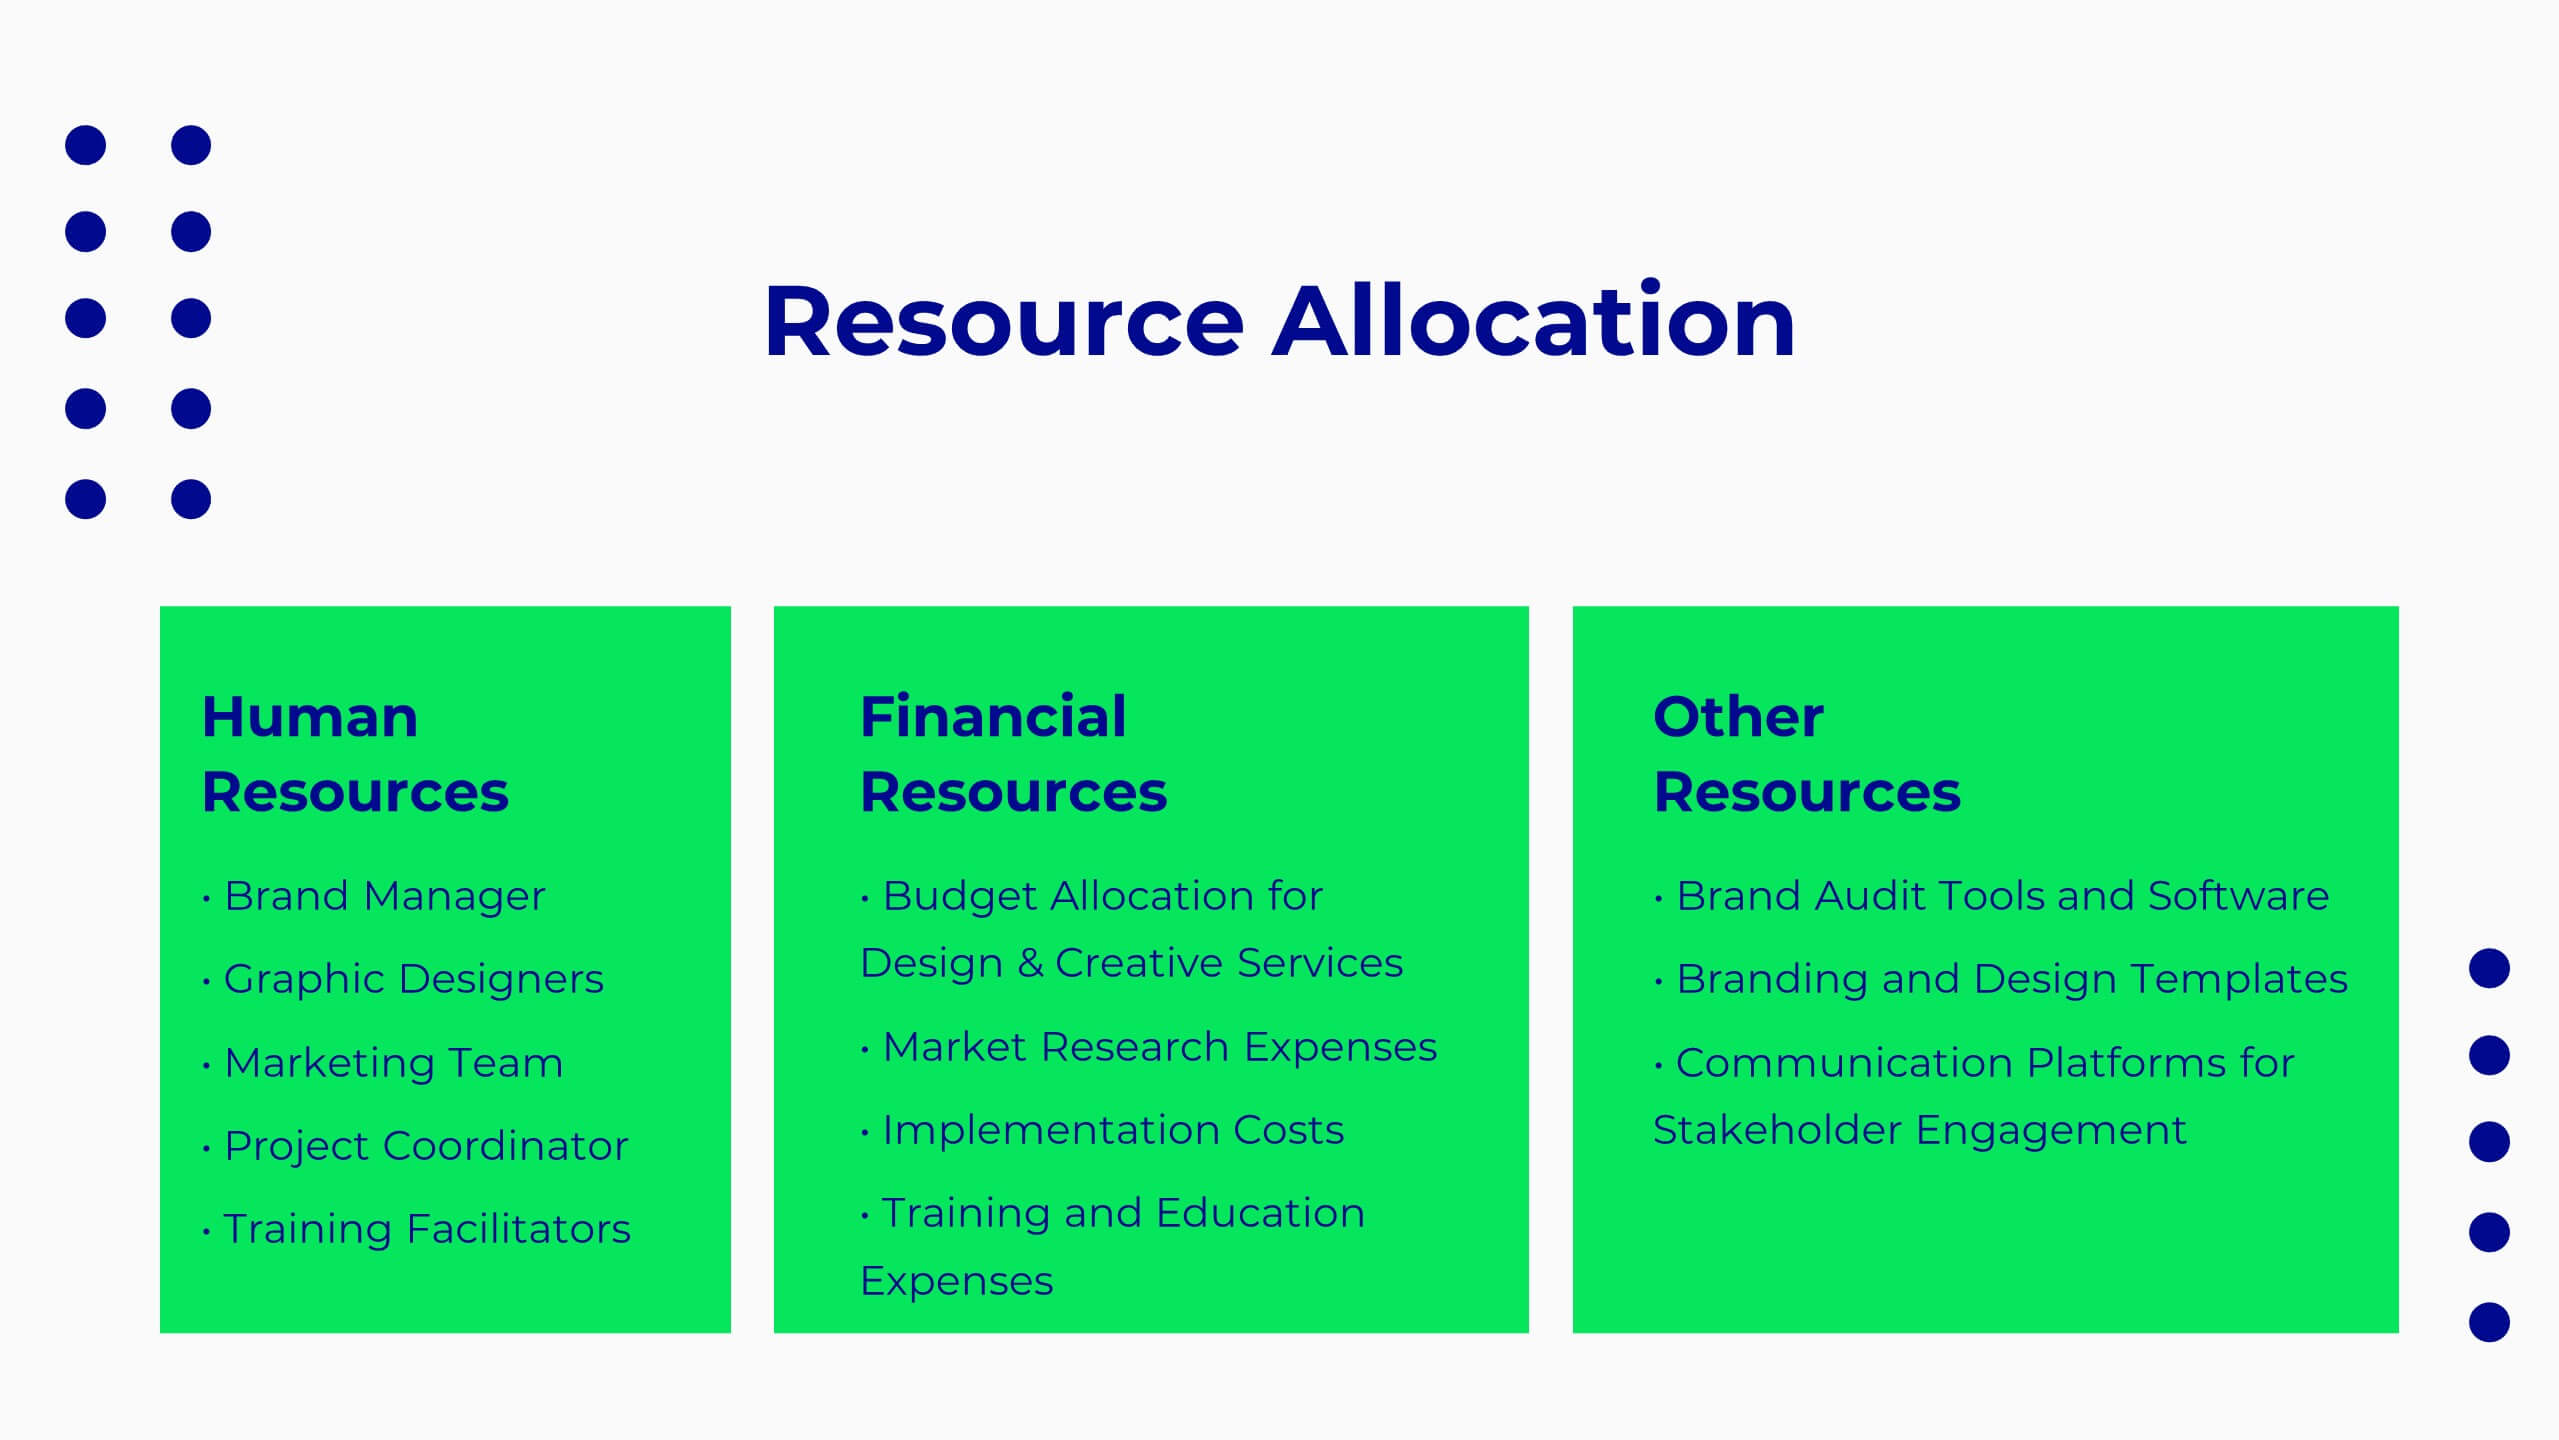
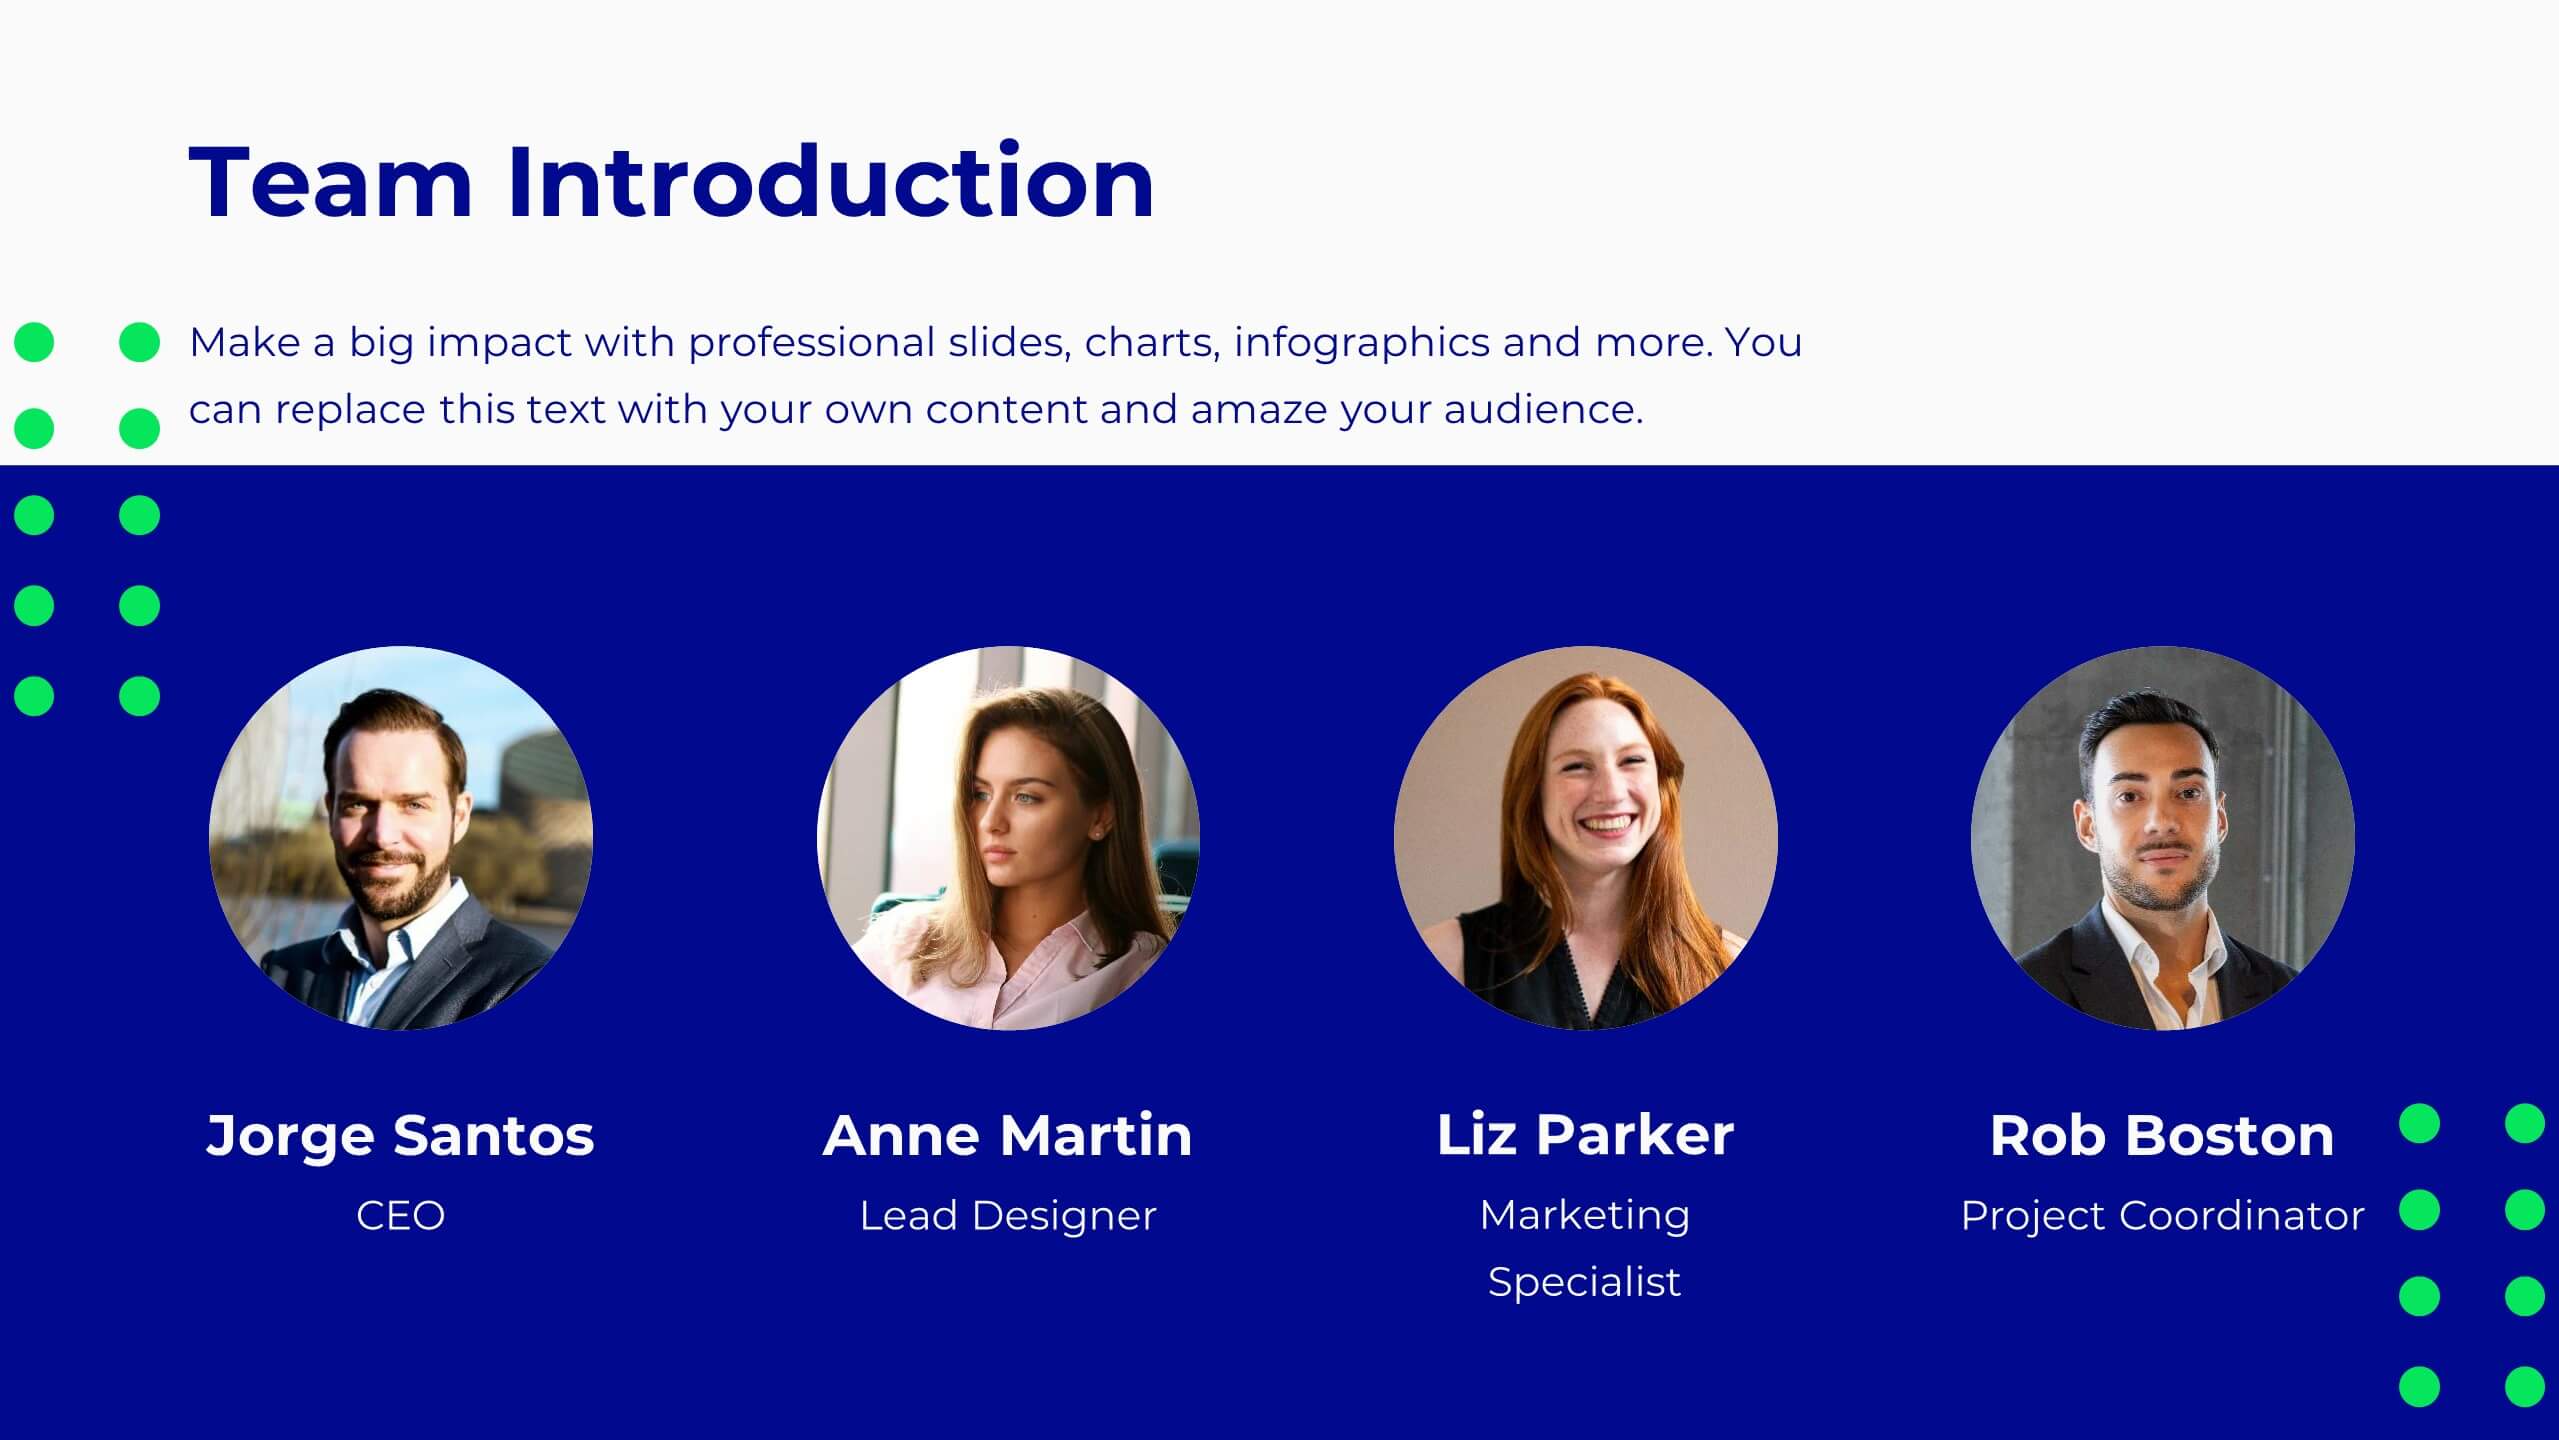
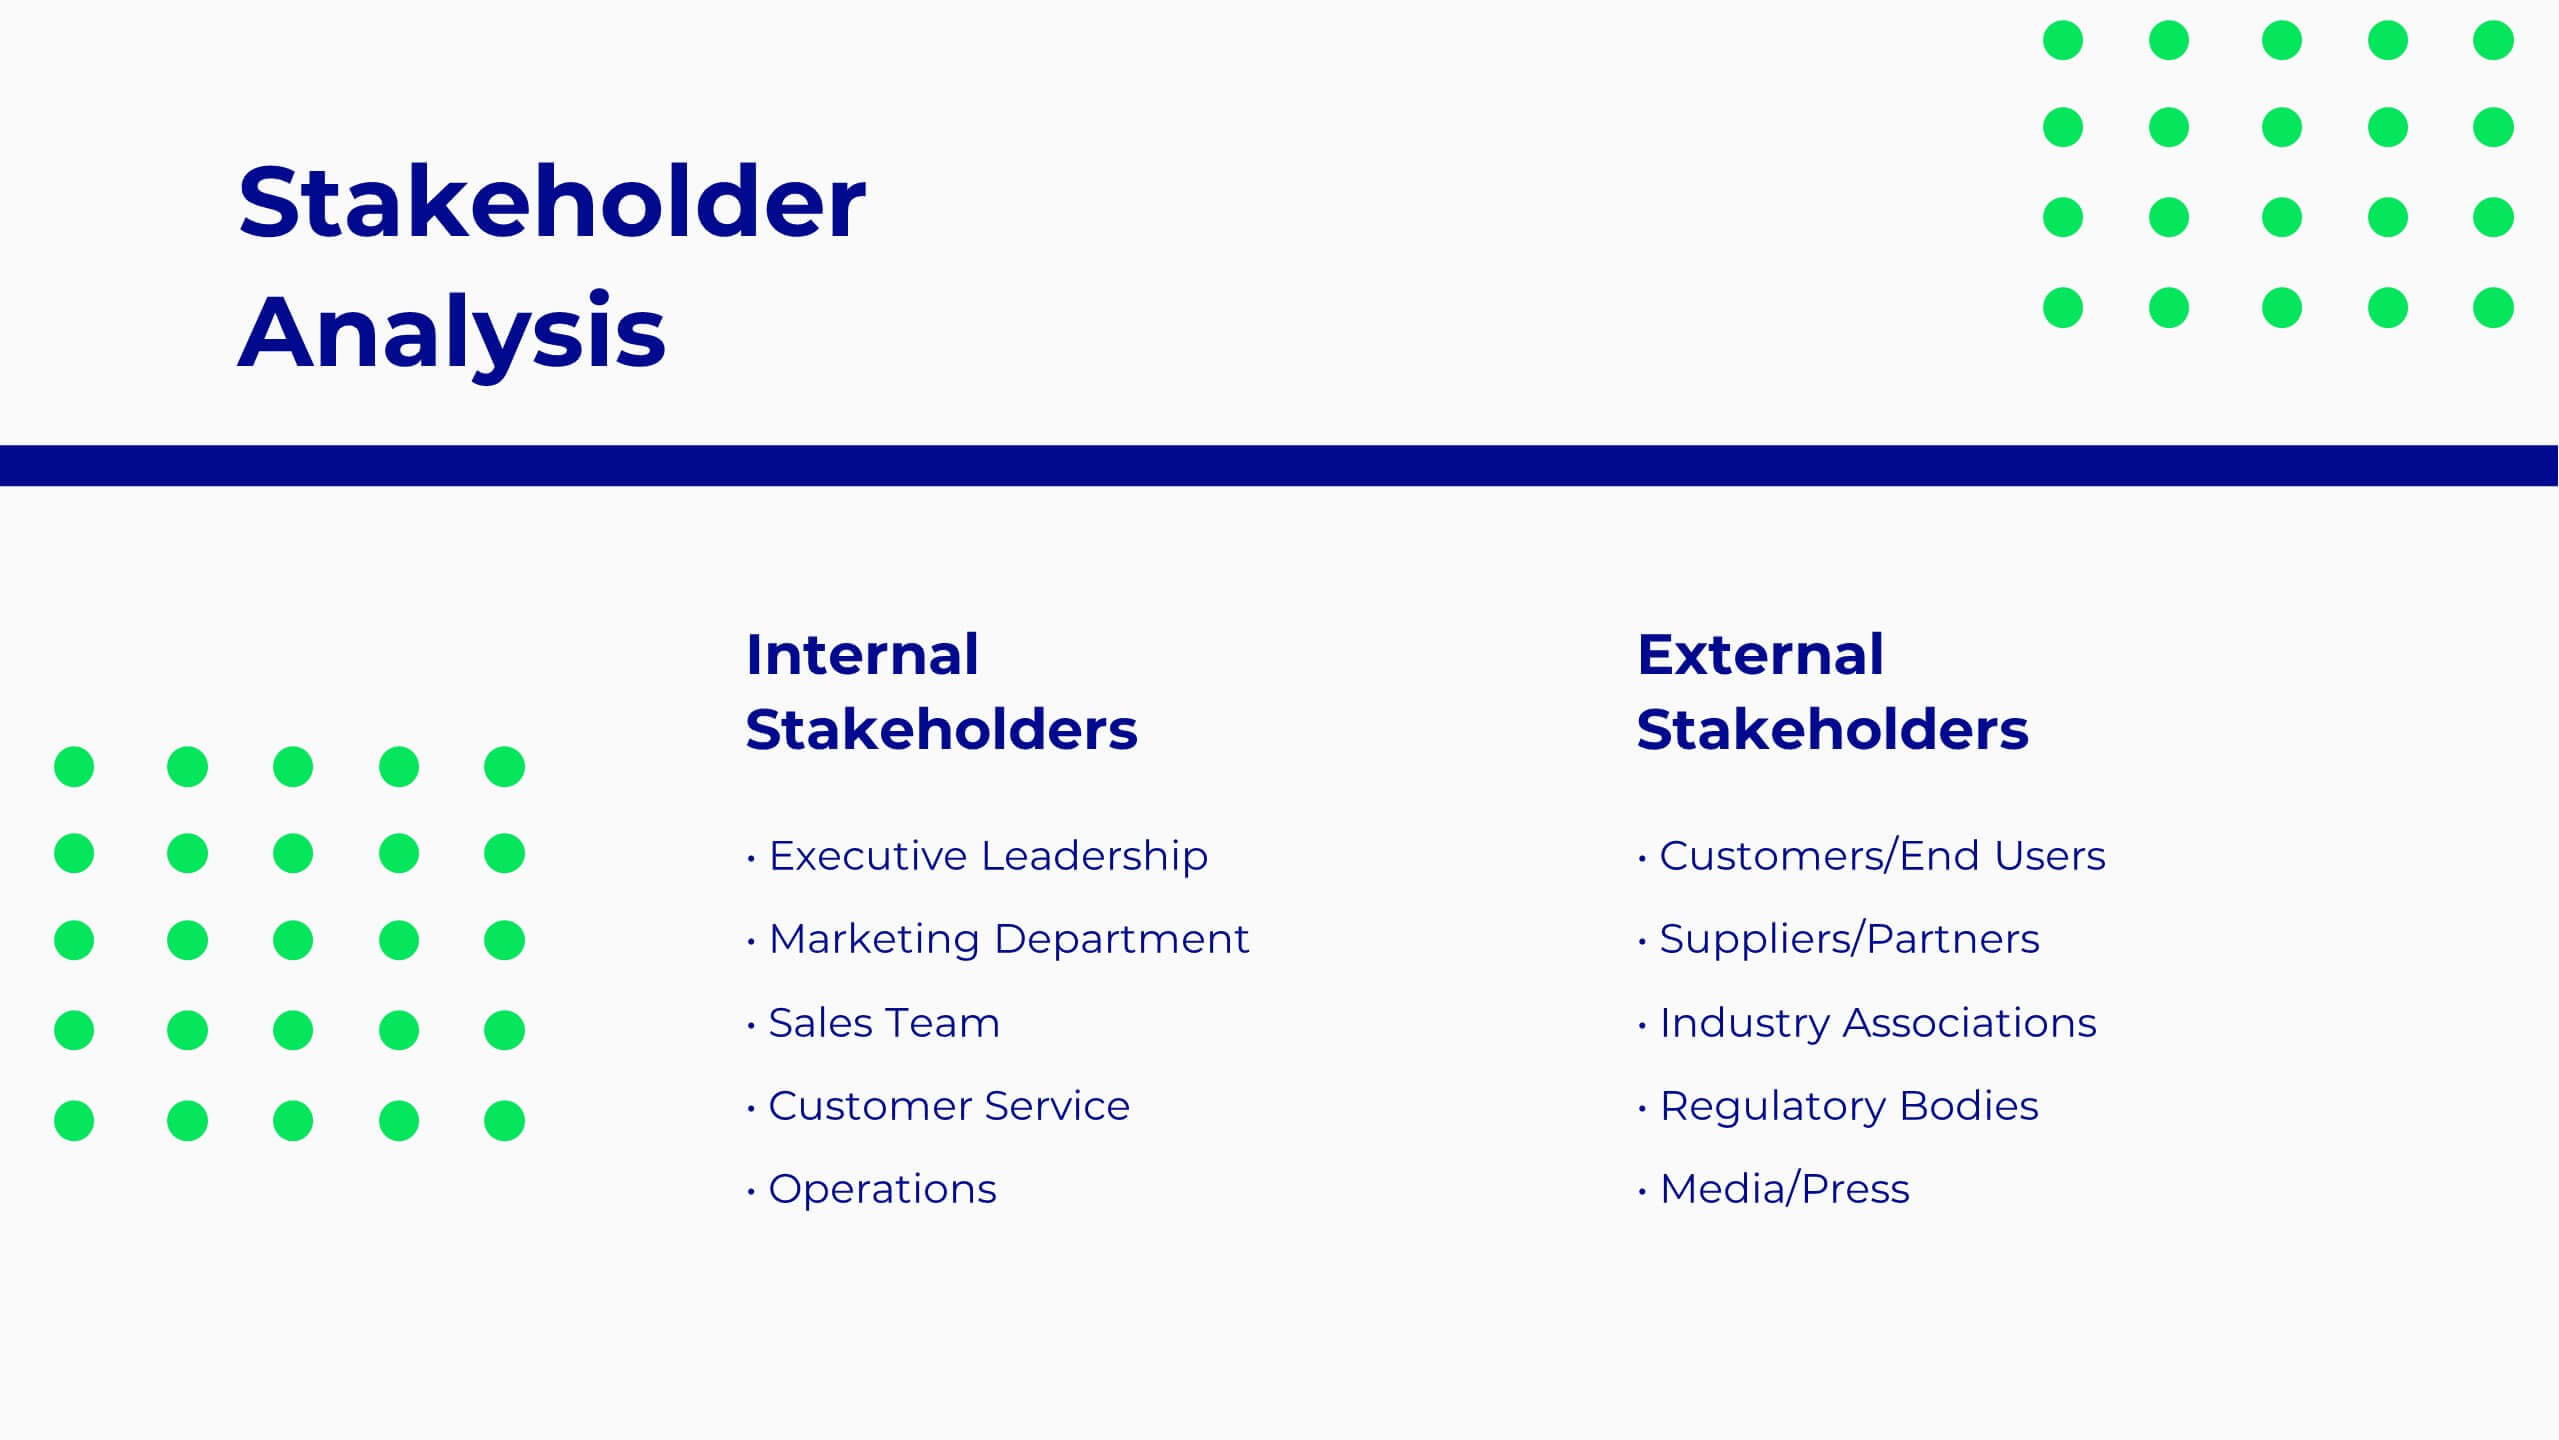
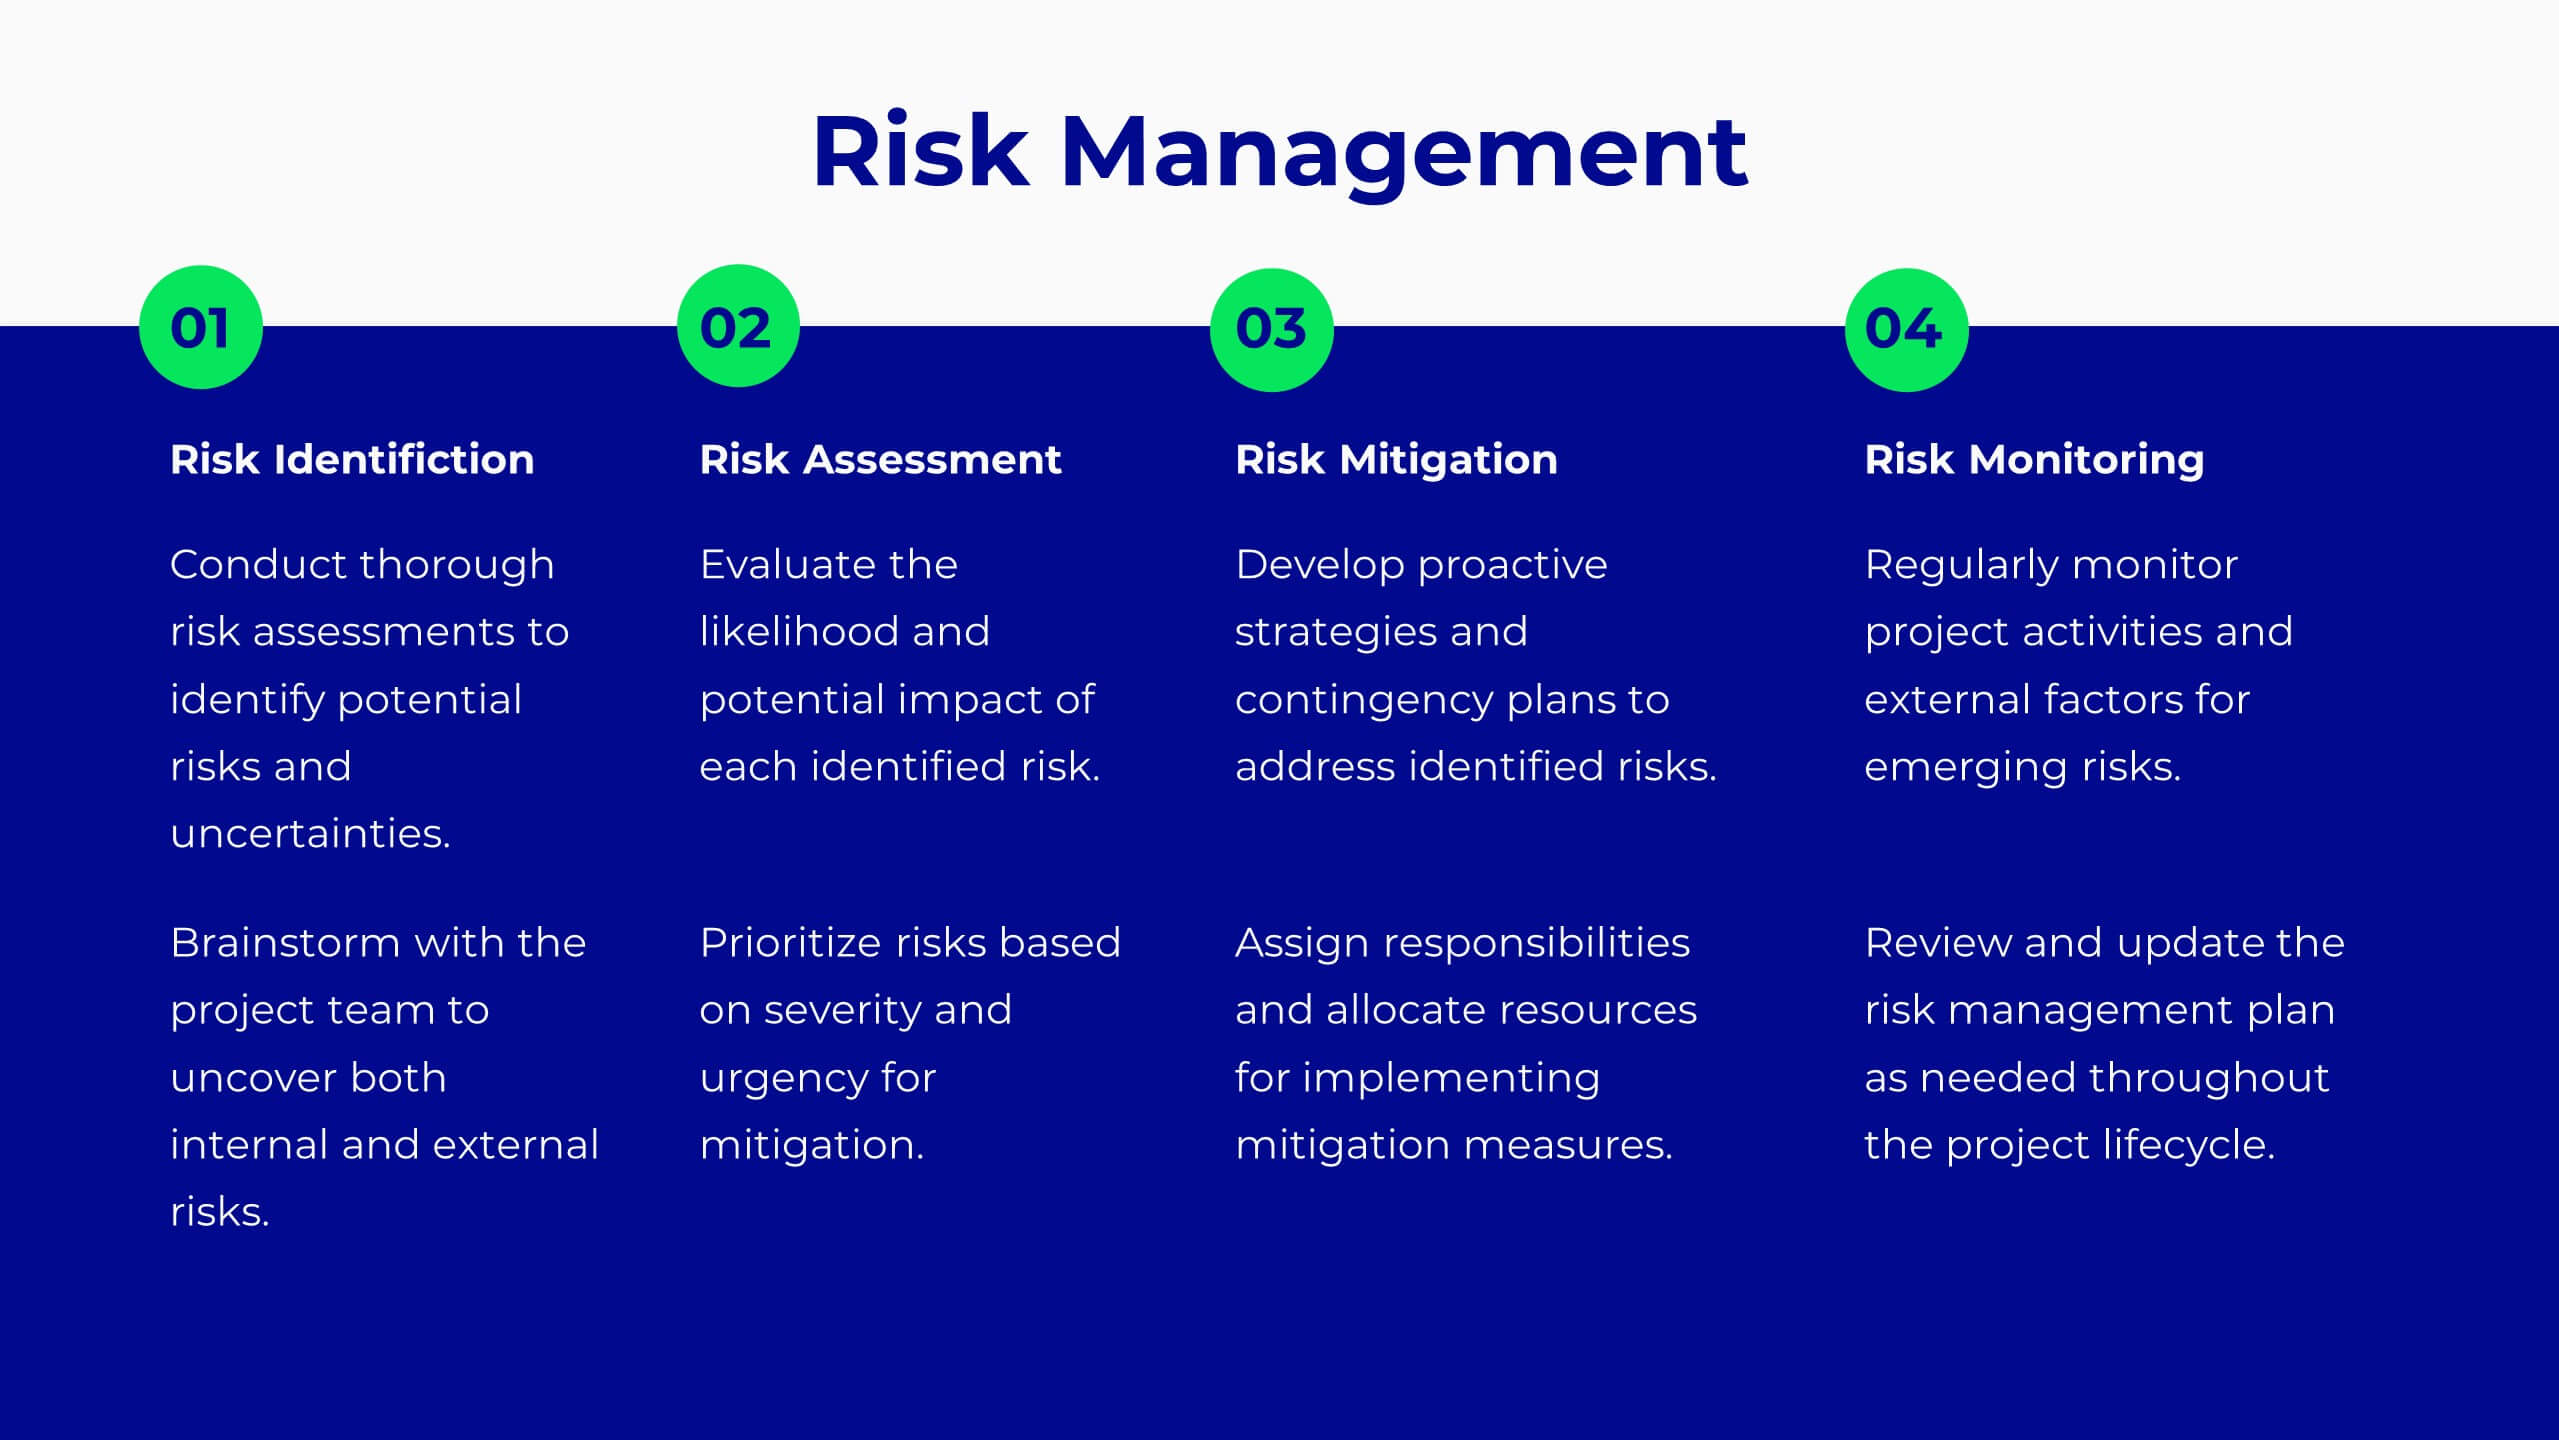
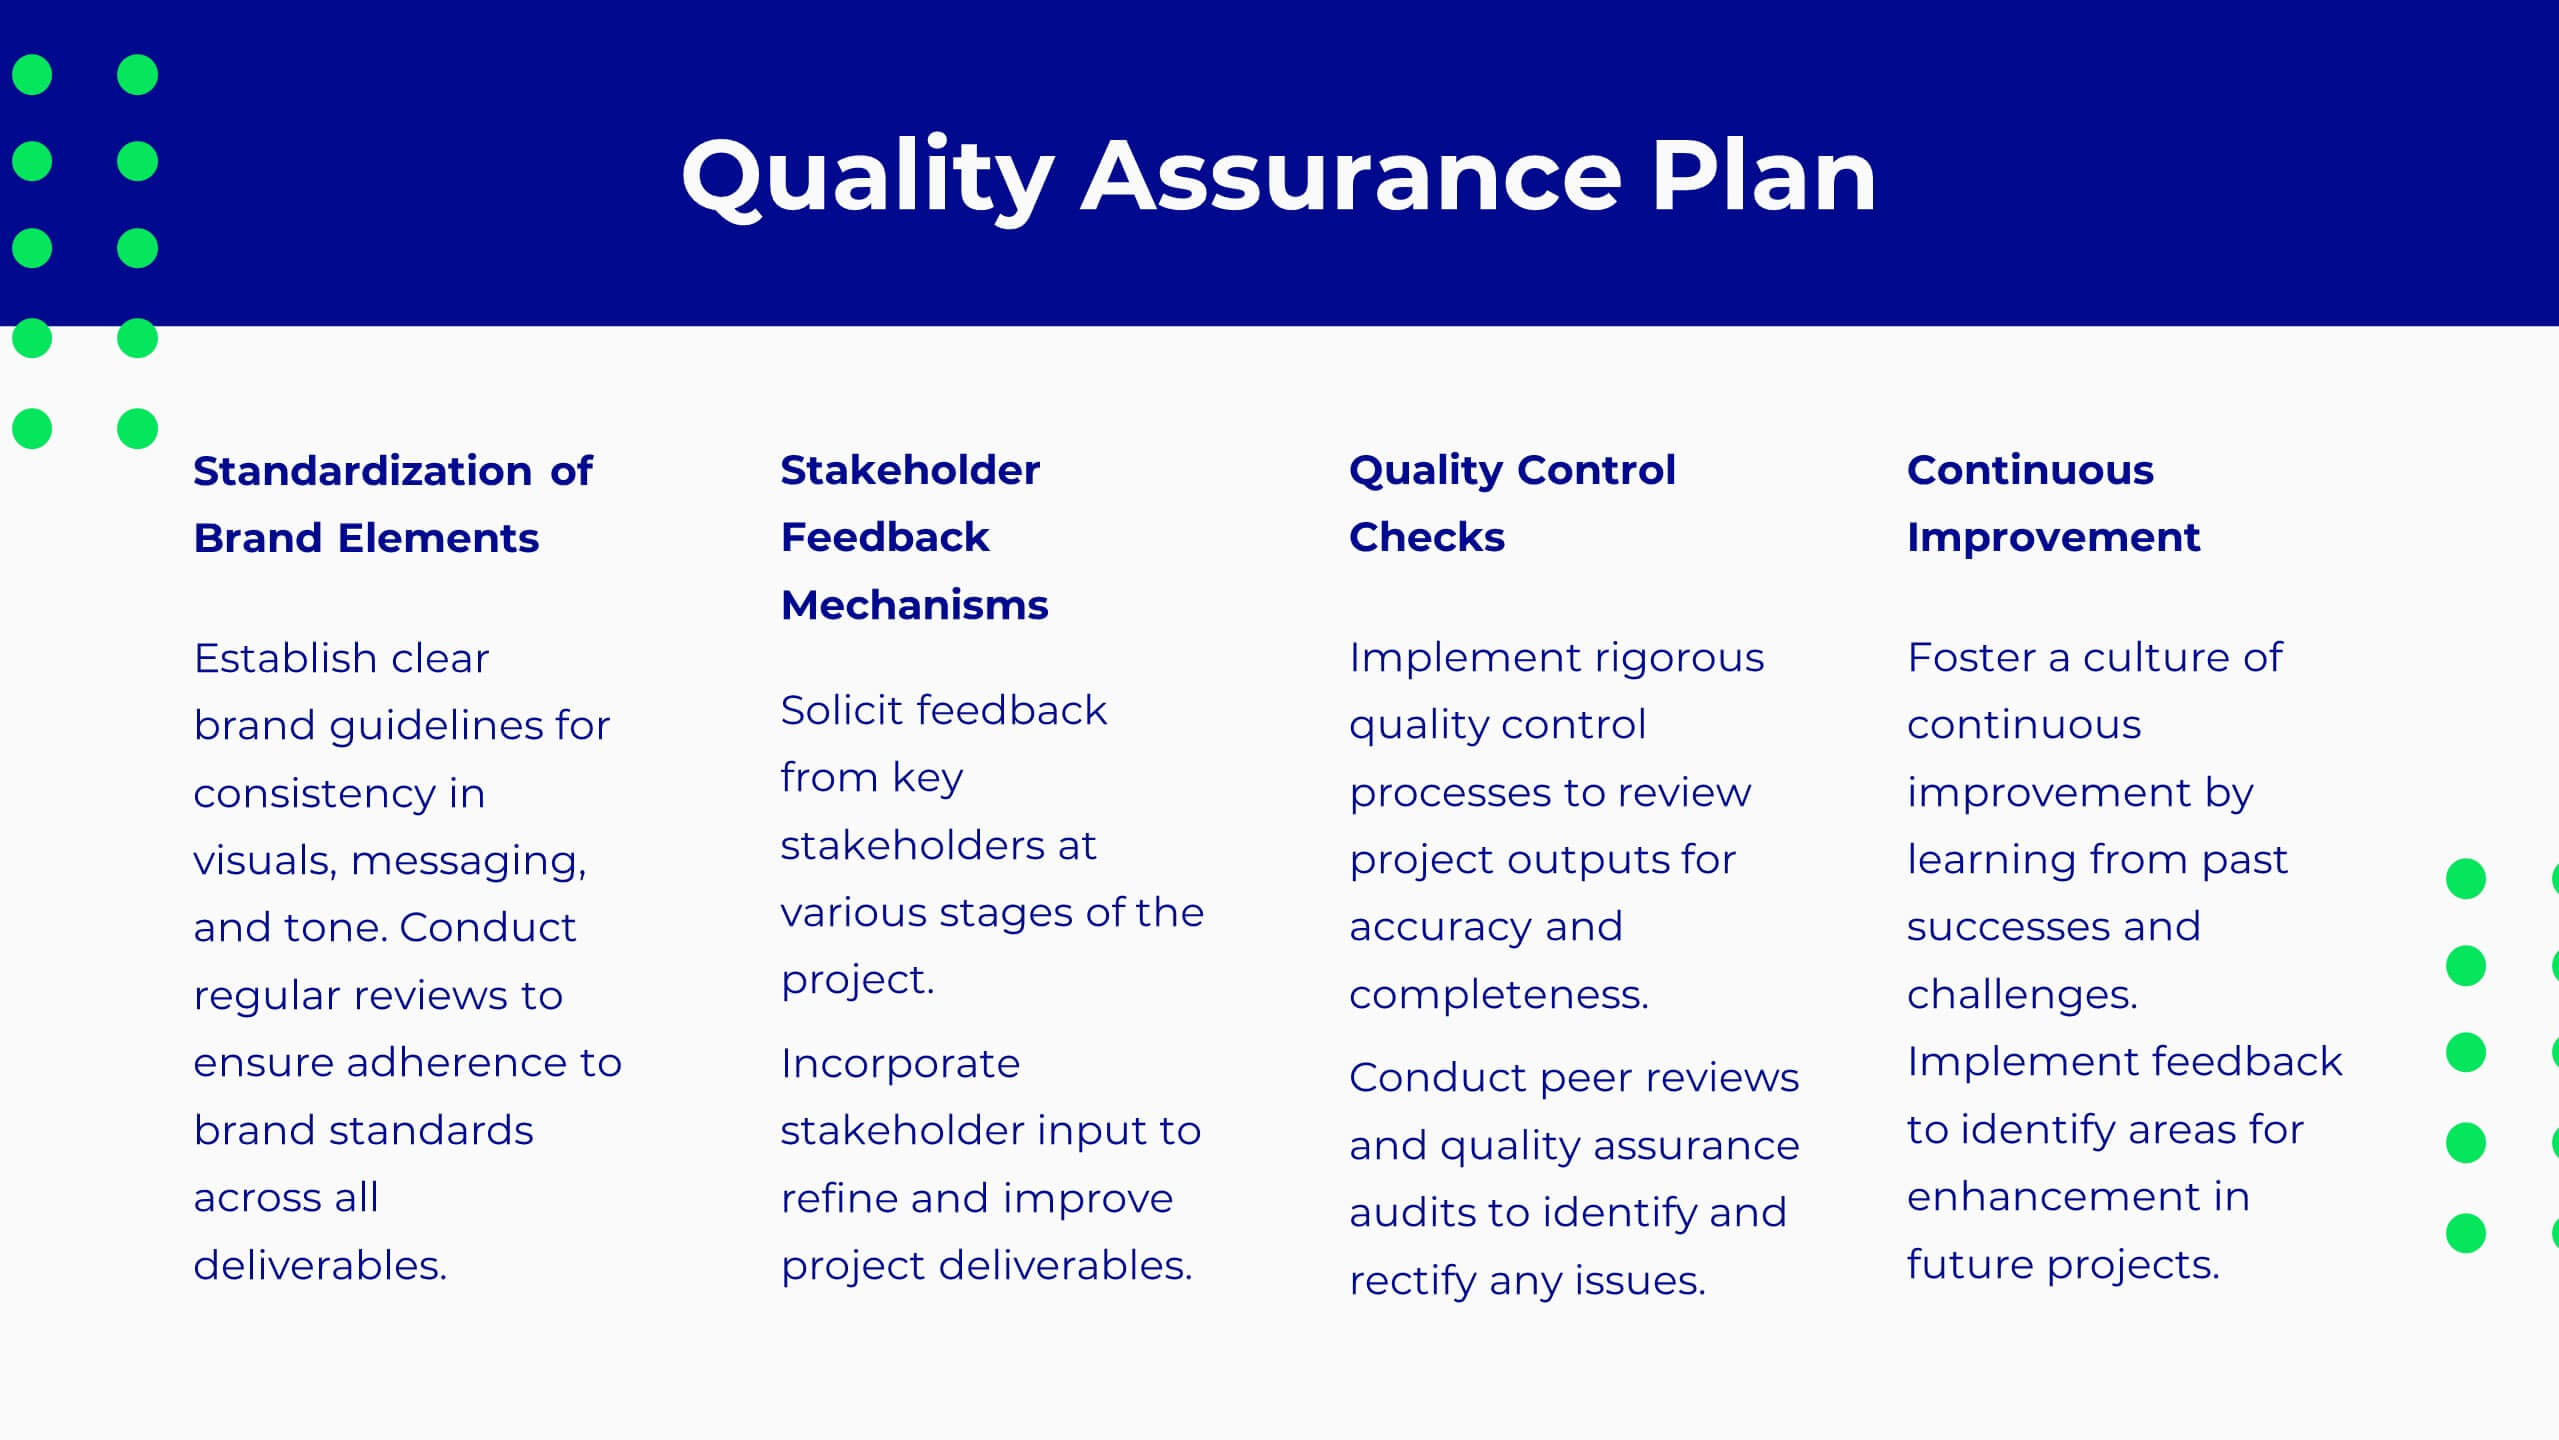
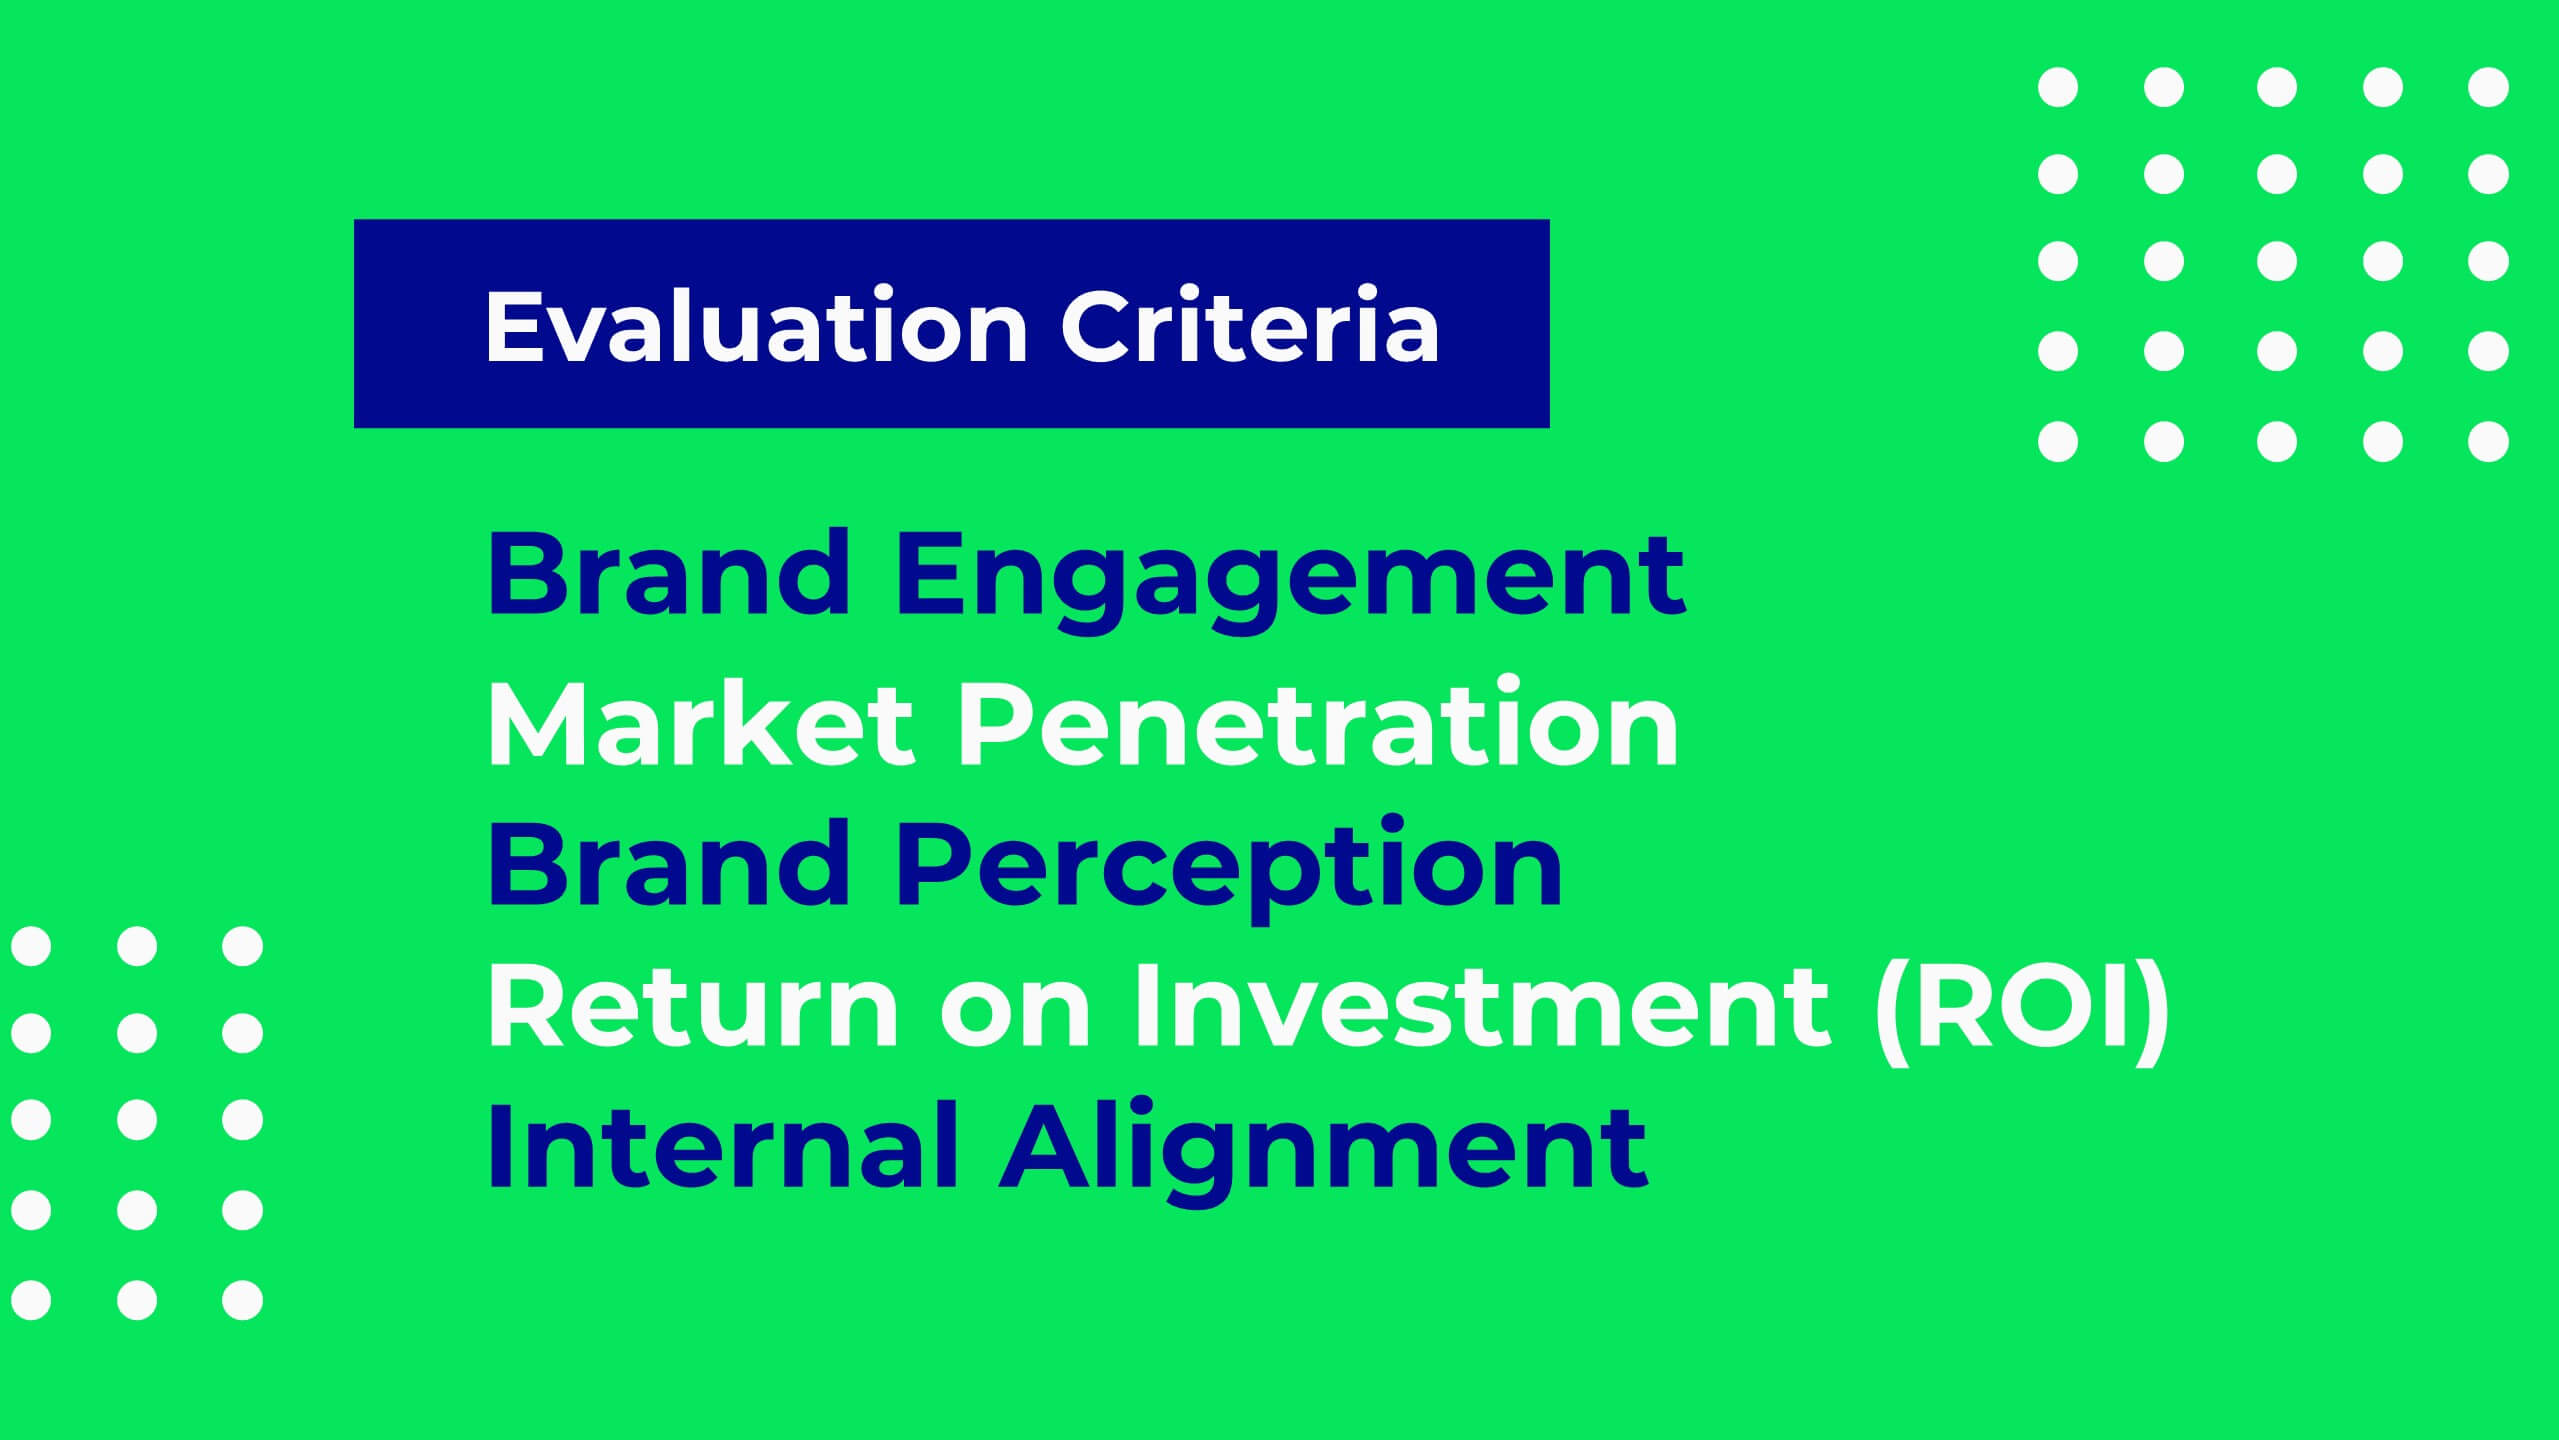
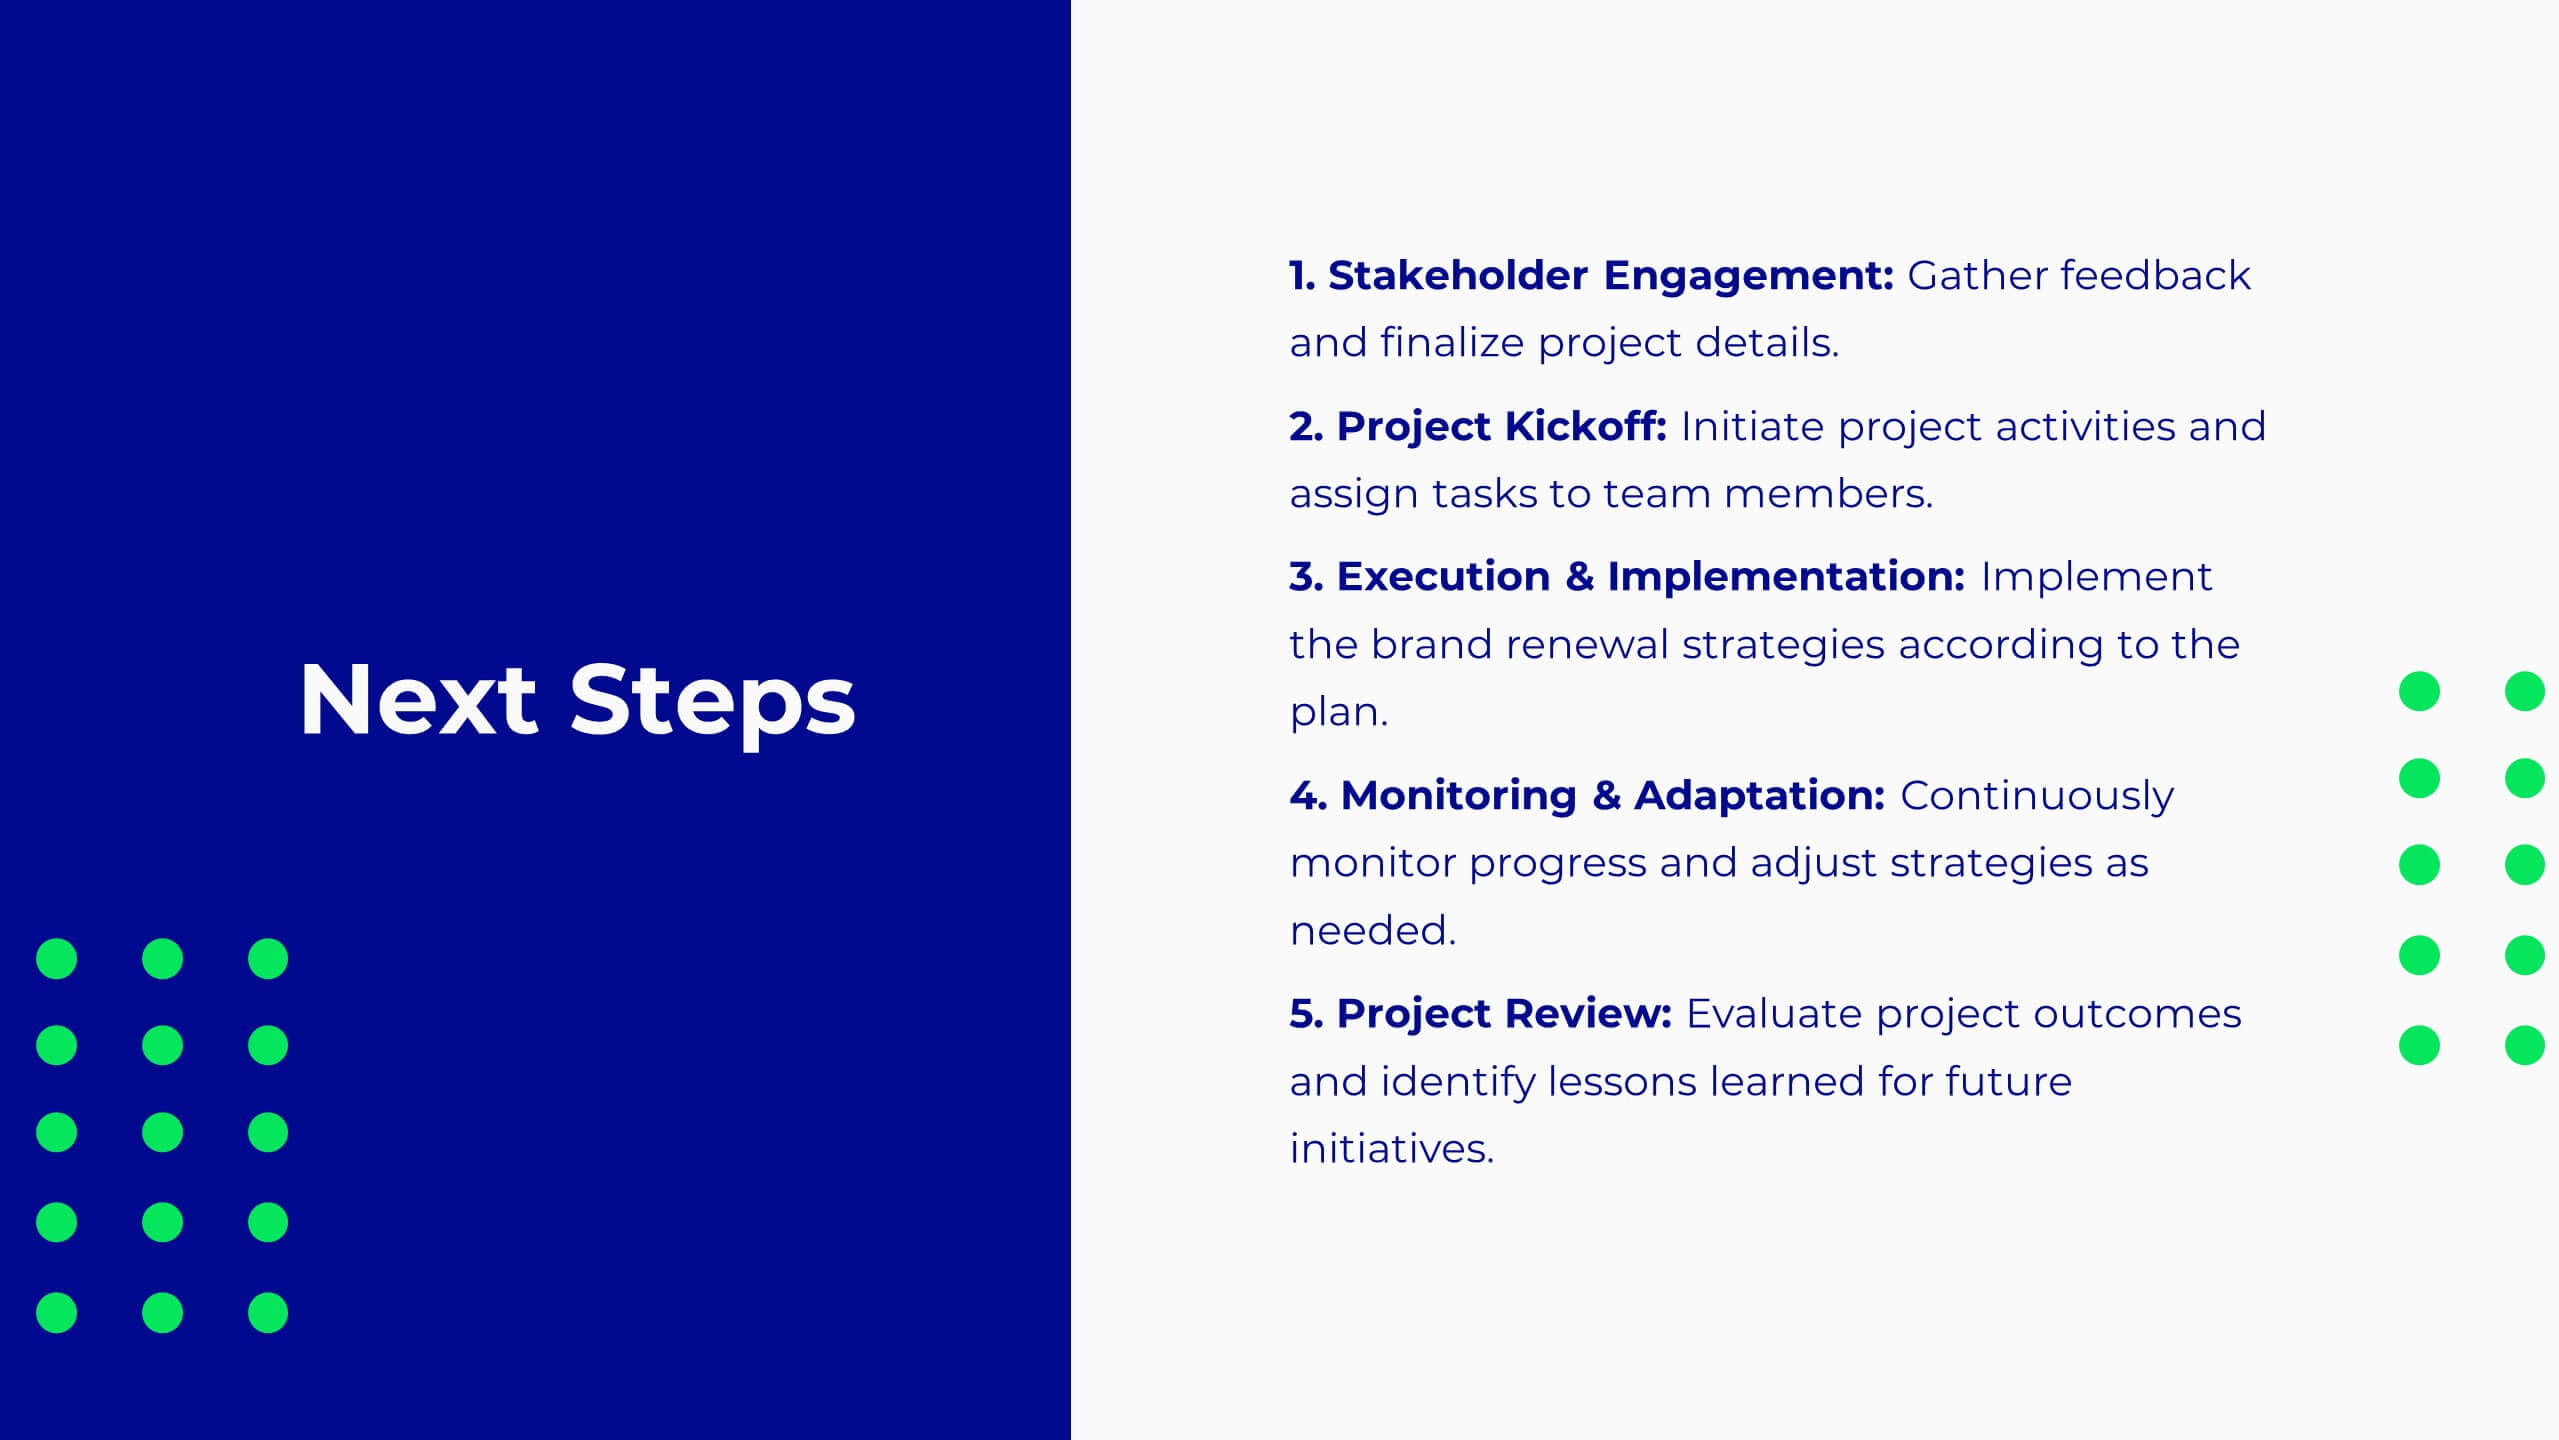
Pulse Project Milestones Report Presentation
Present project milestones effectively with this sleek, professional template. Cover project overview, timeline, and budget. Perfect for defining objectives, scope of work, and resource allocation. Highlight team introductions and stakeholder analysis. Ensure quality with risk management and assurance plans. Compatible with PowerPoint, Keynote, and Google Slides. Elevate your presentations today!


12 diapositivas
Customer Satisfaction Smile Rating Presentation
Measure customer happiness with this engaging customer satisfaction smile rating template! Featuring a visual scale from dissatisfaction to delight, this design helps businesses track feedback and identify improvement areas. Ideal for reports, surveys, and performance reviews. Fully customizable and compatible with PowerPoint, Keynote, and Google Slides.


6 diapositivas
Professional Title Infographic
This collection of professional presentation templates is meticulously designed to meet a variety of business needs, blending visual appeal with practical functionality. The templates are versatile, allowing professionals to effectively communicate complex data, strategic insights, and operational updates. One template is perfect for detailed data visualization, helping to highlight trends and insights that are crucial for data-driven decision-making. Another template focuses on team introductions, ideal for building a connection between your team and the audience, whether in stakeholder meetings or internal briefings. For marketing strategies, there's a template designed to outline customer demographics and behaviors, which is essential for tailoring marketing campaigns and product development. The collection also includes templates for financial reporting and pricing strategies, ensuring that financial data is communicated clearly and efficiently. Additionally, a strategic analysis template aids in outlining key business strengths, weaknesses, opportunities, and threats, supporting strategic planning and risk management. Overall, these templates are a valuable tool for any professional looking to present information clearly and compellingly in various business contexts.


6 diapositivas
Product Pricing Table Comparison
Make your pricing pitch clear and compelling with this vibrant comparison table template designed for easy decision-making. Whether you're showcasing subscription plans, service tiers, or product bundles, this slide helps highlight key features and value differences at a glance. Fully editable in PowerPoint, Keynote, and Google Slides.