


Características


¿Tienes alguna pregunta?
Recomendar


6 diapositivas
Business Overview Company Profile Presentation
Present Your Business with a Dynamic Overview! The Business Overview Company Profile template features a modern circular flow design, perfect for showcasing company insights, key strategies, and core values. With six structured content sections, this layout helps you present information in a clear and engaging way. Whether you're introducing your business or outlining corporate initiatives, this fully editable template in PowerPoint, Keynote, and Google Slides ensures a polished and professional presentation for any industry.


5 diapositivas
Marketing Strategy Wheel Diagram Presentation
Visualize your marketing framework in a clear and engaging way with this Marketing Strategy Wheel Diagram. Designed to highlight key components like audience targeting, communication channels, and campaign goals, this circular format brings strategy to life. Fully customizable and compatible with PowerPoint, Keynote, and Google Slides. Ideal for marketers, agencies, and branding professionals.


5 diapositivas
Information Technology Uses Infographics
Navigate the digital era with our information technology uses infographics, a synthesis of design and functionality. Presented in the trustworthy shades of blue and the vibrant hues of green, this template captures the essence of IT applications across spectrums. Whether you're an educator or tech enthusiast, these vertical, creatively designed infographics serve as a conduit to explain the intricacies of contemporary tech use. Compatible with Powerpoint, Keynote, and Google Slides. Complete with expressive icons and customizable image placeholders, this visual aid is crafted for clarity, making complex IT concepts engaging for audiences.


7 diapositivas
Strategy Wheel Options Infographic Presentation
A Strategy Wheel Infographic is a visual tool that helps organizations develop and communicate their strategic plans. This template uses a circular diagram that breaks down the elements of a strategy into categories or segments, with each segment representing a different aspect of the plan. This infographic includes a central circle that represents the organization's overall goal, surrounded by smaller circles or segments that represent specific strategies or tactics. Each segment may include additional information such as goals, objectives, key performance indicators, and action items.


5 diapositivas
Science Branches Infographics
Science is a vast and diverse field that encompasses several branches or disciplines, each focusing on different aspects of the natural world, physical phenomena, and the study of living organisms. These infographic templates are perfect for presenting the diverse fields of science and their significant contributions to our understanding of the world. Use these infographics to deliver a presentation on science education, scientific research, or the interdisciplinary nature of science. This template will help you visually communicate the information, engage your audience, and create an impactful presentation experience.


7 diapositivas
Credit Card Infographic Presentation Template
A Credit card Infographic is a stacked chart showing data visualization of credit card types and associated information, including the number of cards owned by different age groups and gender, as well as overall debt. This infographic allows you to cover the ins and outs of credit cards, from rewards to fees and interest rates. This template will help you understand how credit cards work, while comparing cards based on price and other important factors. This Infographic is the perfect way to visualize data, trends and facts in an engaging way that grabs attention and keeps people reading.


4 diapositivas
Effective Leadership Tips Presentation
Lead with clarity and confidence using this clean, modern presentation design. Perfect for sharing management insights, motivational principles, and communication strategies, it helps visualize ideas that inspire stronger teams and better decision-making. Fully editable and compatible with PowerPoint, Keynote, and Google Slides for effortless professional customization.


7 diapositivas
Project Stakeholder Analysis Infographic
Stakeholder analysis is a technique used in project management and organizational strategy to identify and understand the interests, influence, and impact of individuals or organizations that can significantly affect or be affected by a project or decision. This infographic template is your compass to navigating the intricate landscape of stakeholders, understanding their influence, and engaging them effectively for project success. Compatible with Powerpoint, Keynote, and Google Slides. The vibrant design and strategic insights of our template will empower you to navigate the stakeholder cosmos and steer your project towards triumph.


4 diapositivas
Corporate Planning and Analysis Presentation
Simplify strategic discussions with this Corporate Planning and Analysis Presentation. Featuring a circular 4-piece puzzle diagram, each section highlights a different business focus area using icons and color coding. Ideal for illustrating synergy between departments or initiatives. Fully customizable in PowerPoint, Keynote, and Google Slides.


7 diapositivas
PESTEL Framework for External Analysis Presentation
Evaluate external factors with ease using the PESTEL Framework for External Analysis Presentation. This structured layout helps you assess Political, Economic, Social, Technological, Environmental, and Legal influences on your business. Perfect for market research, risk assessment, and strategic planning. Fully customizable in PowerPoint, Canva, and Google Slides.


19 diapositivas
Sales Proposal Presentation
Secure your next big deal with our Sales Proposal presentation template, tailored to make your pitch unforgettable. It's a comprehensive toolkit for sales professionals designed to address every aspect of your offering. The slides smoothly guide your audience through your company overview, mission, product or service features, and the solutions you provide to the client's problems. They are meticulously structured to help you outline your value proposition, address customer pain points, and present a convincing case with customer testimonials. The design is not just visually appealing but also conducive to narrative flow, presenting cost and pricing details with clarity, and allowing room for engaging Q&A sessions. This template is ideal for sales pitches, adaptable across PowerPoint, Keynote, and Google Slides. It helps you build a persuasive argument for why your solution is the best fit for the client, providing a professional edge in a competitive marketplace.


7 diapositivas
5G Mobile infographic Presentation
5G technology is important because it has the potential to transform the way we live, work, and interact with the world around us. This template is designed to help you create an eye catching and informative infographic on the topic of 5G technology. With this template, you can easily showcase the benefits and capabilities of 5G in an easy to understand way. This template features a vibrant and clean design, with uniquely selected color schemes and fonts to ensure that the content is visually appealing. It includes a variety of slide layouts, including text slides, images, charts and graphs!


6 diapositivas
6-Step Training Program Slide Presentation
Make your training process feel like a journey worth taking. This vibrant 6-step infographic template helps you break down each stage of your program with clear icons, color-coded steps, and a clean visual path. Ideal for onboarding, workshops, or employee development. Fully compatible with PowerPoint, Keynote, and Google Slides.


22 diapositivas
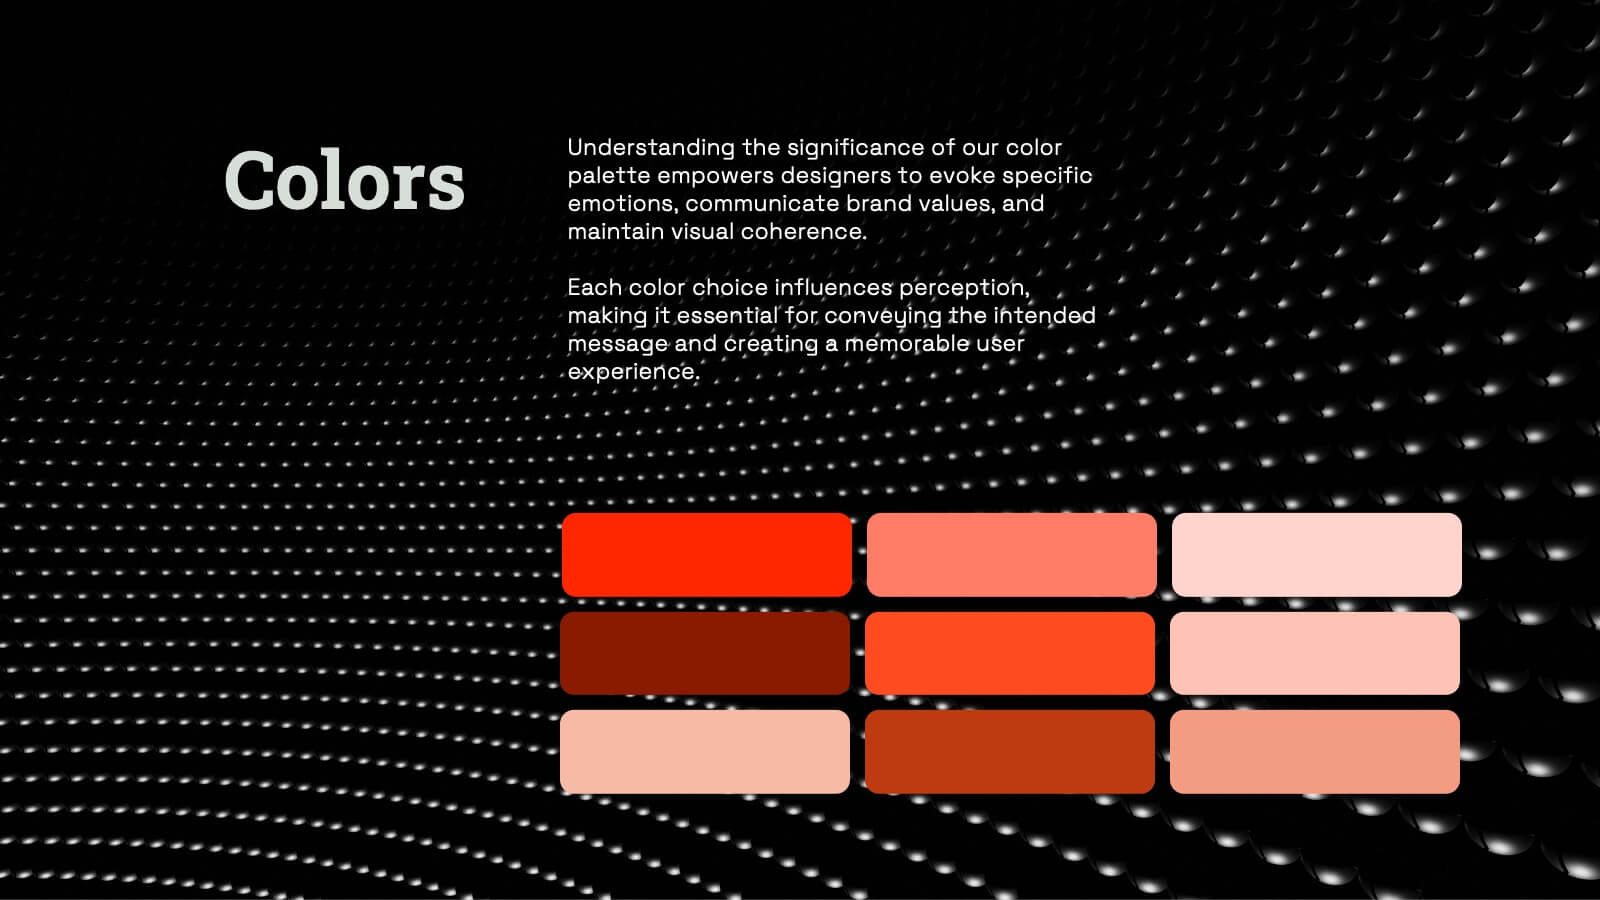
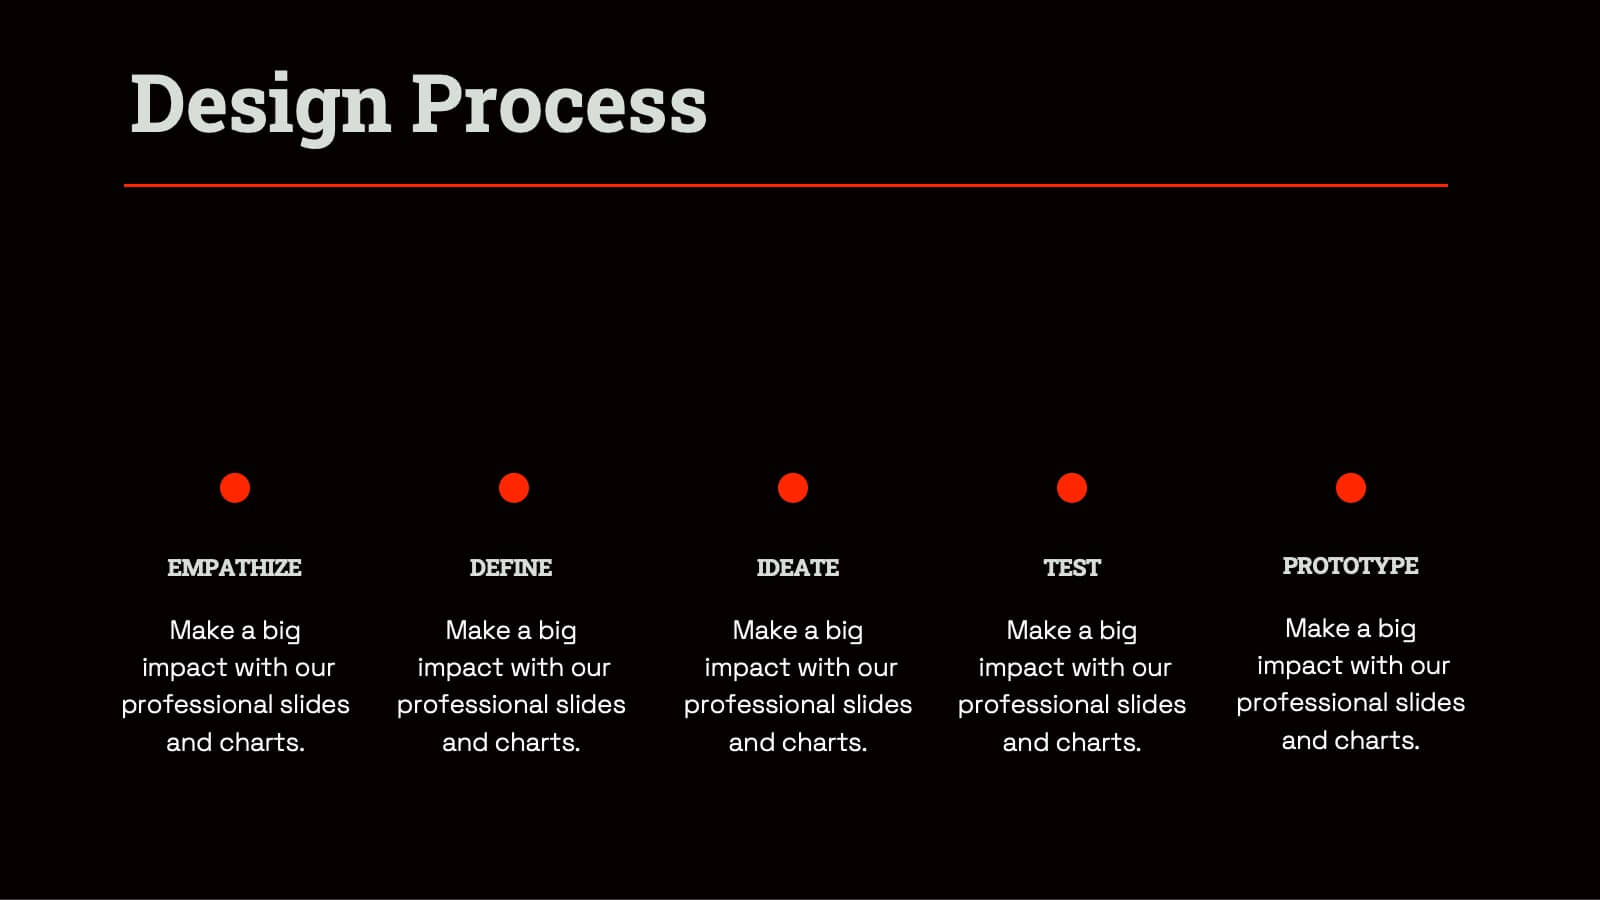
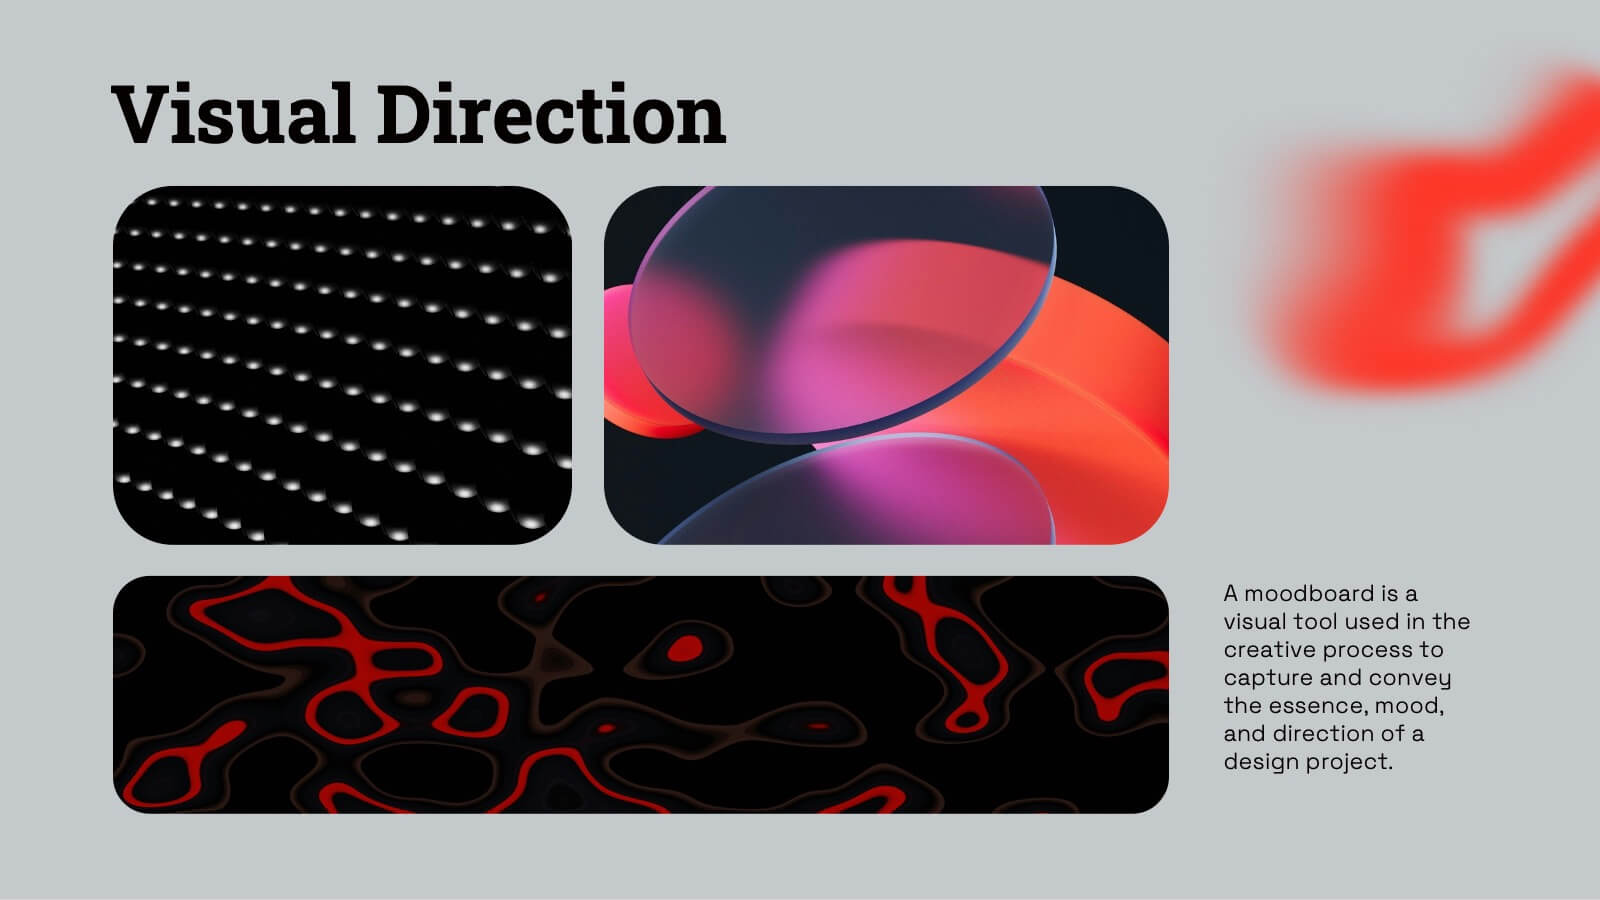
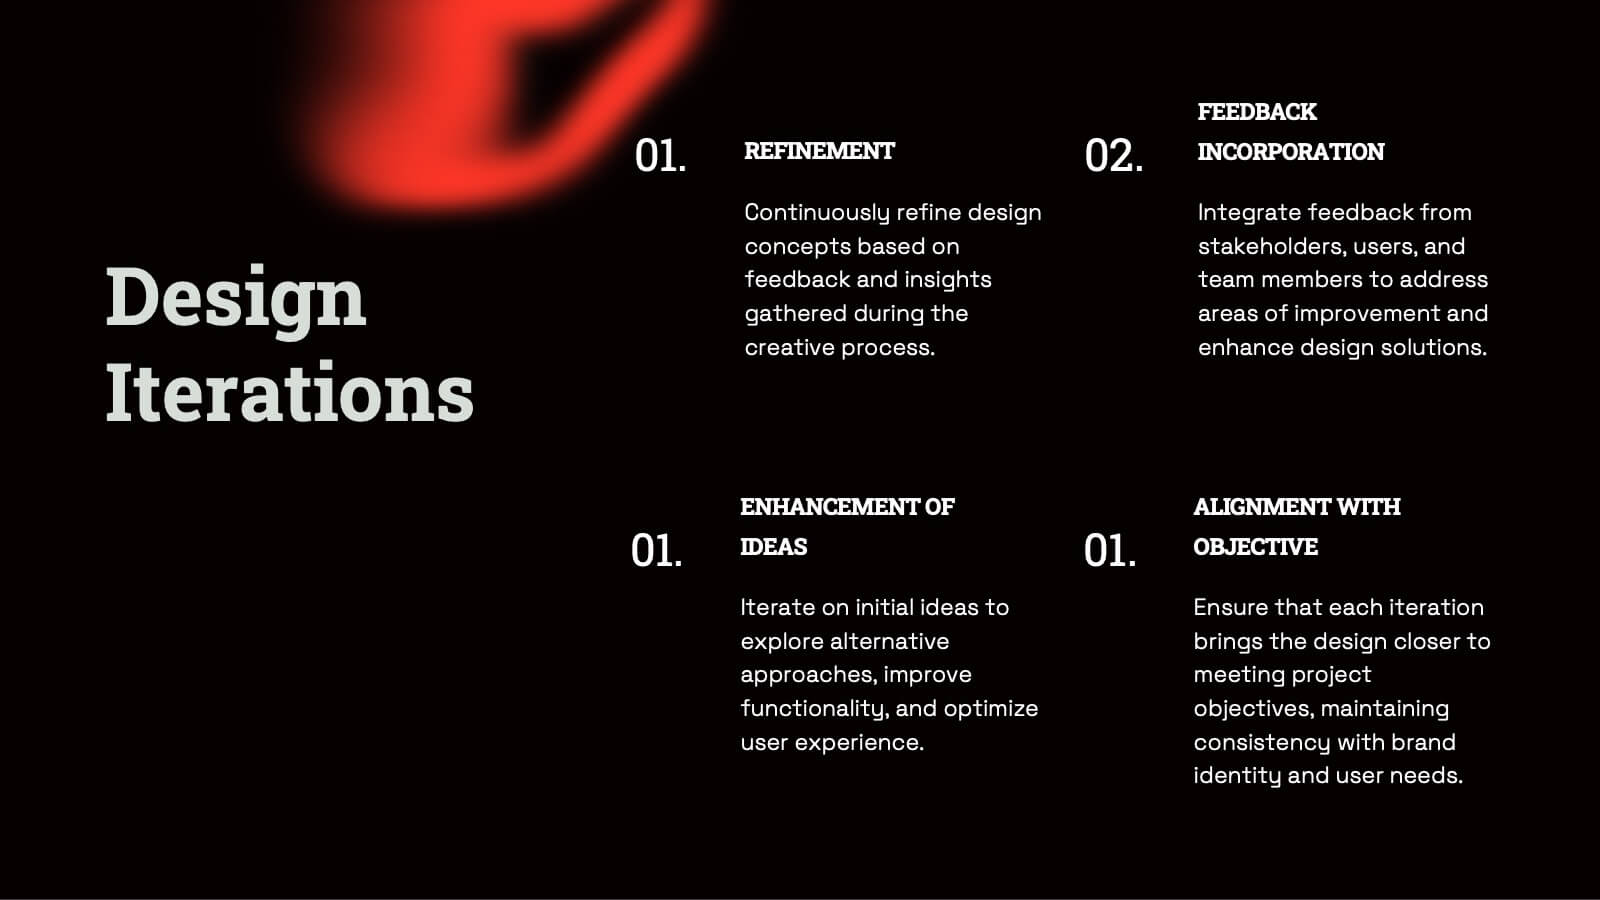
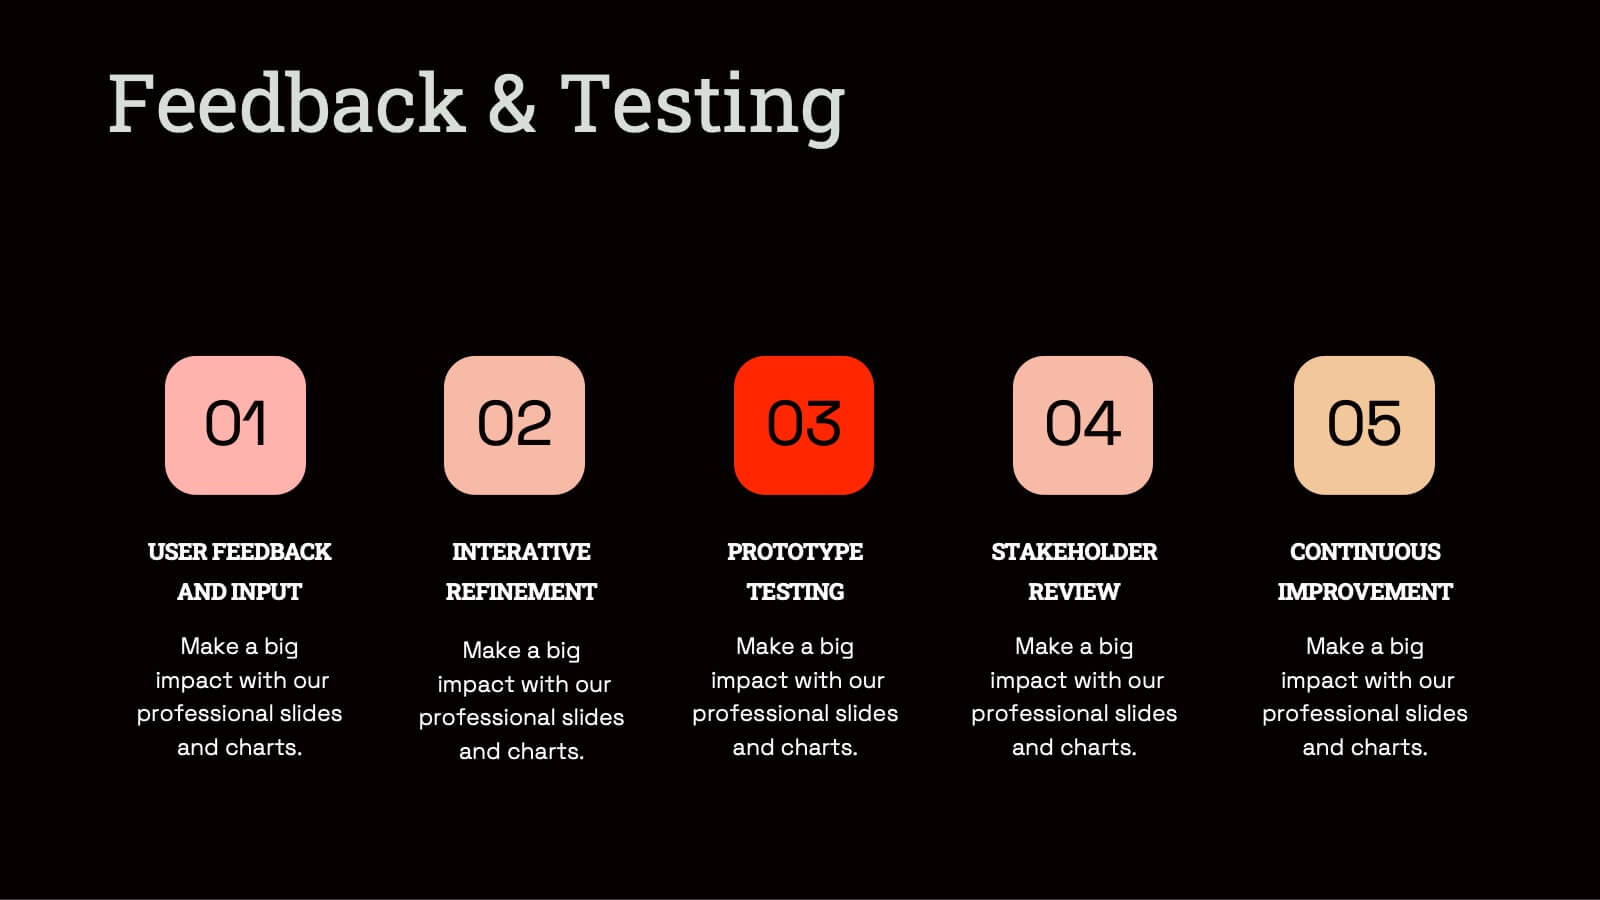
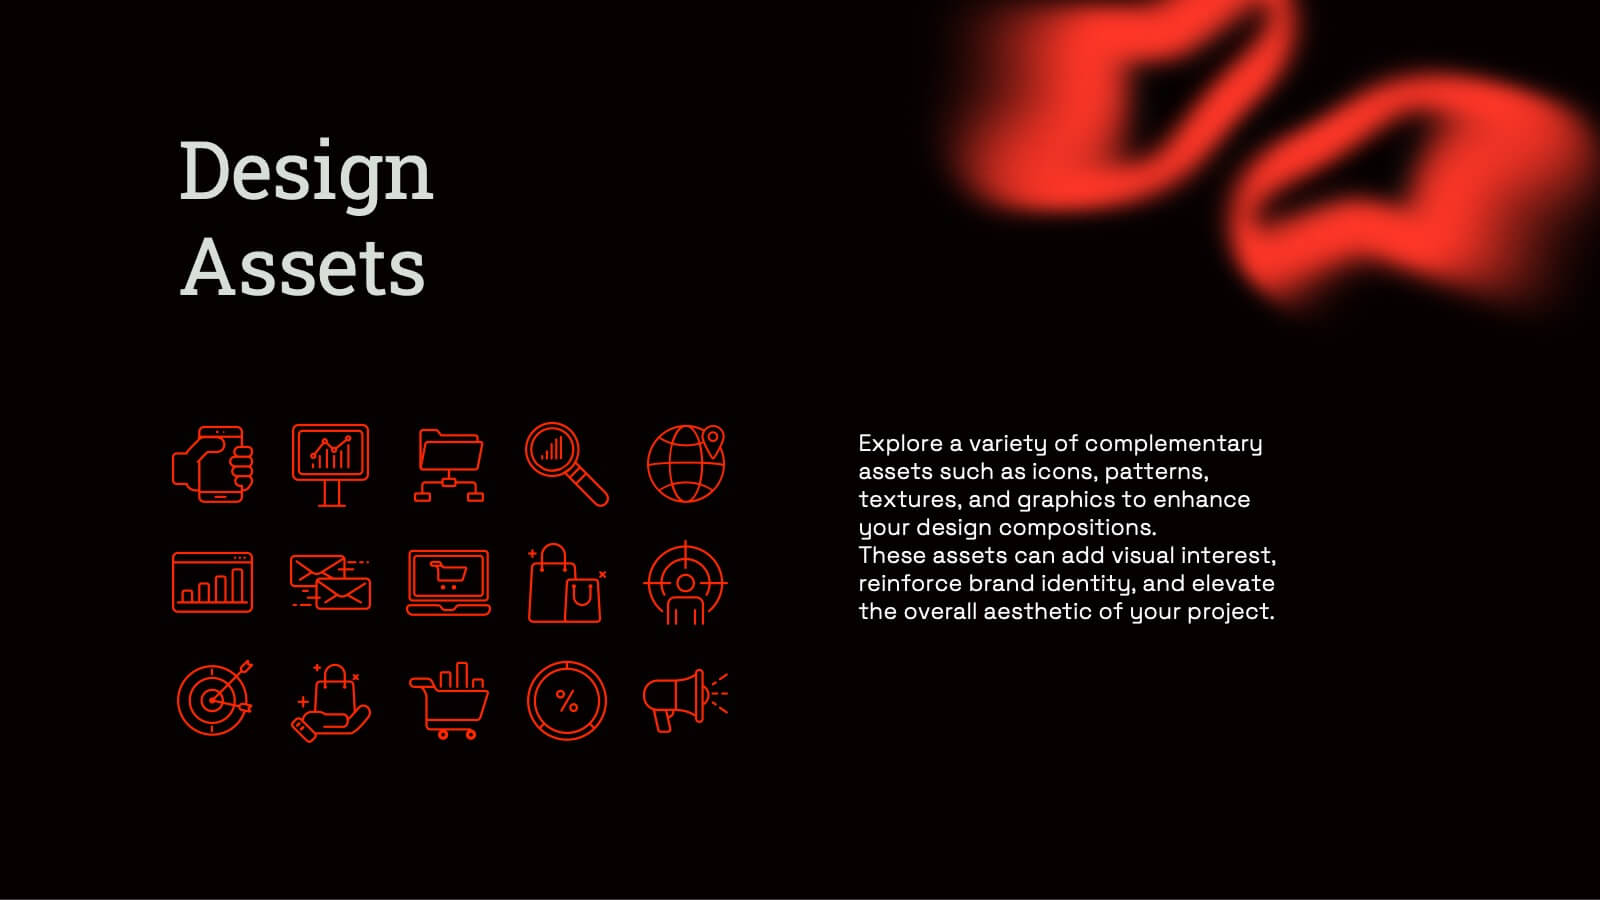
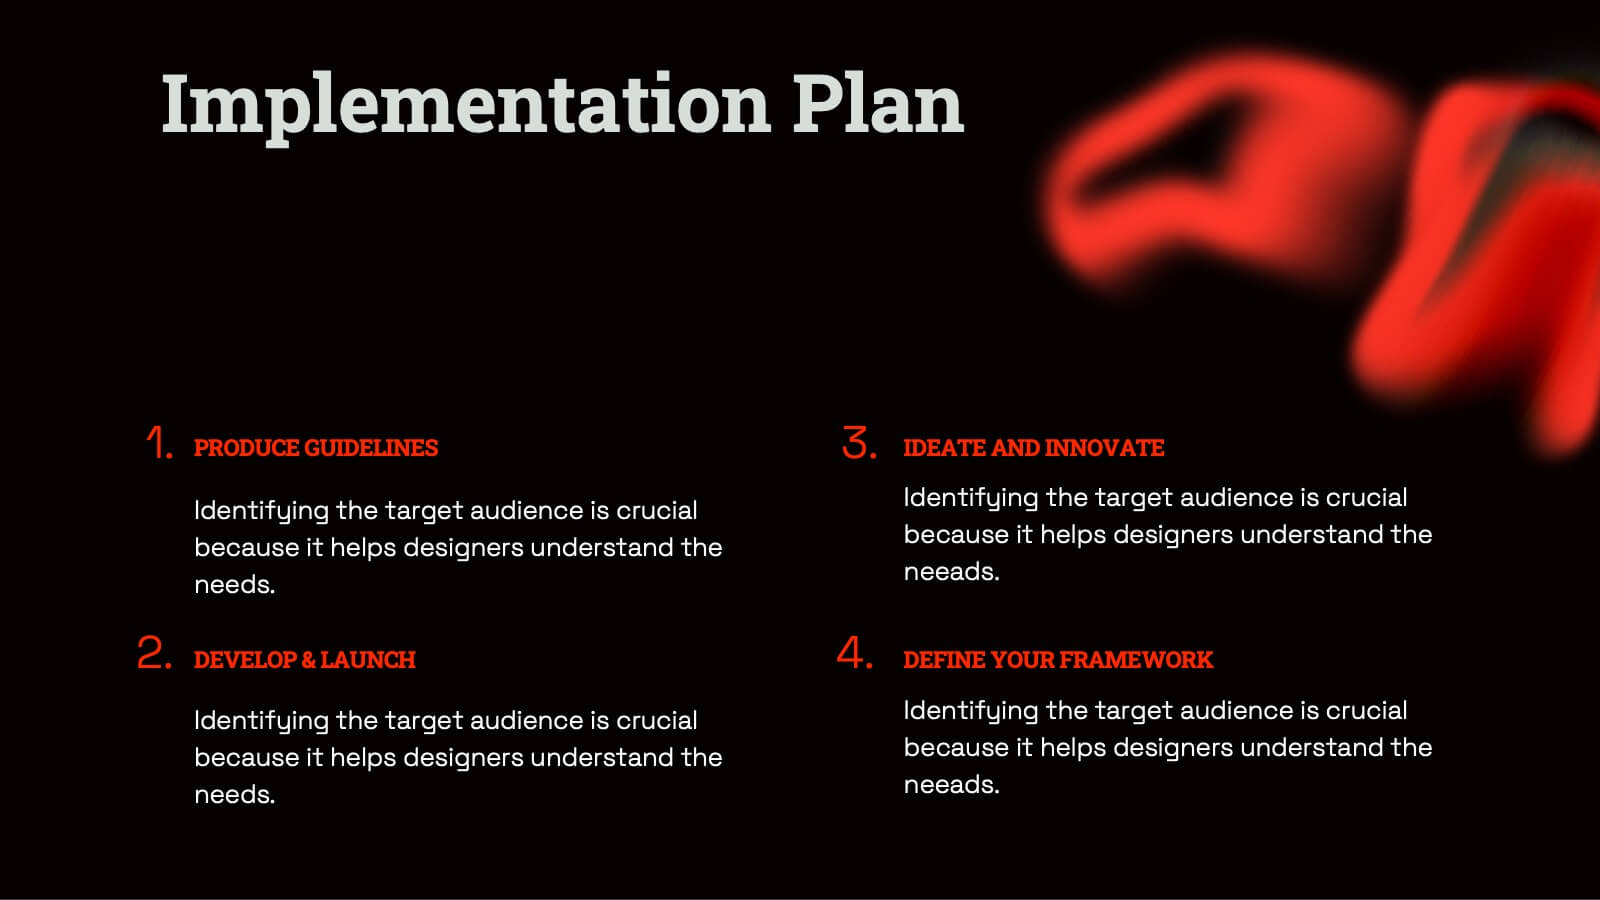
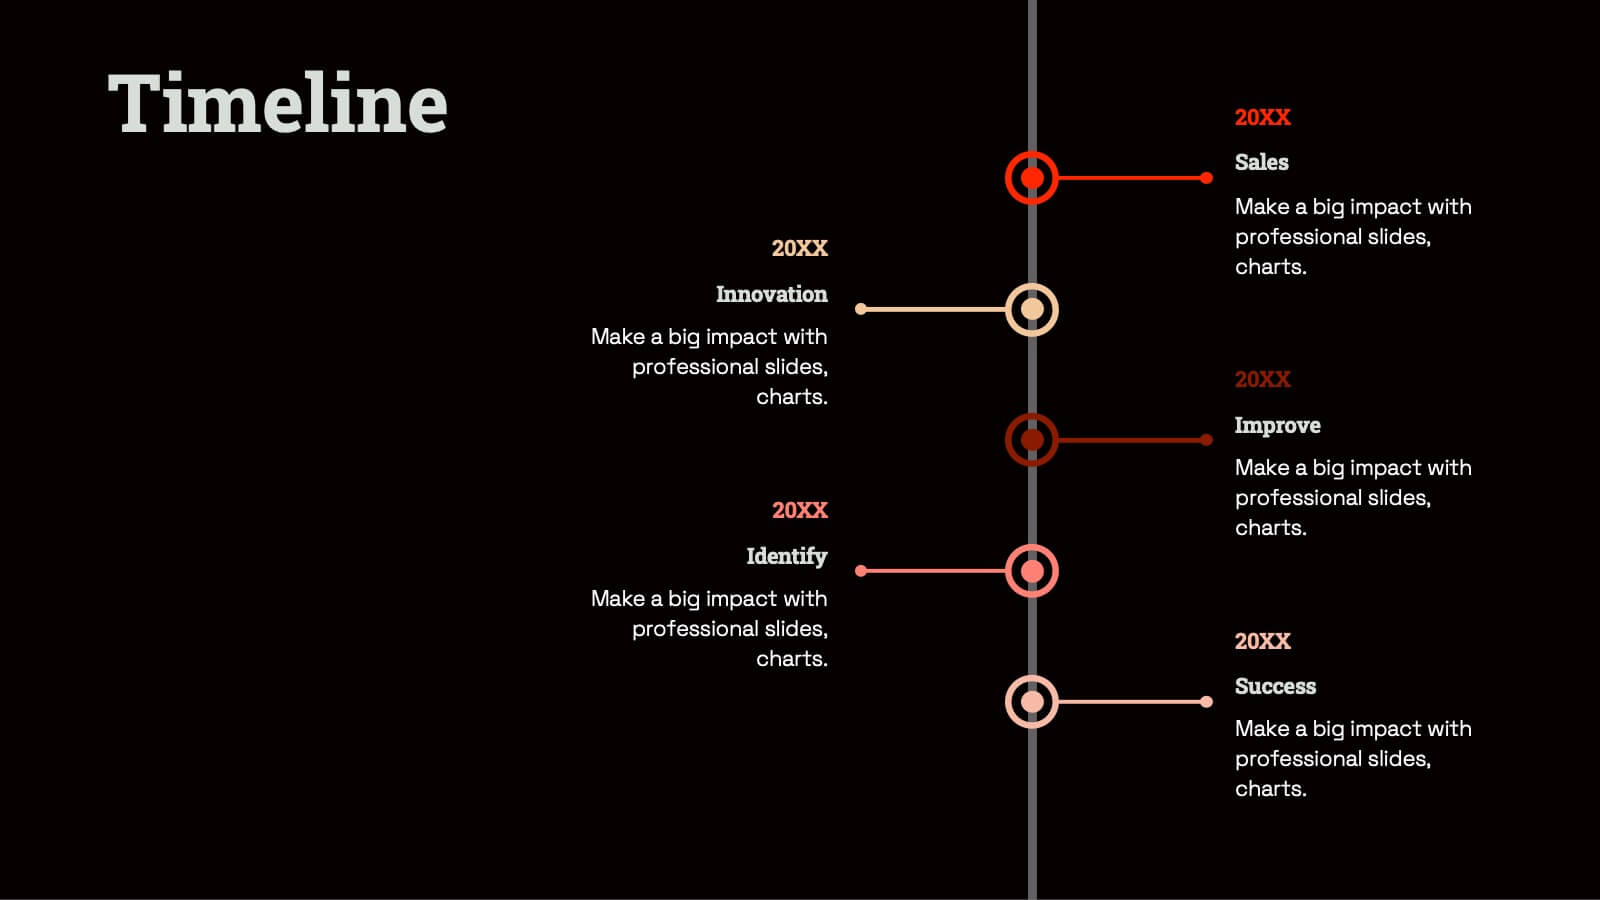
Radiant Graphic Design Project Plan Presentation
Unleash your creativity with this bold and dynamic graphic design project plan template! Perfect for showcasing design elements, textures, and typography, this template guides you through every phase, from concept development and prototyping to feedback and final presentations. Ideal for visual direction and design asset management, it’s fully compatible with PowerPoint, Keynote, and Google Slides for seamless use.


5 diapositivas
Corporate Staff Introduction and Bios Presentation
Introduce your team with clarity using the Corporate Staff Introduction and Bios Presentation. This layout is perfect for showcasing employee names, titles, photos, and brief bios in a professional format. Ideal for company overviews, internal communications, or onboarding decks. Fully editable in PowerPoint, Canva, and Google Slides.


7 diapositivas
Premium Credit Card Infographic
A premium credit card, is a type of credit card that offers enhanced benefits and exclusive features compared to standard credit cards. This infographic template provides an overview of premium credit cards, showcasing their exclusive benefits and empowering users to make informed financial decisions. Present different types of premium credit cards available, showcasing how each caters to specific needs and preferences. Fully customizable and compatible with Powerpoint, Keynote, and Google Slides. This allows you to easily present financial management tools and features embedded in premium credit cards.


6 diapositivas
Corporate Governance Strategy
Present your company’s leadership structure with clarity using this corporate governance strategy slide. This hexagonal framework highlights key areas such as vision, objectives, and strategy—surrounded by six supporting pillars. Each section includes editable icons and text for board responsibilities, ethics, oversight, and more. Ideal for executive updates, policy reviews, and stakeholder reports. Fully customizable in PowerPoint, Keynote, and Google Slides.