


Características


¿Tienes alguna pregunta?
Recomendar


7 diapositivas
Strategy Wheel Infographics Presentation Template
The Strategy Wheel is a tool you can use for your personal life and work life to get clarity on how you create unique value for the world. This strategy seeks to generate consistent value while limiting risk. Use the strategy wheel as a tool to help your company develop unique strategies. Your Strategy Wheel should be a reflection of your purpose and your approach for unique value creation. This template is perfect if you want to center your purpose and evaluate why you and your business exist. This template comes with a variety of different strategy wheels you can customize and make your own.


5 diapositivas
Territory Overview in Oceania Presentation
Highlight your regional data with the Territory Overview in Oceania Presentation. Featuring a clean map layout of Australia and surrounding territories, this slide is ideal for displaying key regional insights, office locations, or performance data. Color-coded markers and callouts help organize your content clearly. Fully editable in Canva, PowerPoint, or Google Slides.


6 diapositivas
Advanced Project Timeline with Gantt Layout
Keep complex projects on track with the Advanced Project Timeline with Gantt Layout Presentation. This slide makes it easy to outline task durations over multiple weeks, providing a clear visual of overlaps, dependencies, and pacing. Ideal for managers, teams, and stakeholders needing a structured view of multi-week initiatives. Compatible with PowerPoint, Keynote, and Google Slides for seamless updates.


6 diapositivas
Root Cause Analysis of Key Problems Presentation
Get to the heart of business issues with this Root Cause Analysis of Key Problems presentation. This template helps you break down complex challenges into actionable components: Who, What, When, Where, Why, and How. Clean, color-coded arrows ensure clarity. Ideal for strategic reviews and process optimization. Fully editable in Canva, PowerPoint, and Google Slides.


4 diapositivas
Fixed and Variable Cost Balance Presentation
Visualize cost distribution using a balanced scale metaphor. This presentation helps compare fixed and variable costs with editable sections for data input. Ideal for financial planning, budgeting, or cost control analysis. Fully customizable in PowerPoint, Keynote, and Google Slides to match any brand or business presentation style.


22 diapositivas
Simple Pitch Deck Presentation
Streamline your pitch process with this no-frills Pitch Deck template, designed for clear communication and powerful impact. From the get-go, the cover slide clearly announces your purpose, inviting audiences into your business narrative. The template smoothly transitions from one slide to the next, each one a stepping stone in building your case — from problem to solution. It includes a neatly organized table of contents, thought-provoking mission and vision statements, and data-rich slides for a deep dive into your business metrics. Each section, marked with bold, numbered headers, keeps your presentation on track and your audience engaged. A final 'Thank You' slide adds a touch of professionalism, and the credits section ensures that your sources are transparently acknowledged. This pitch deck is ideal for startups and businesses looking to capture attention and convey their story succinctly.


7 diapositivas
Puzzle Communication Infographic
Piece together the art of effective communication with our puzzle communication infographic. Set on a sleek white foundation, complemented by the enigma of purple, the zest of orange, and the passion of red, this template ingeniously utilizes puzzle pieces to symbolize interconnected communication elements. Enhanced with inventive infographics, representative icons, and adjustable image placeholders, it offers a comprehensive exploration of communication dynamics. Exquisitely crafted for Powerpoint, Keynote, or Google Slides. An indispensable tool for communication specialists, team leads, trainers, or anyone keen on enhancing interpersonal exchanges.


4 diapositivas
4-Quadrant Empathy Map Presentation
Dive into your audience’s mindset with a clean, structured layout that brings clarity to what they see, feel, hear, and do. This presentation helps teams understand user behavior and motivations with simple quadrant-based insights. Fully compatible with PowerPoint, Keynote, and Google Slides.


5 diapositivas
Problem-Solving and Challenge Resolution Presentation
Solve problems efficiently with a structured approach using this Problem-Solving and Challenge Resolution template. Featuring a unique visual of connecting solutions like a plug and socket, this slide helps break down problems, present solutions, and demonstrate effective decision-making strategies. Ideal for brainstorming sessions, business strategy meetings, and risk management discussions, this template is fully customizable and compatible with PowerPoint, Keynote, and Google Slides.


22 diapositivas
Galileo Advertising Agency Proposal Presentation
Present your advertising agency’s capabilities with a proposal template designed to captivate and convince. This sleek and professional layout is perfect for agencies looking to showcase their services, team expertise, and strategic approach to clients. Highlight key sections such as your mission, client success stories, market analysis, and creative process, ensuring every detail is covered. Dive into campaign execution plans, resource allocation, and testimonials to build trust and credibility. Visualize your strategy development with data-driven slides and impactful case study layouts. Fully customizable in PowerPoint, Google Slides, and Keynote, this template is tailored for seamless editing to reflect your agency’s branding. The clean design, bold accents, and structured content make it ideal for pitches, client proposals, or business development meetings. Take your presentations to the next level and leave a lasting impression on potential clients.


5 diapositivas
Company History and Growth Timeline Presentation
Present your milestones with clarity using the Company History and Growth Timeline presentation. Ideal for startups, enterprises, and project retrospectives, this timeline layout helps you highlight key achievements, growth phases, and expansion years in a visually structured format. With modern design elements, editable text fields, and dynamic year markers, it's perfect for telling your brand story or progress journey. Fully compatible with PowerPoint, Keynote, and Google Slides.


26 diapositivas
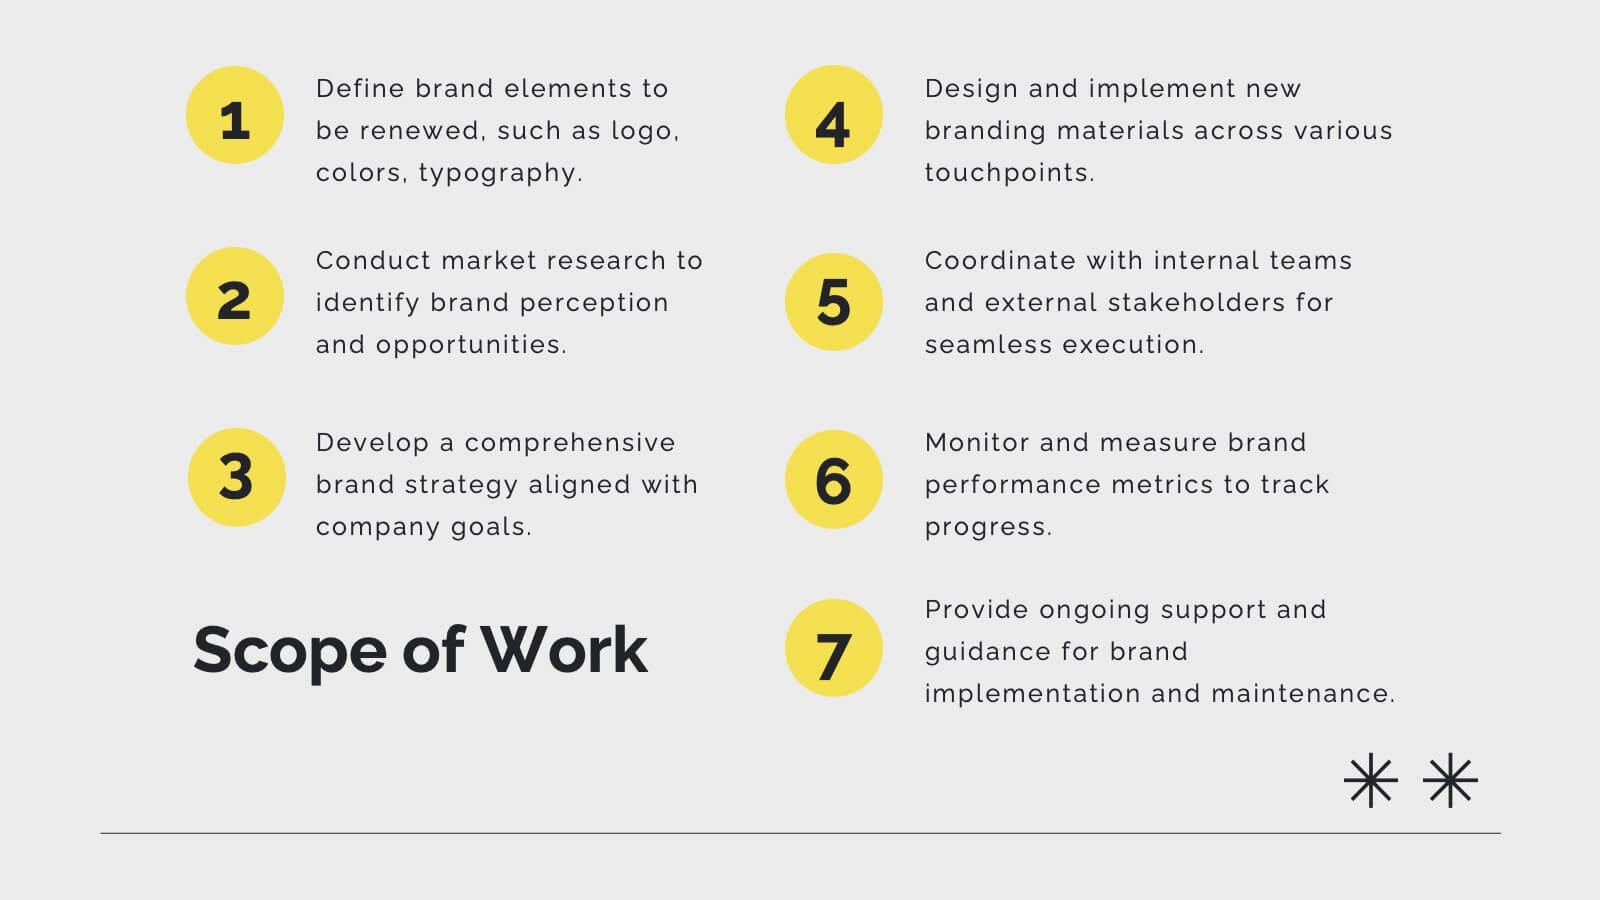
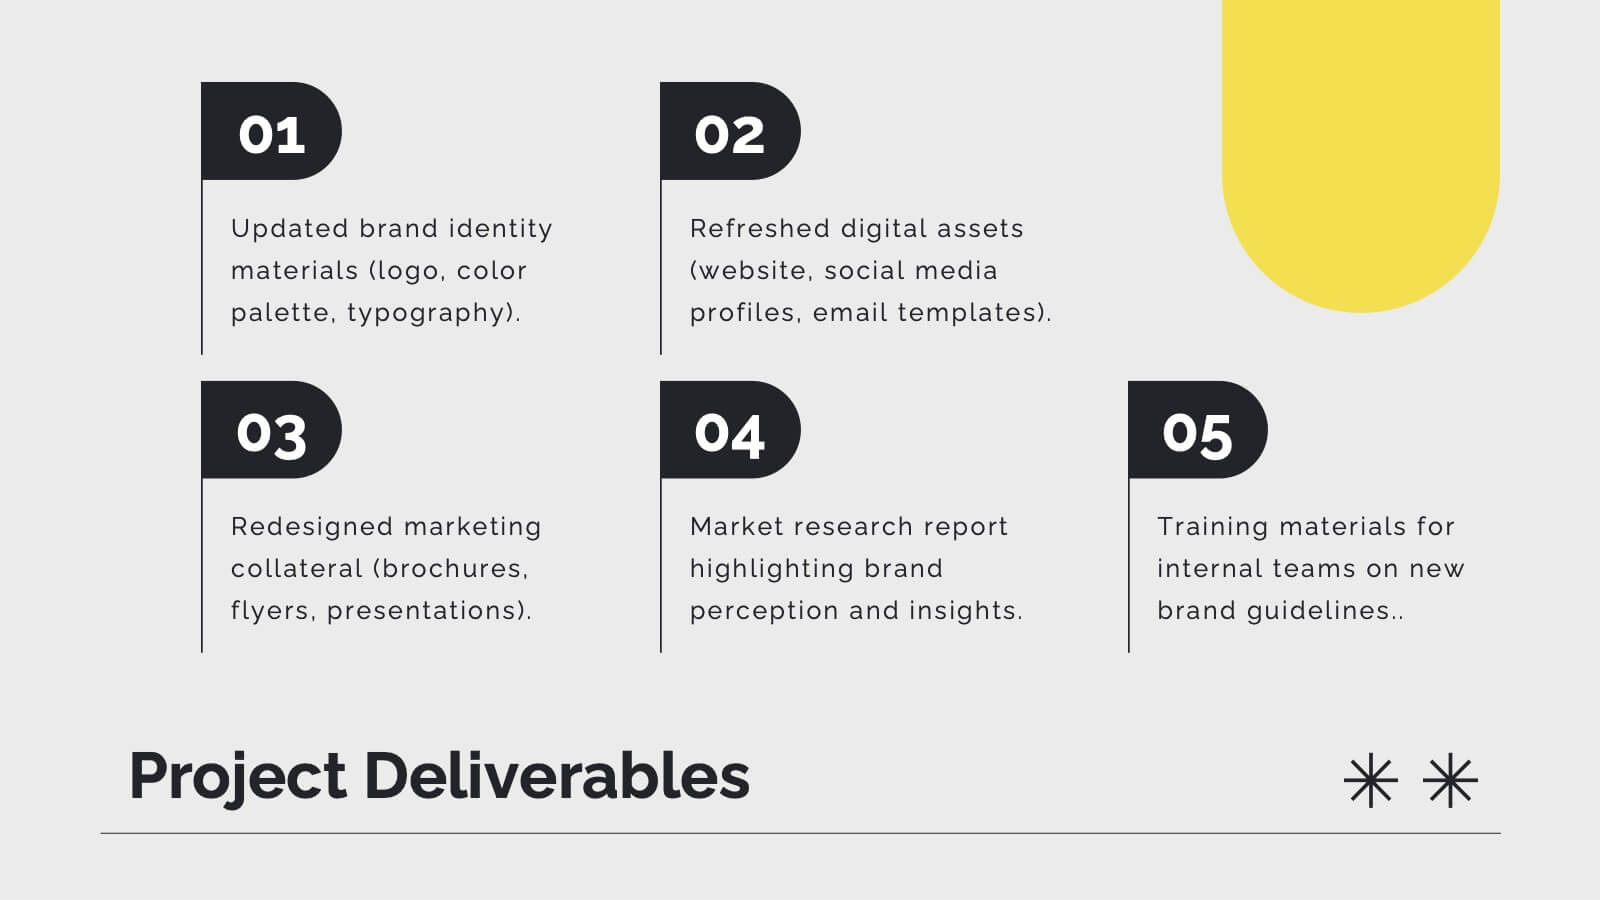
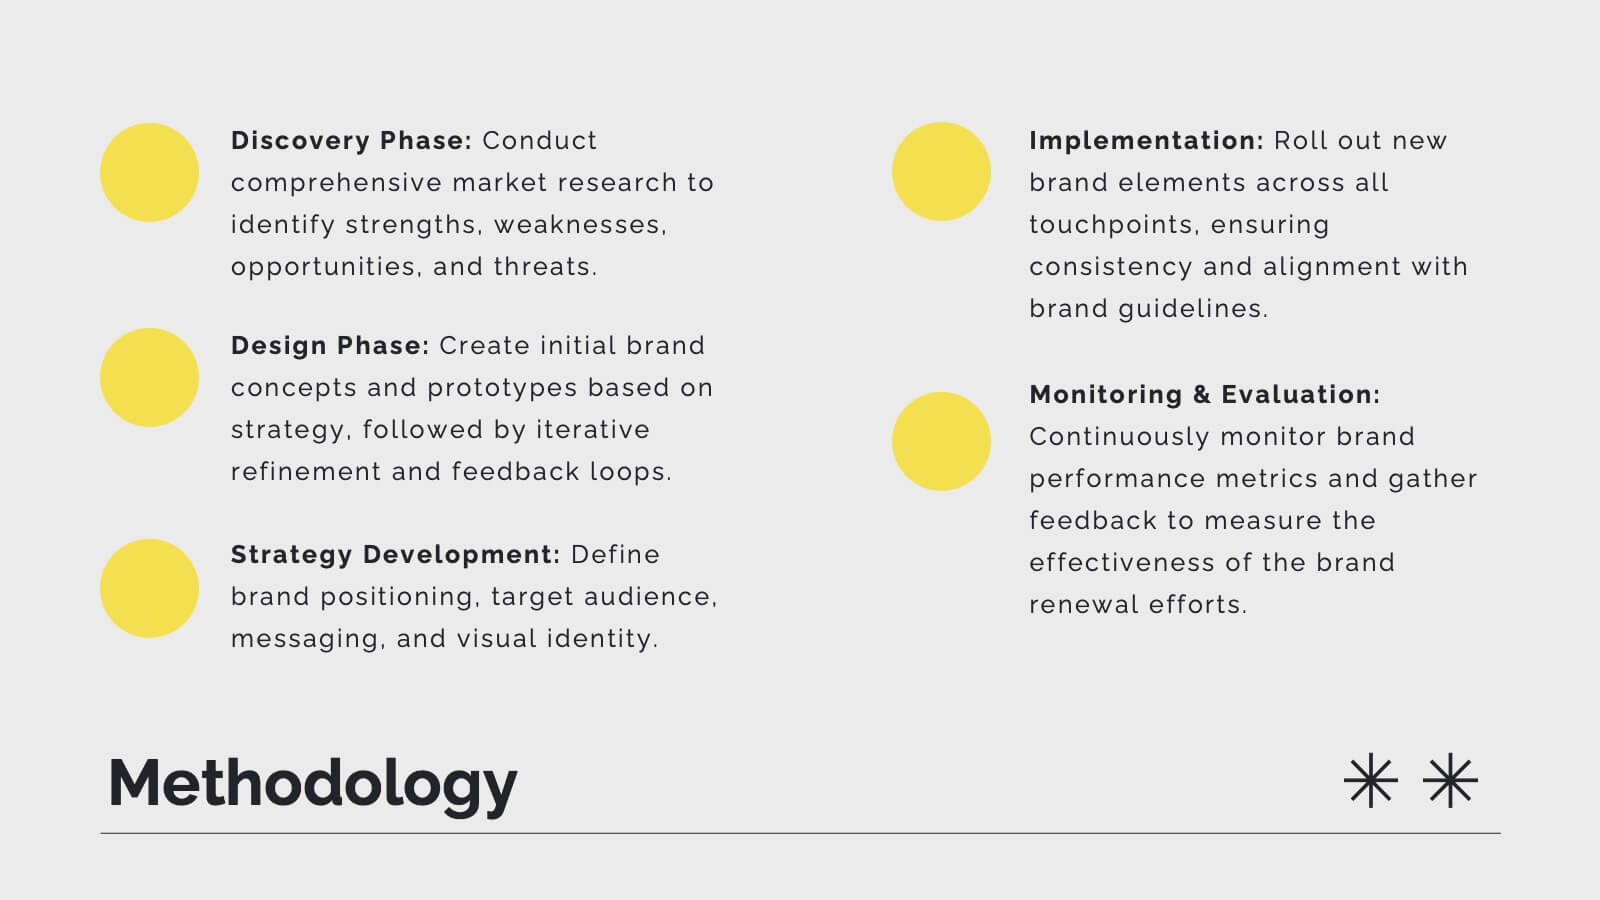
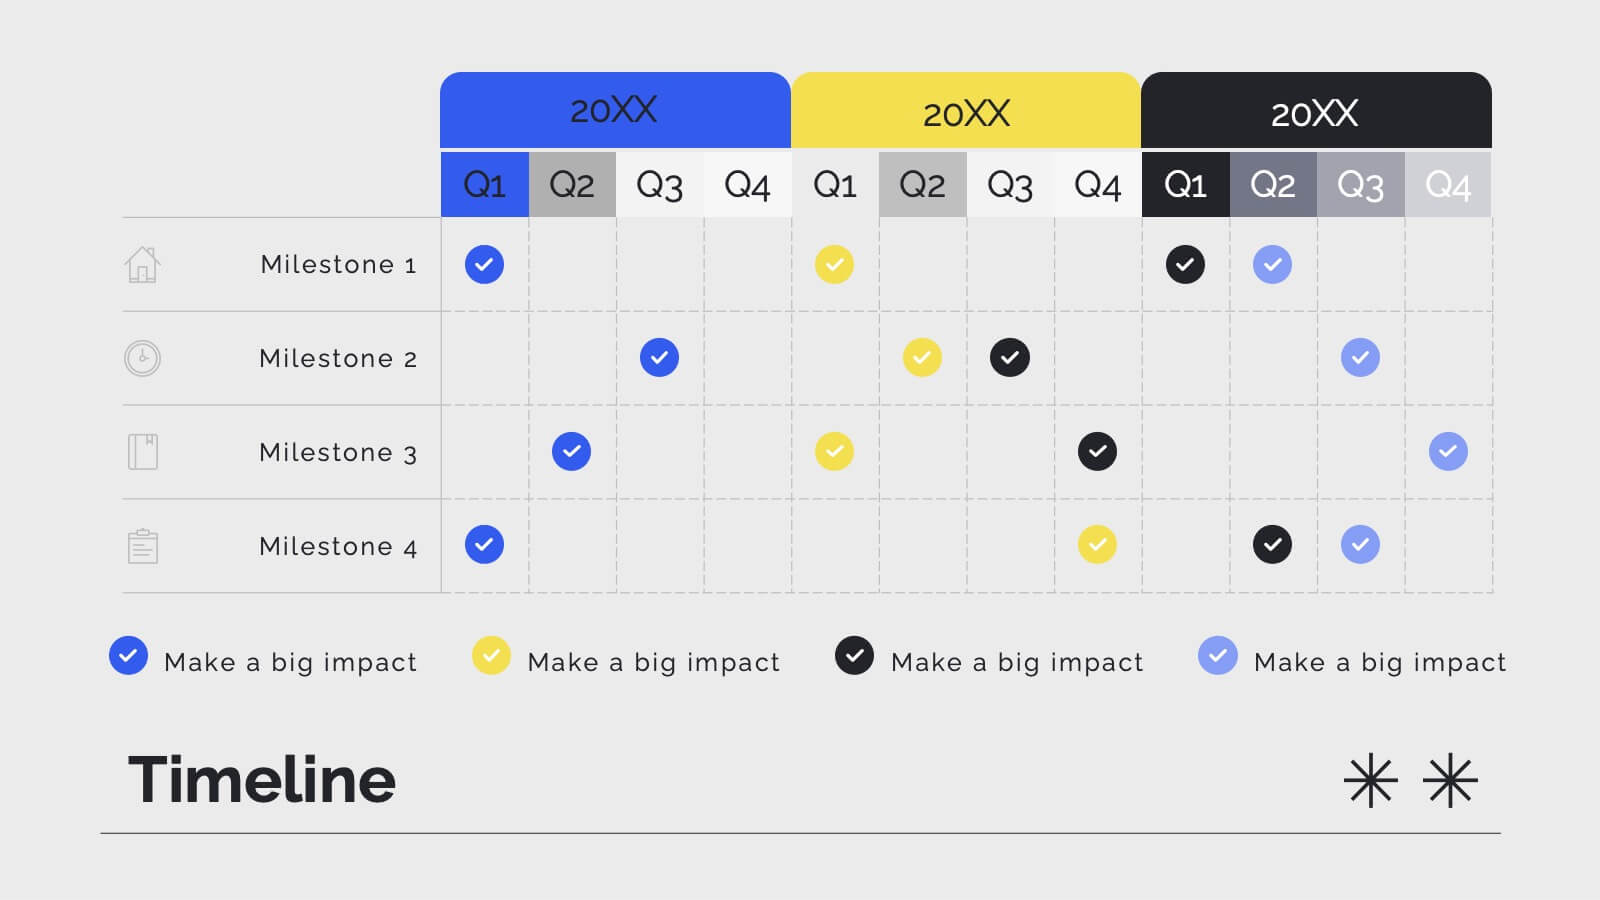
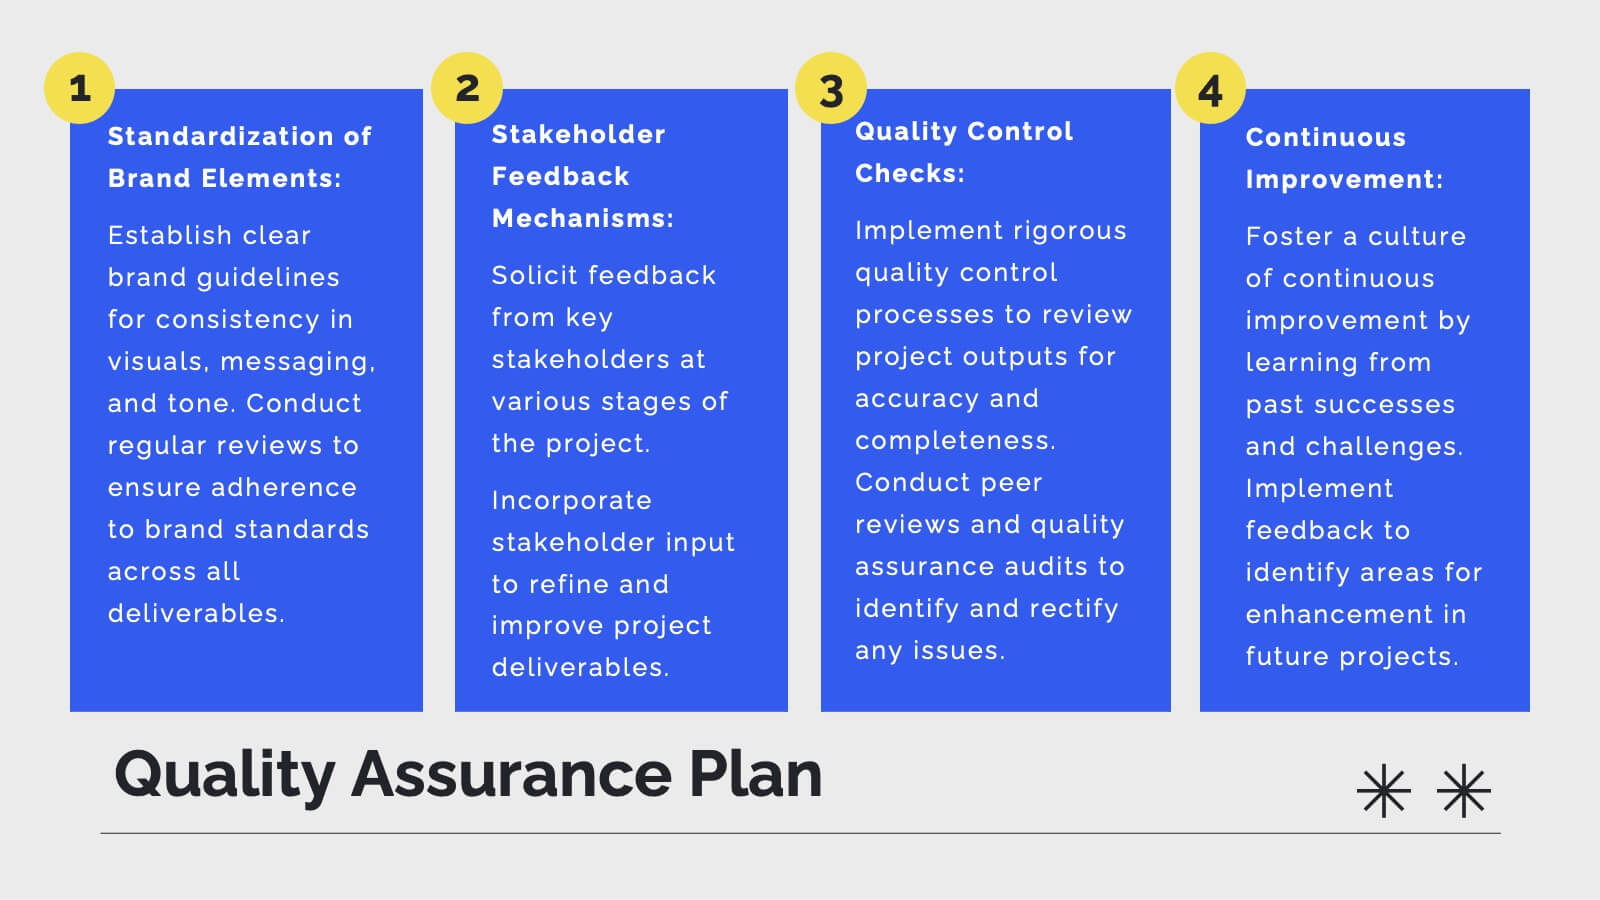
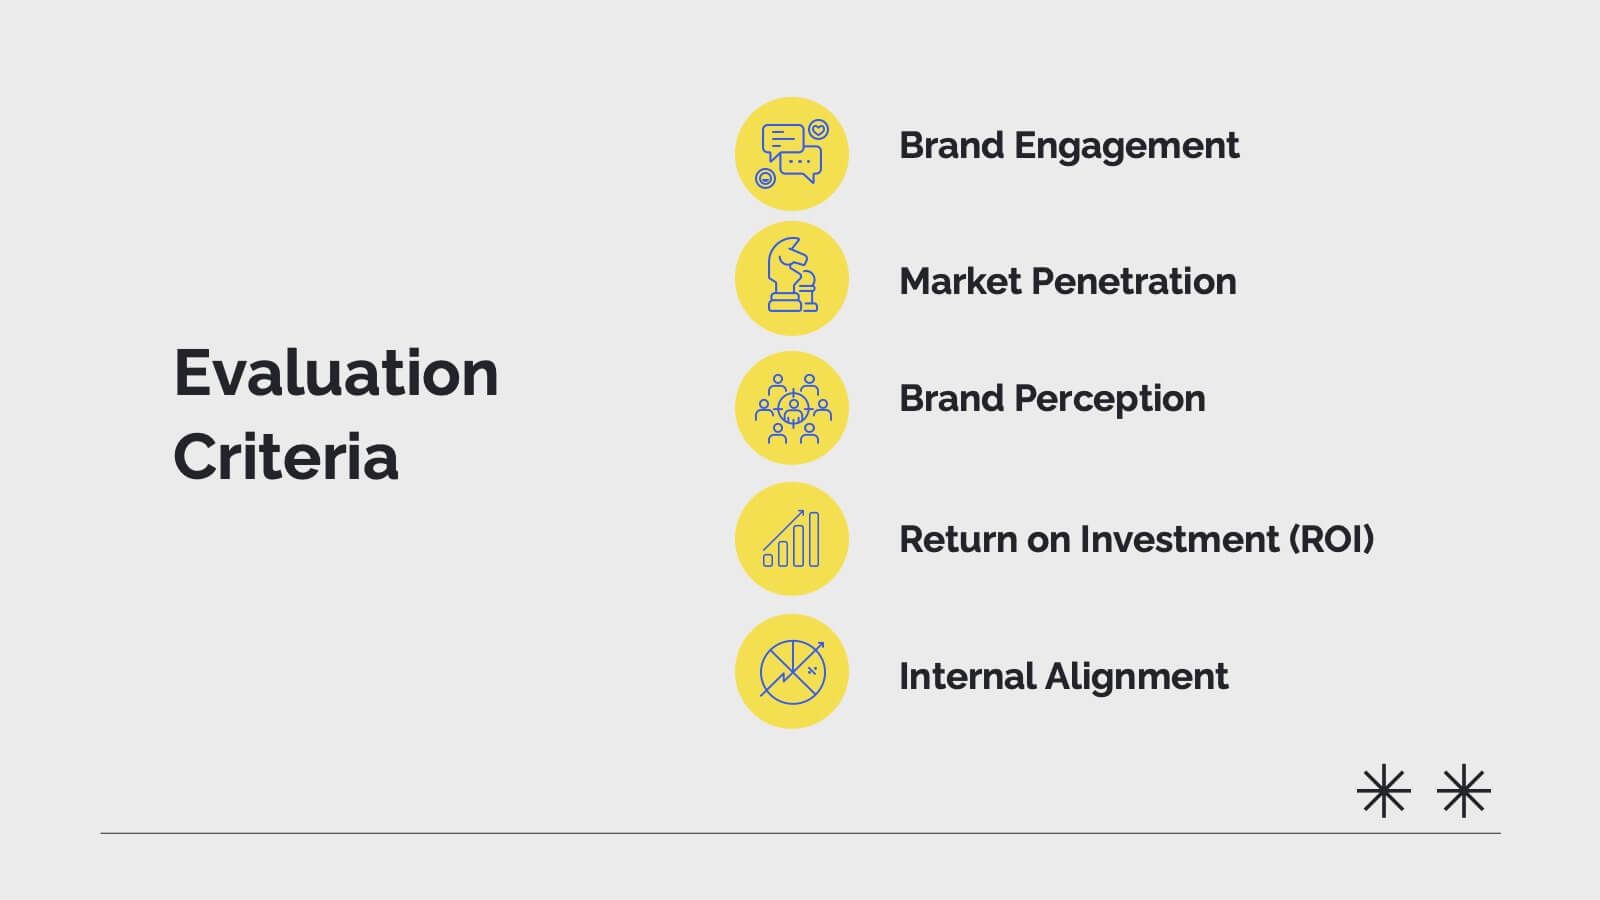
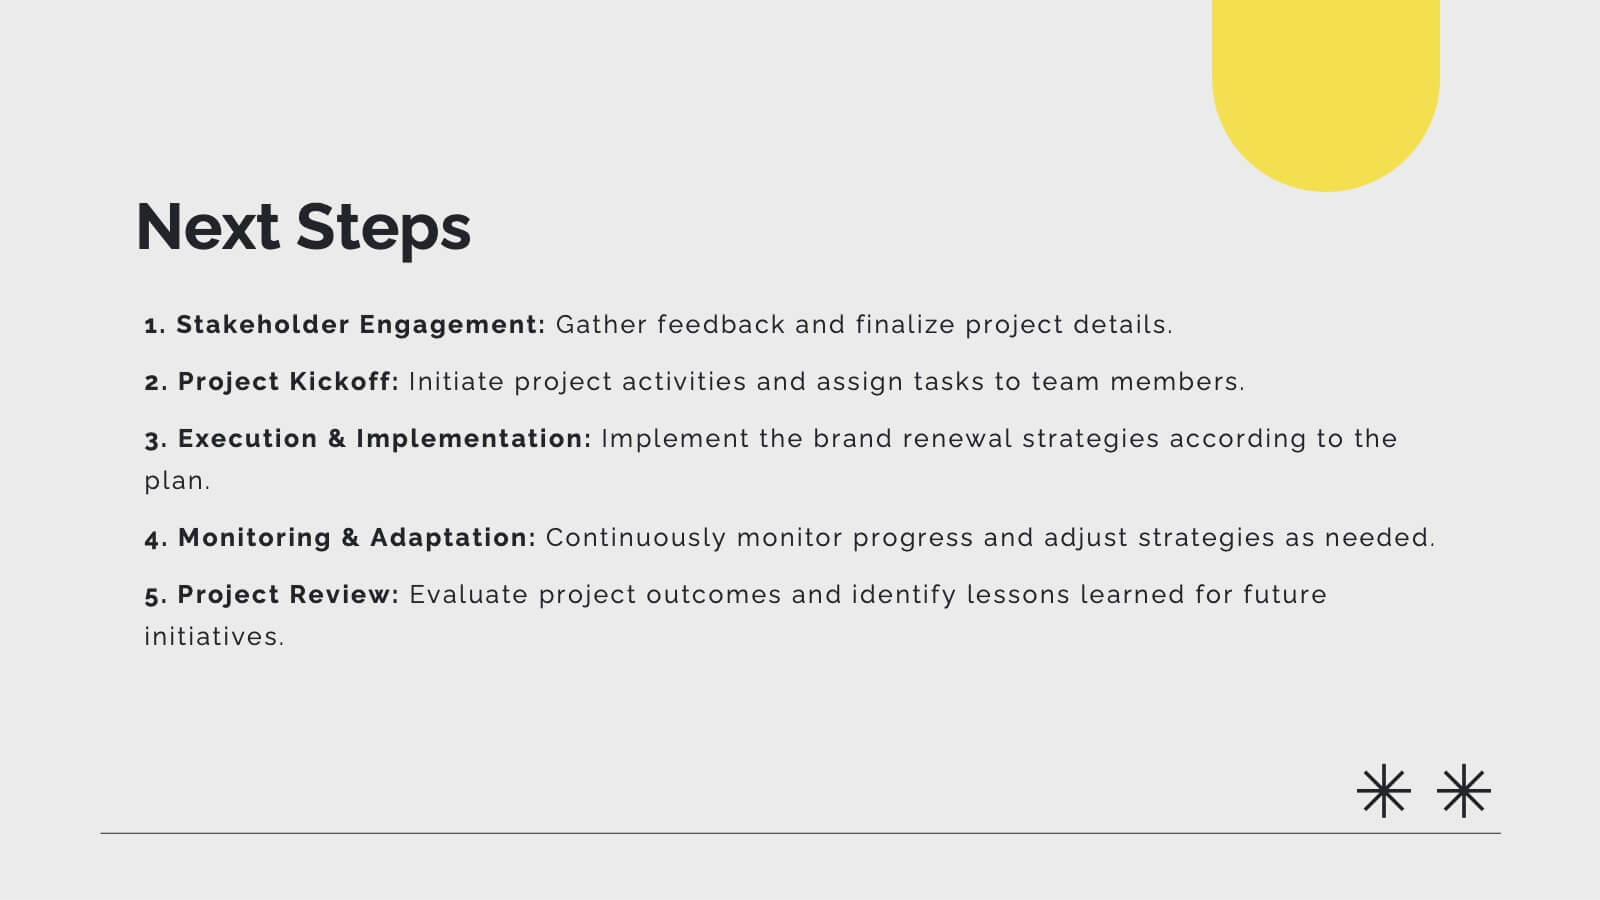
Briarfall Rebranding Project Plan Presentation
This Brand Presentation Template offers a modern and structured approach to showcasing your brand identity, values, and strategic direction. Covering essential elements like audience personas, brand positioning, touchpoints, and performance metrics, it's fully customizable and perfect for businesses looking to strengthen their brand presence. Compatible with PowerPoint, Keynote, and Google Slides.


4 diapositivas
Environmental Impact Assessment Presentation
Bring your audience into a greener future with a clean, leaf-inspired design that makes complex sustainability insights feel clear and approachable. This presentation helps you break down key environmental factors, impact areas, and responsible planning in a simple visual flow. Fully editable and compatible with PowerPoint, Keynote, and Google Slides.


20 diapositivas
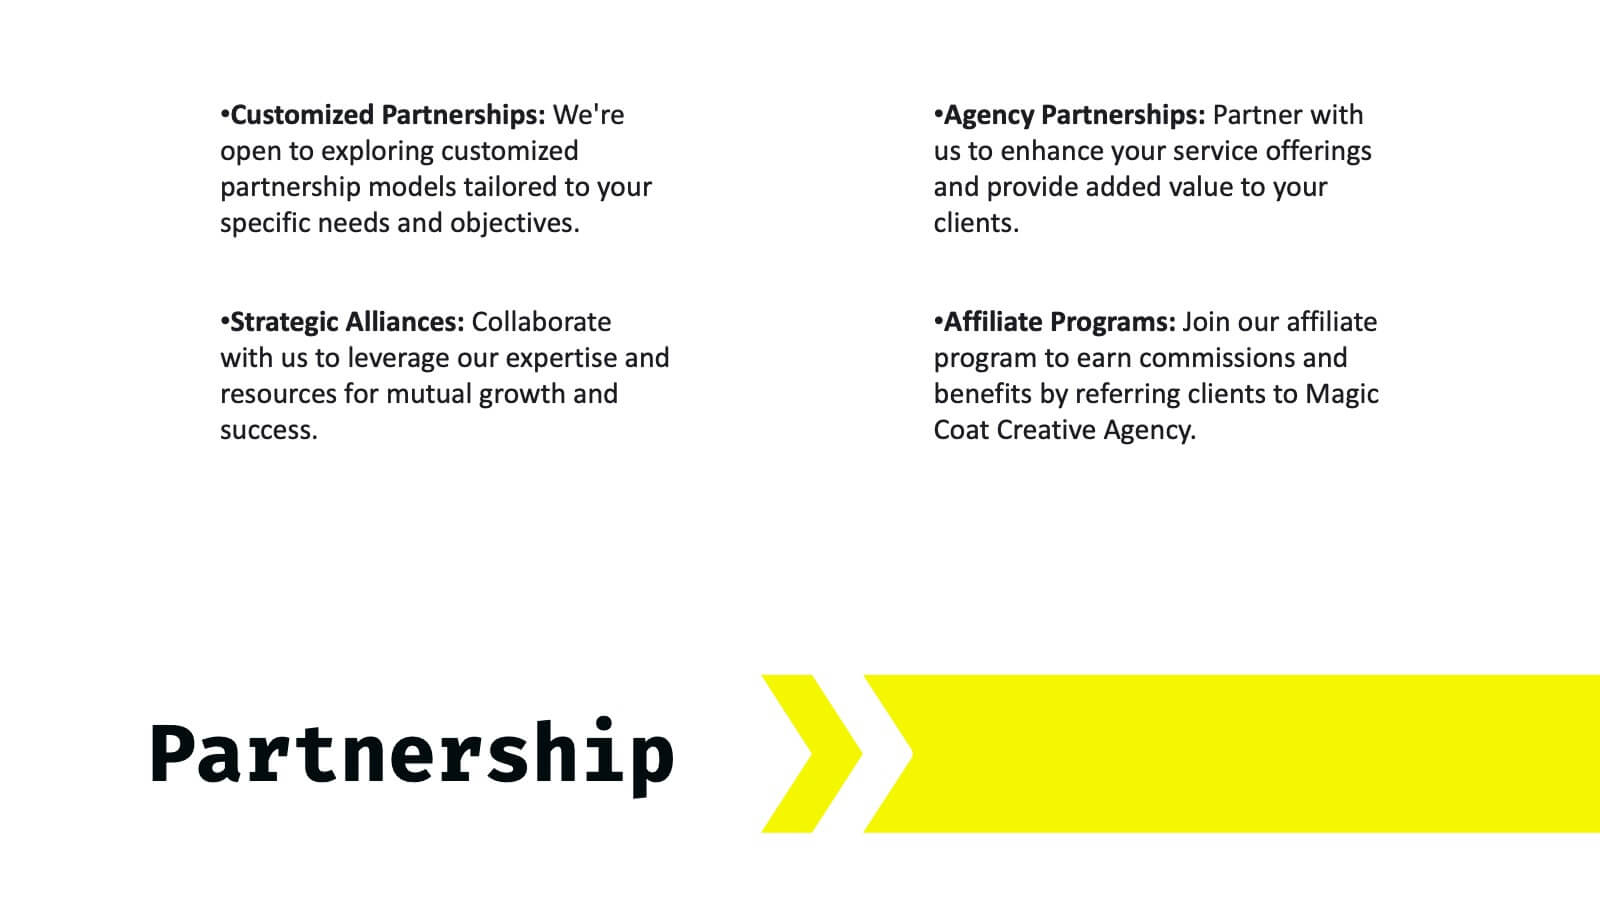
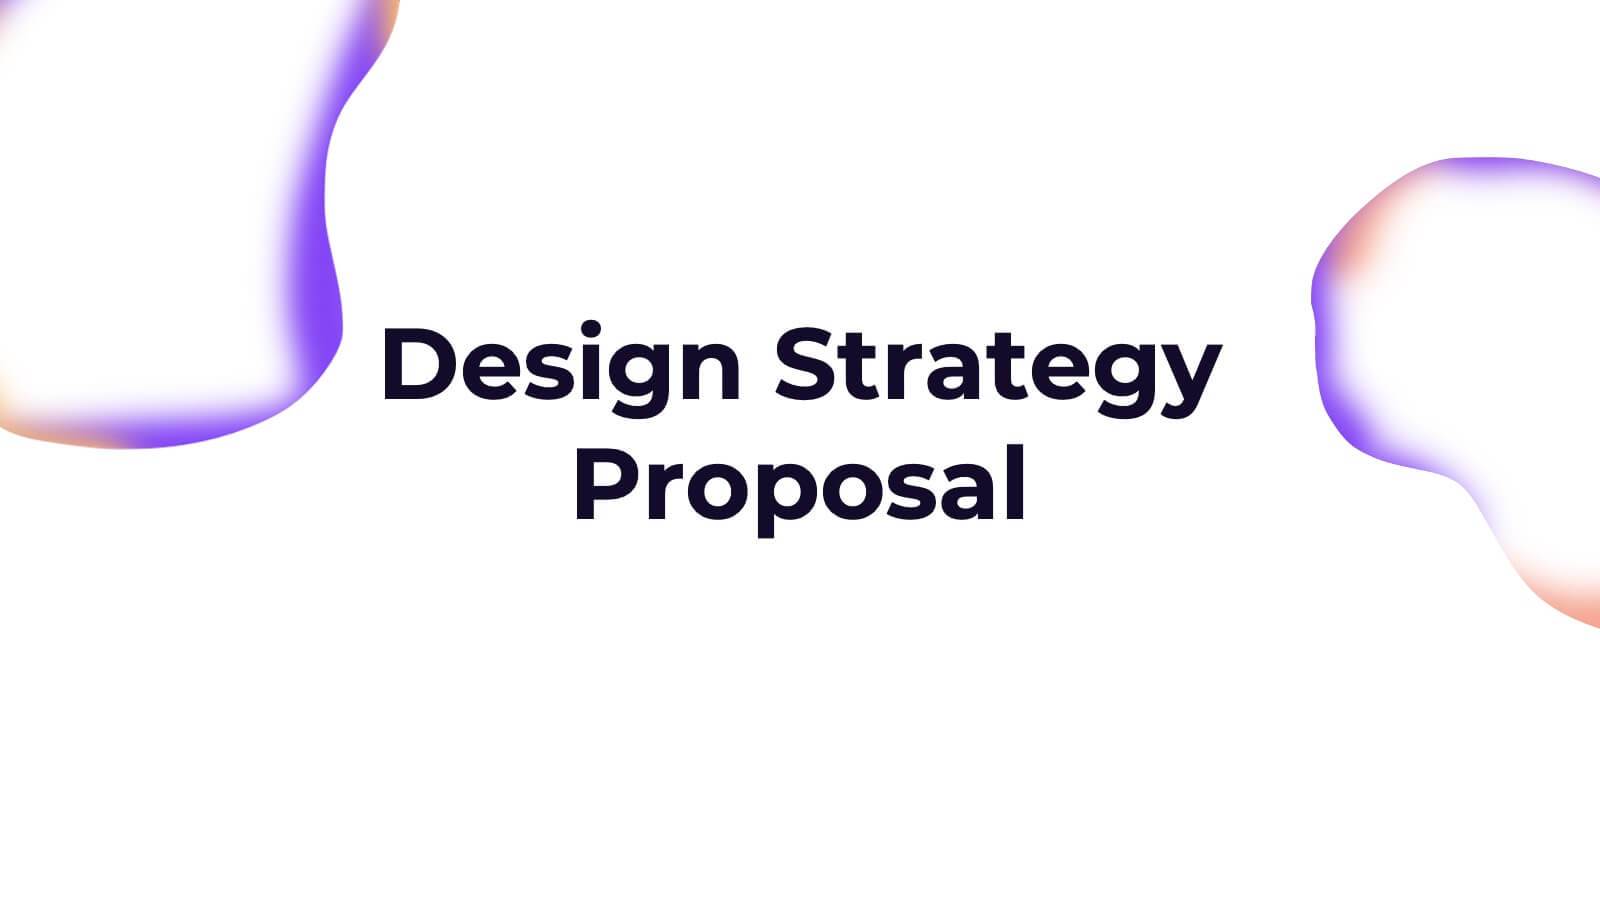
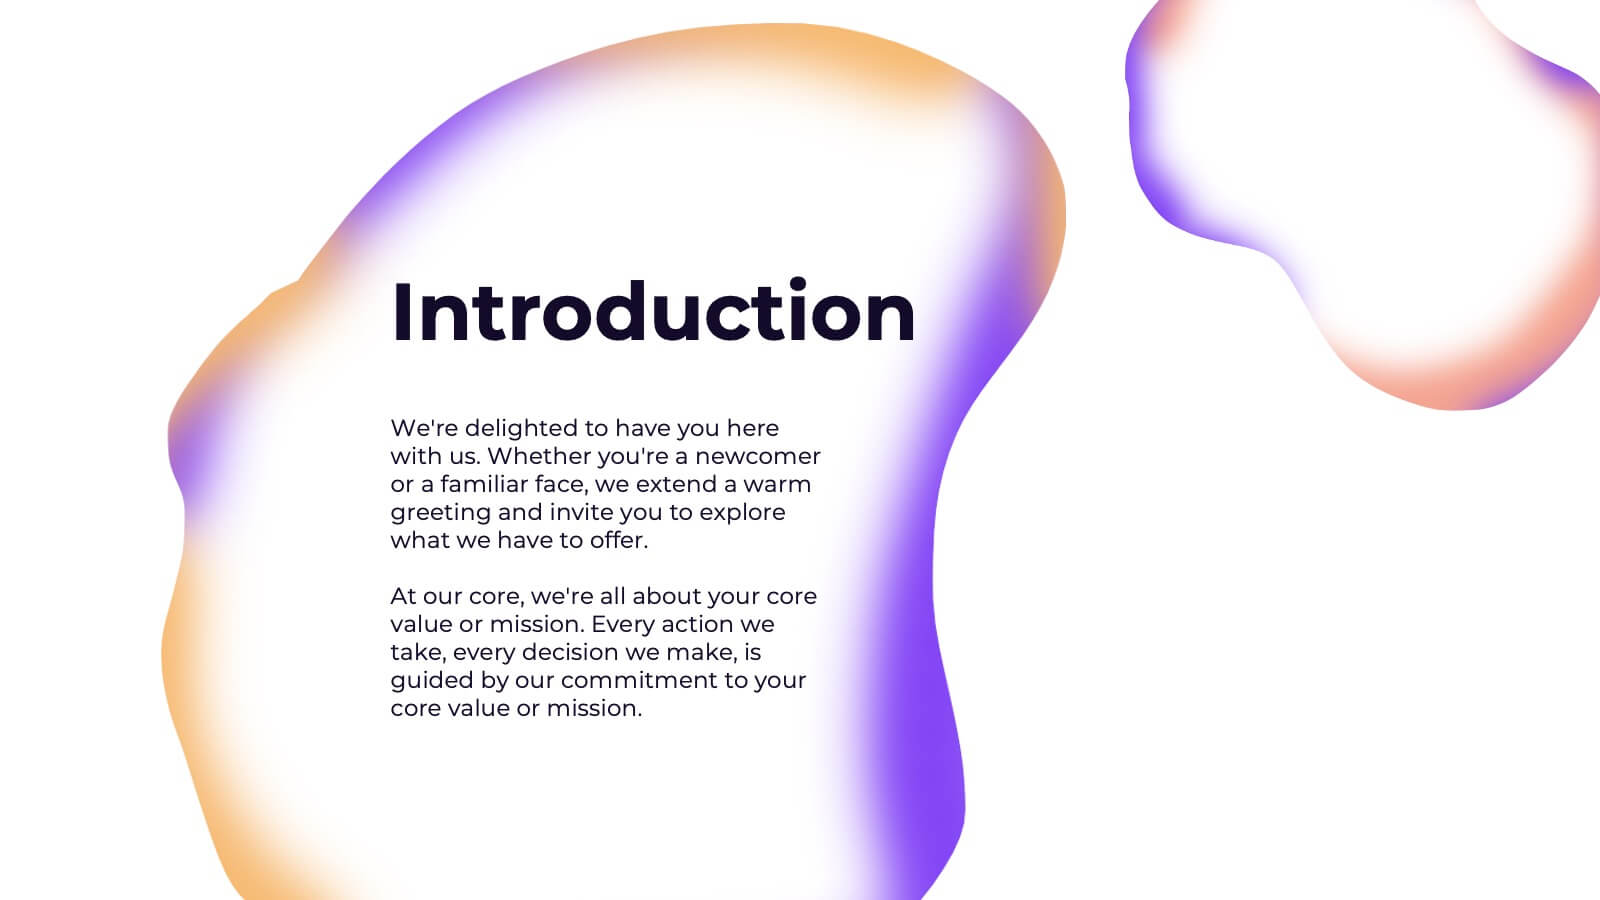
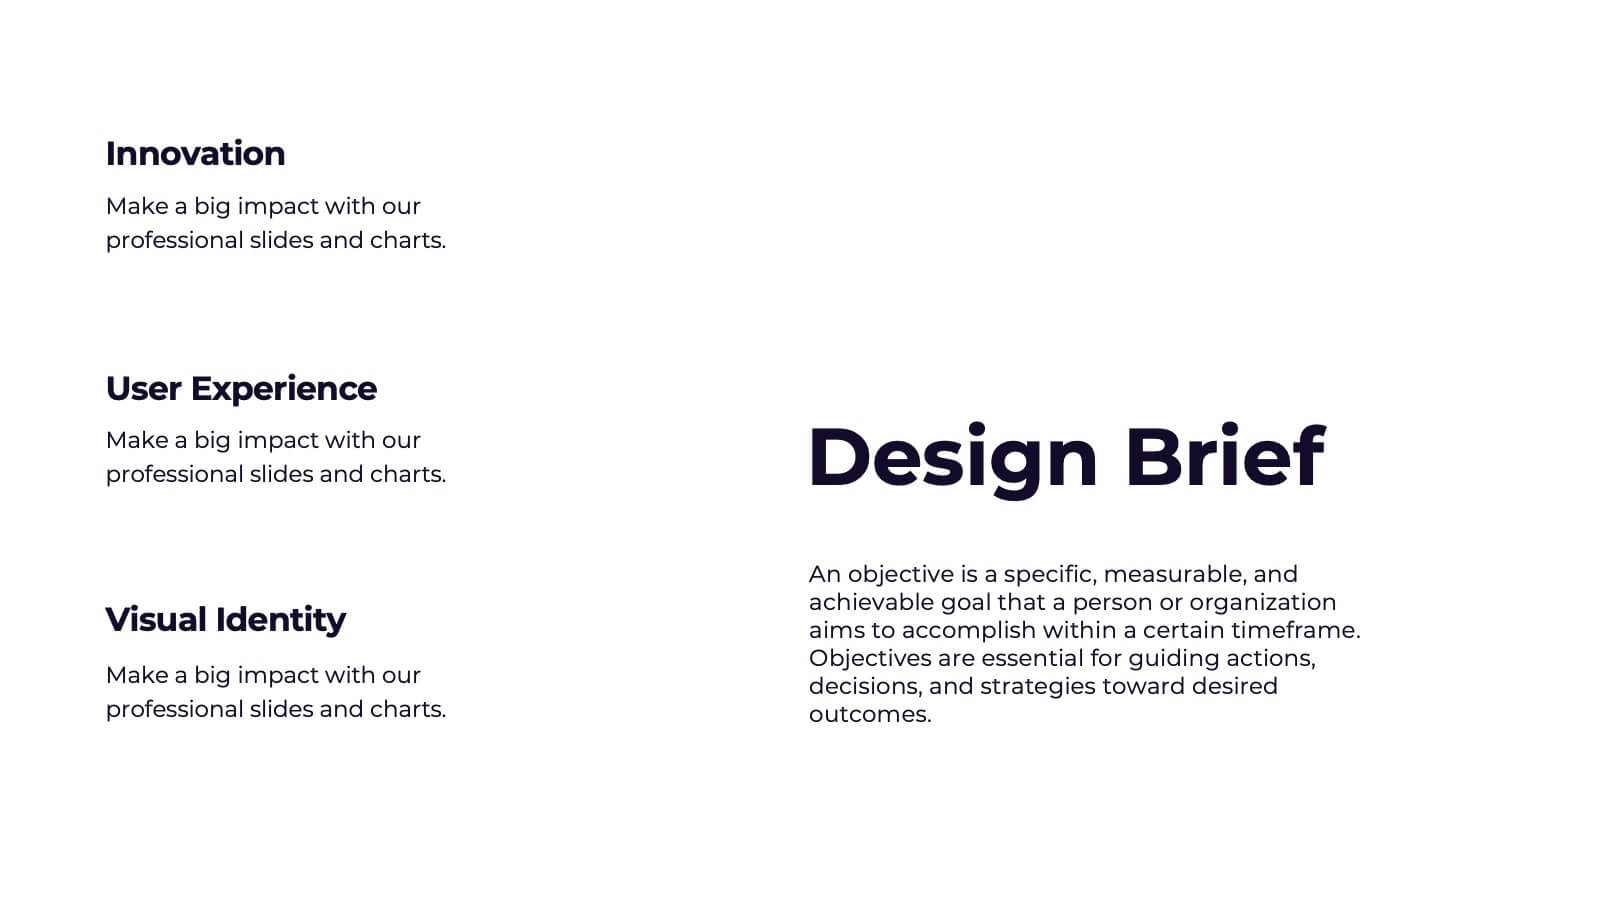
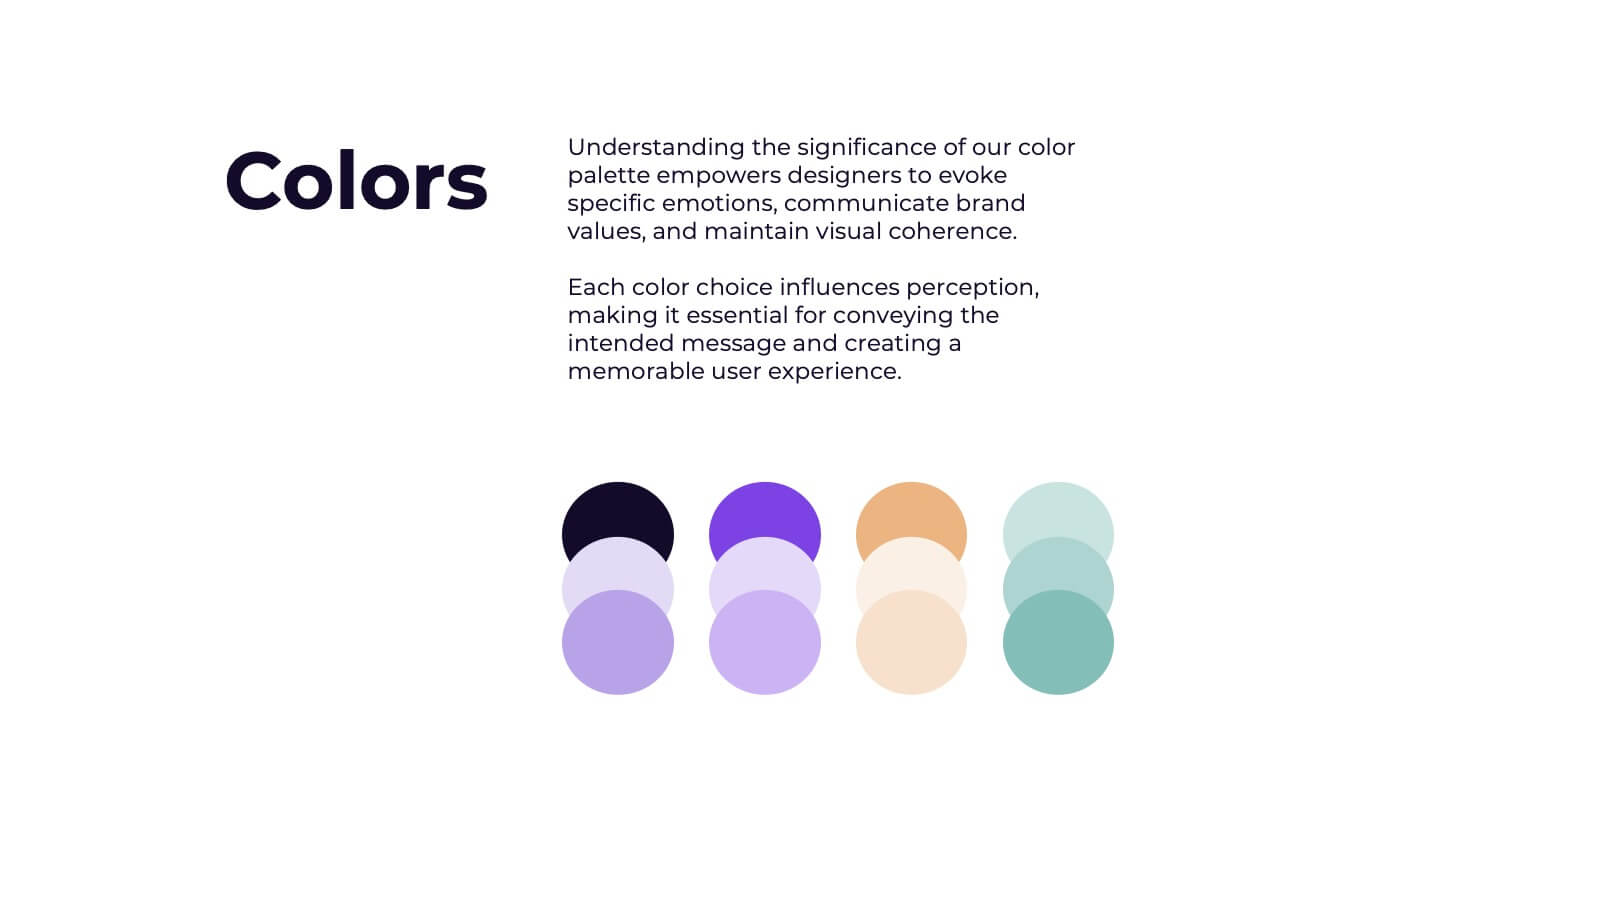
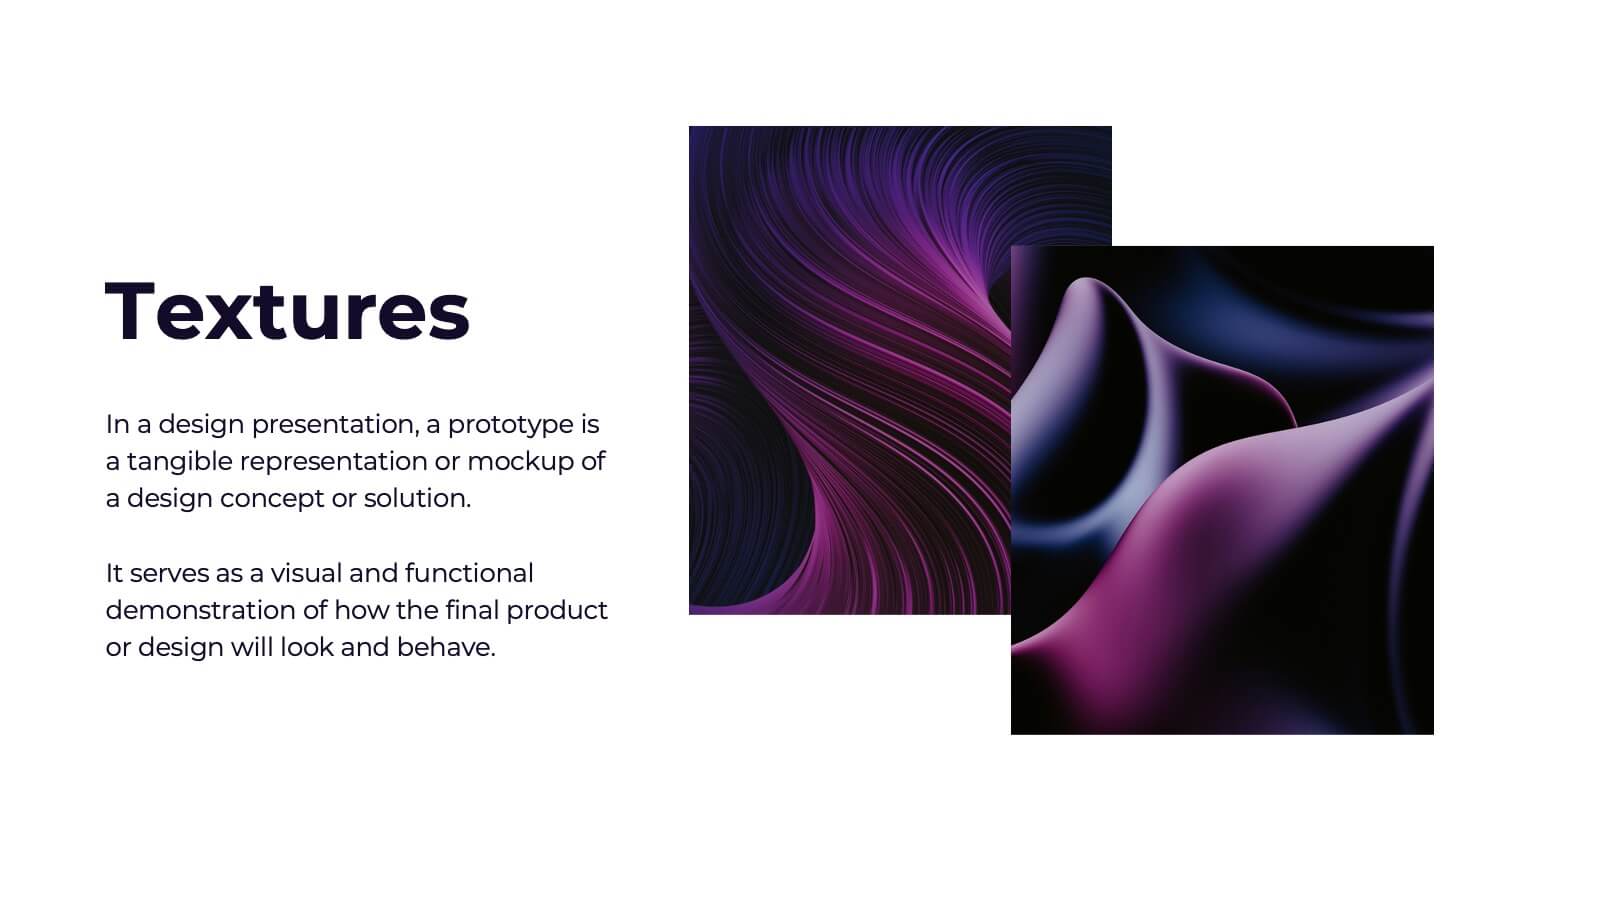
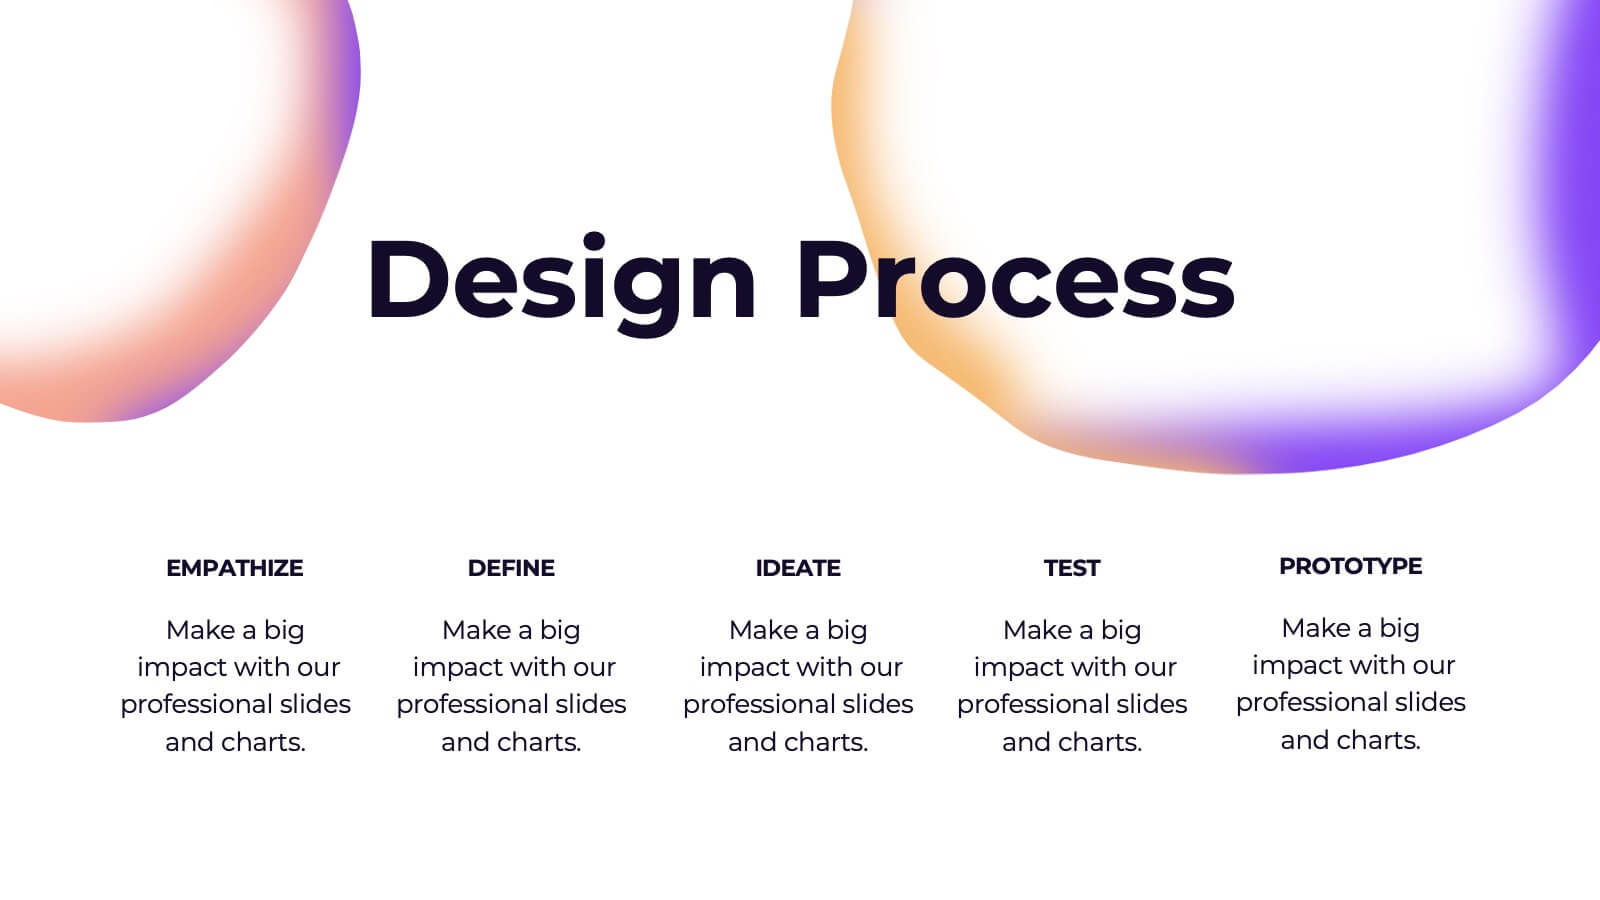
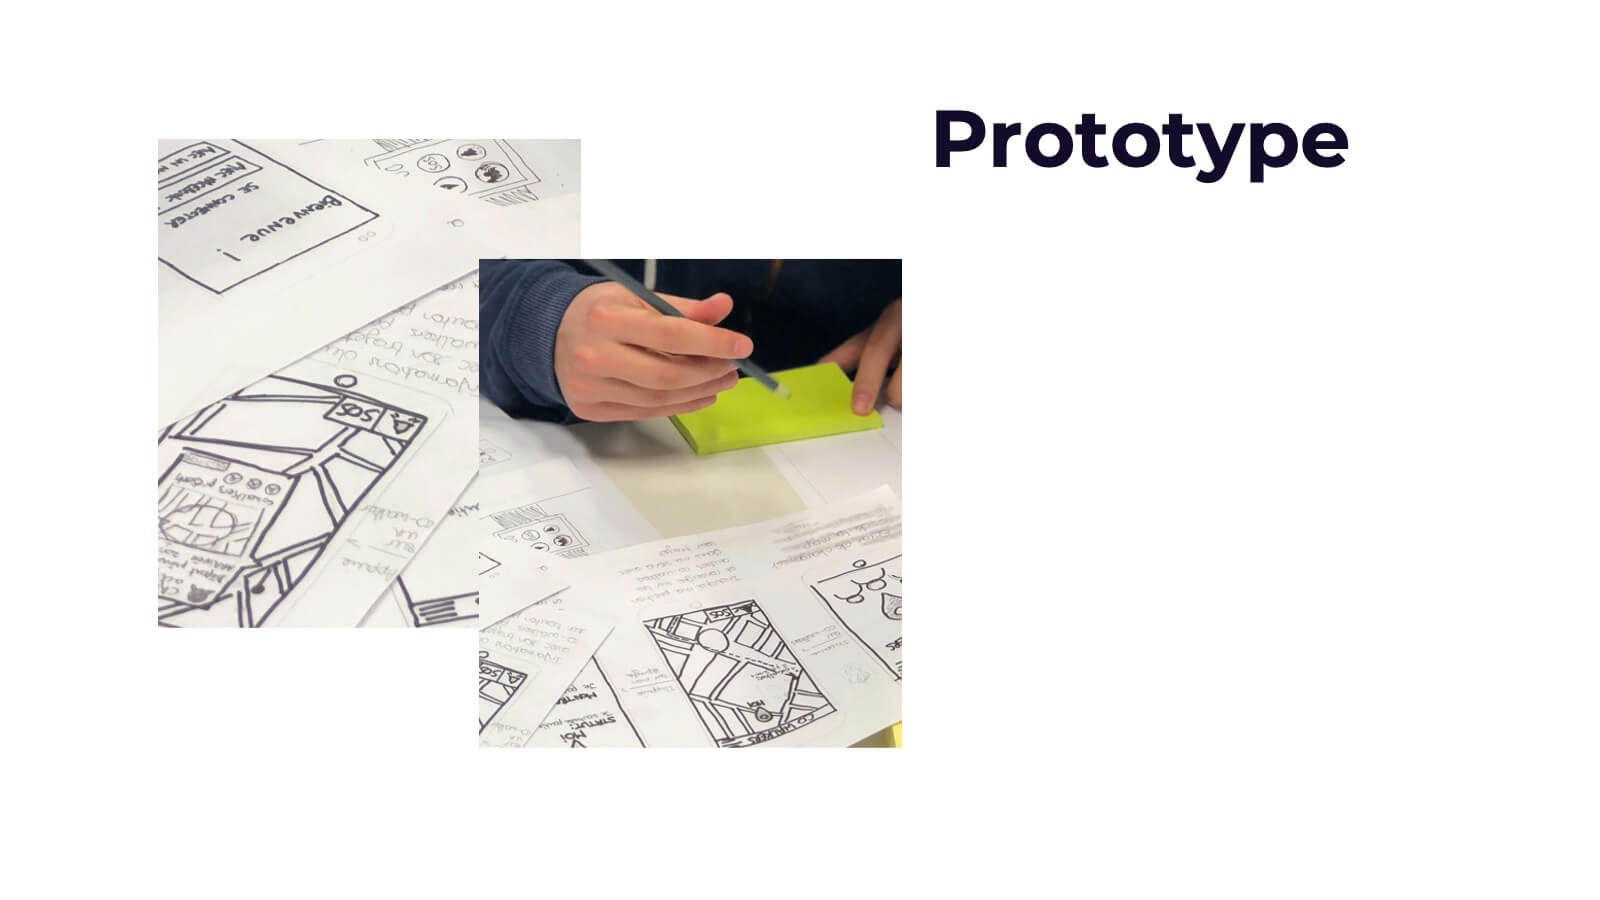
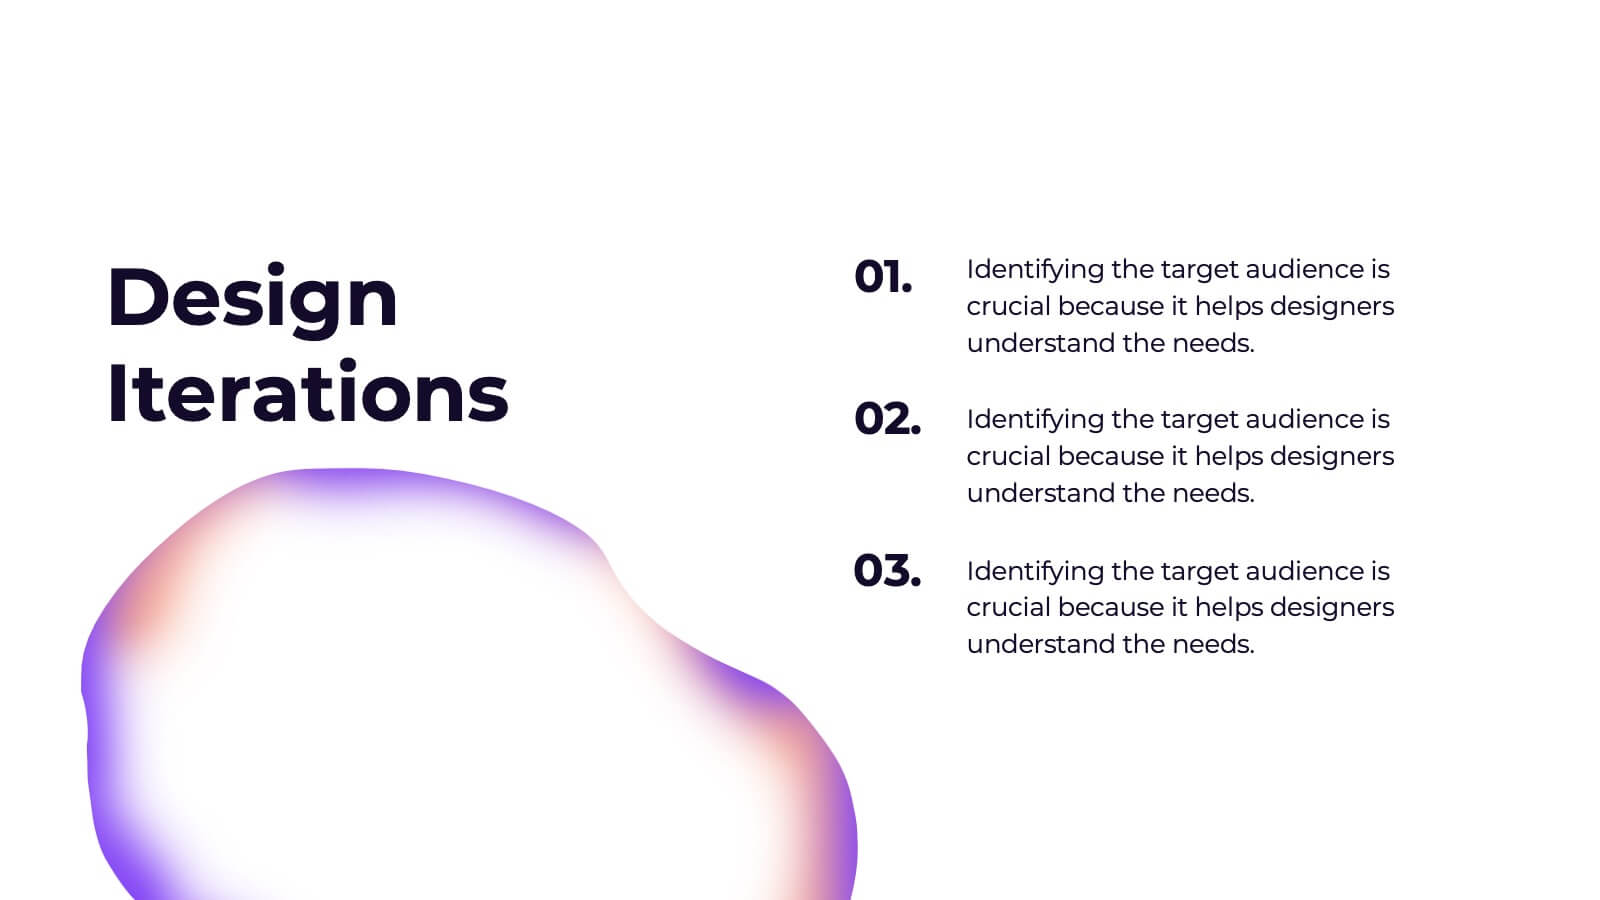
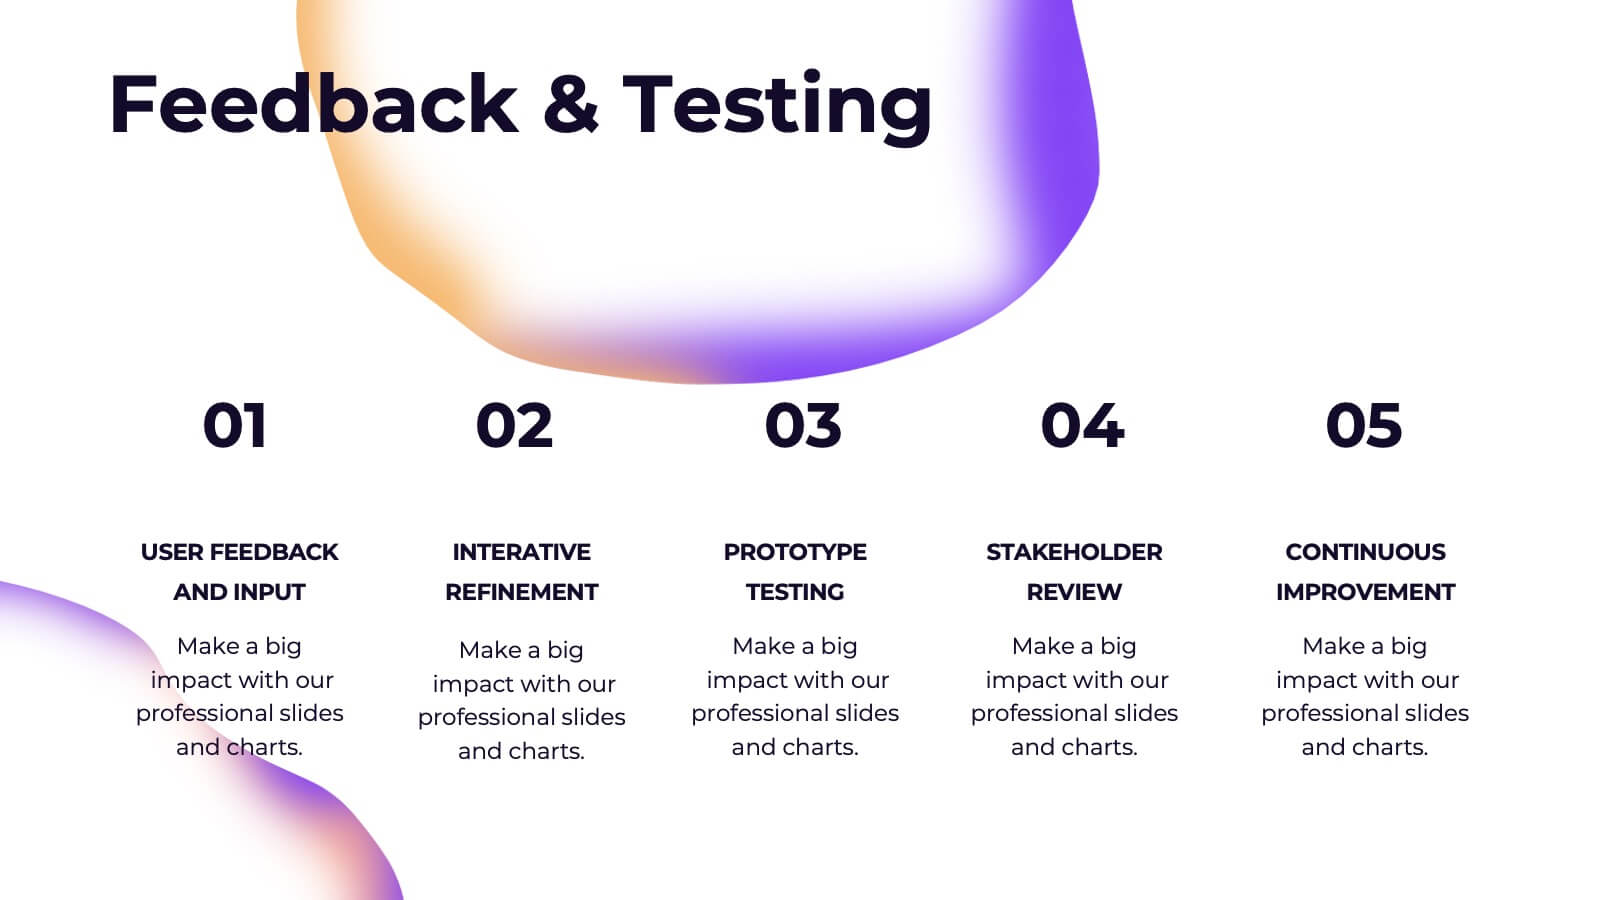
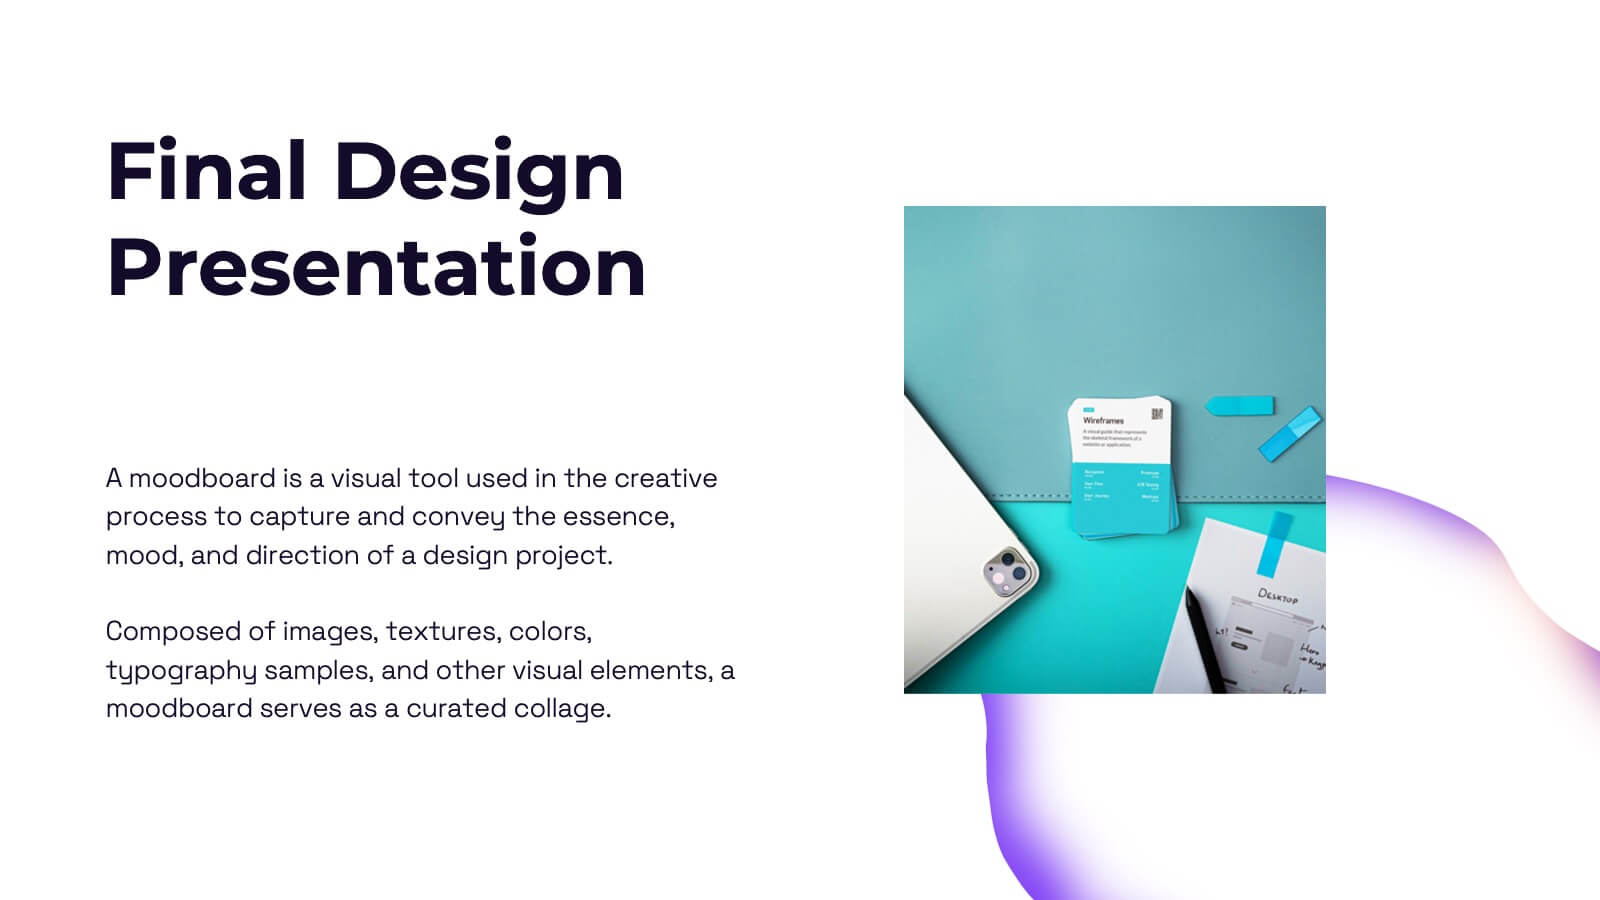
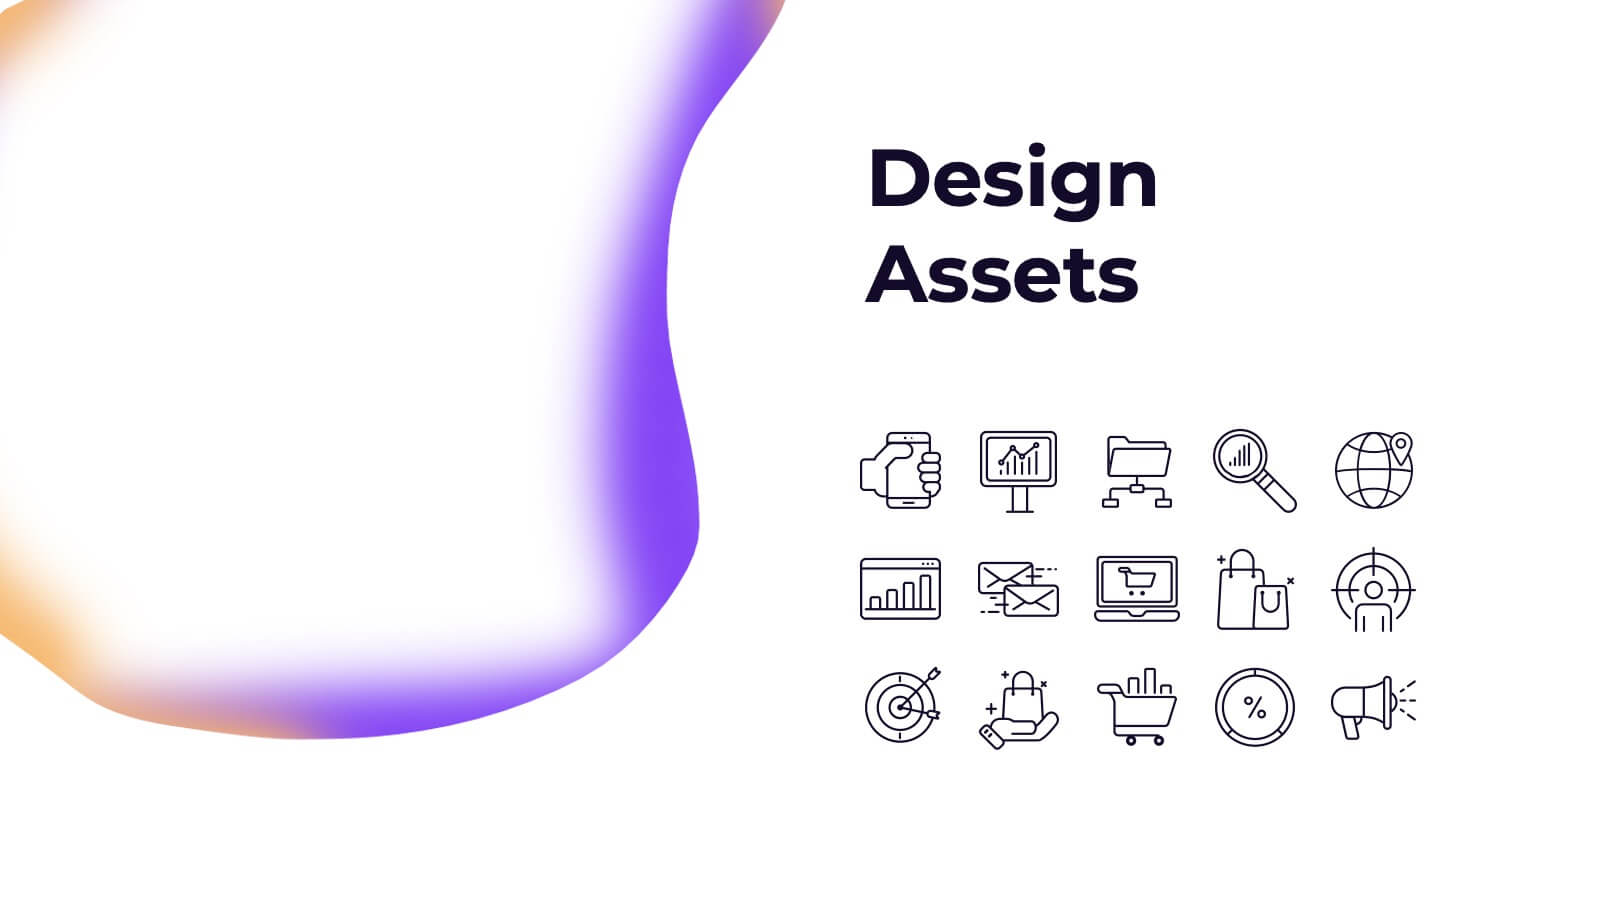
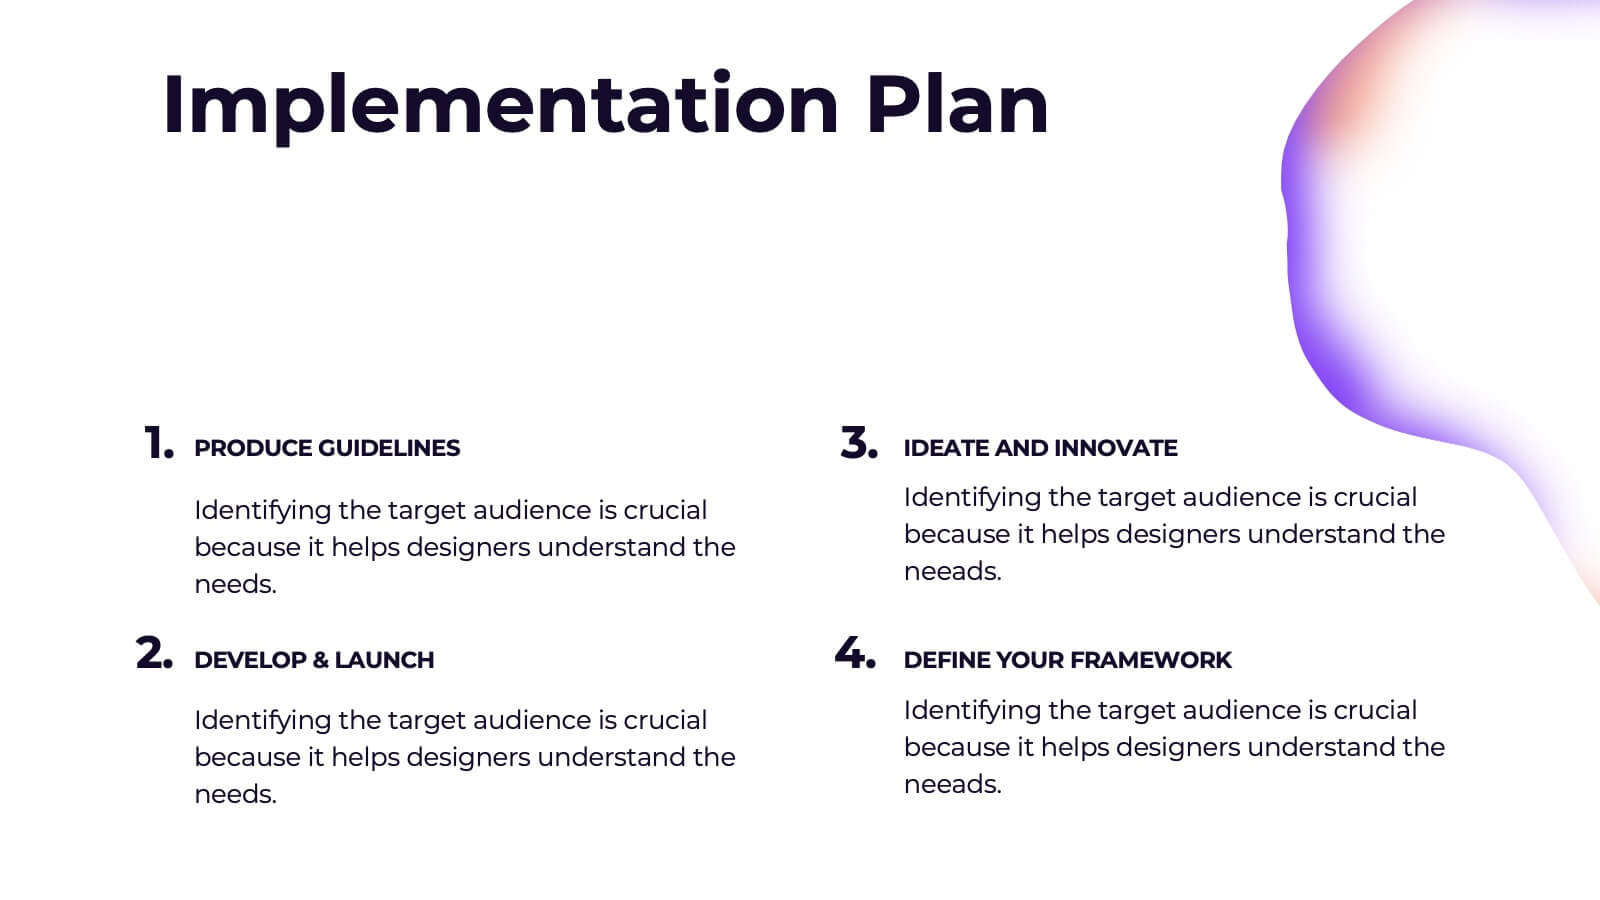
Valkyrie Design Strategy Proposal Presentation
Elevate your design strategy presentations with this visually captivating and modern template! It covers every step of the design process, from concept development and mood boards to prototype iterations and feedback. Ideal for showcasing design elements, textures, and assets, this template is perfect for creative professionals. Compatible with PowerPoint, Keynote, and Google Slides for easy, polished presentations.


6 diapositivas
Economic Trends in Africa Map Presentation
The Economic Trends in Africa Map template visually presents economic data across Africa. It displays regional economic shifts and trends, using an interactive map and related graphs. Ideal for analysts and investors, it offers clear insights for strategic decisions. Compatible with PowerPoint, Keynote, and Google Slides.


6 diapositivas
Business Law and Compliance
Simplify complex legal processes with this business law and compliance slide. Featuring a dynamic hexagon cycle diagram, it’s ideal for showcasing policies, regulatory frameworks, and compliance workflows. Designed for corporate, legal, and risk management presentations. Fully editable and compatible with PowerPoint, Keynote, and Google Slides.


21 diapositivas
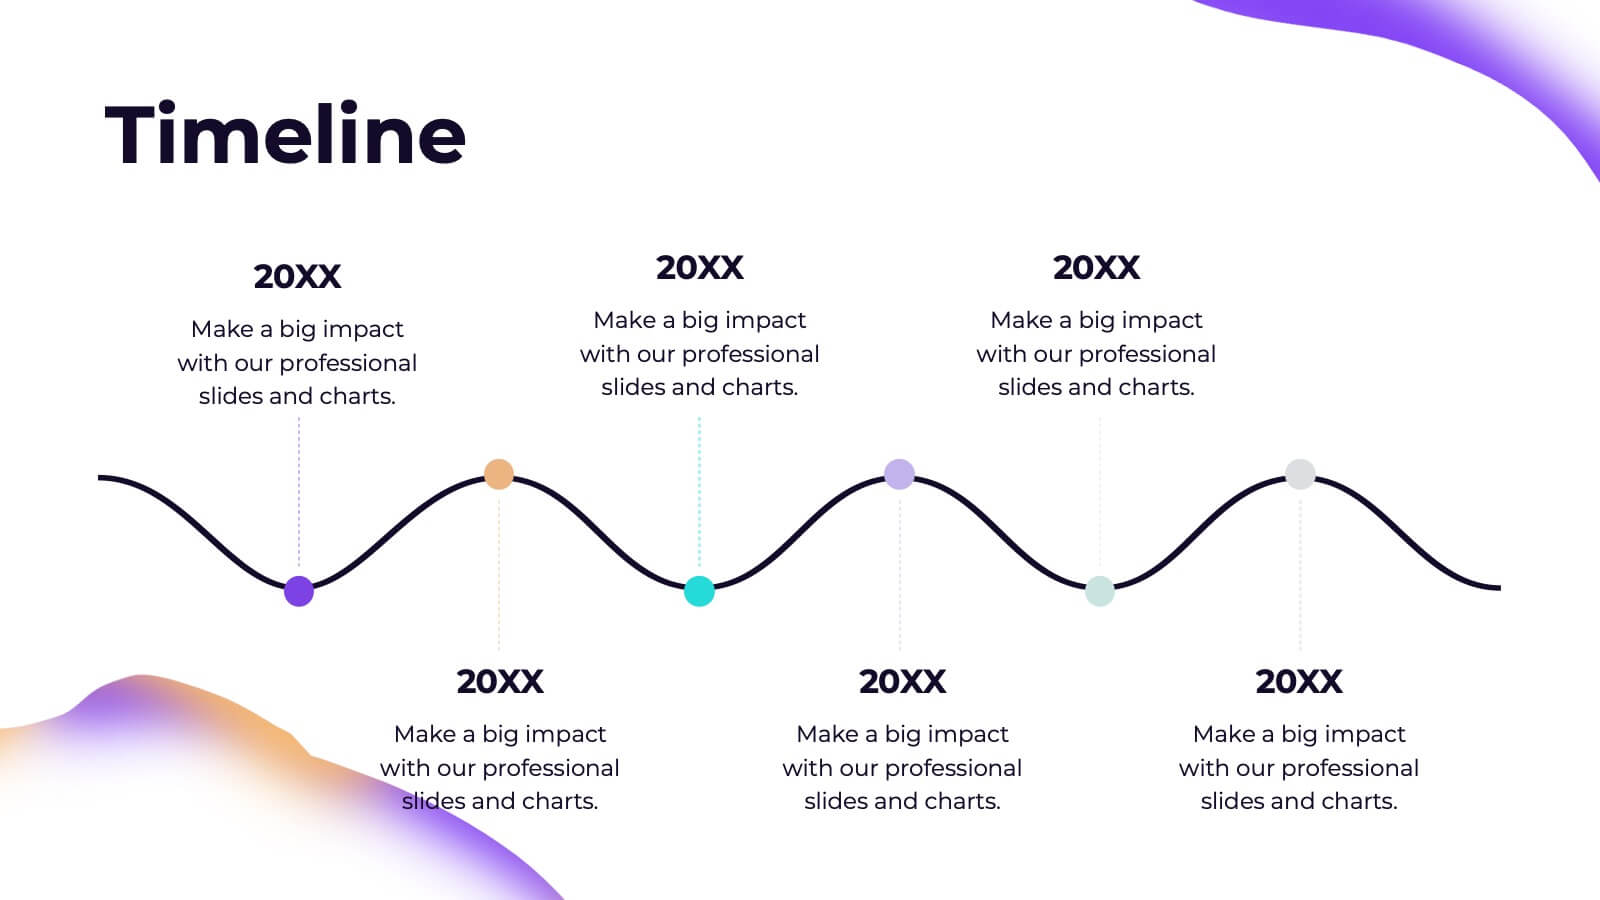
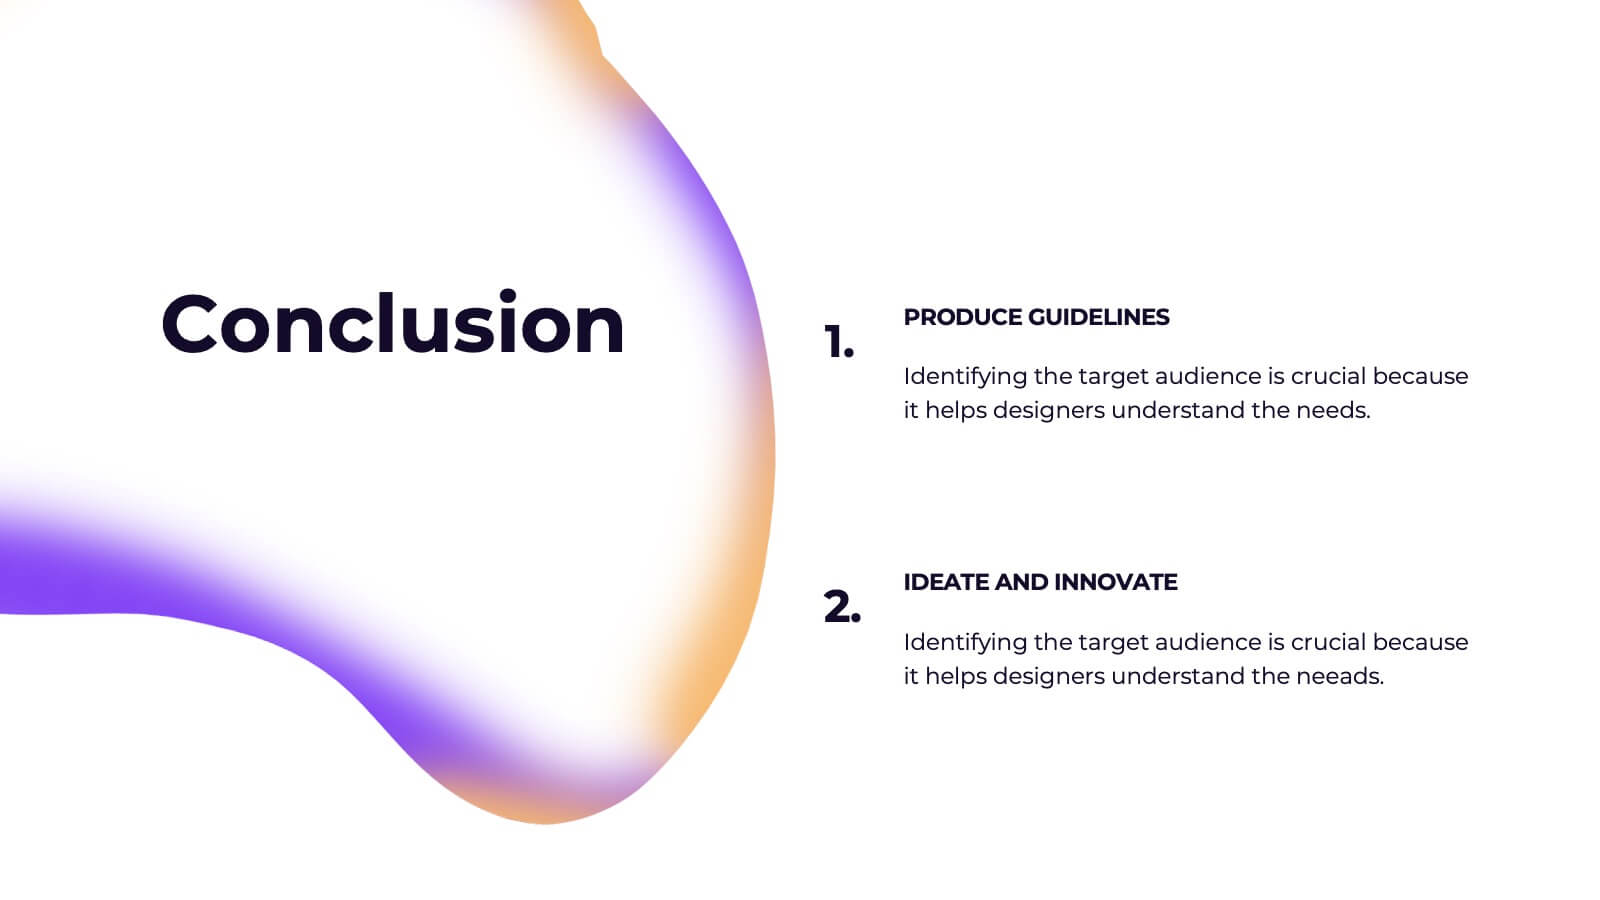
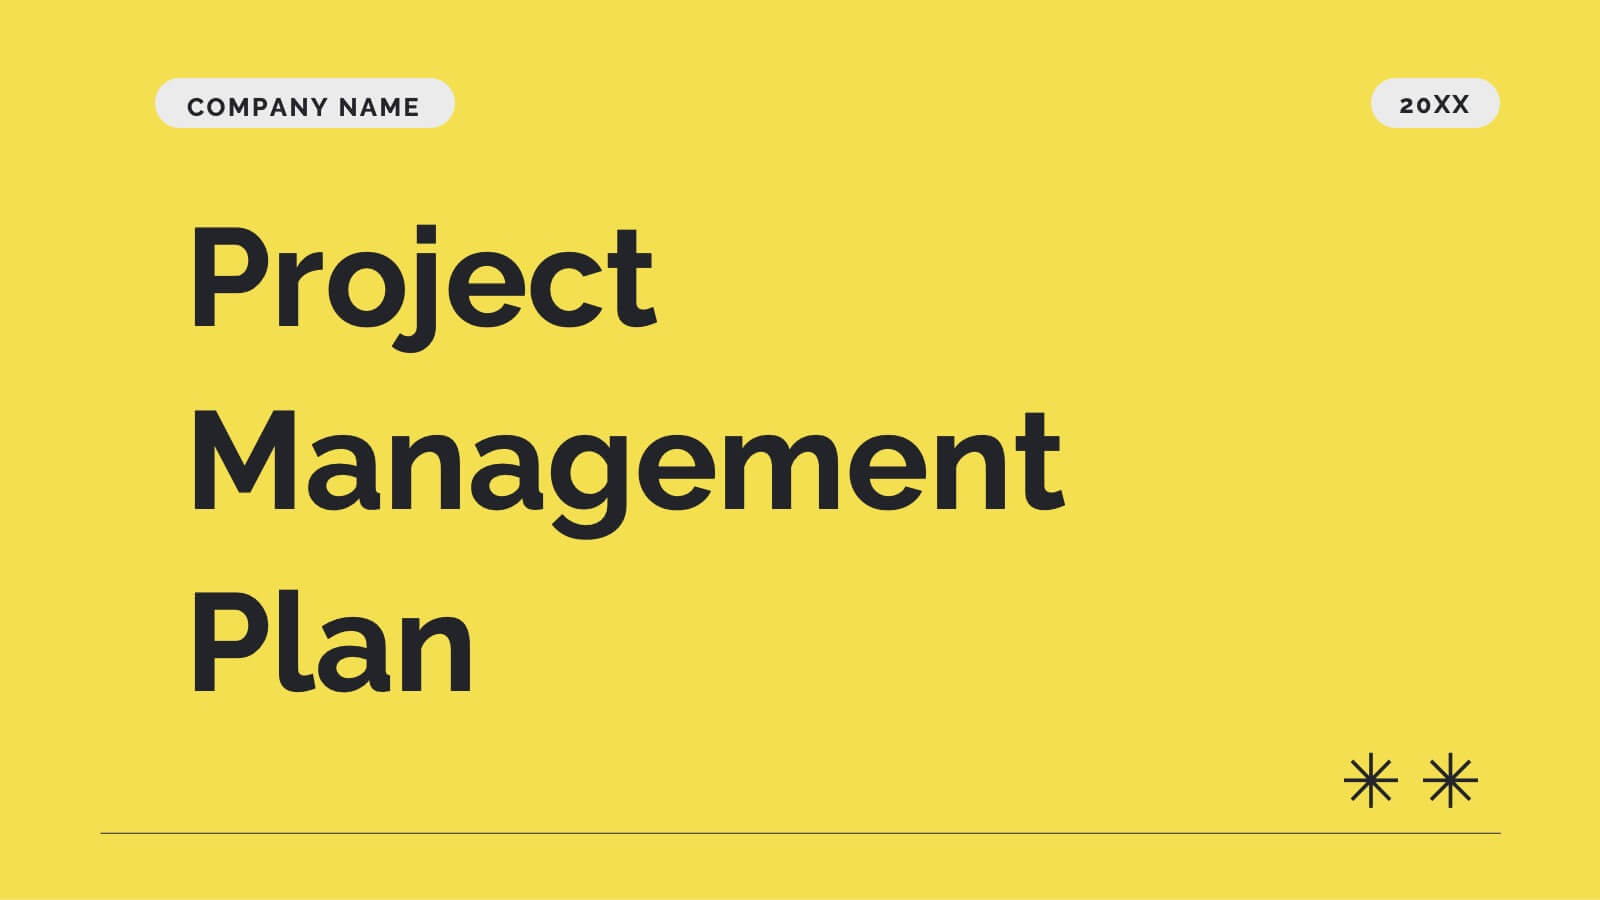
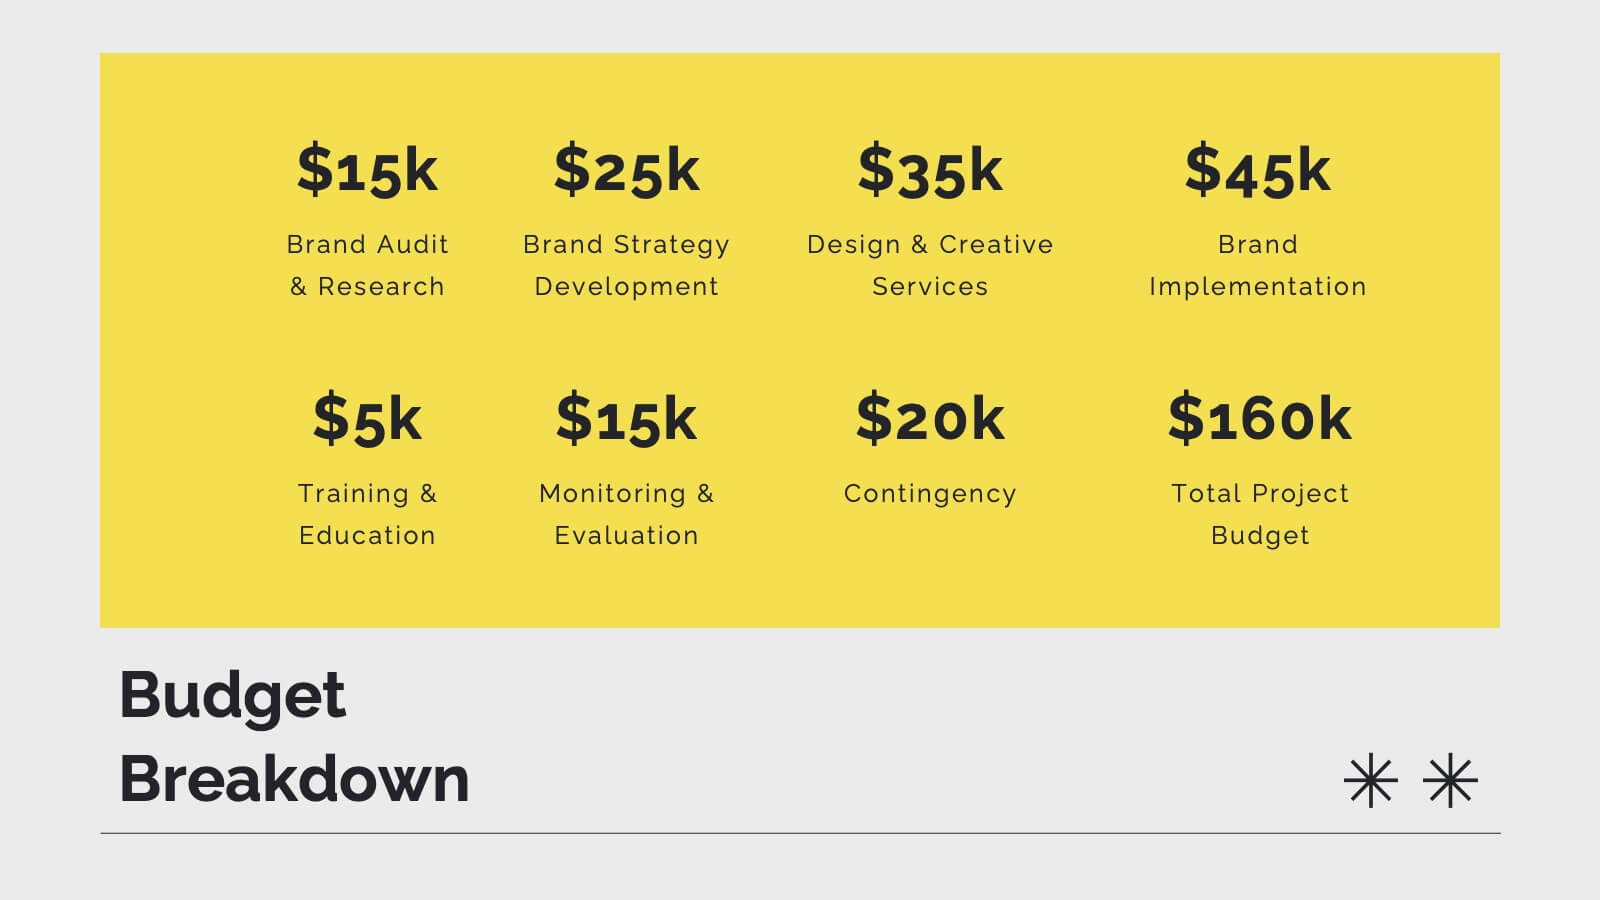
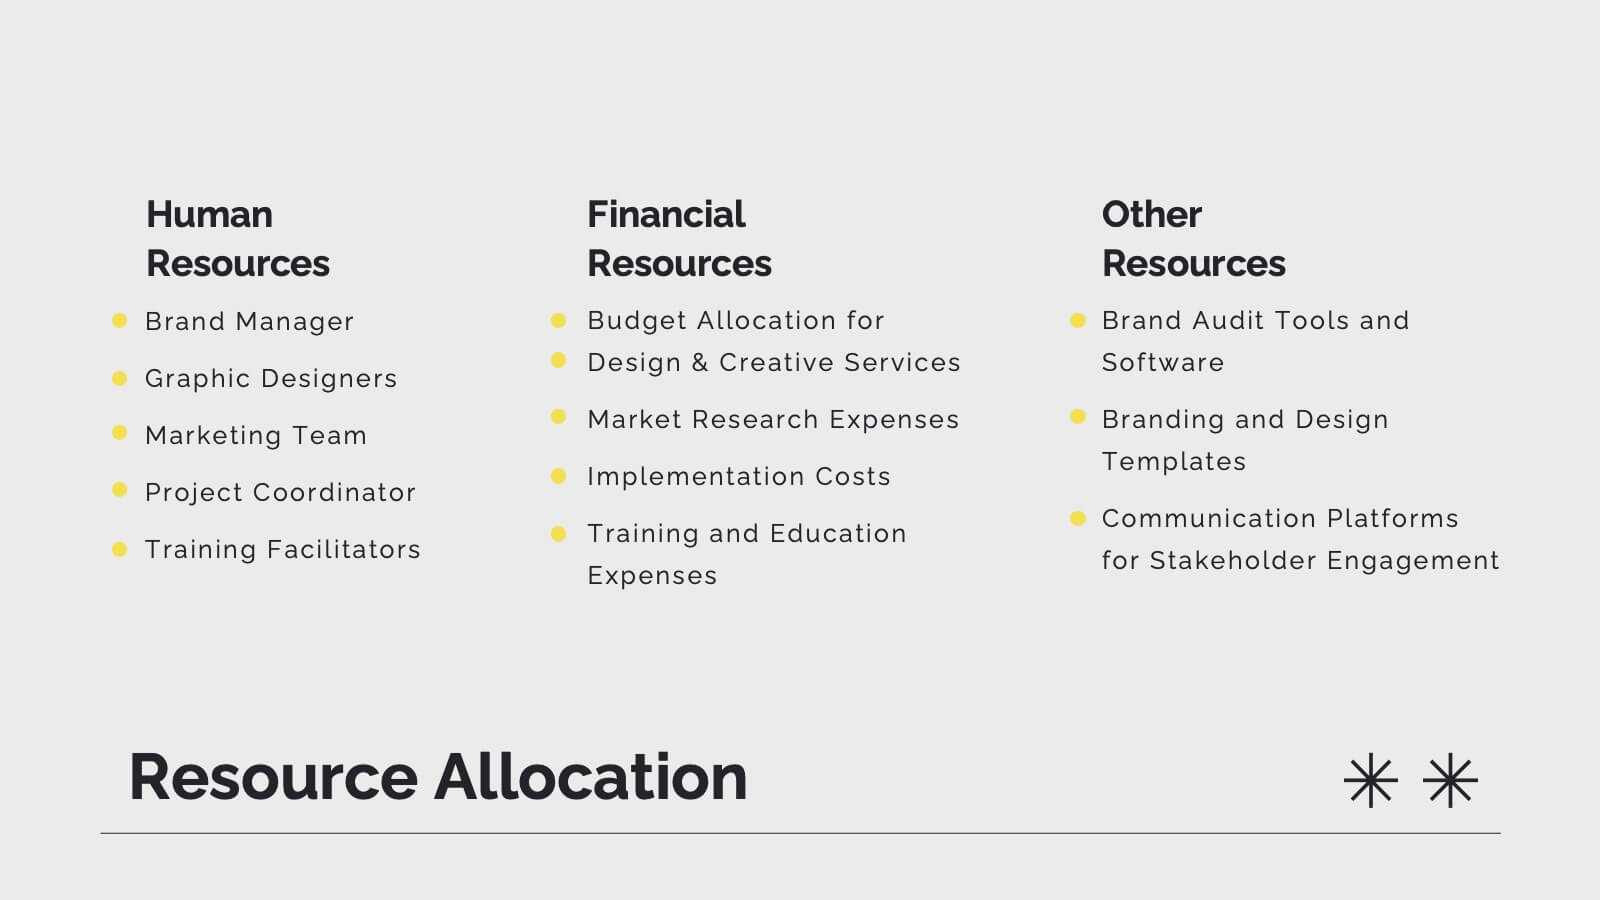
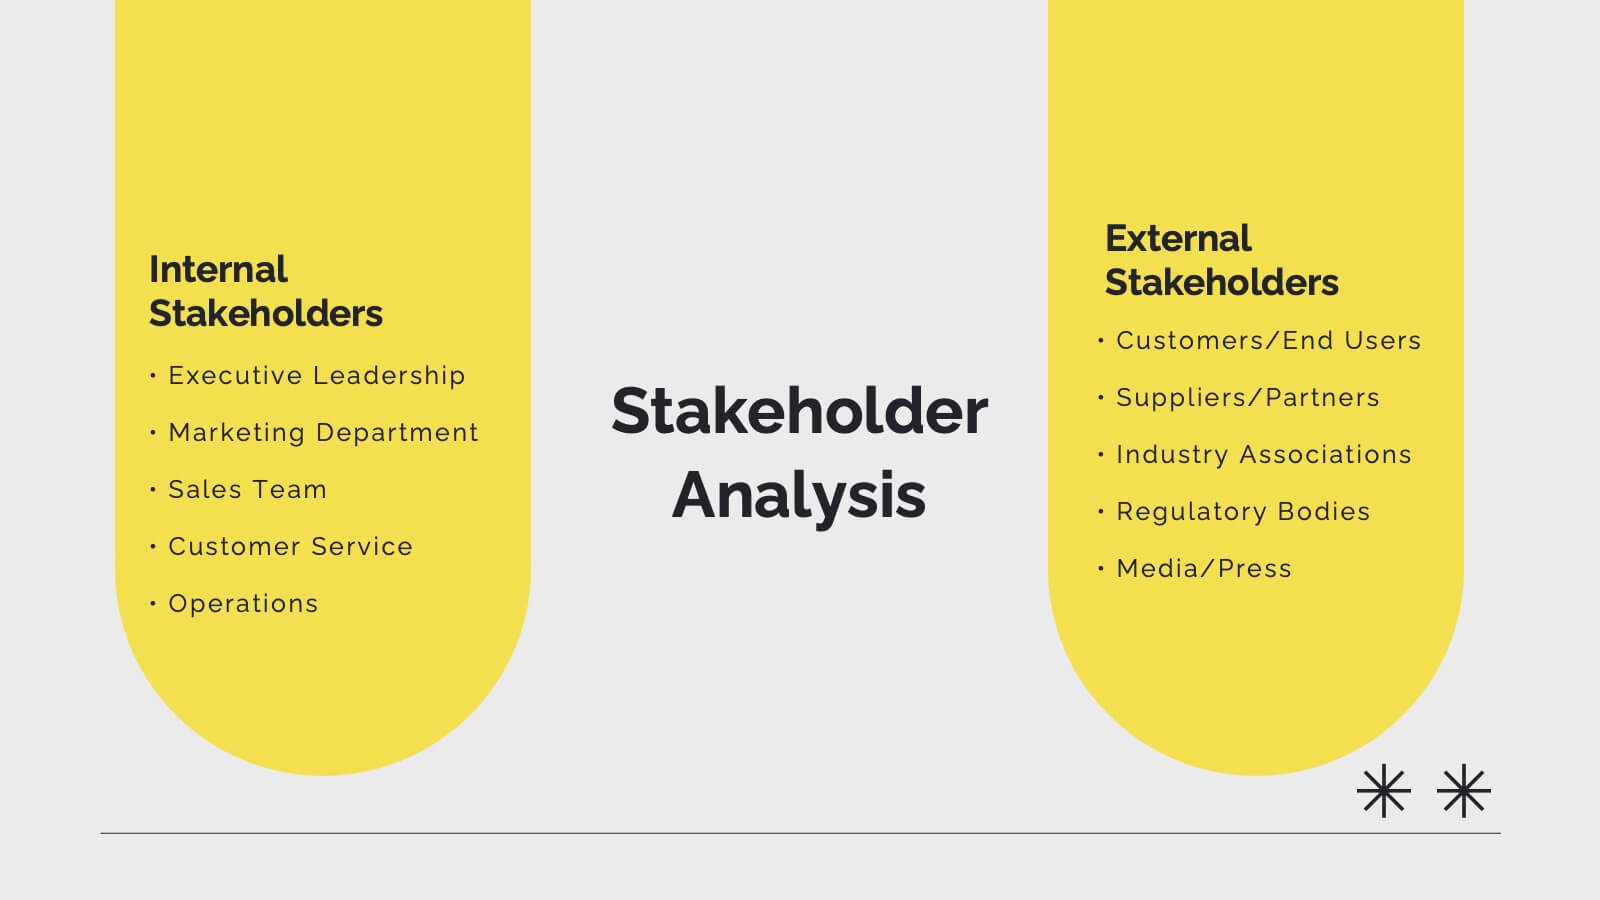
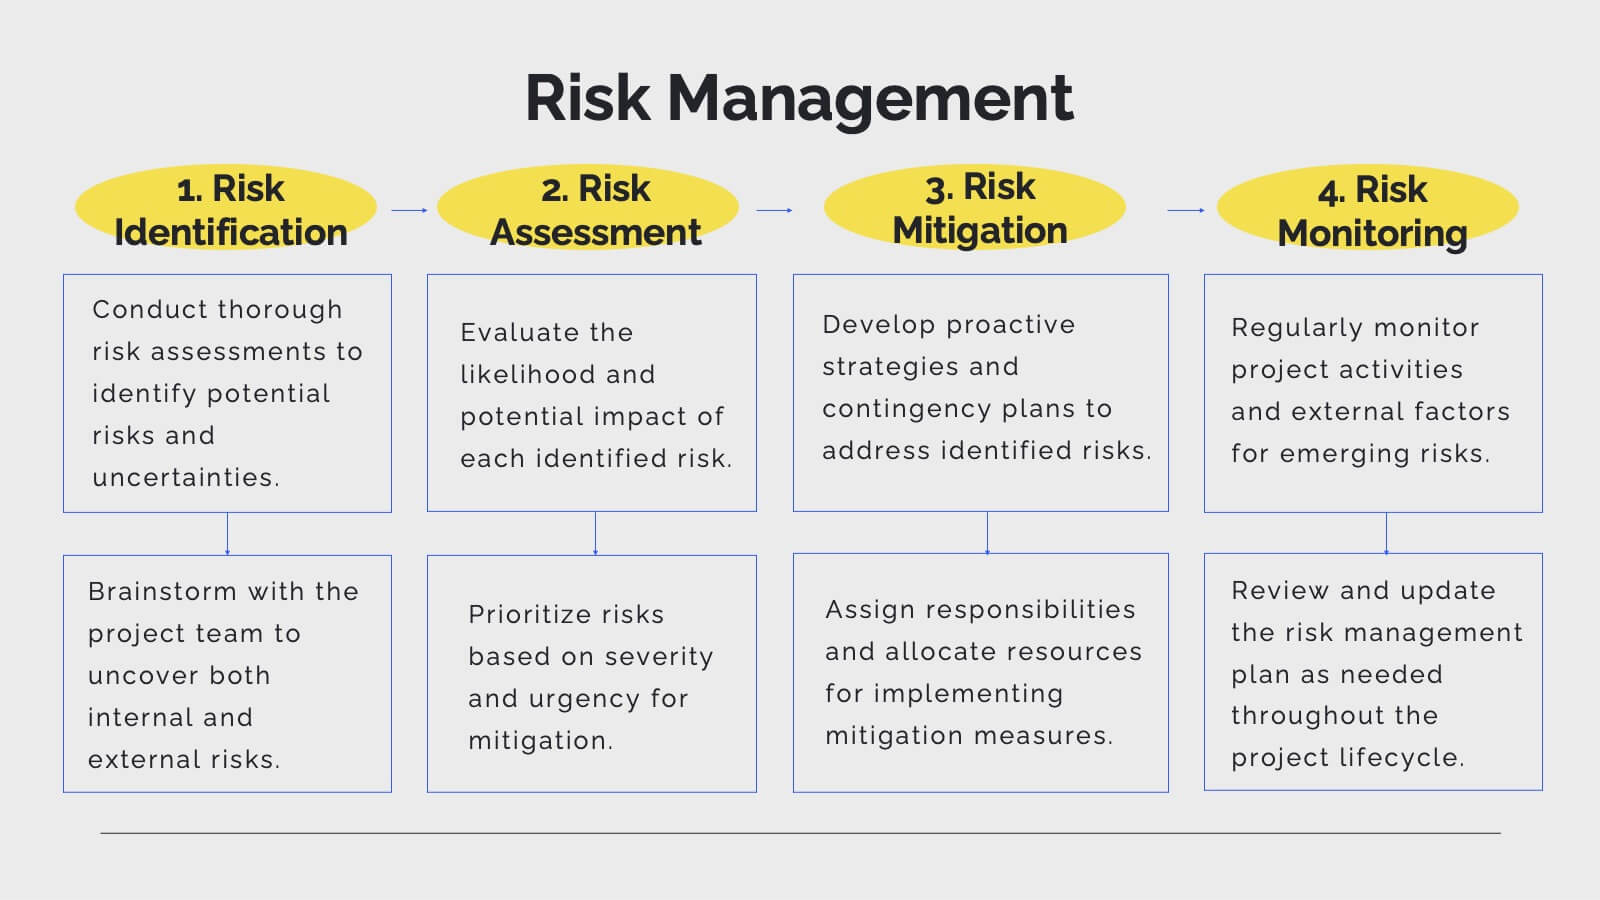
Pulse Project Management Plan Presentation
Streamline your project management with this vibrant template. It covers project overview, objectives, deliverables, methodology, timeline, budget, and risk management. Perfect for clear and engaging presentations. Compatible with PowerPoint, Keynote, and Google Slides for seamless customization.