


Características


¿Tienes alguna pregunta?
Recomendar


6 diapositivas
SCRUM Methodology Infographic
Scrum is a widely used agile project management framework that helps teams work collaboratively to develop complex products. This infographic template is designed to provide a quick overview of SCRUM for teams, stakeholders, or anyone interested in understanding its fundamental concepts. This template is well-suited for projects where requirements are constantly changing or not fully known at the start. This is characterized by its iterative and incremental approach, enabling teams to deliver high-quality products in a flexible and adaptive manner. This is a popular agile methodology used in software development and project management.
25 diapositivas
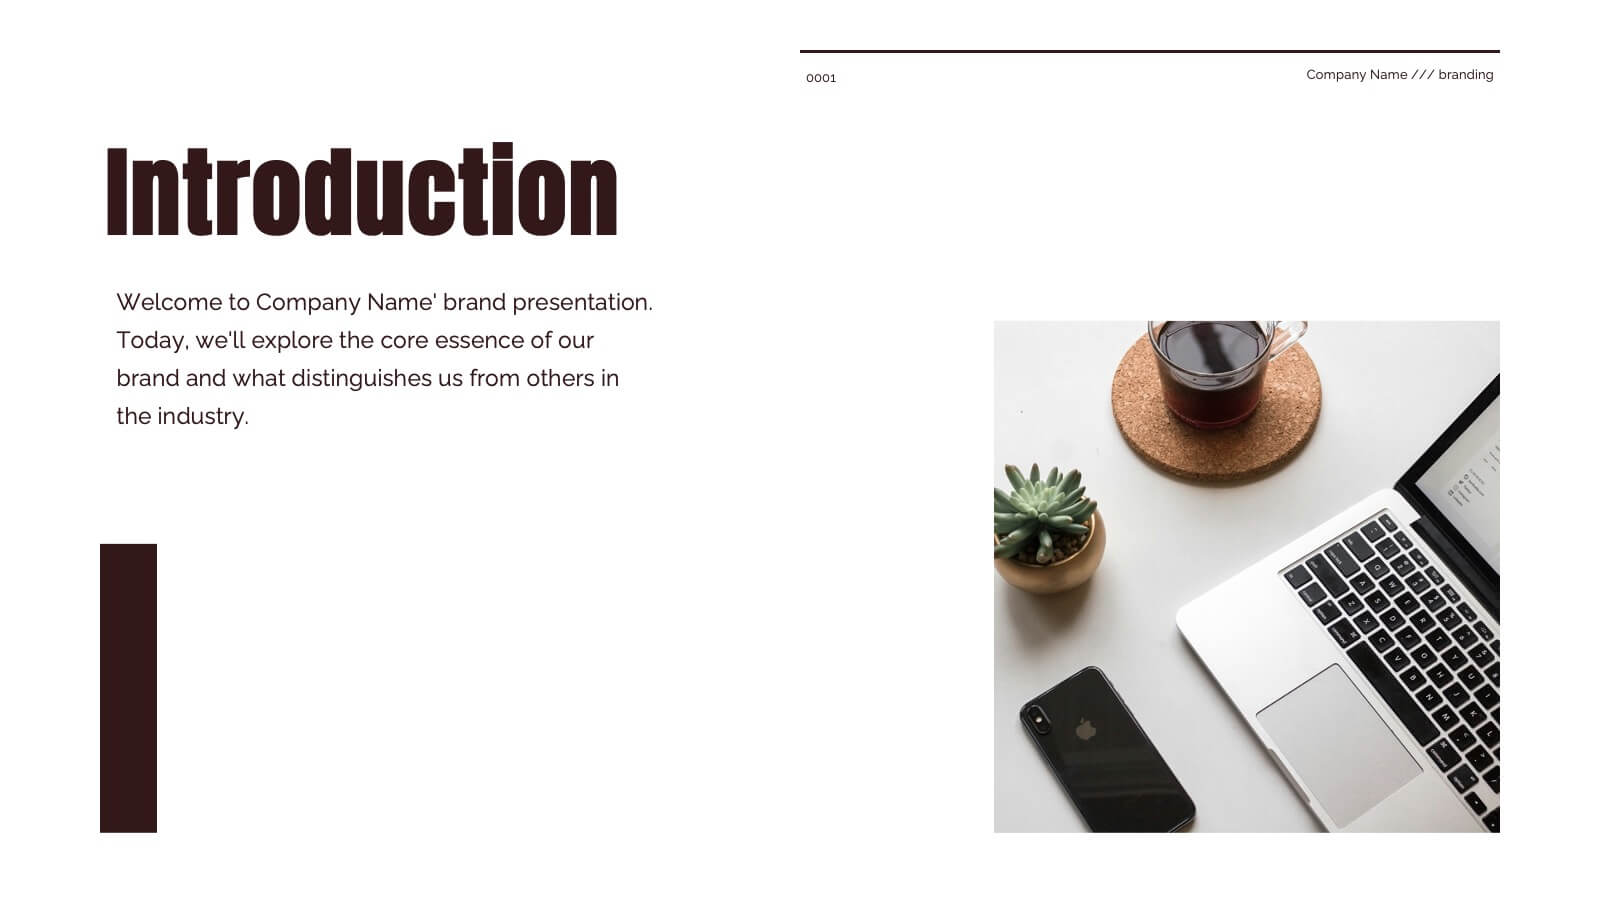
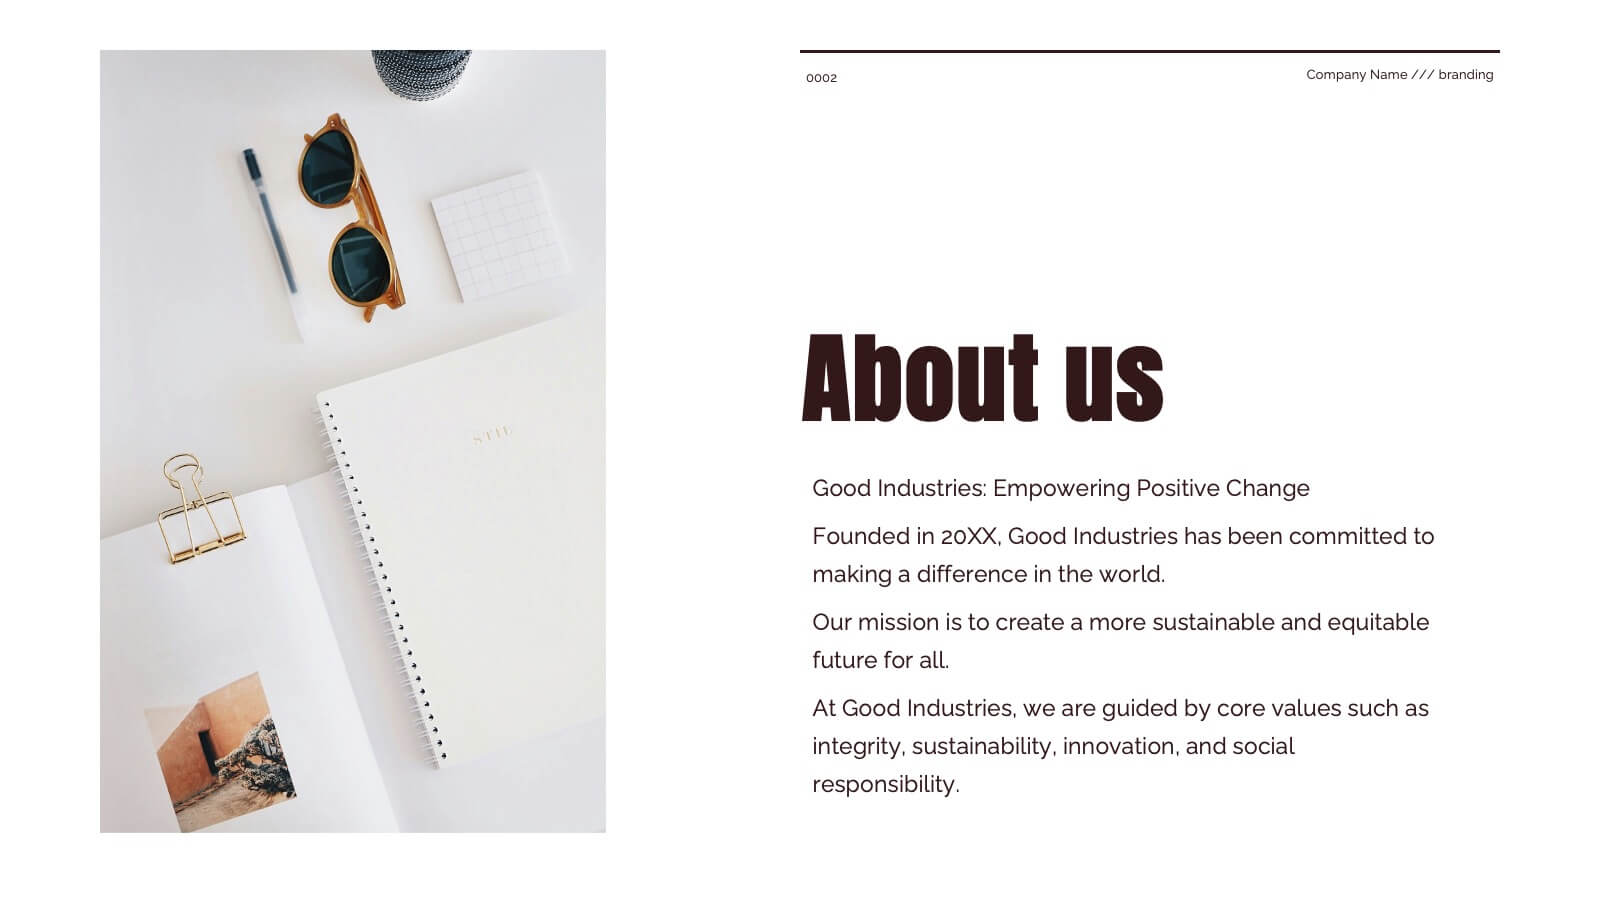
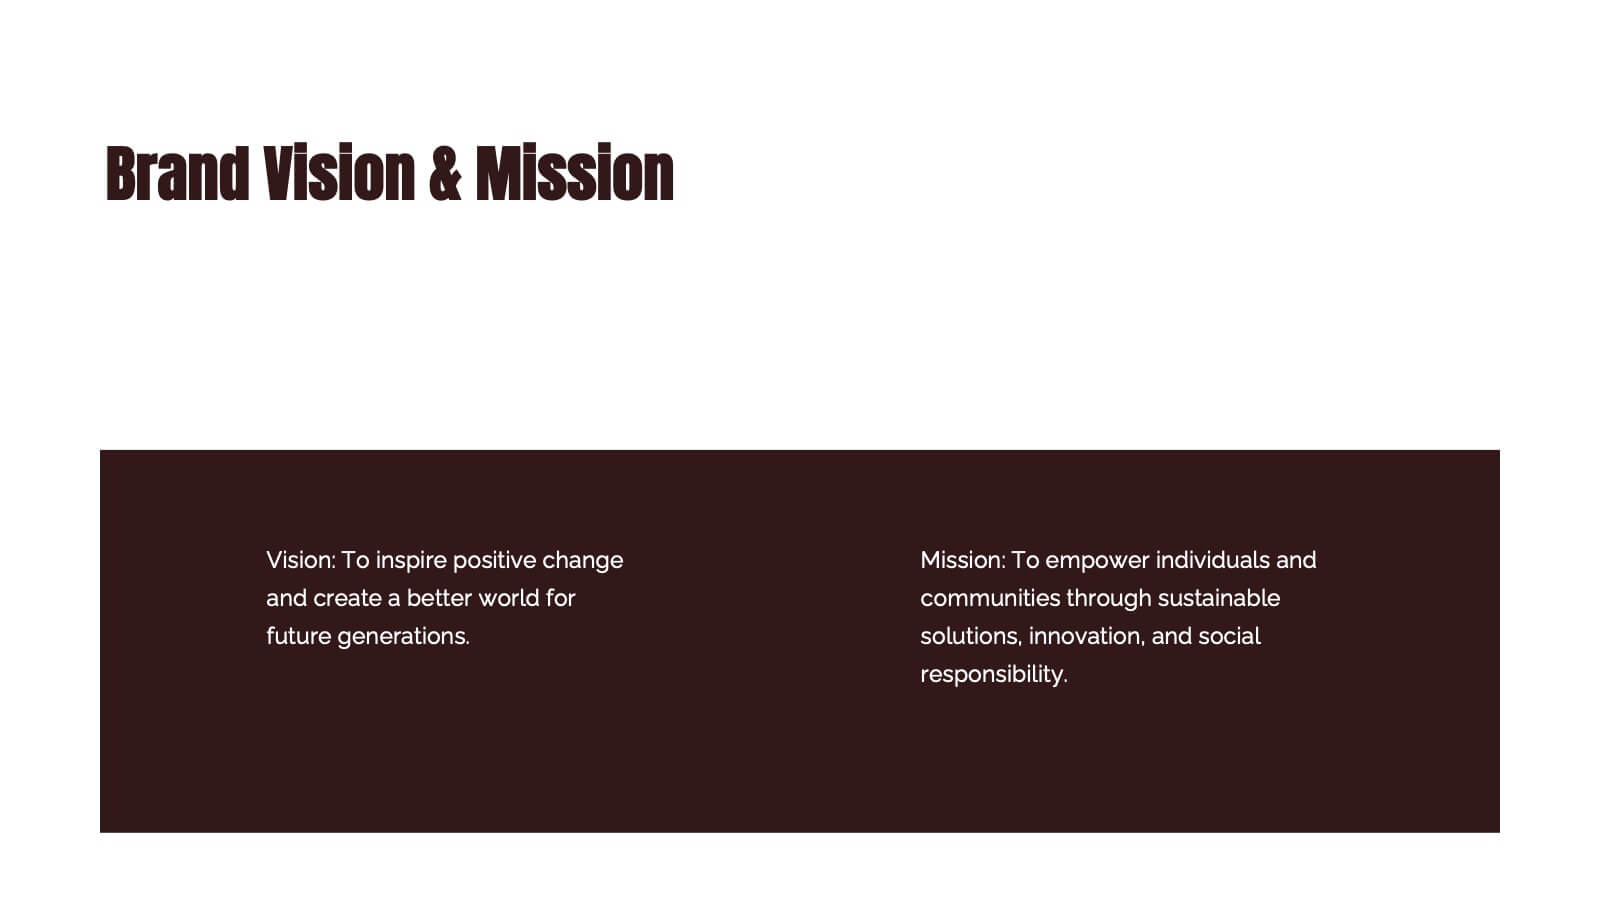
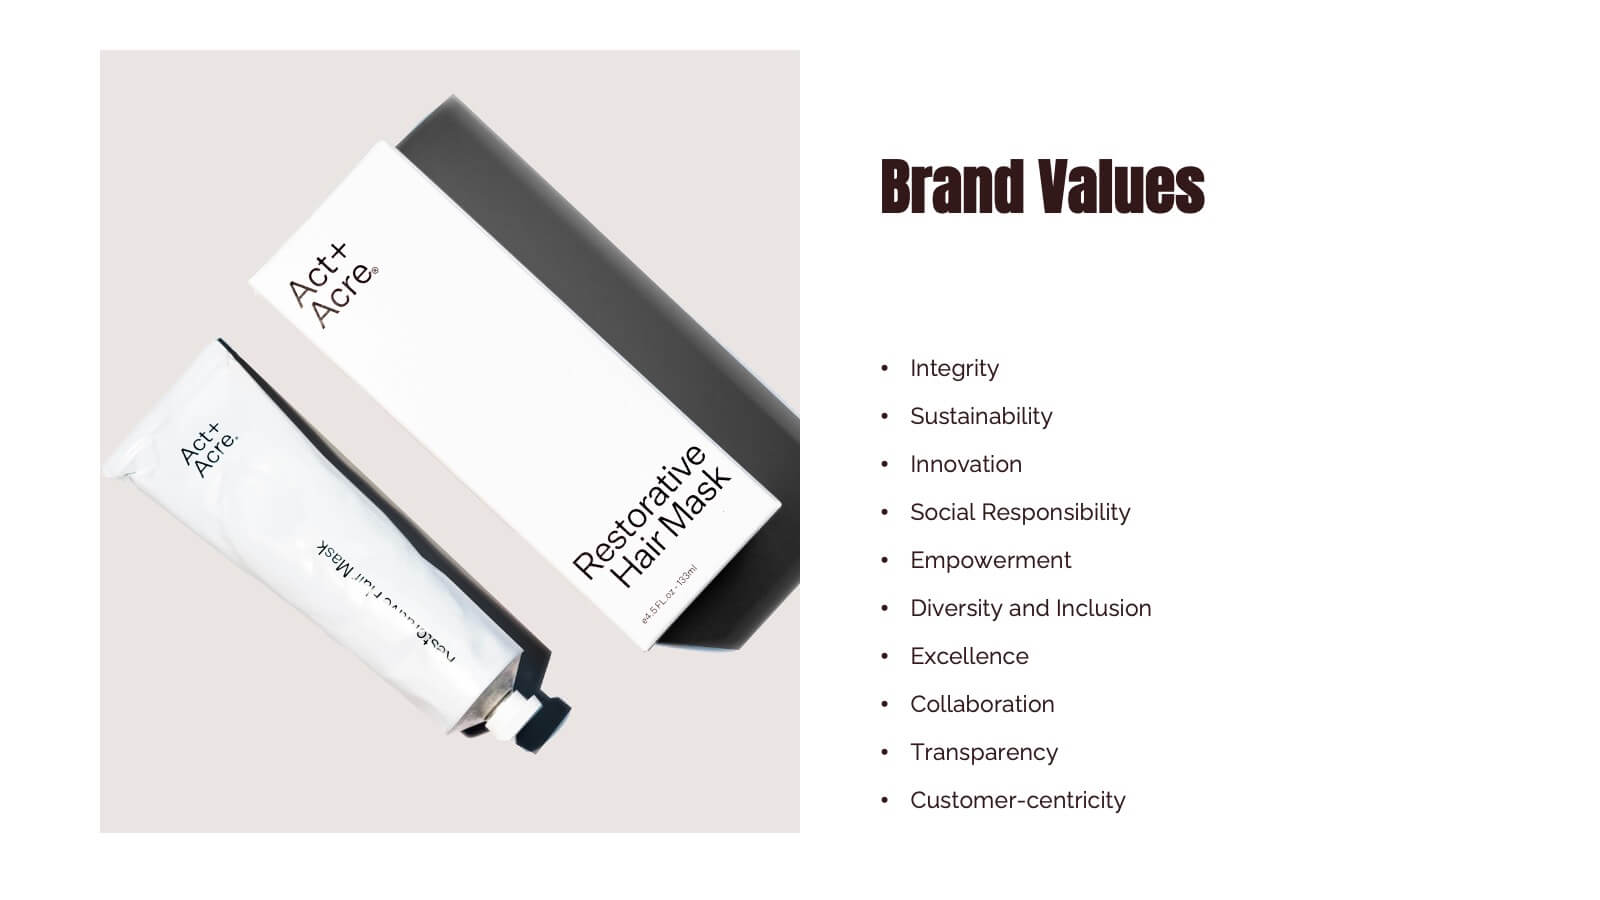
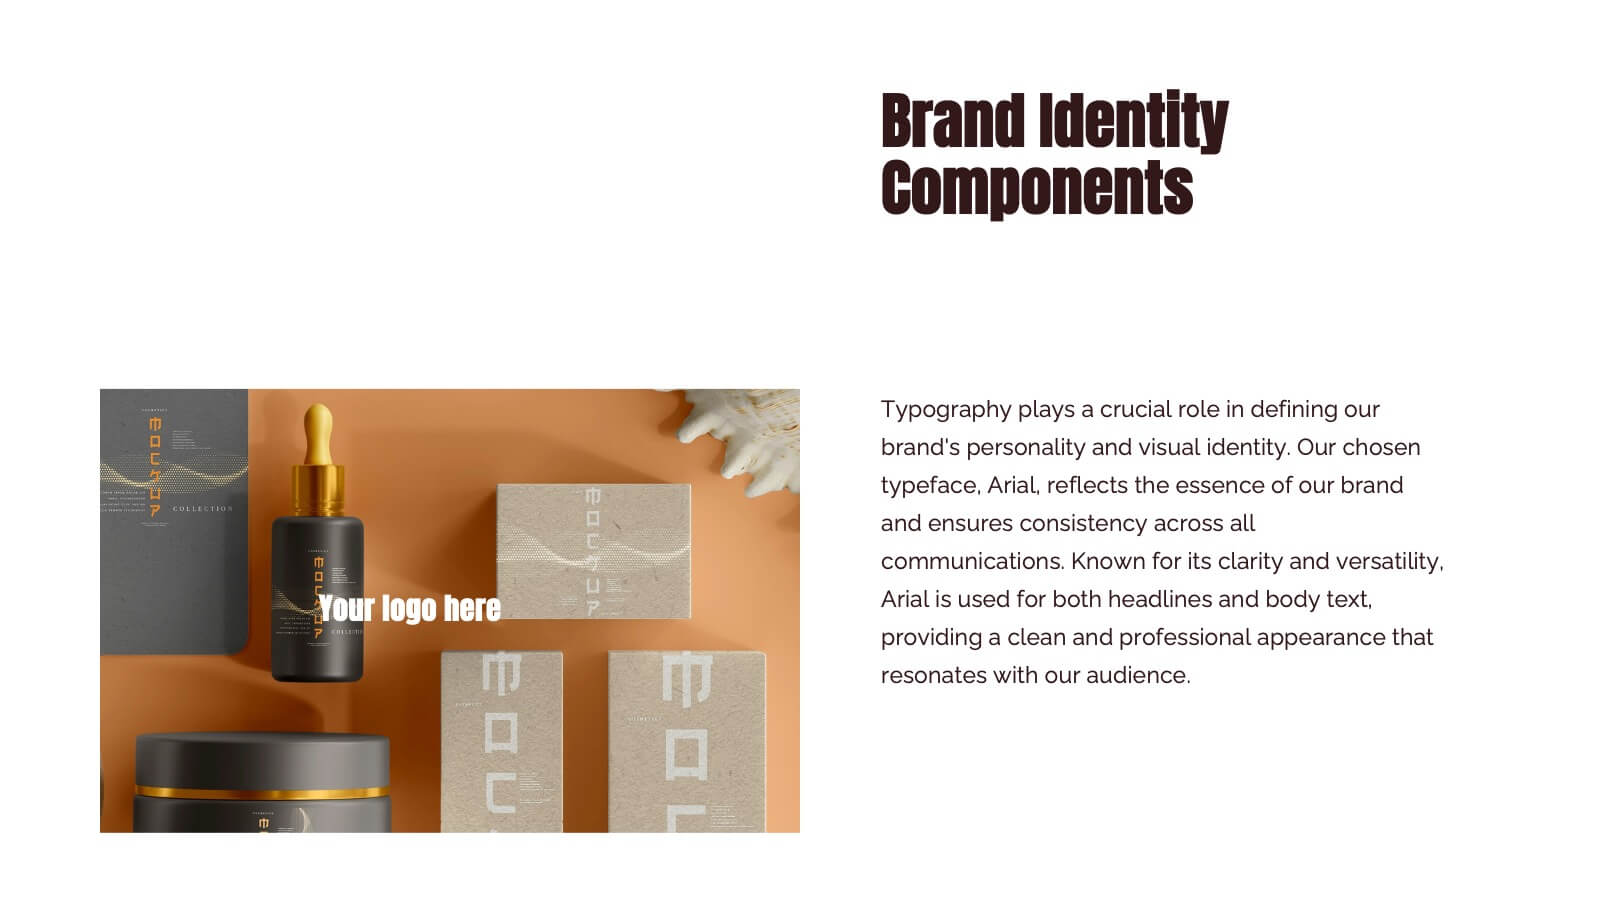
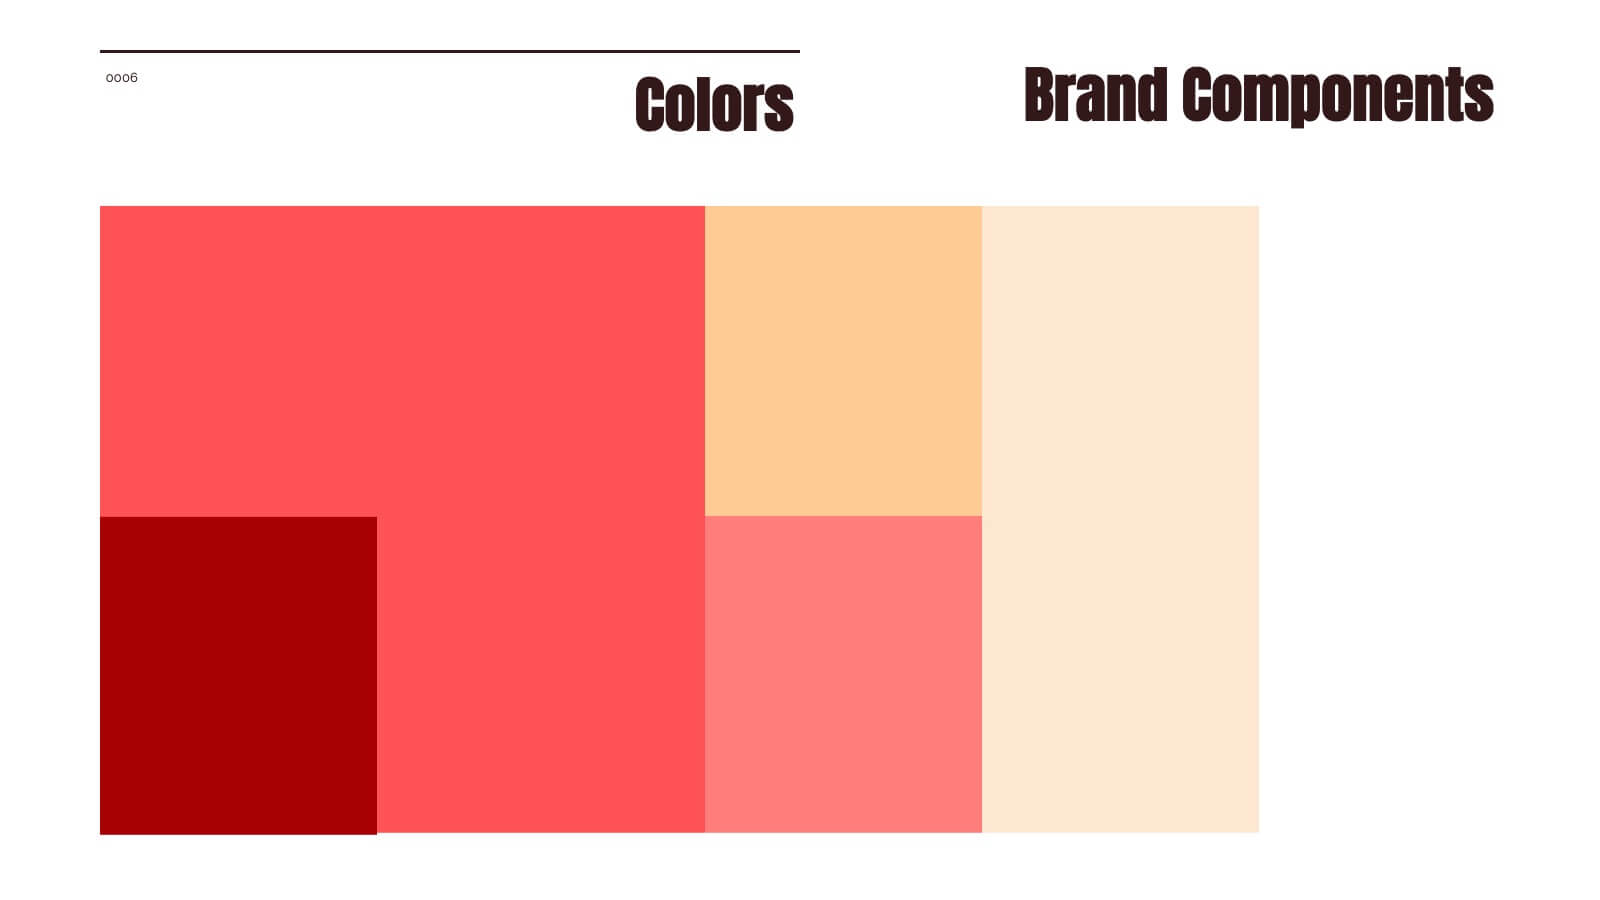
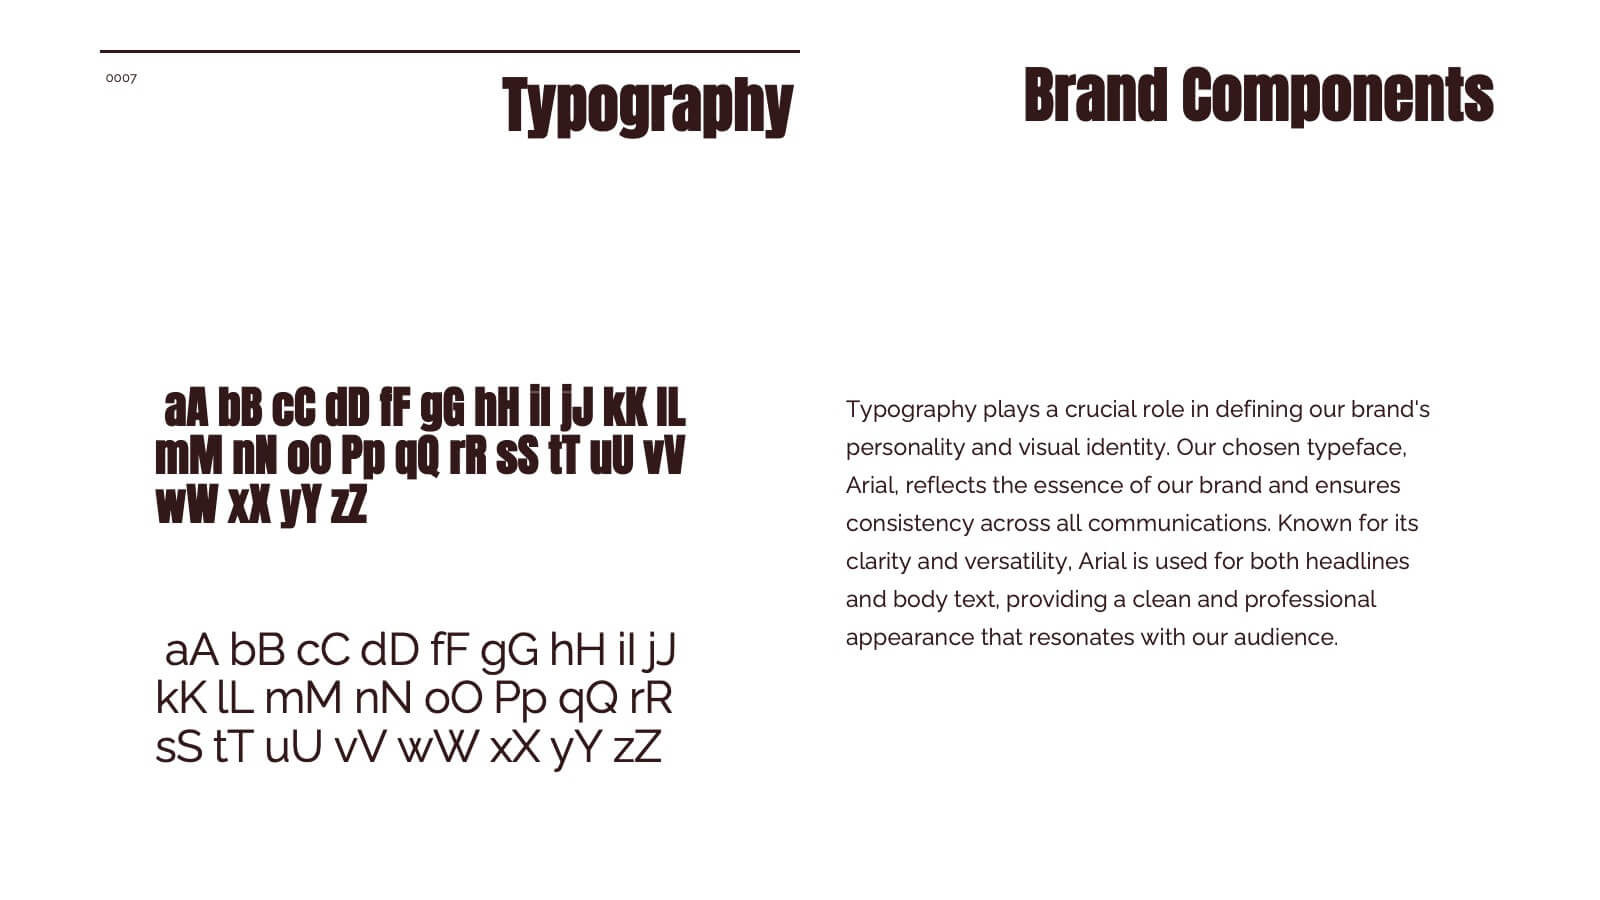
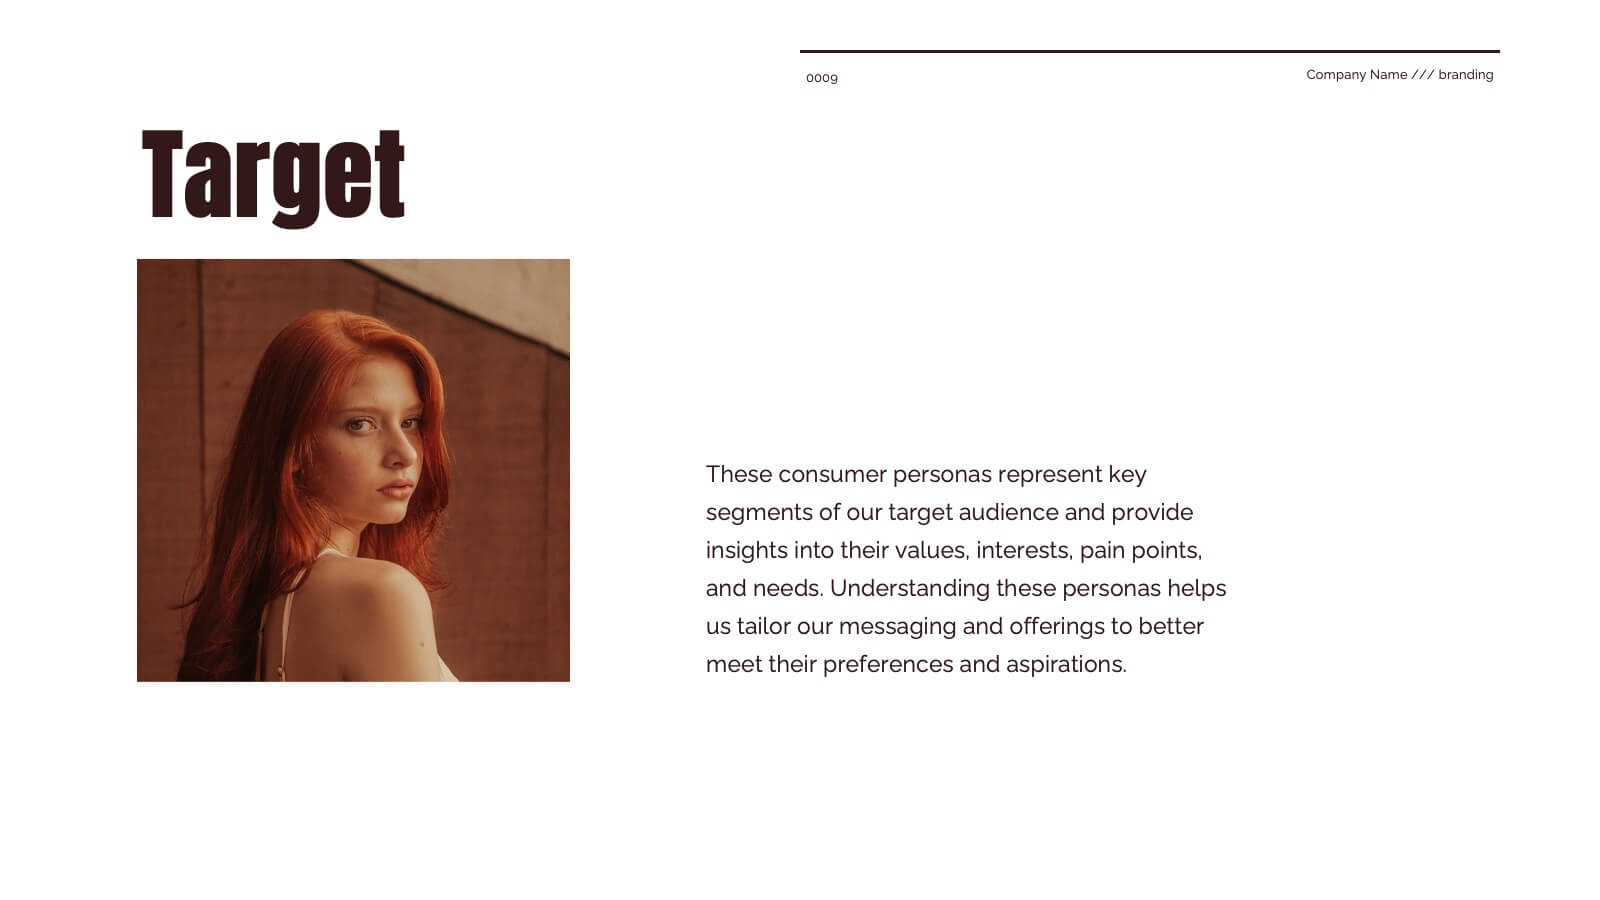
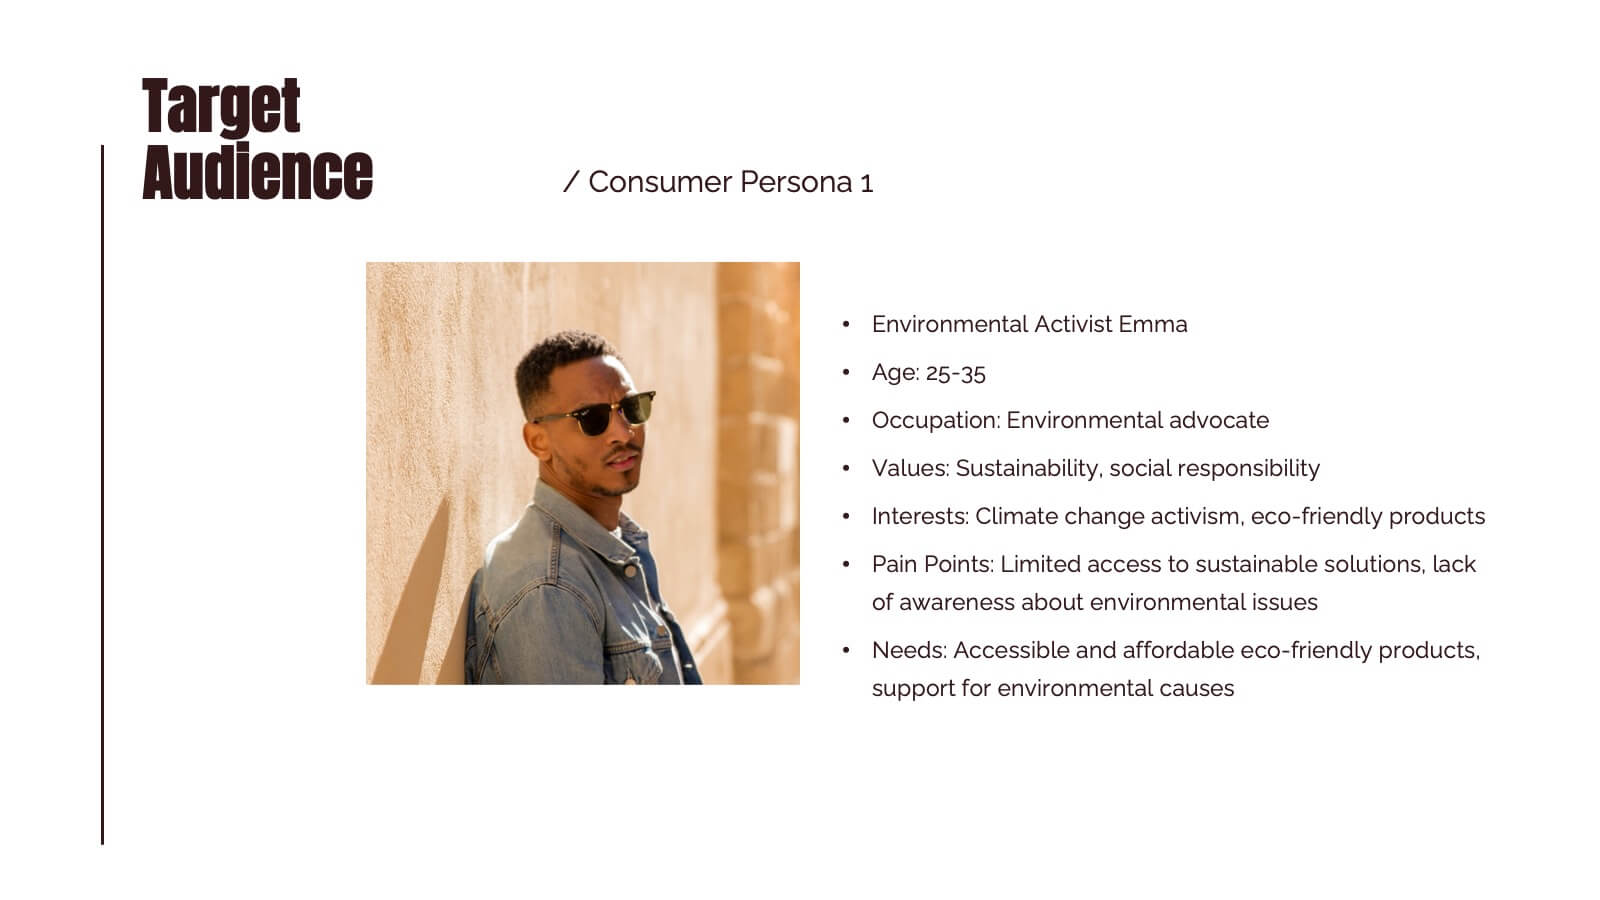
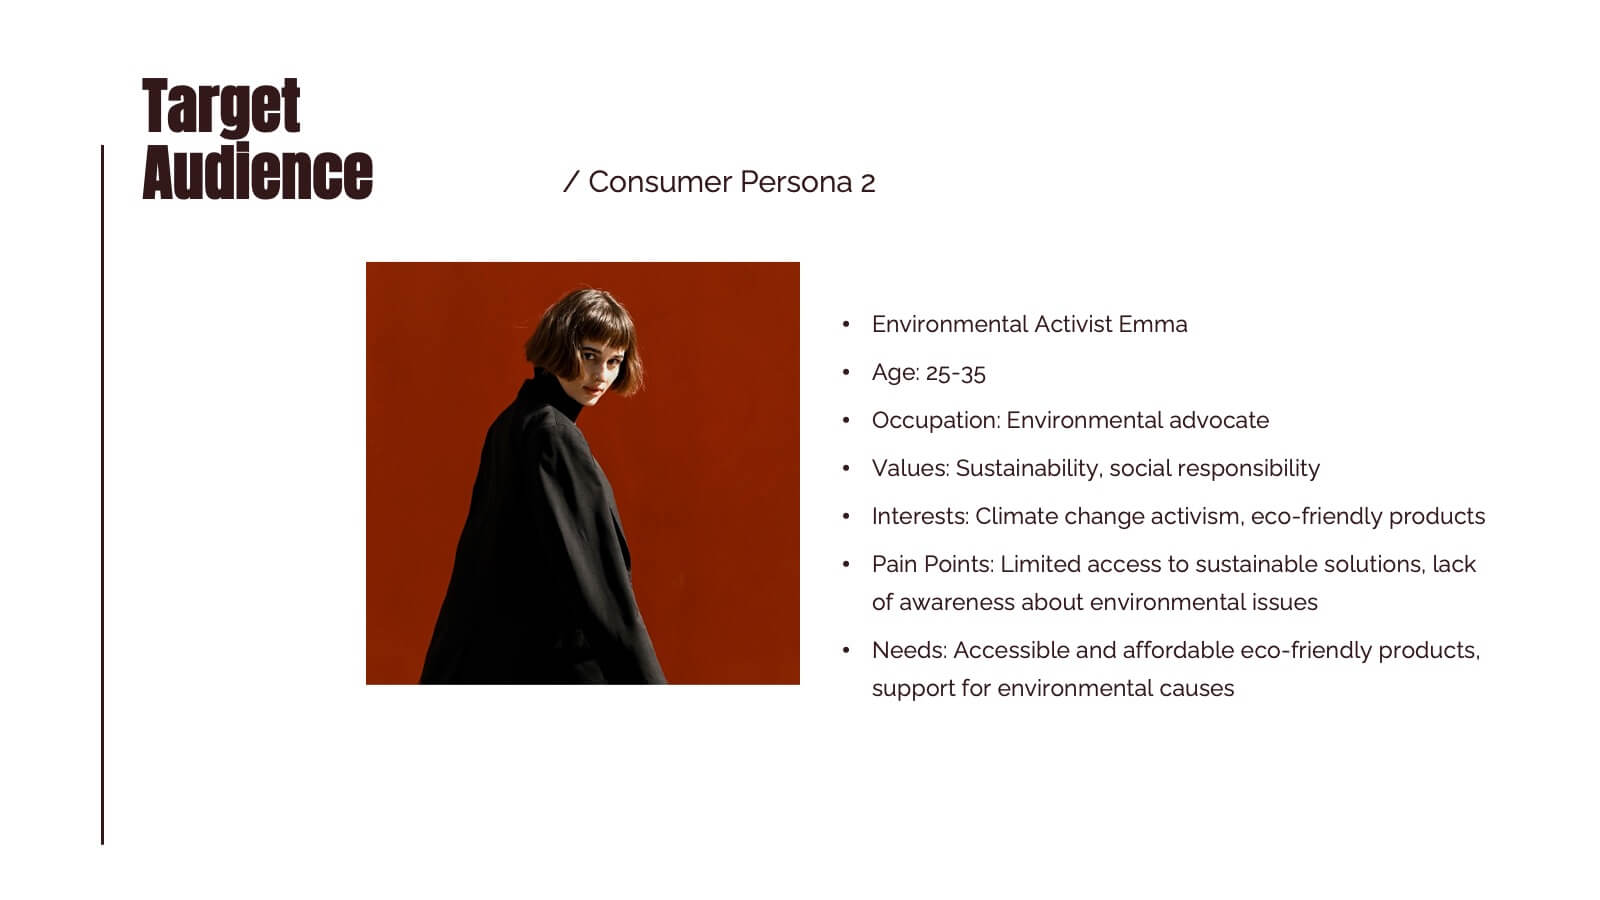
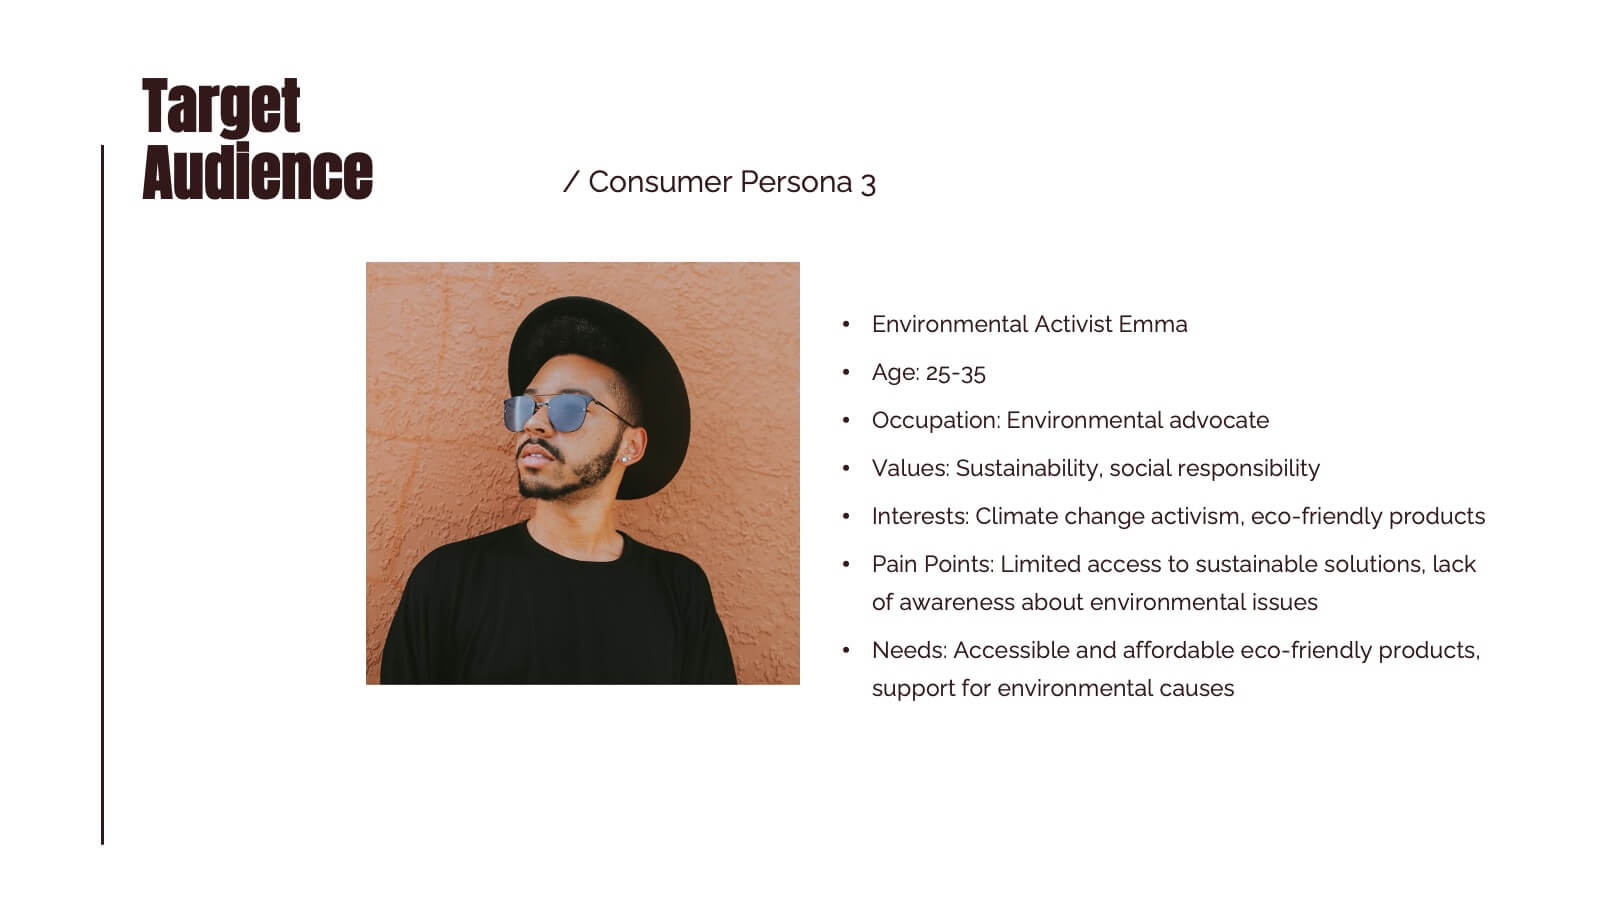
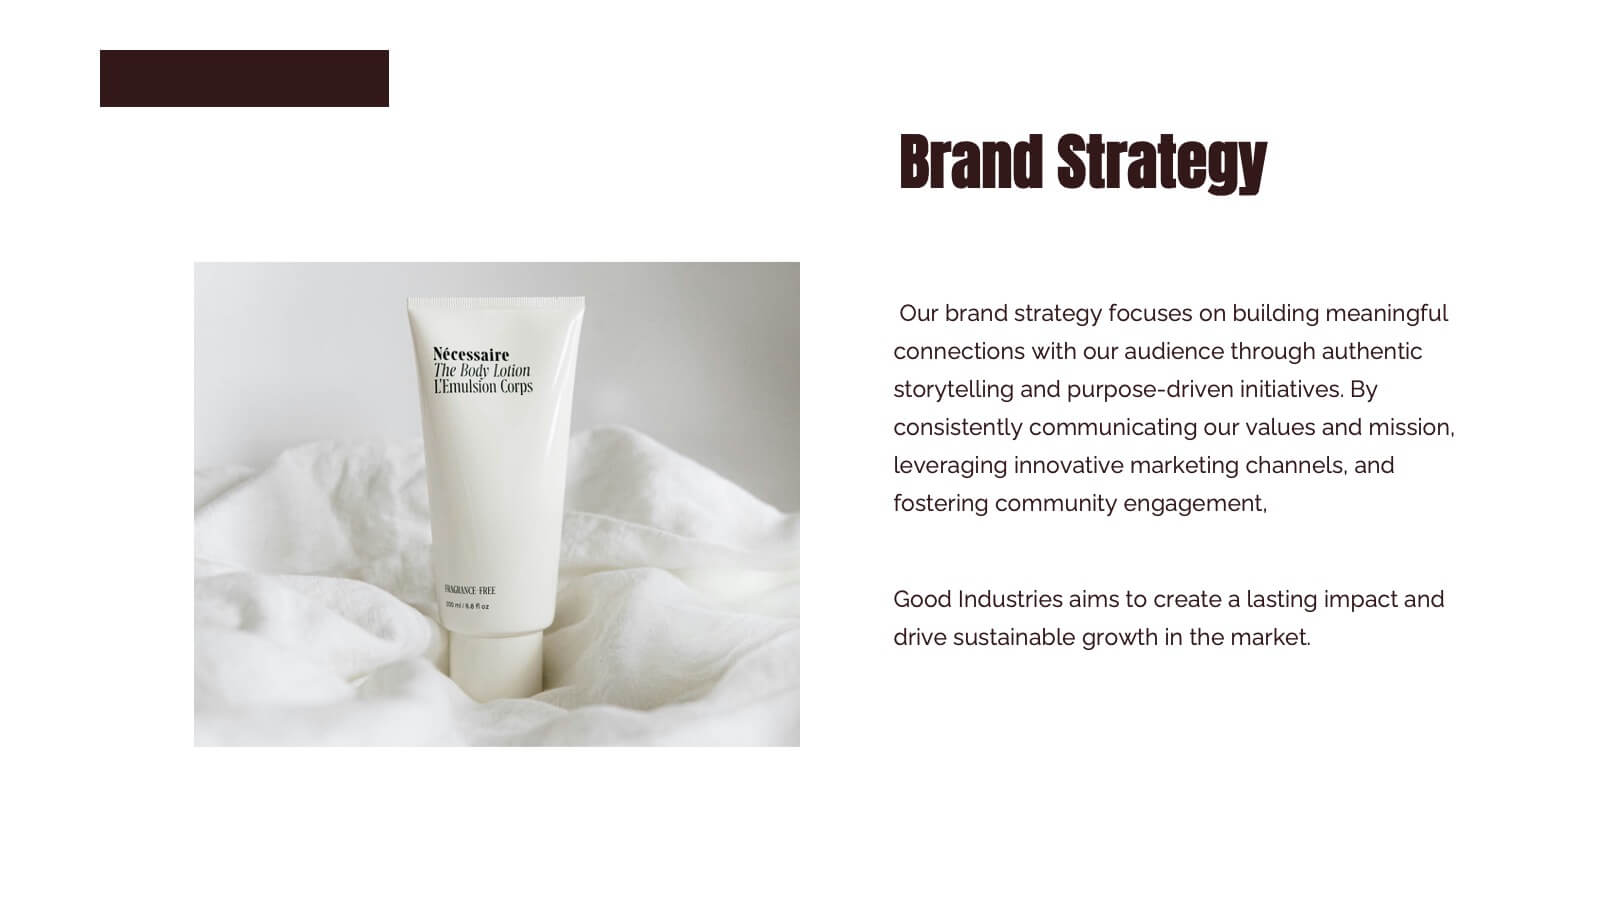
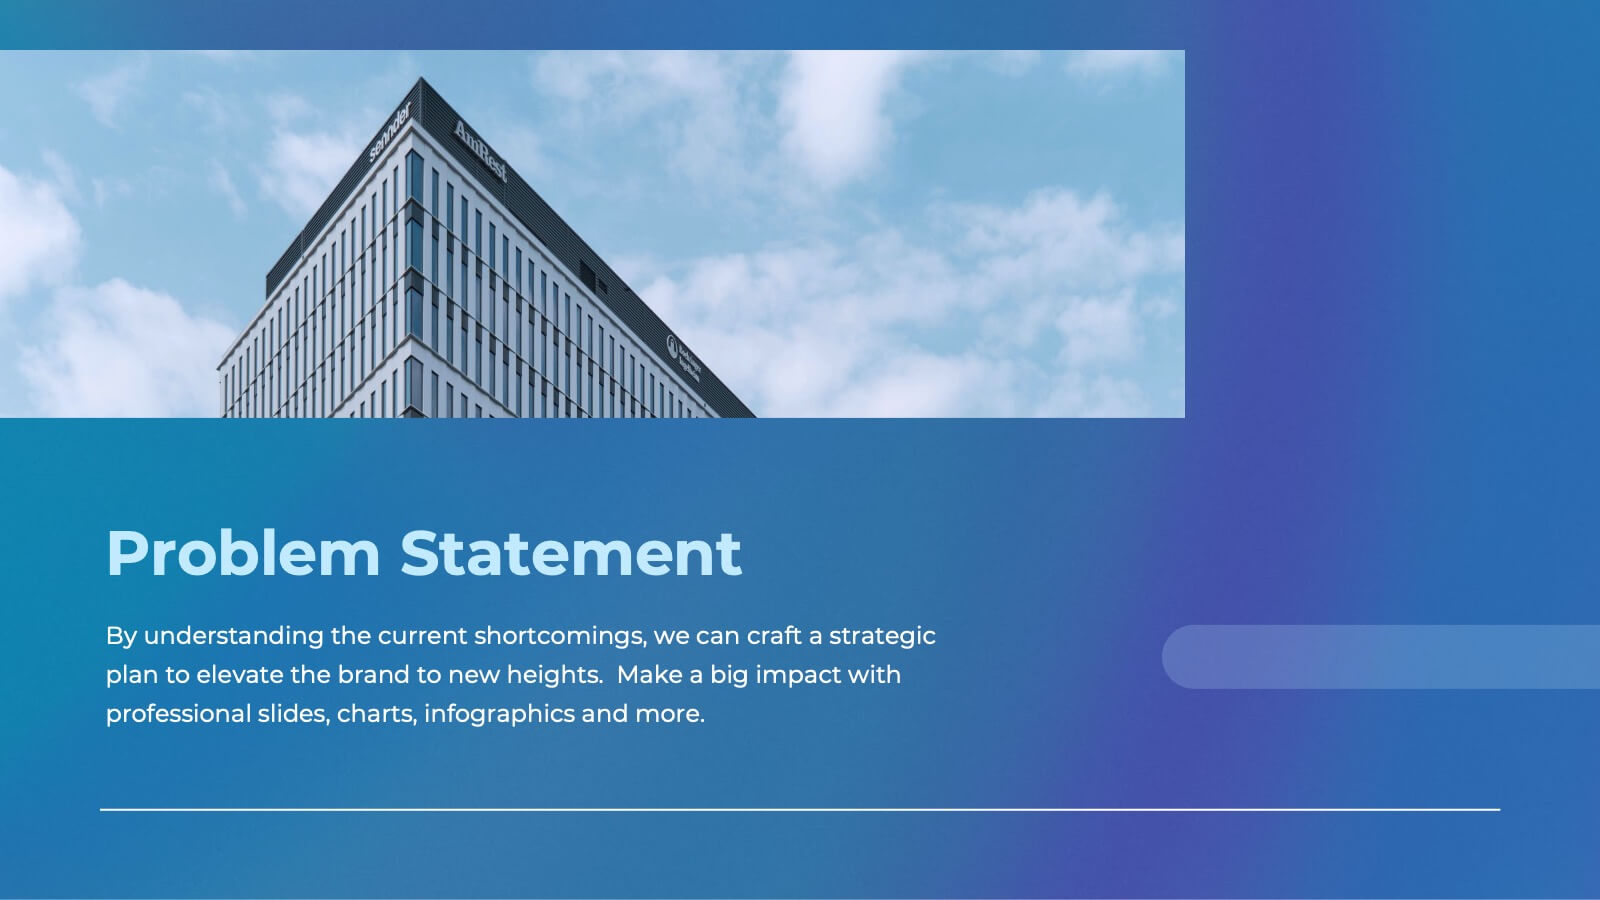
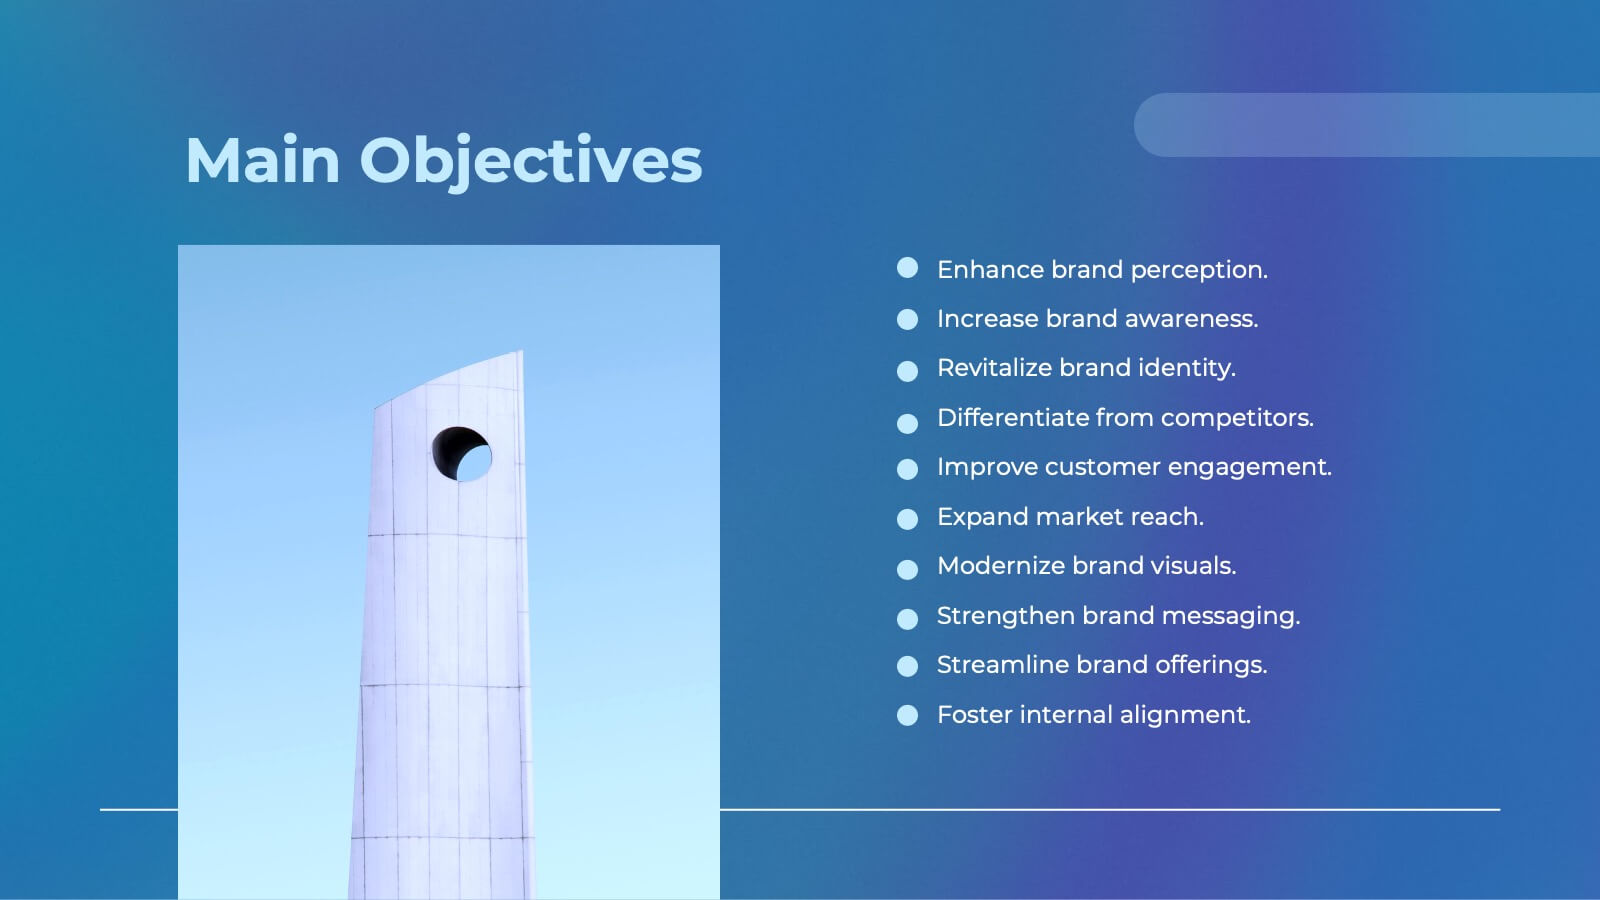
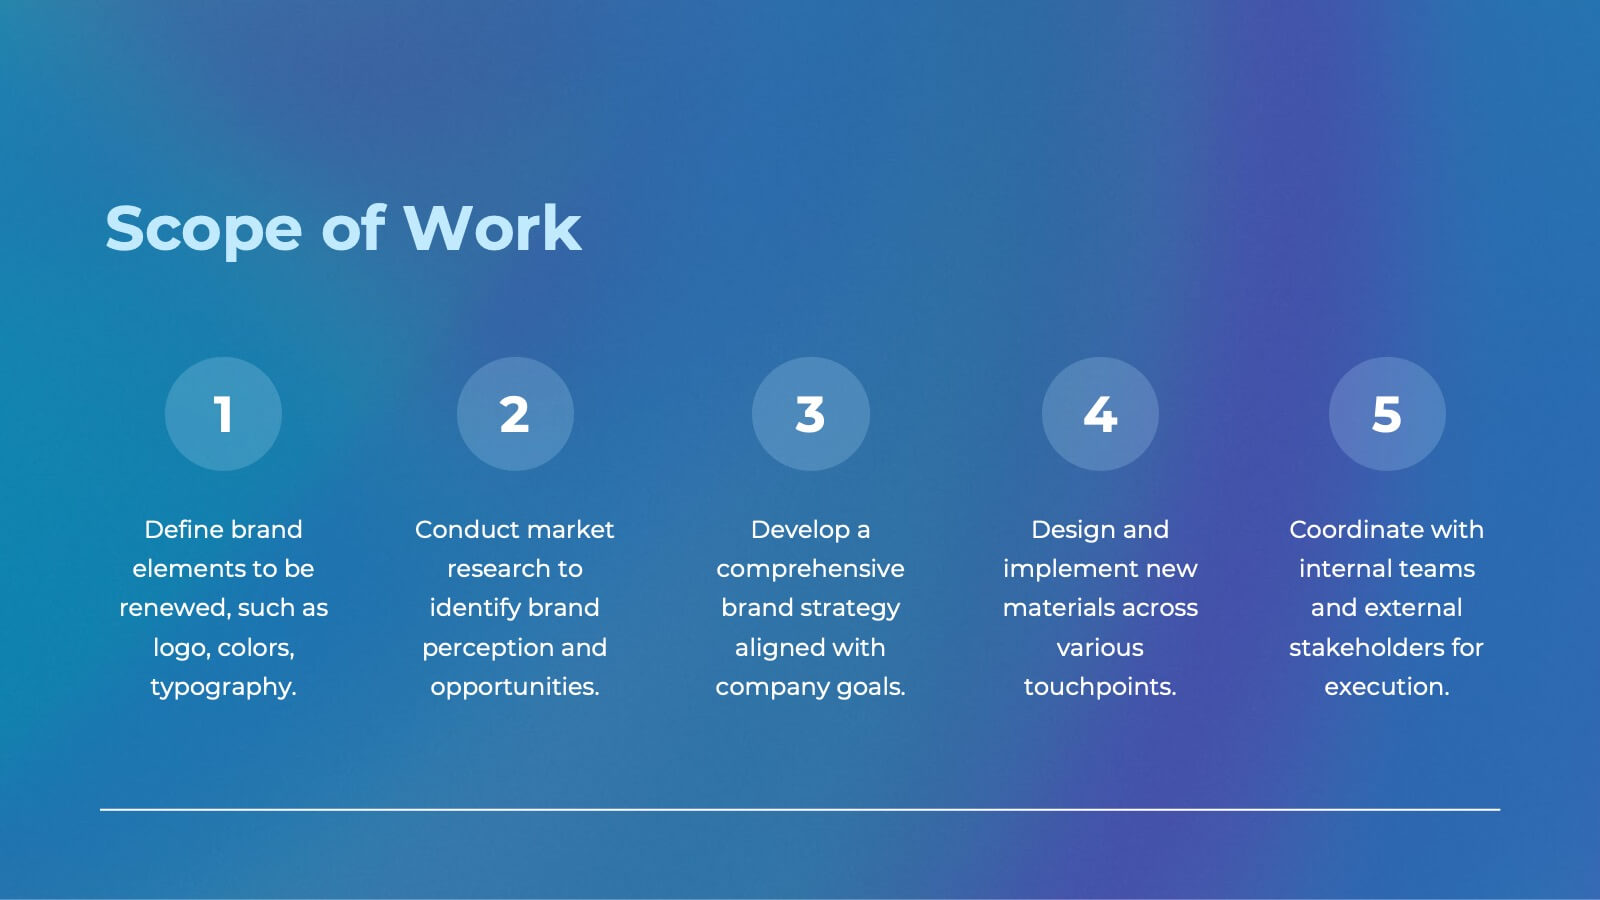
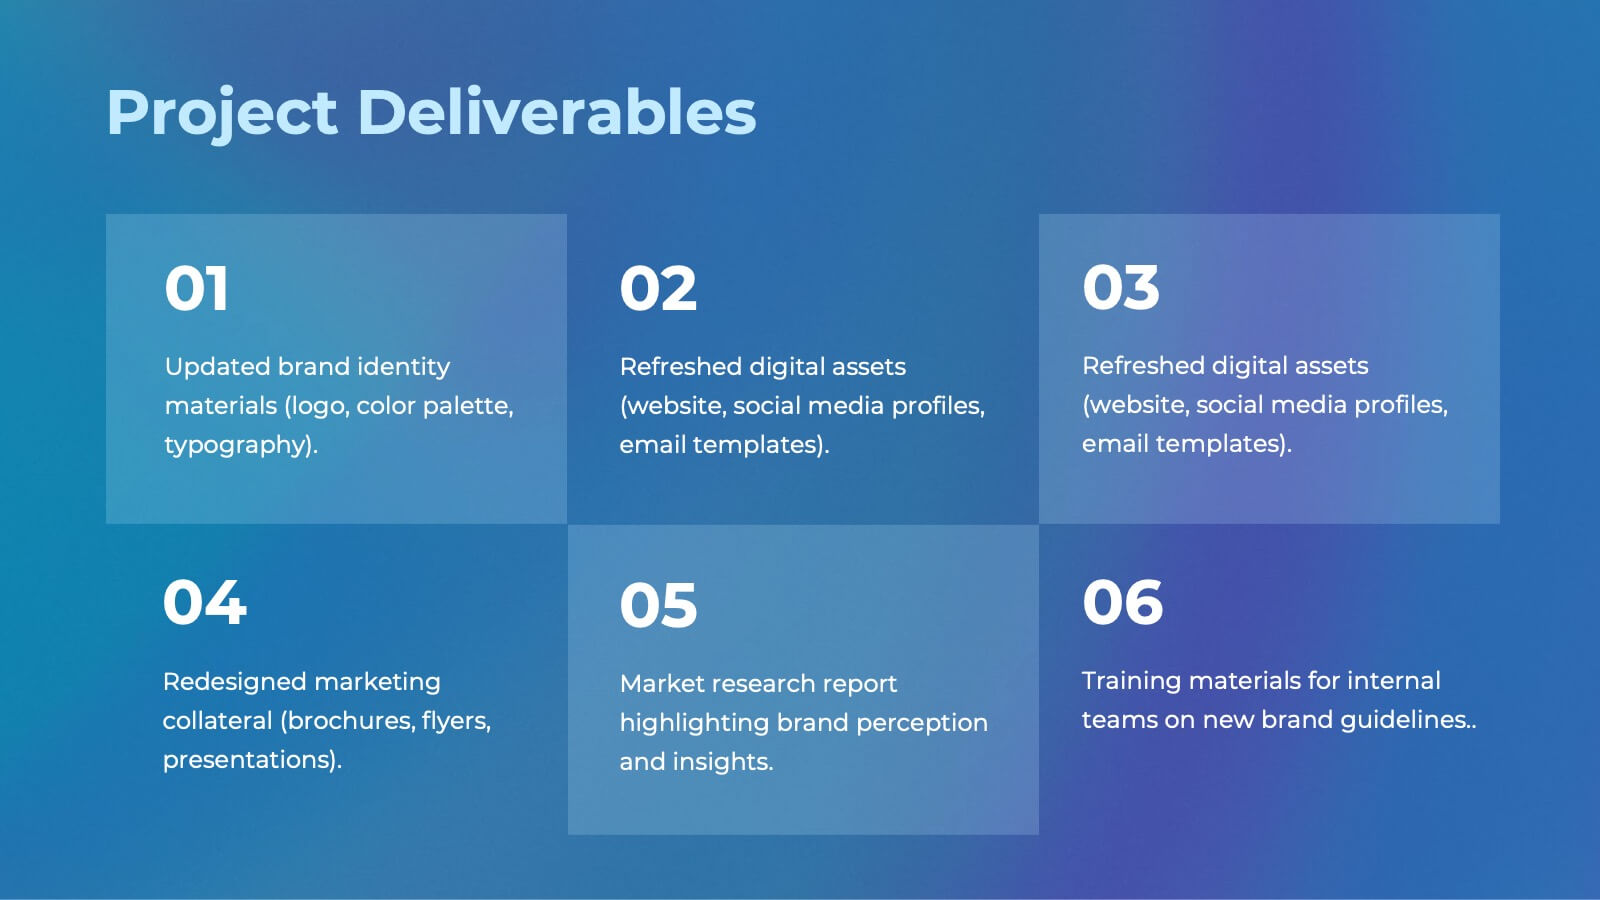
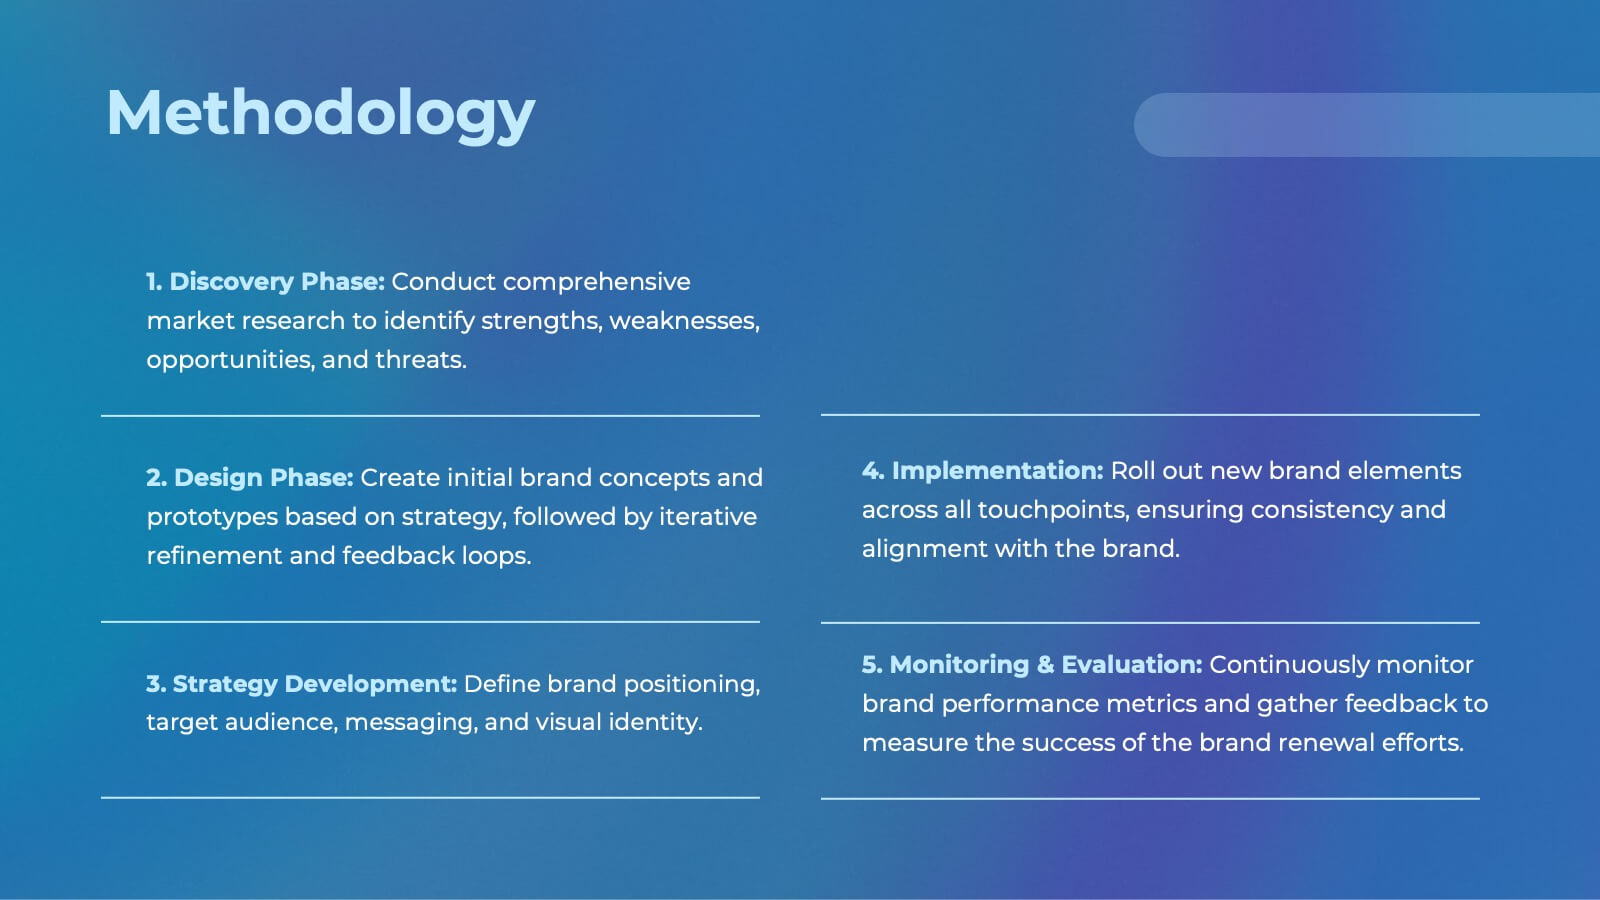
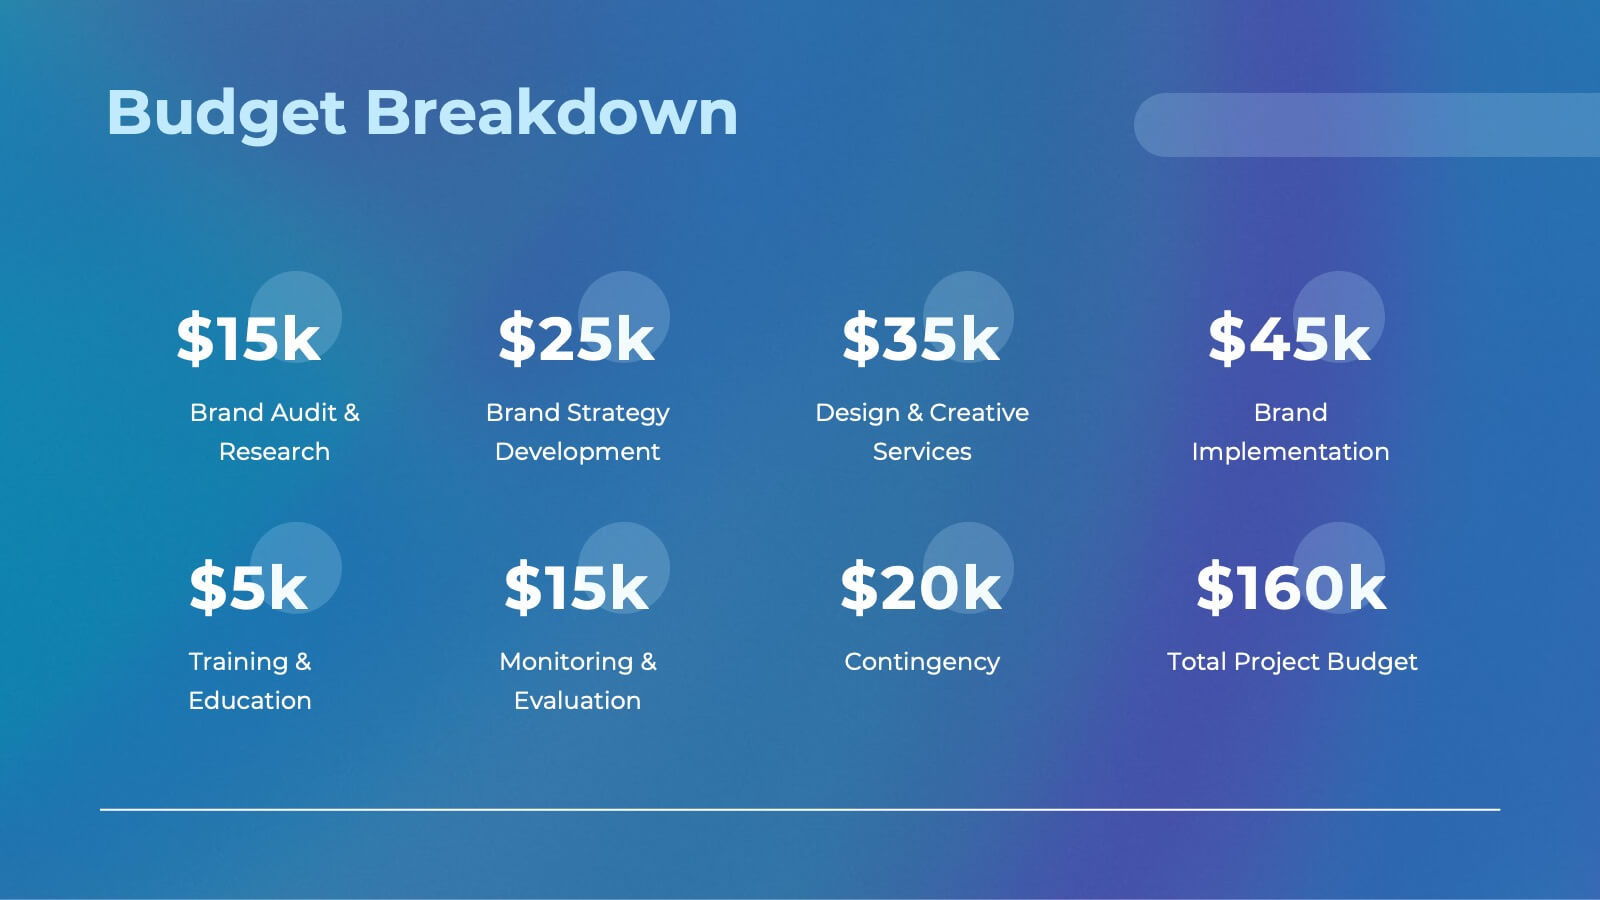
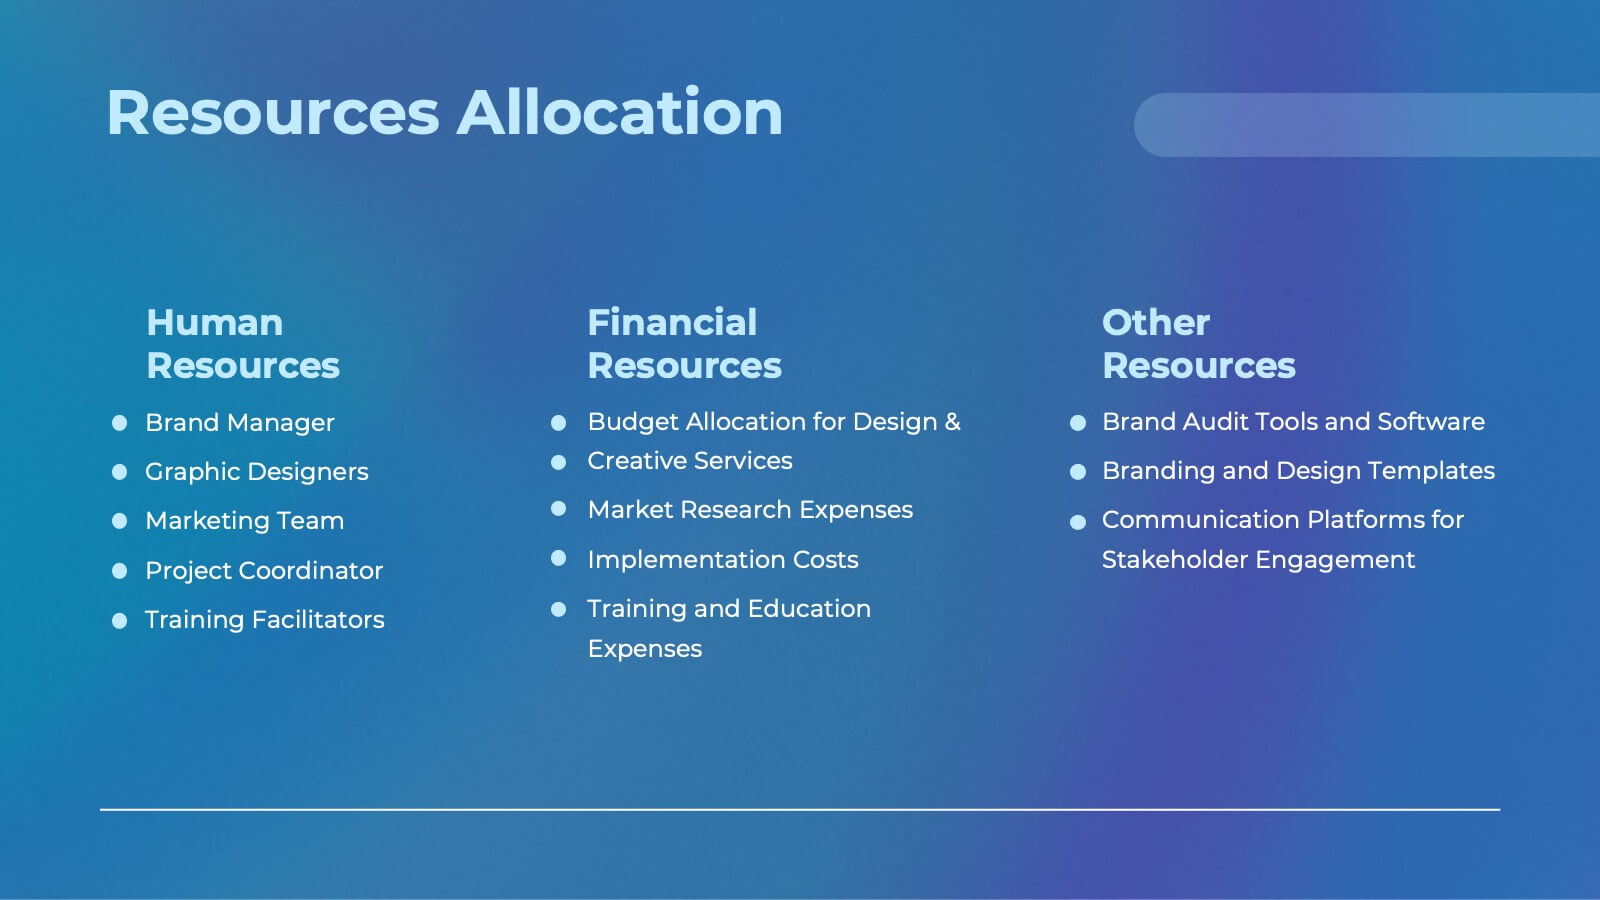
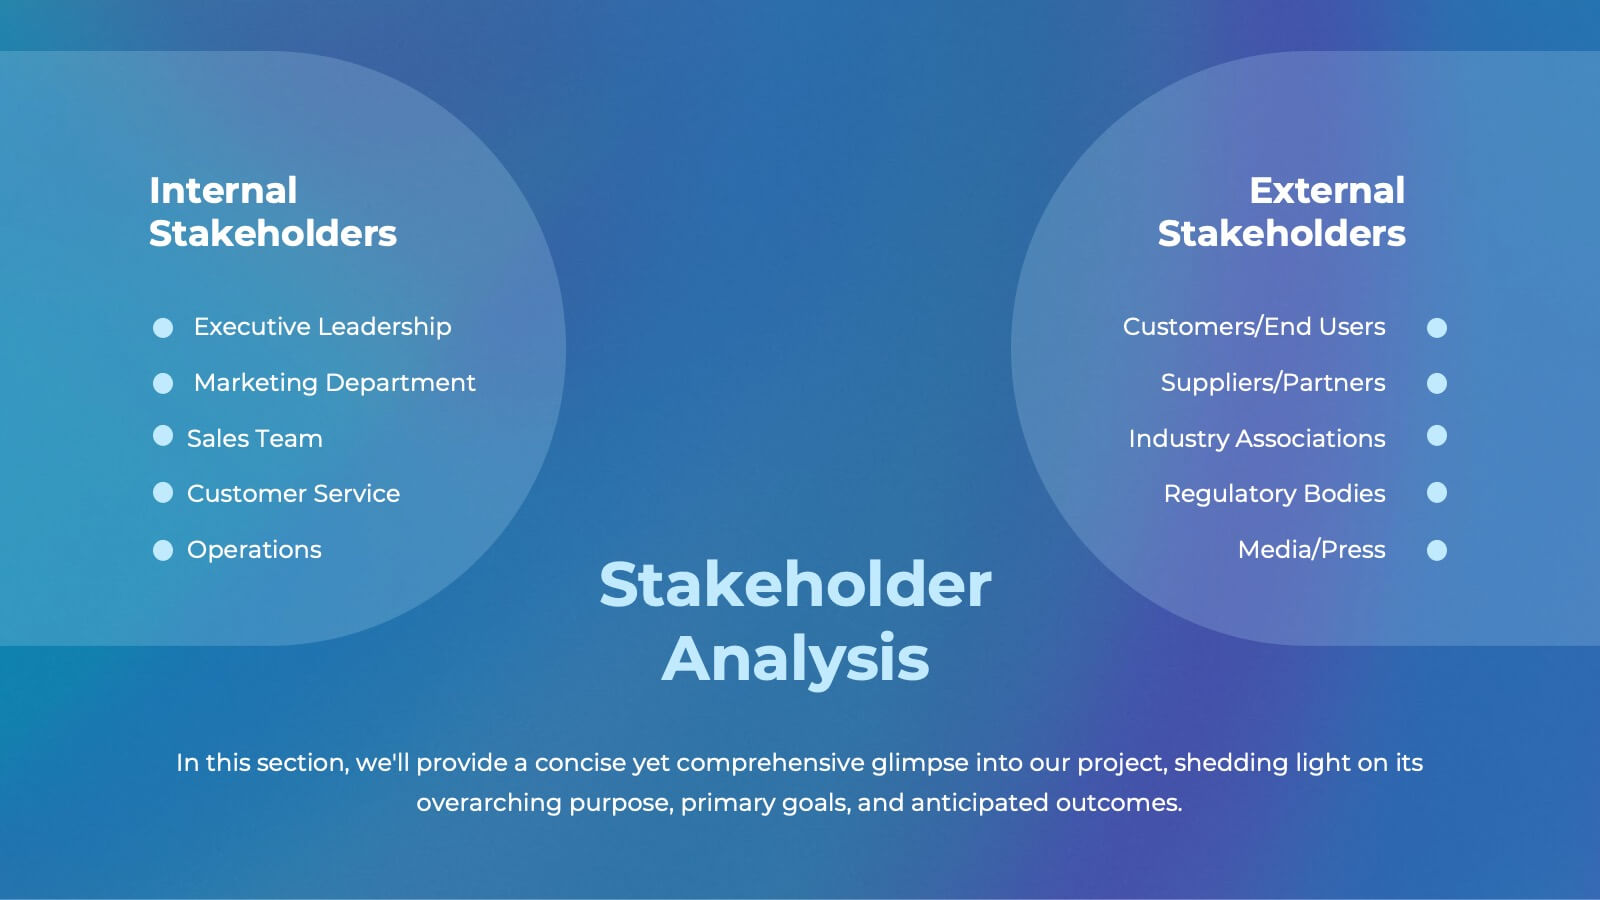
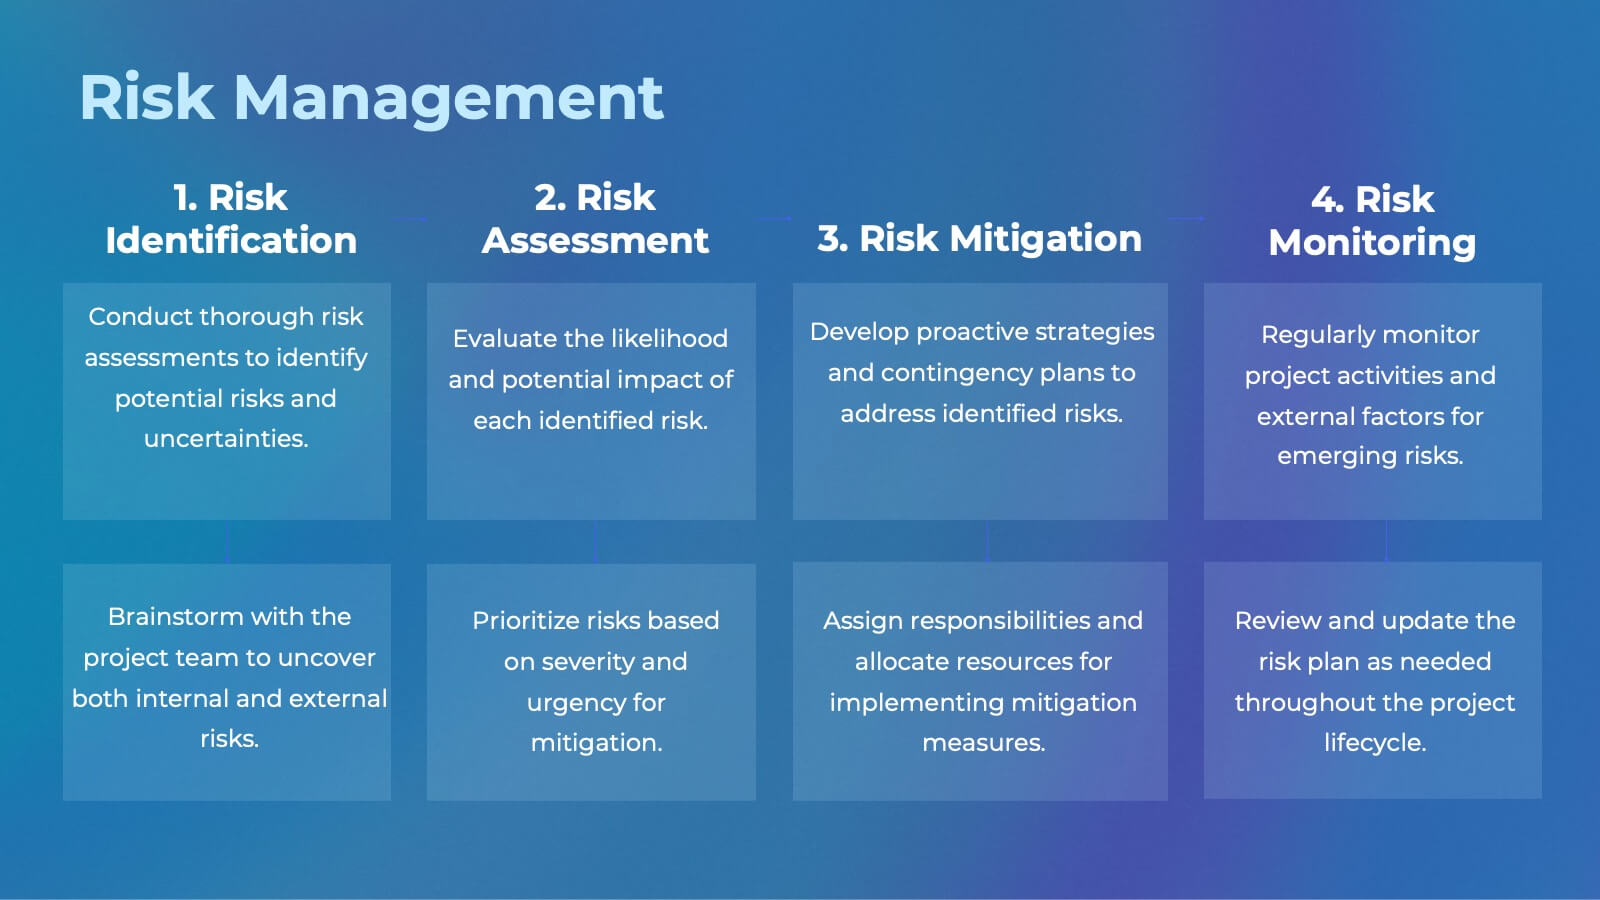
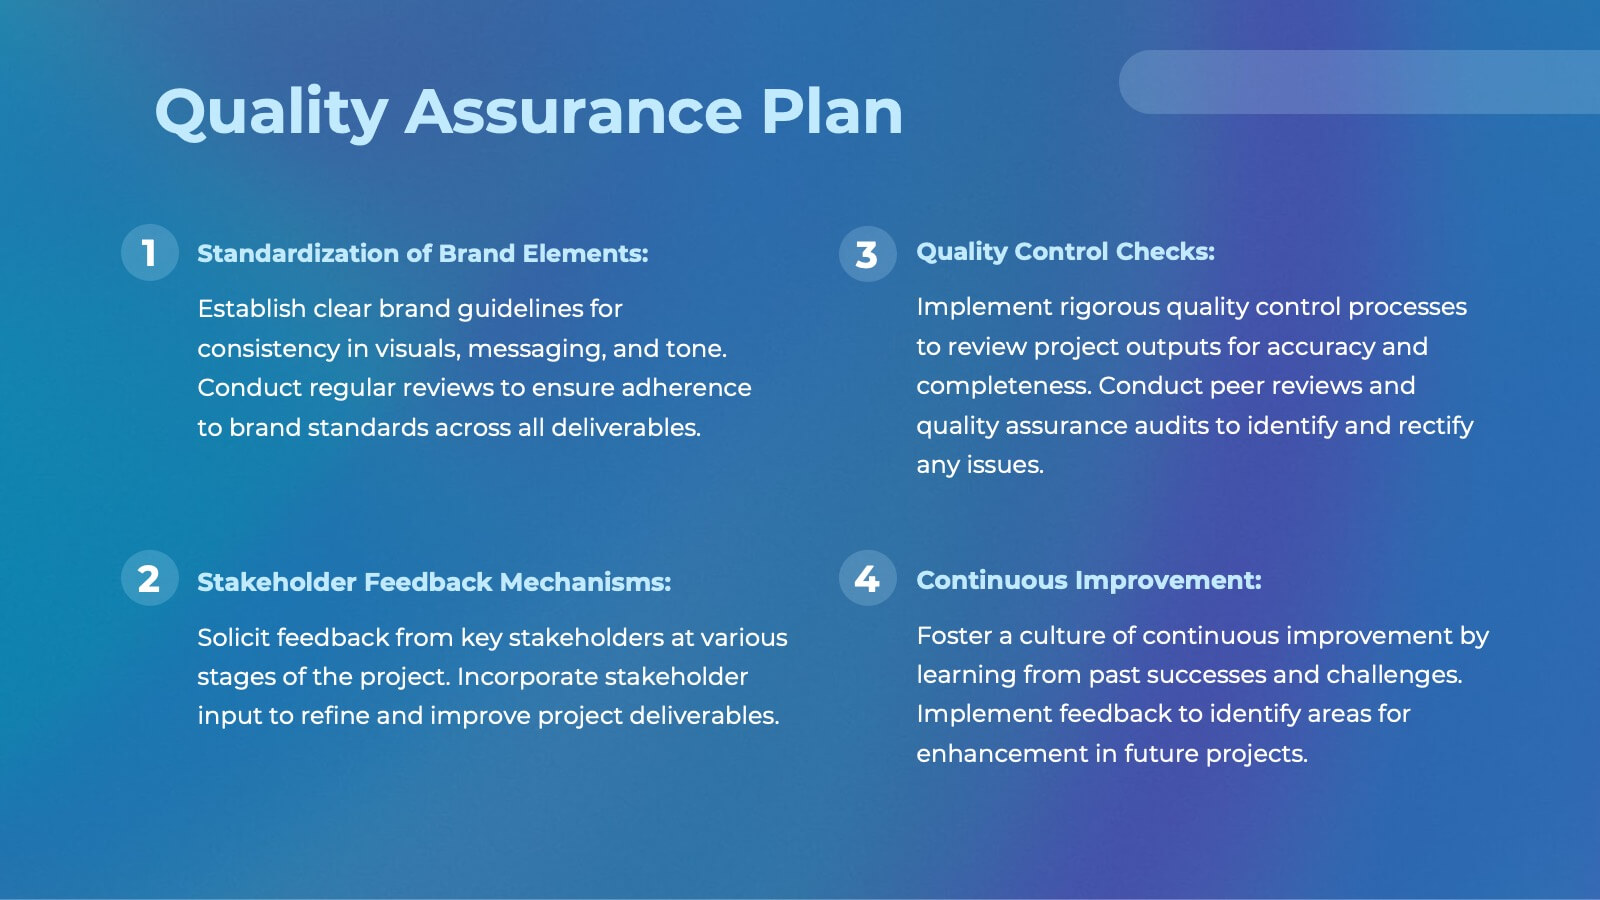
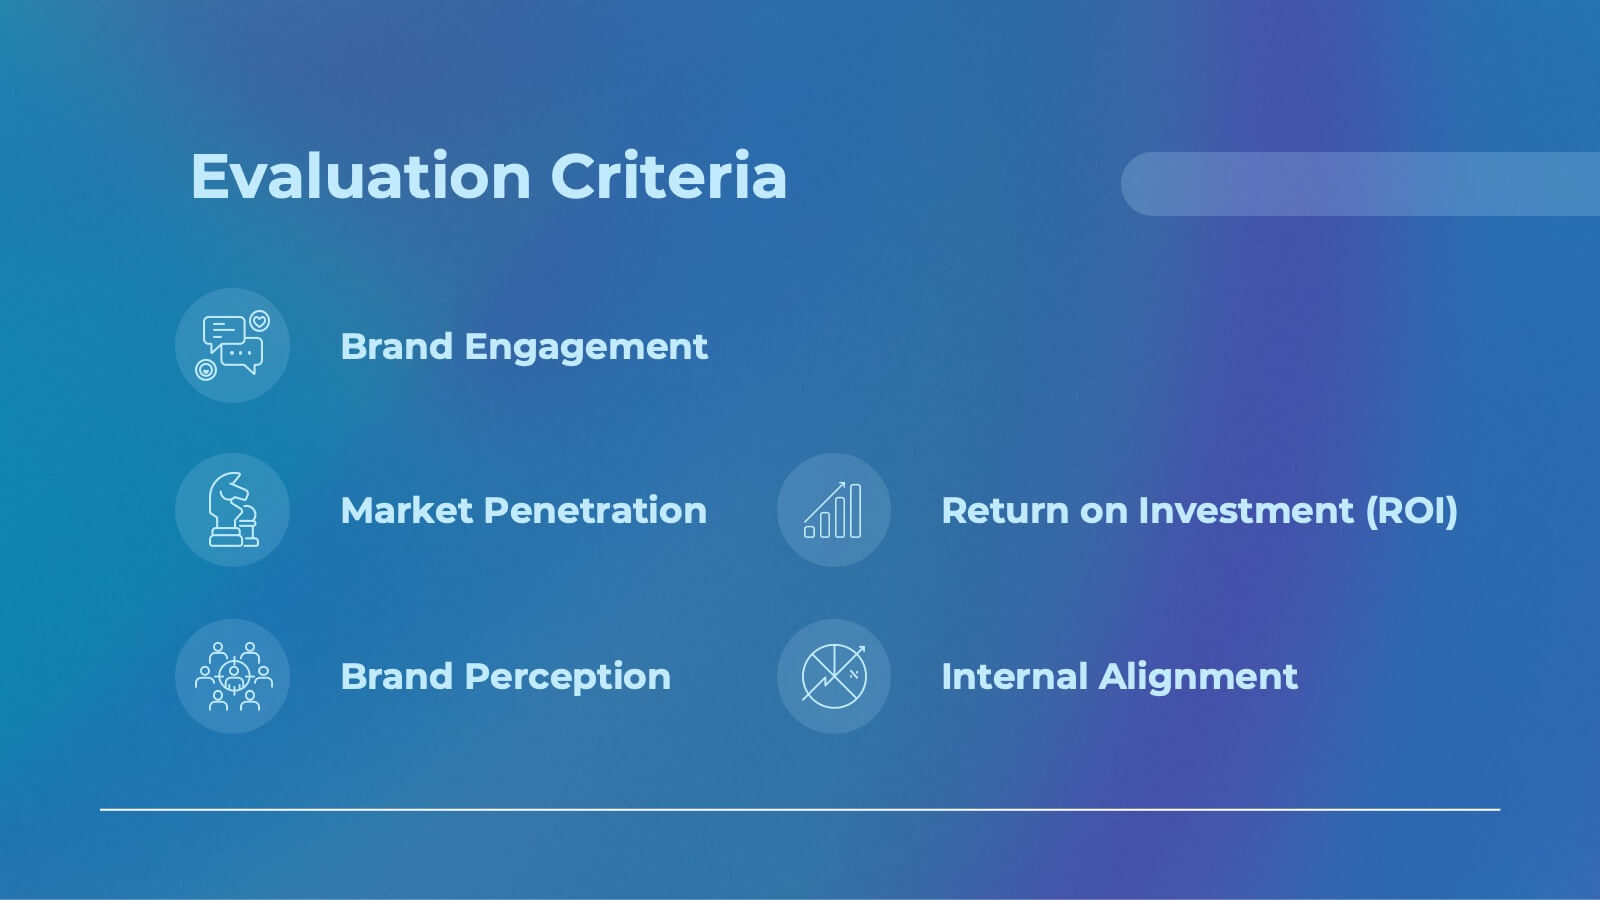
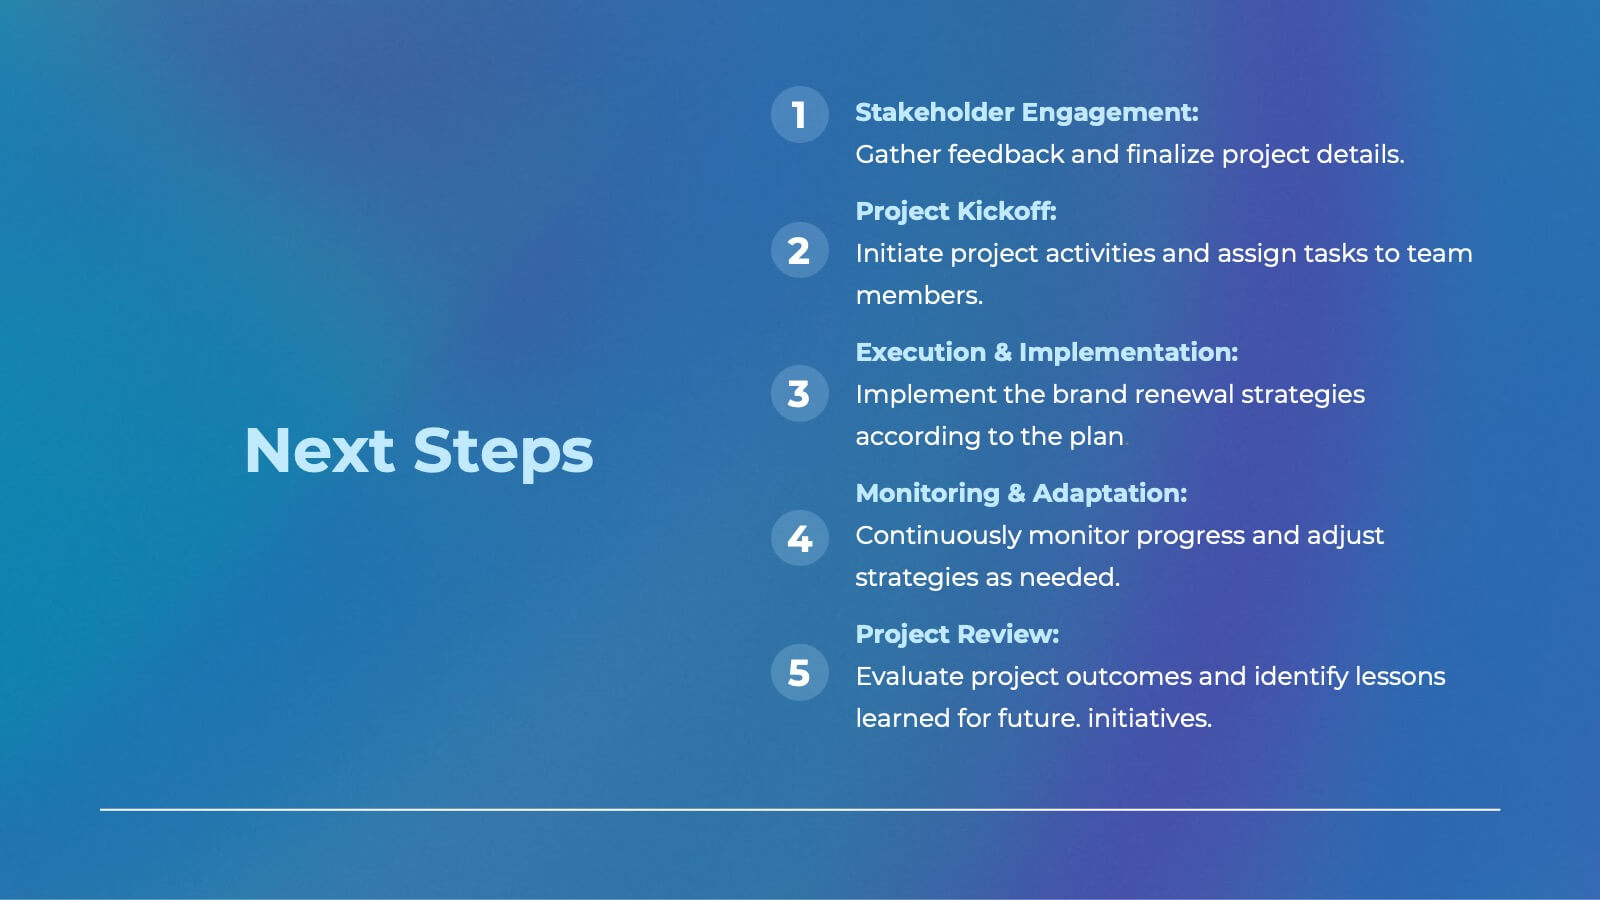
Blaze Brand Identity Presentation
Ignite your brand's potential with this vibrant, blaze-inspired presentation! Ideal for showcasing your brand identity, this template highlights key elements like logo design, color palette, and brand messaging with bold visuals and a modern layout. Perfect for making your brand stand out. Compatible with PowerPoint, Keynote, and Google Slides.


6 diapositivas
Quality Control Six Sigma Process Presentation
Bring clarity and energy to your workflow with this clean visual guide that outlines each phase of a structured improvement cycle. It helps communicate steps, responsibilities, and progress in a polished, professional way your audience can follow instantly. Fully compatible with PowerPoint, Keynote, and Google Slides.


20 diapositivas
Sylph Design Portfolio Presentation
Dive into a creative journey with this visually striking design portfolio presentation template! Ideal for showcasing design processes, mood boards, and final outcomes, it’s perfect for impressing clients or stakeholders. Highlight your design skills and methodology with this modern, sleek format. Compatible with PowerPoint, Keynote, and Google Slides for seamless integration into your workflow.


26 diapositivas
Modern Company Profile Striped Presentation
Present your company with style, our modern company profile presentation, is the perfect template to showcase your business in a contemporary and stylish way. This template combines professionalism with a touch of flair and striped elements, making it ideal for modern businesses looking to make a lasting impression. Ideal for tech startups, creative agencies, or a professional service firms, this presentation will help you convey your company's professionalism. Fully customizable and compatible with Powerpoint, Keynote, and Google Slides. This makes it easy for potential clients, partners, and investors to reach out!


8 diapositivas
Employee Onboarding 30-60-90 Day Plan Presentation
Set new hires up for success with this employee onboarding 30-60-90 day plan template! Designed to streamline the onboarding process, this structured layout helps HR teams and managers define clear goals, training steps, and performance milestones. Fully customizable and compatible with PowerPoint, Keynote, and Google Slides for seamless adaptation.


7 diapositivas
Medical Infographic Presentation Template
A Medical Infographic is a visual representation of complex medical information or data, designed to simplify and clarify the information for the reader. The purpose of our medical infographic template is to educate and inform people about various health and medical topics through visual aids such as charts, graphs, diagrams, and illustrations. With this template, you'll have everything you need to create a professional and engaging presentation. The template includes a variety of visual elements that can be used to present data and statistics in an easy-to-understand manner.


7 diapositivas
Timeline Schedule Infographics
A Timeline Schedule is an effective way to communicate complex schedules or timelines. It's a constructive tool for coordinating work and managing projects. This template can help you build a timeline, show the overview and present your value proposition. This timeline Infographic can be used for any business, personal, or academic project. This is a fully editable template so you can change the color, size and everything as per your needs. The timeline charts have been designed with various categories and time range pattern through which you can plan your projects in an effective way!


6 diapositivas
Cyber Security Jobs Infographics
The "Cyber Security Jobs" infographic template, designed for PowerPoint, Keynote, and Google Slides, is a vital tool for career counselors, educational institutions, and cyber security professionals. This modern and informative template is specifically crafted to highlight career opportunities and pathways in the field of cyber security. Featuring key elements such as various job roles in cyber security, skill requirements, and career growth opportunities, the template is structured to provide a comprehensive overview of the industry. Its layout is ideal for presenting the diverse range of careers available in cyber security, making it an invaluable resource for career guidance and professional development presentations. The design is tech-themed with a color scheme that includes shades of blue, black, and gray. This not only gives the template a professional and engaging look but also reflects the technological and security aspects of the field. Whether it's used in job fairs, educational seminars, or corporate training sessions, this template ensures that information about cyber security jobs is presented clearly, effectively, and attractively.


4 diapositivas
Remote Team Management Slides Presentation
Bring virtual teamwork into focus with a clean, collaborative design that makes managing distributed teams feel effortless. This presentation breaks down communication, coordination, and workflow strategies to help leaders guide remote groups with clarity and structure. Fully customizable and compatible with PowerPoint, Keynote, and Google Slides.


5 diapositivas
Business Innovations Strategy Presentation
Bring your next big idea to life with this modern, visually engaging presentation. Perfect for showcasing creative strategies, innovation frameworks, and growth opportunities, it helps you present your concepts with clarity and flow. Fully customizable and compatible with PowerPoint, Keynote, and Google Slides for a smooth professional experience.


23 diapositivas
Twilora Business Plan Presentation
Present your business strategy with a comprehensive and visually engaging template designed to impress stakeholders and investors. This template covers key elements of a business plan, including company background, market opportunities, business objectives, and key milestones. Showcase your product offerings, target audience, and competitive advantages through clear, professional visuals and data-driven charts. Highlight your financial performance, investment opportunities, and operational plans with precision and clarity. Tailor the design to reflect your brand's identity and goals. Fully compatible with PowerPoint, Google Slides, and Keynote, this versatile template is perfect for startups, established businesses, and entrepreneurs aiming to present a strong and compelling business case.


7 diapositivas
Processed Food Infographic
Indulge in the intricate world of processed foods with our meticulously crafted infographic. Garnished in a palate of clean white and bold red, this template offers a delectable insight into how our everyday foods transition from raw ingredients to the final product on supermarket shelves. Compatible with Powerpoint, Keynote, and Google Slides, our template offers detailed graphics, intuitive icons, and straightforward image placeholders that dive deep into the realm of processed foods. This is a must-have for nutritionists, dieticians, food bloggers, or any individual keen on educating others about the nuances of processed foods in our daily diet.


7 diapositivas
Modern Food Menu Presentation
Bring your ideas to the table with a clean and modern layout that turns any food-related content into an easy, visually appealing story. This presentation helps you showcase dishes, categories, or menu insights with clarity and style, making information simple to follow. Fully compatible with PowerPoint, Keynote, and Google Slides.


21 diapositivas
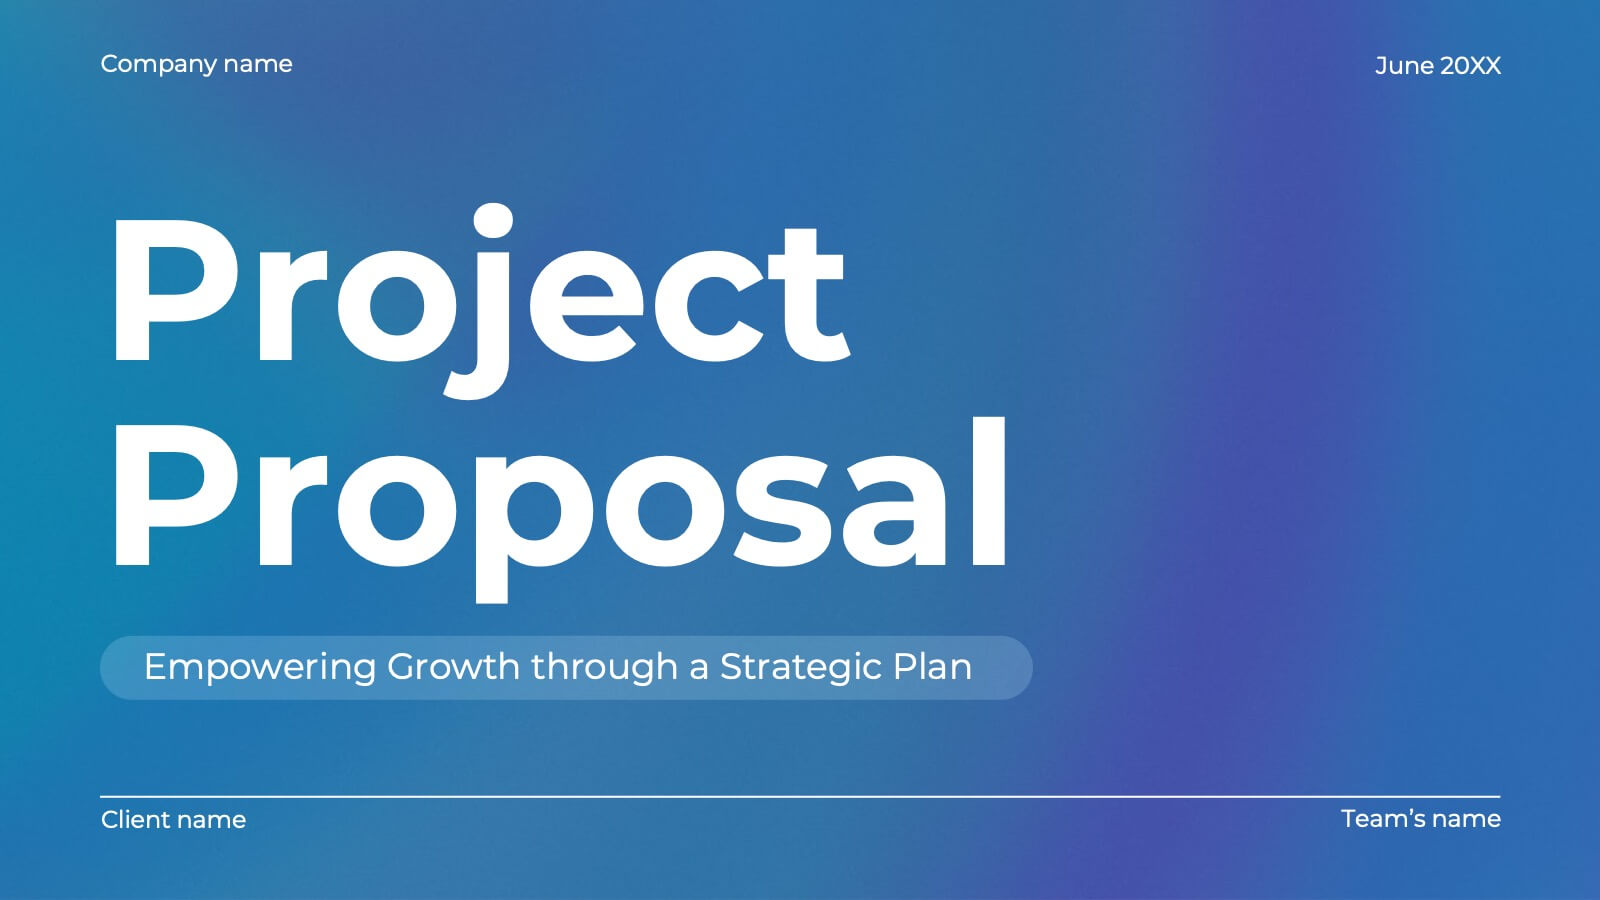
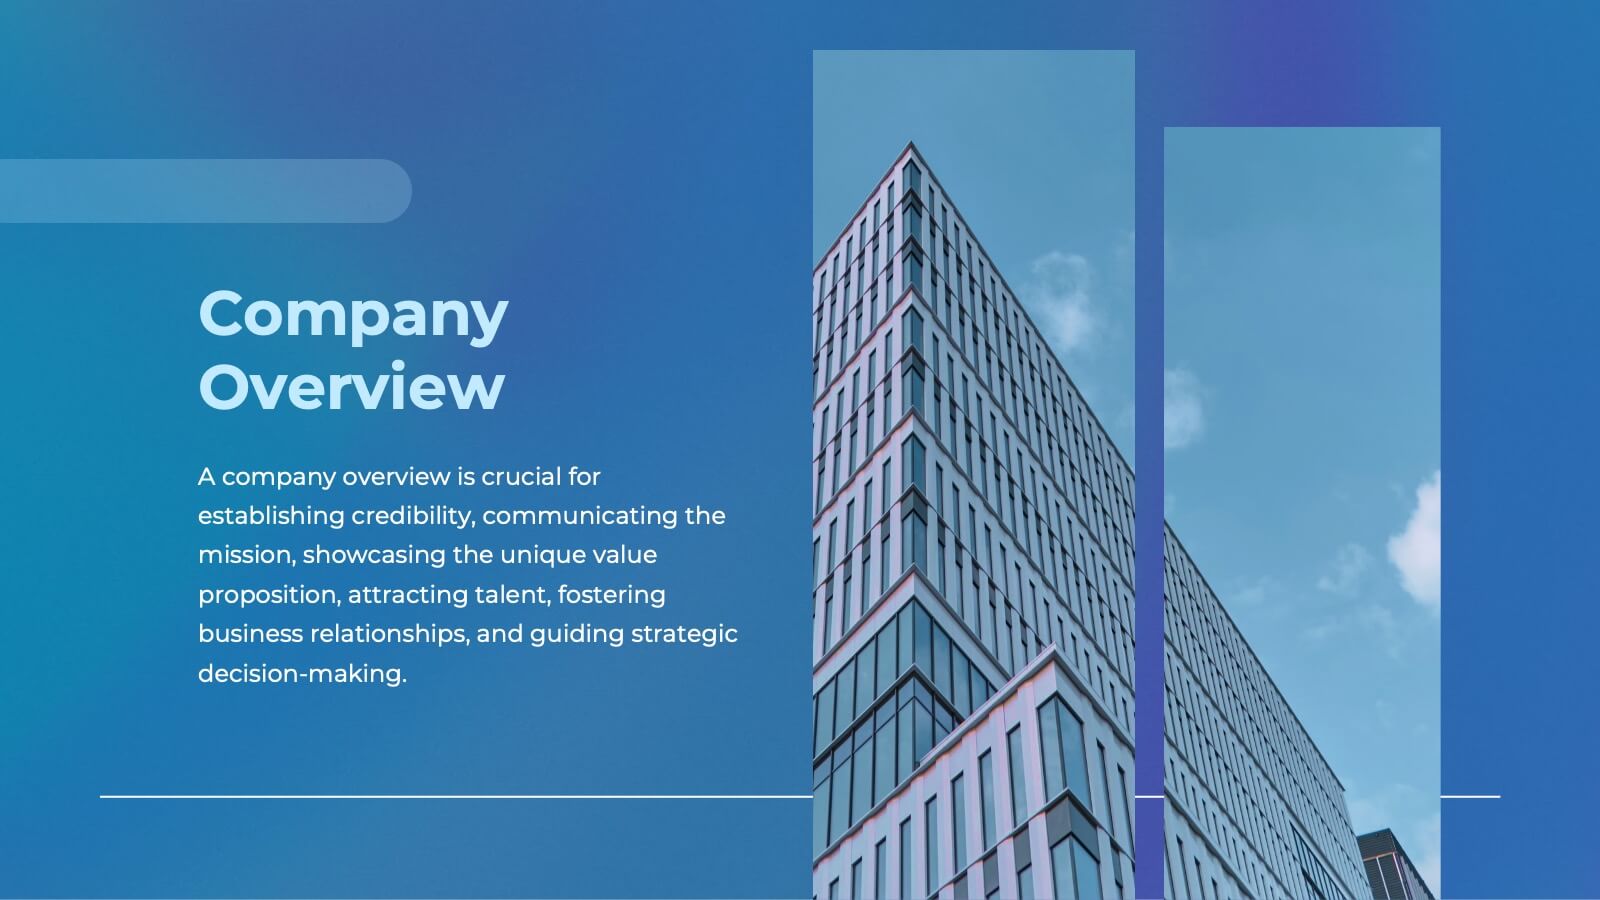
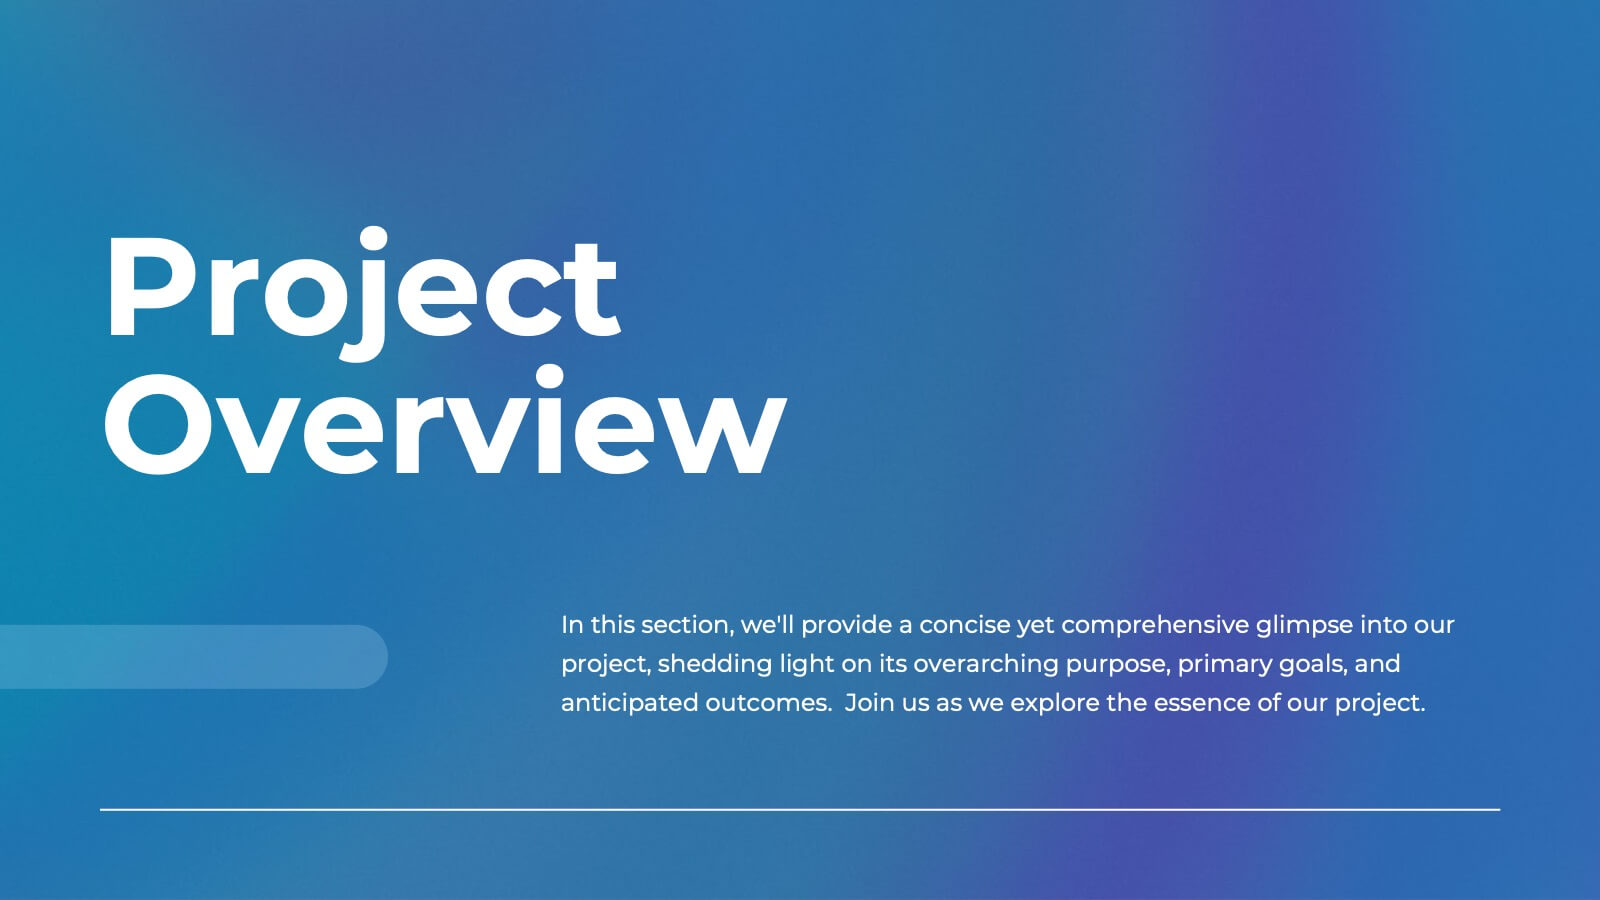
Ember Agile Project Plan Presentation
Ready to ace your next project proposal? This sleek presentation template is perfect for outlining objectives, timelines, and budgets. Designed for professionals aiming to impress stakeholders and secure approvals. Compatible with PowerPoint, Keynote, and Google Slides, it ensures a smooth and professional presentation every time. Ideal for project managers and business leaders.


4 diapositivas
Problem Tracing with Fishbone Diagram Presentation
Identify root causes clearly with the Problem Tracing with Fishbone Diagram Presentation. This template features a horizontal, fish-shaped layout with six categories represented in vertical columns, helping you trace issues back to their source. Ideal for quality control, brainstorming, and strategic reviews. Fully editable in PowerPoint, Keynote, and Google Slides.


5 diapositivas
IT Support and Systems Presentation
Streamline your tech communication with a clean, structured layout that highlights your IT services, support processes, and system workflows. Perfect for teams presenting solutions, infrastructure overviews, or technical strategies, this presentation brings clarity to complex topics. Fully compatible with PowerPoint, Keynote, and Google Slides for effortless editing and delivery.