


Características


¿Tienes alguna pregunta?
Recomendar


4 diapositivas
Meet the Business Team Presentation
Ignite curiosity from the start with a clean, modern layout designed to introduce your team with clarity and confidence. This presentation highlights key roles, expertise, and contributions, helping audiences quickly understand who drives the work forward. Fully editable and easy to customize in PowerPoint, Keynote, and Google Slides.


21 diapositivas
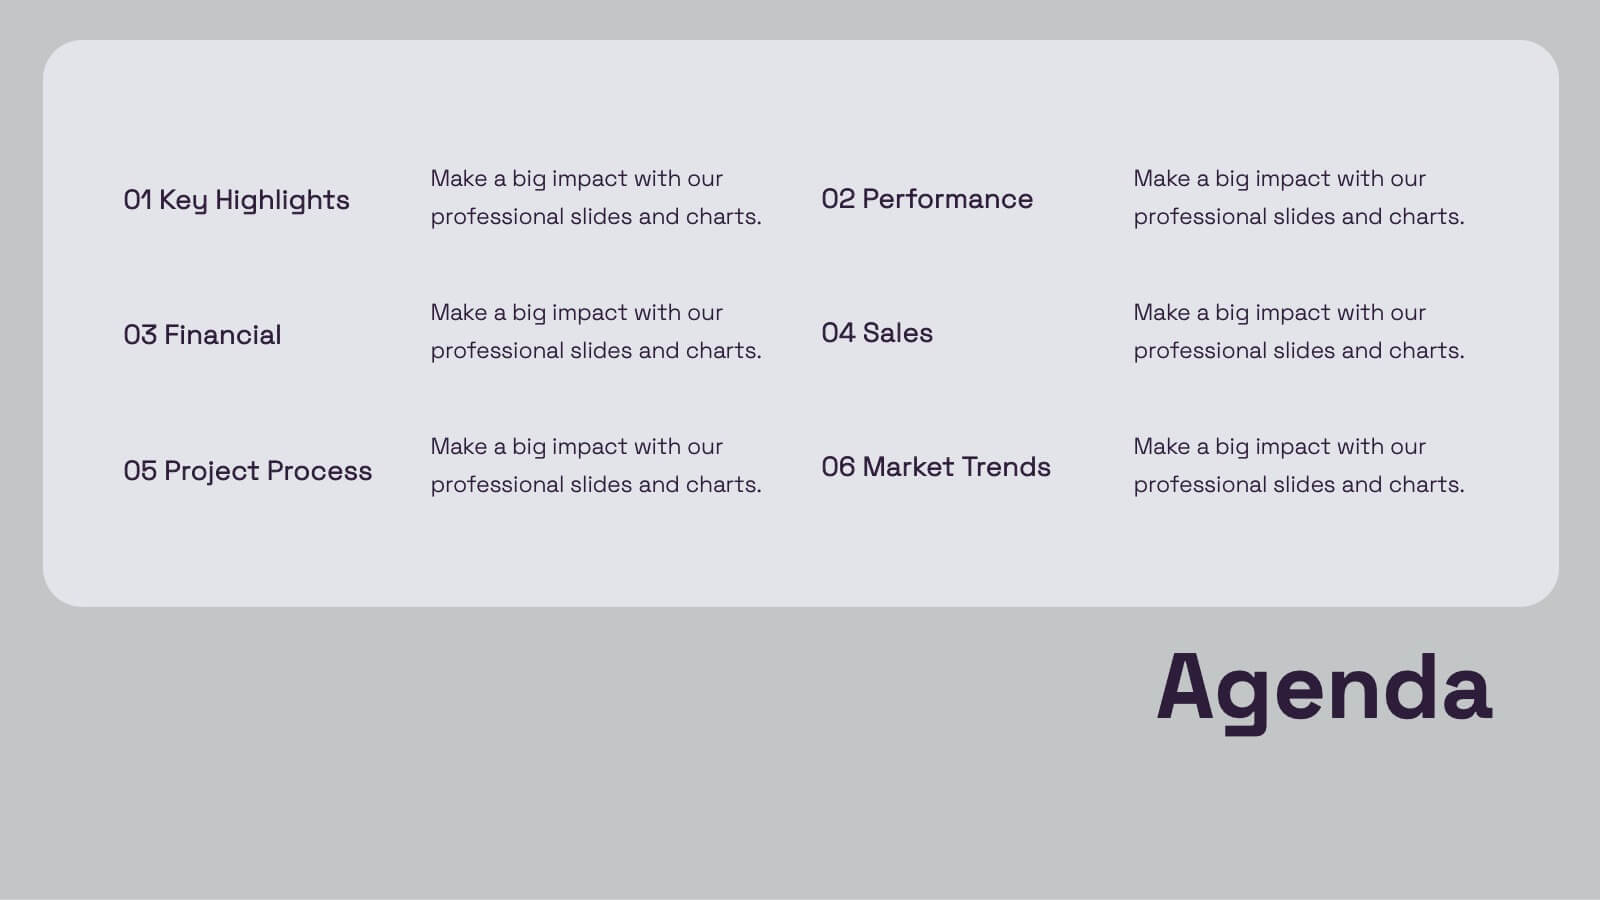
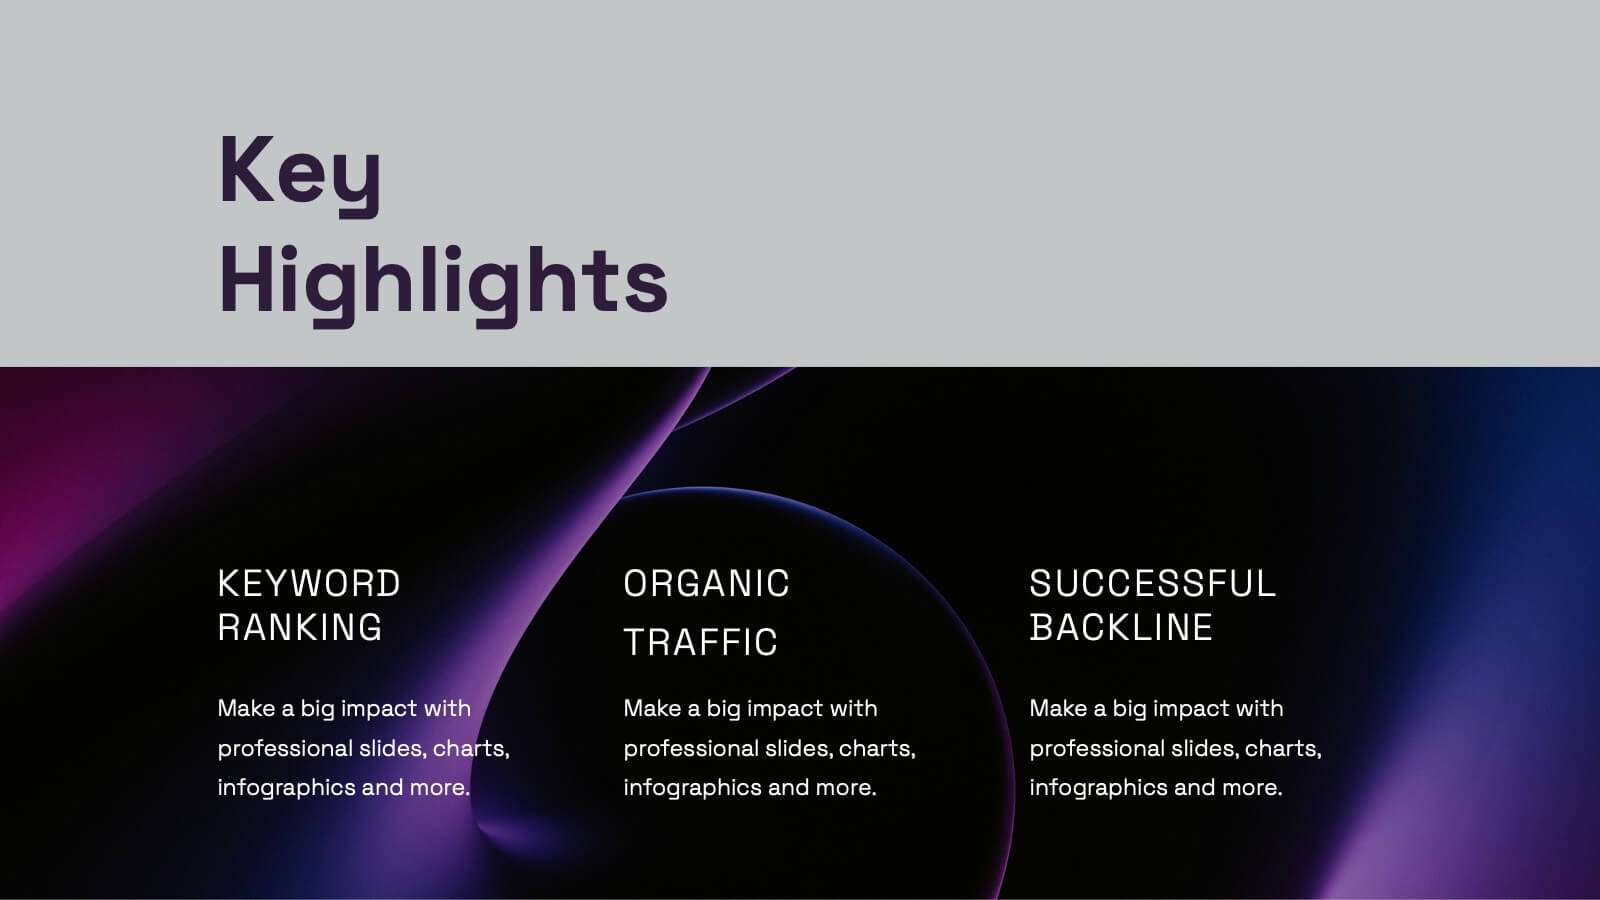
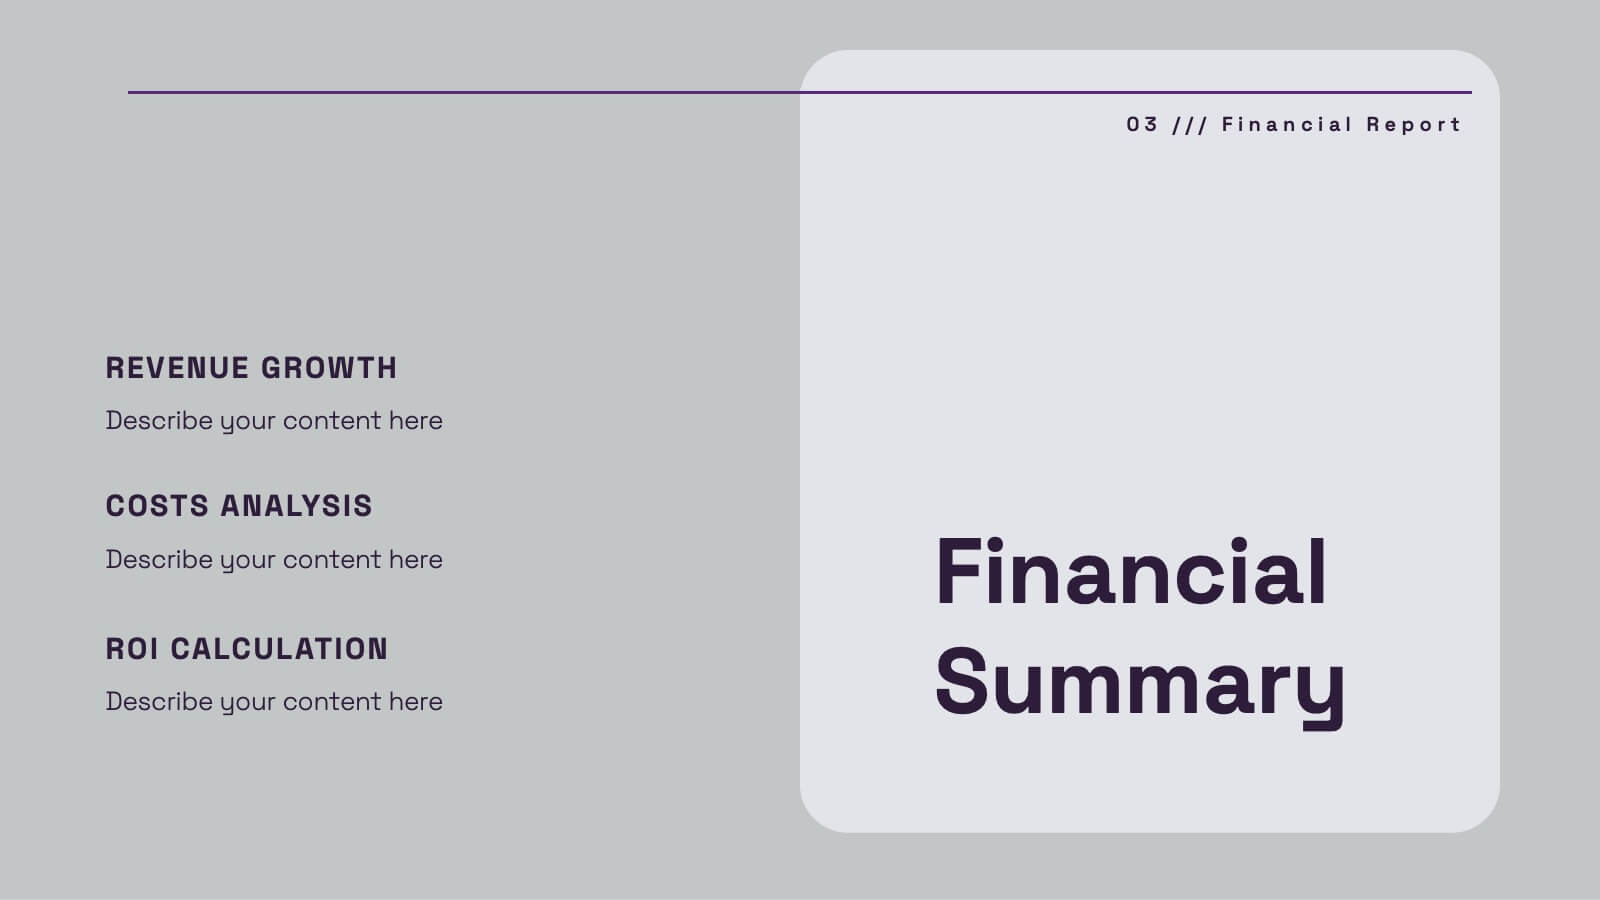
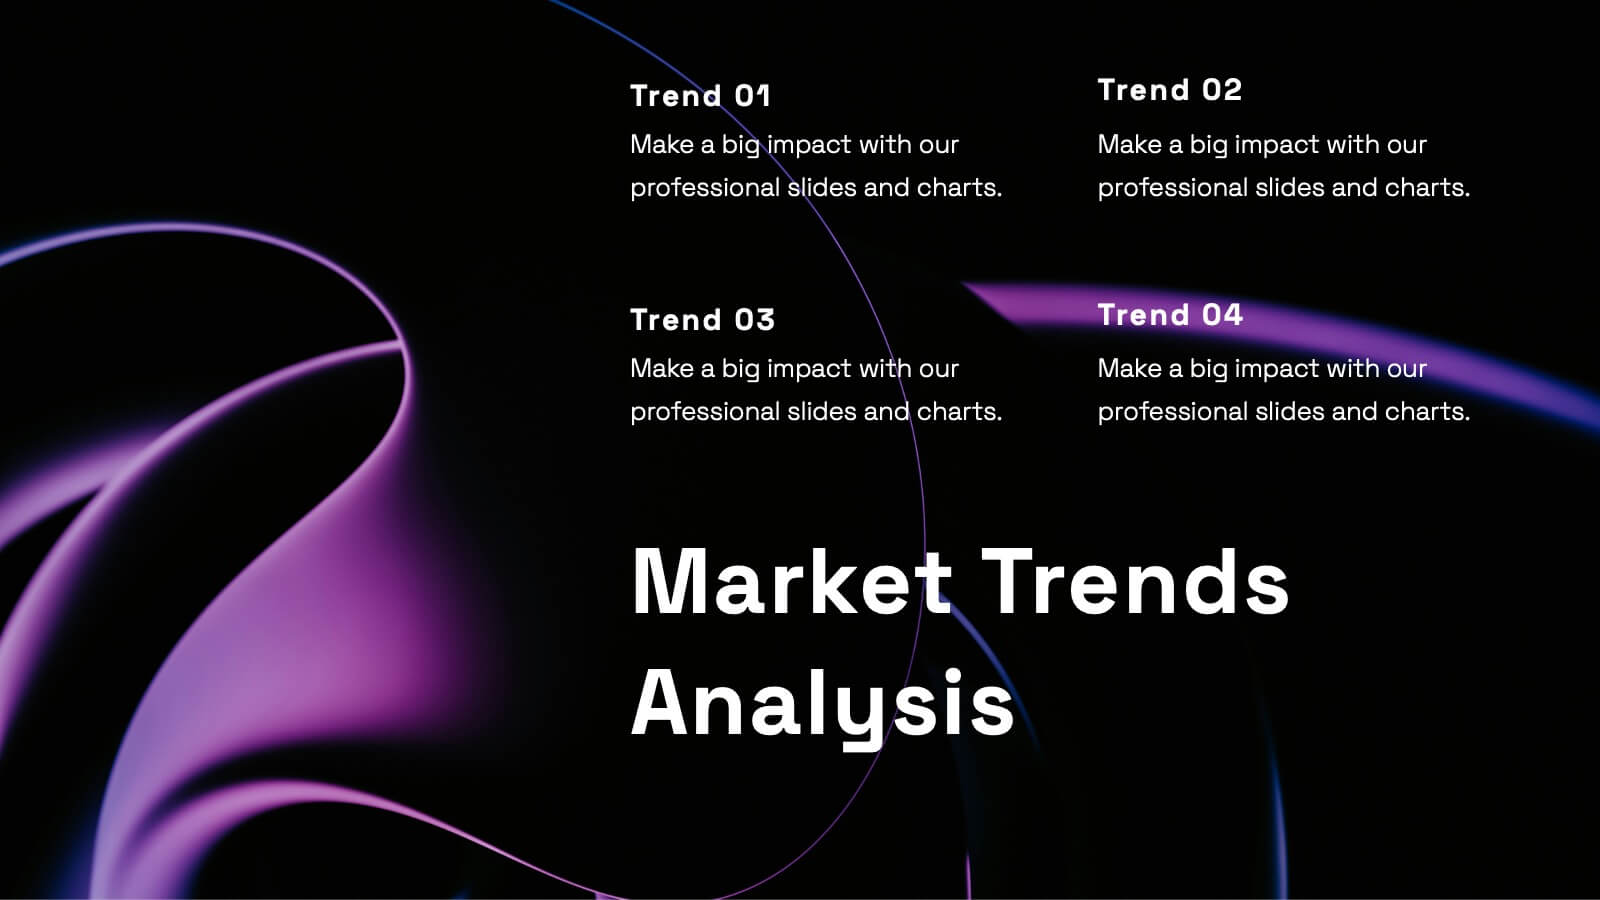
Uplift Financial Report Presentation
Present your financial or business report with this sleek and modern presentation template! It includes essential sections such as performance metrics, financial summaries, project progress, and market trends analysis, ensuring a comprehensive overview. Whether you're discussing key achievements or competitor insights, this template is perfect for delivering a professional and polished report. Compatible with PowerPoint, Keynote, and Google Slides for easy use and customization.


6 diapositivas
Human Resources Job Infographic
Human Resources (HR) refers to the department or function within an organization that is responsible for managing the human capital, workforce, and related processes. This infographic template serves as a helpful guide for individuals interested in pursuing a career in HR or for HR professionals looking to understand the different career paths and opportunities available in their field. This infographic uses visuals, icons, and graphics to make the content more engaging and easily understandable. The layout of the infographic is organized and easy to navigate, allowing viewers to quickly find information about different HR job roles.


6 diapositivas
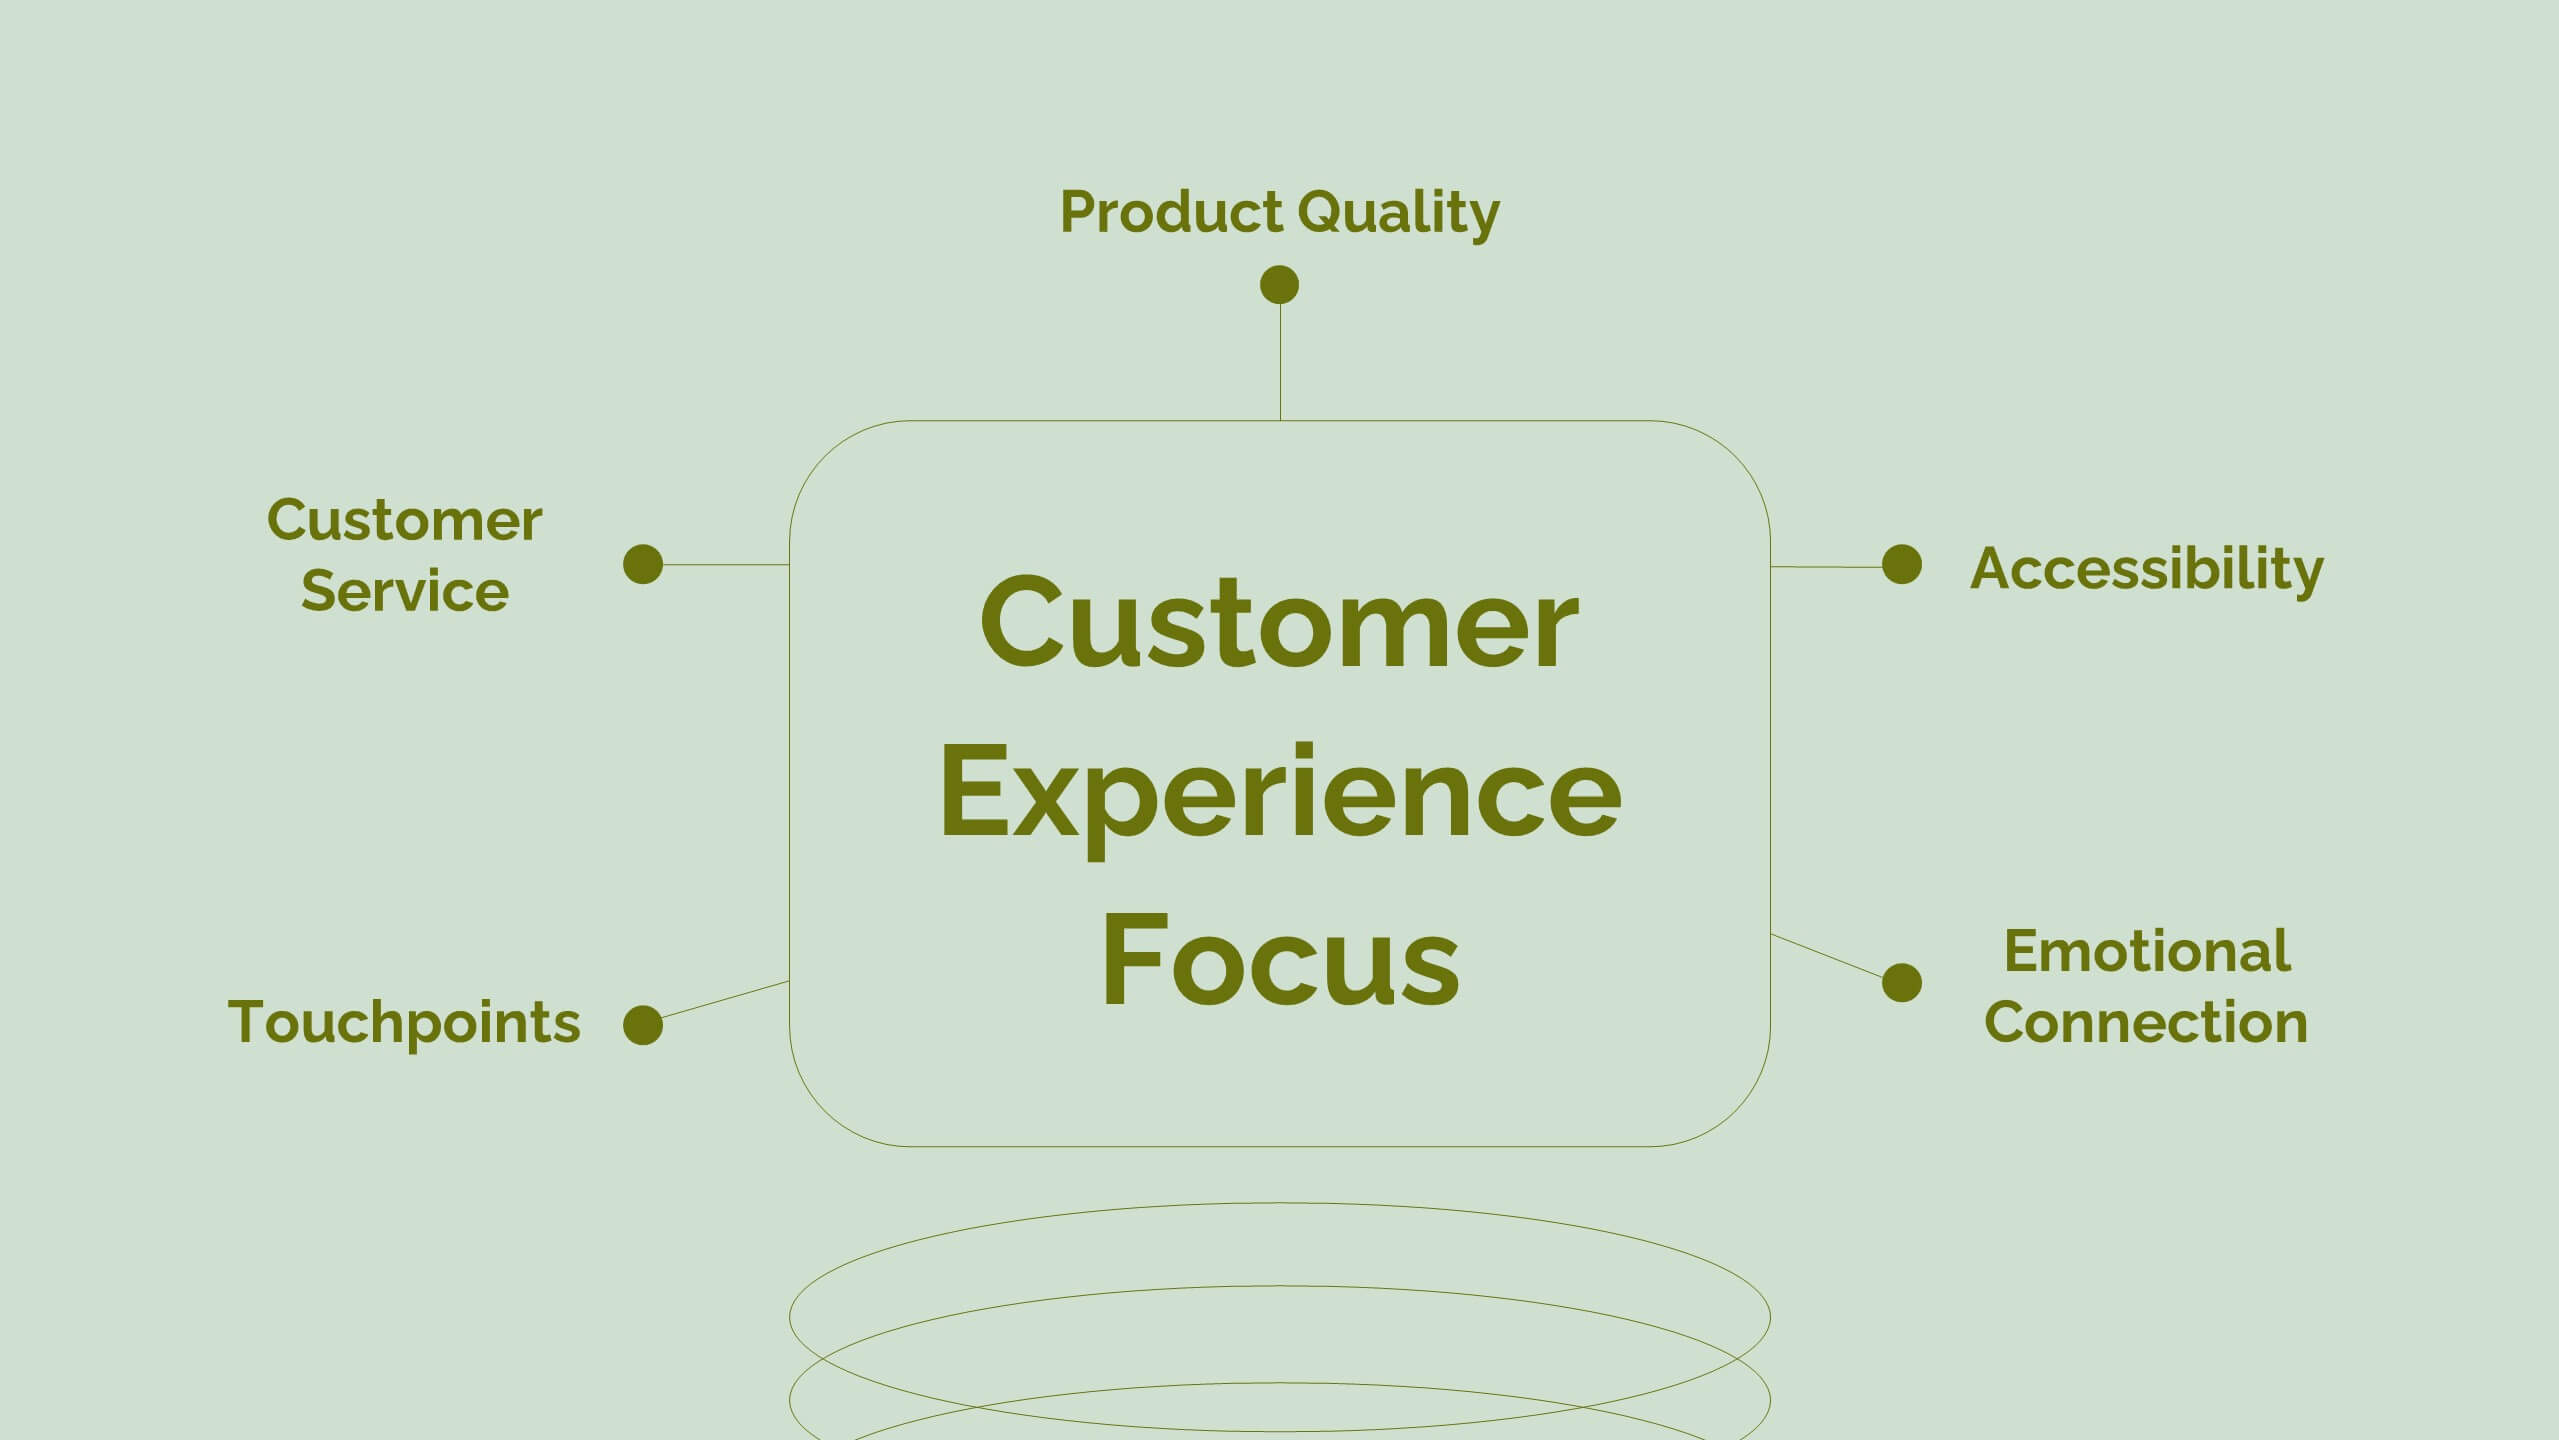
Customer Perceived Value Analysis
Visualize what matters most to your audience using this customer-centric diagram. Perfect for marketers, brand strategists, and CX professionals looking to present value drivers, motivations, or user insights. Easily editable in PowerPoint, Keynote, and Google Slides—customize colors, icons, and text to align with your brand.


22 diapositivas
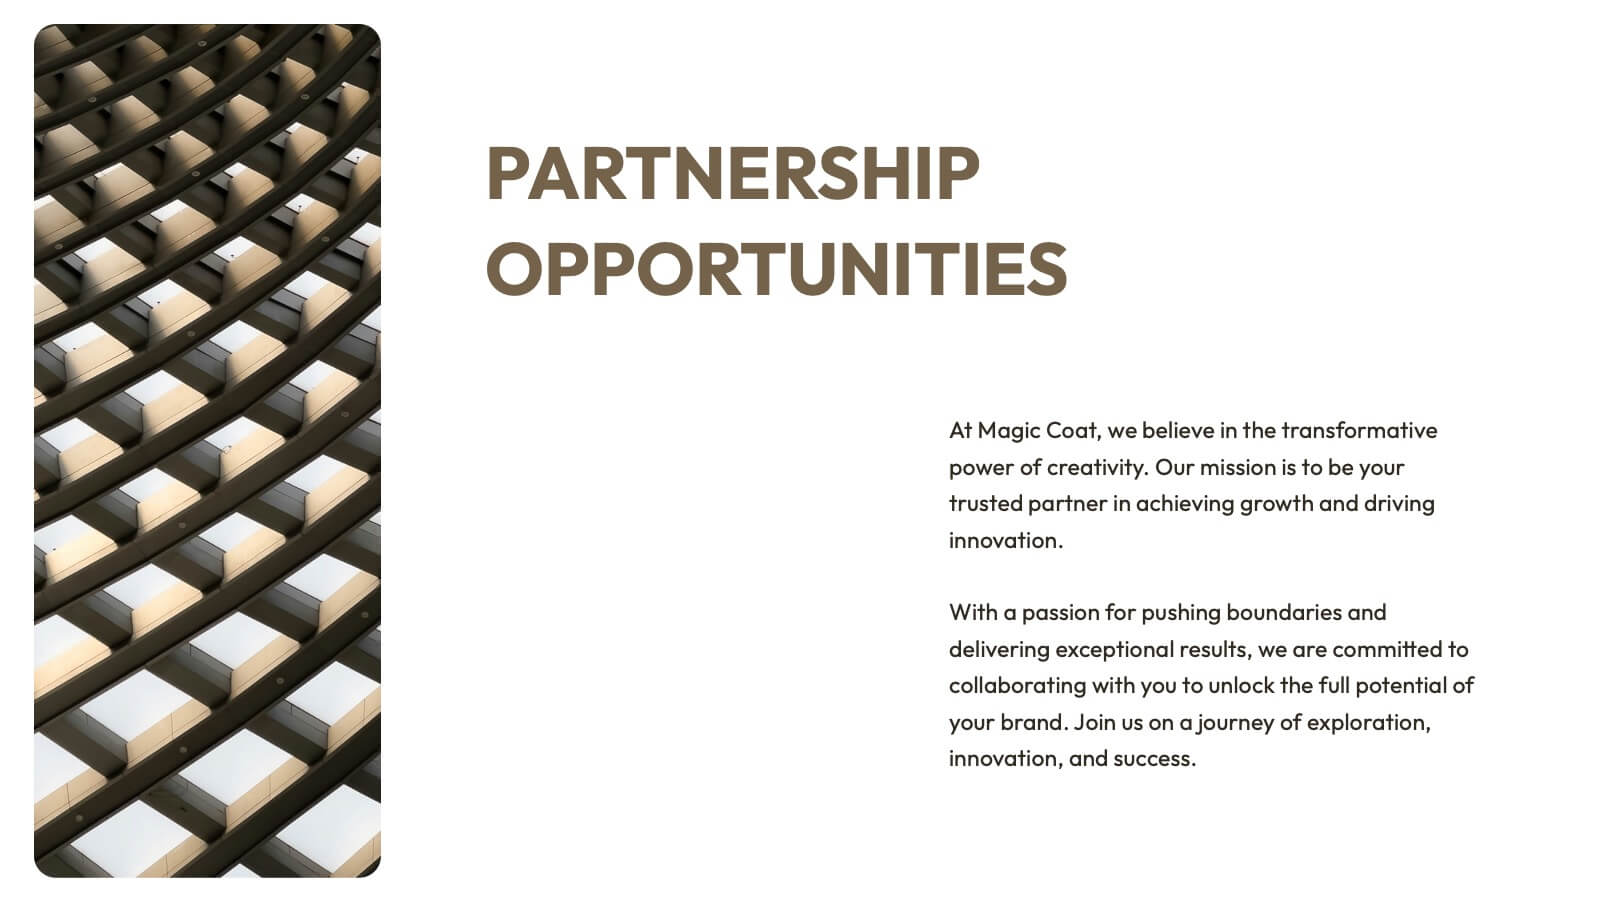
Vivid Creative Agency Pitch Deck Presentation
This sleek creative agency template is ideal for presenting your company's mission, services, and success stories. With a minimalist design, it offers a professional yet stylish approach to showcase case studies, industry trends, and partnership opportunities. It’s perfect for PowerPoint, Keynote, and Google Slides, making your agency stand out with every slide.


5 diapositivas
Large Scale Data Insights Presentation
A clean, modern slide that makes complex information feel surprisingly easy to explain, this layout helps you break down large-scale data in a way your audience can instantly understand. Use it to outline key insights, visualize processes, or highlight system components. Fully compatible with PowerPoint, Keynote, and Google Slides.


6 diapositivas
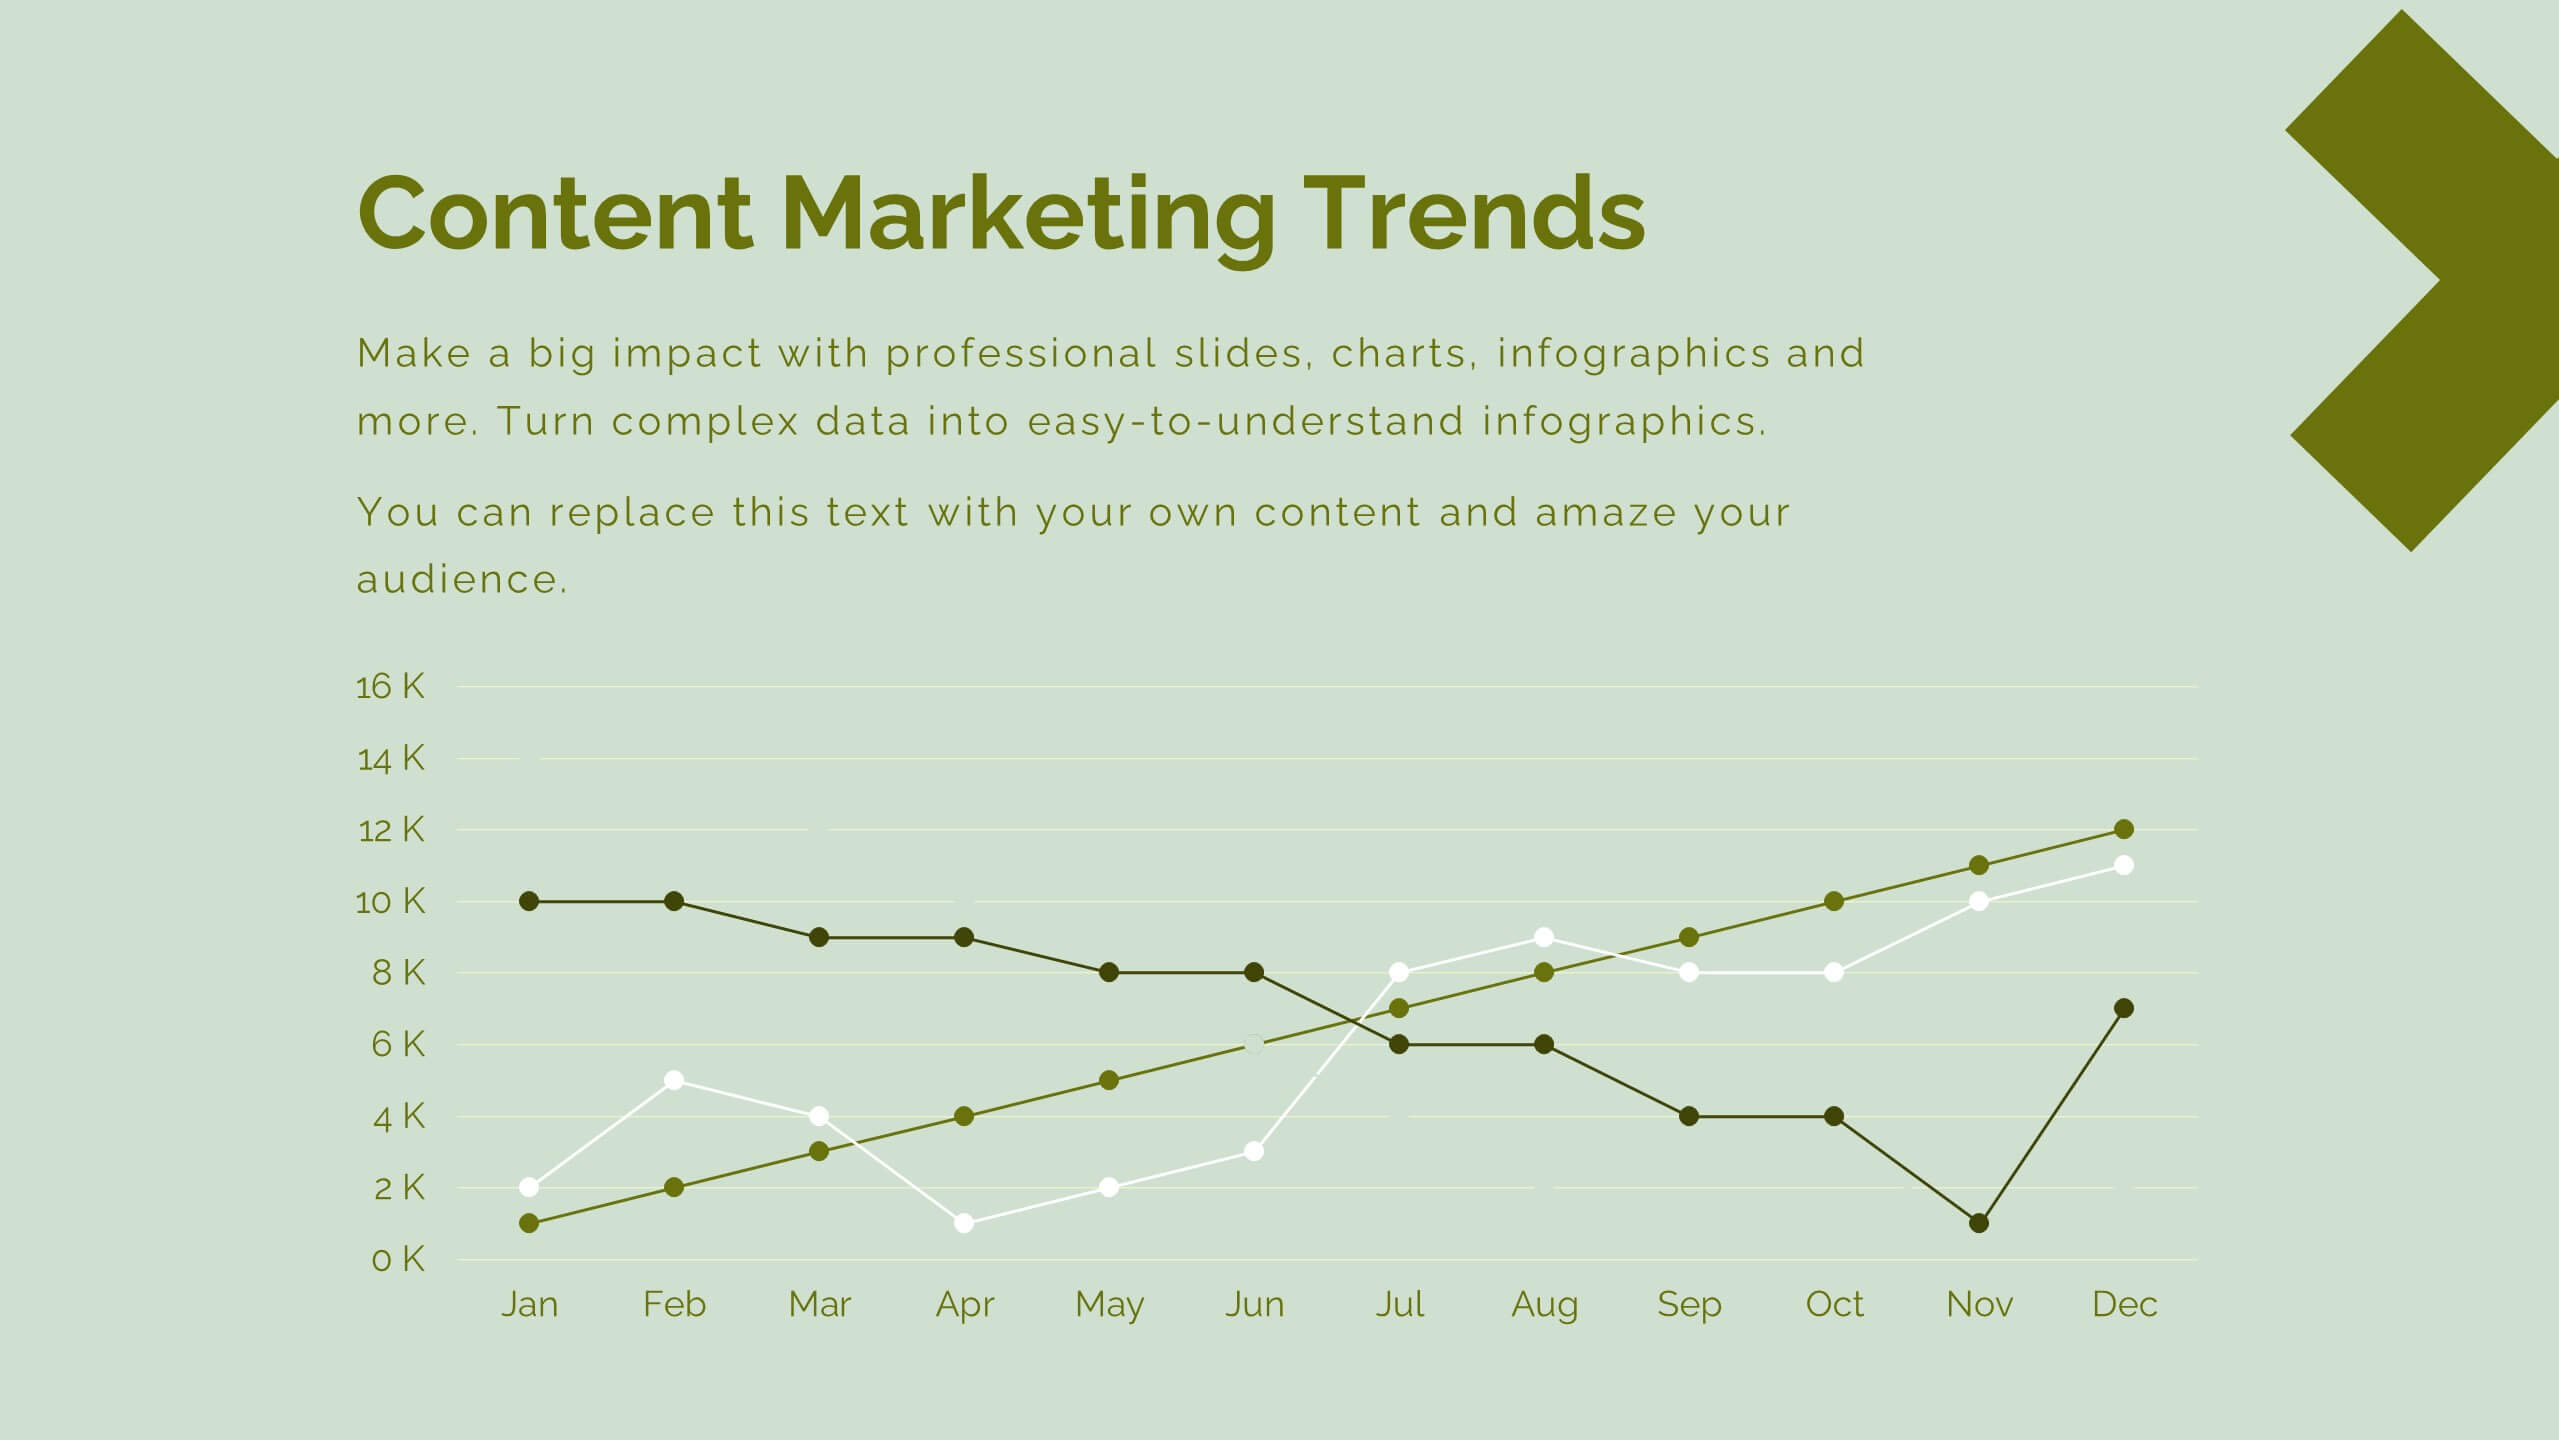
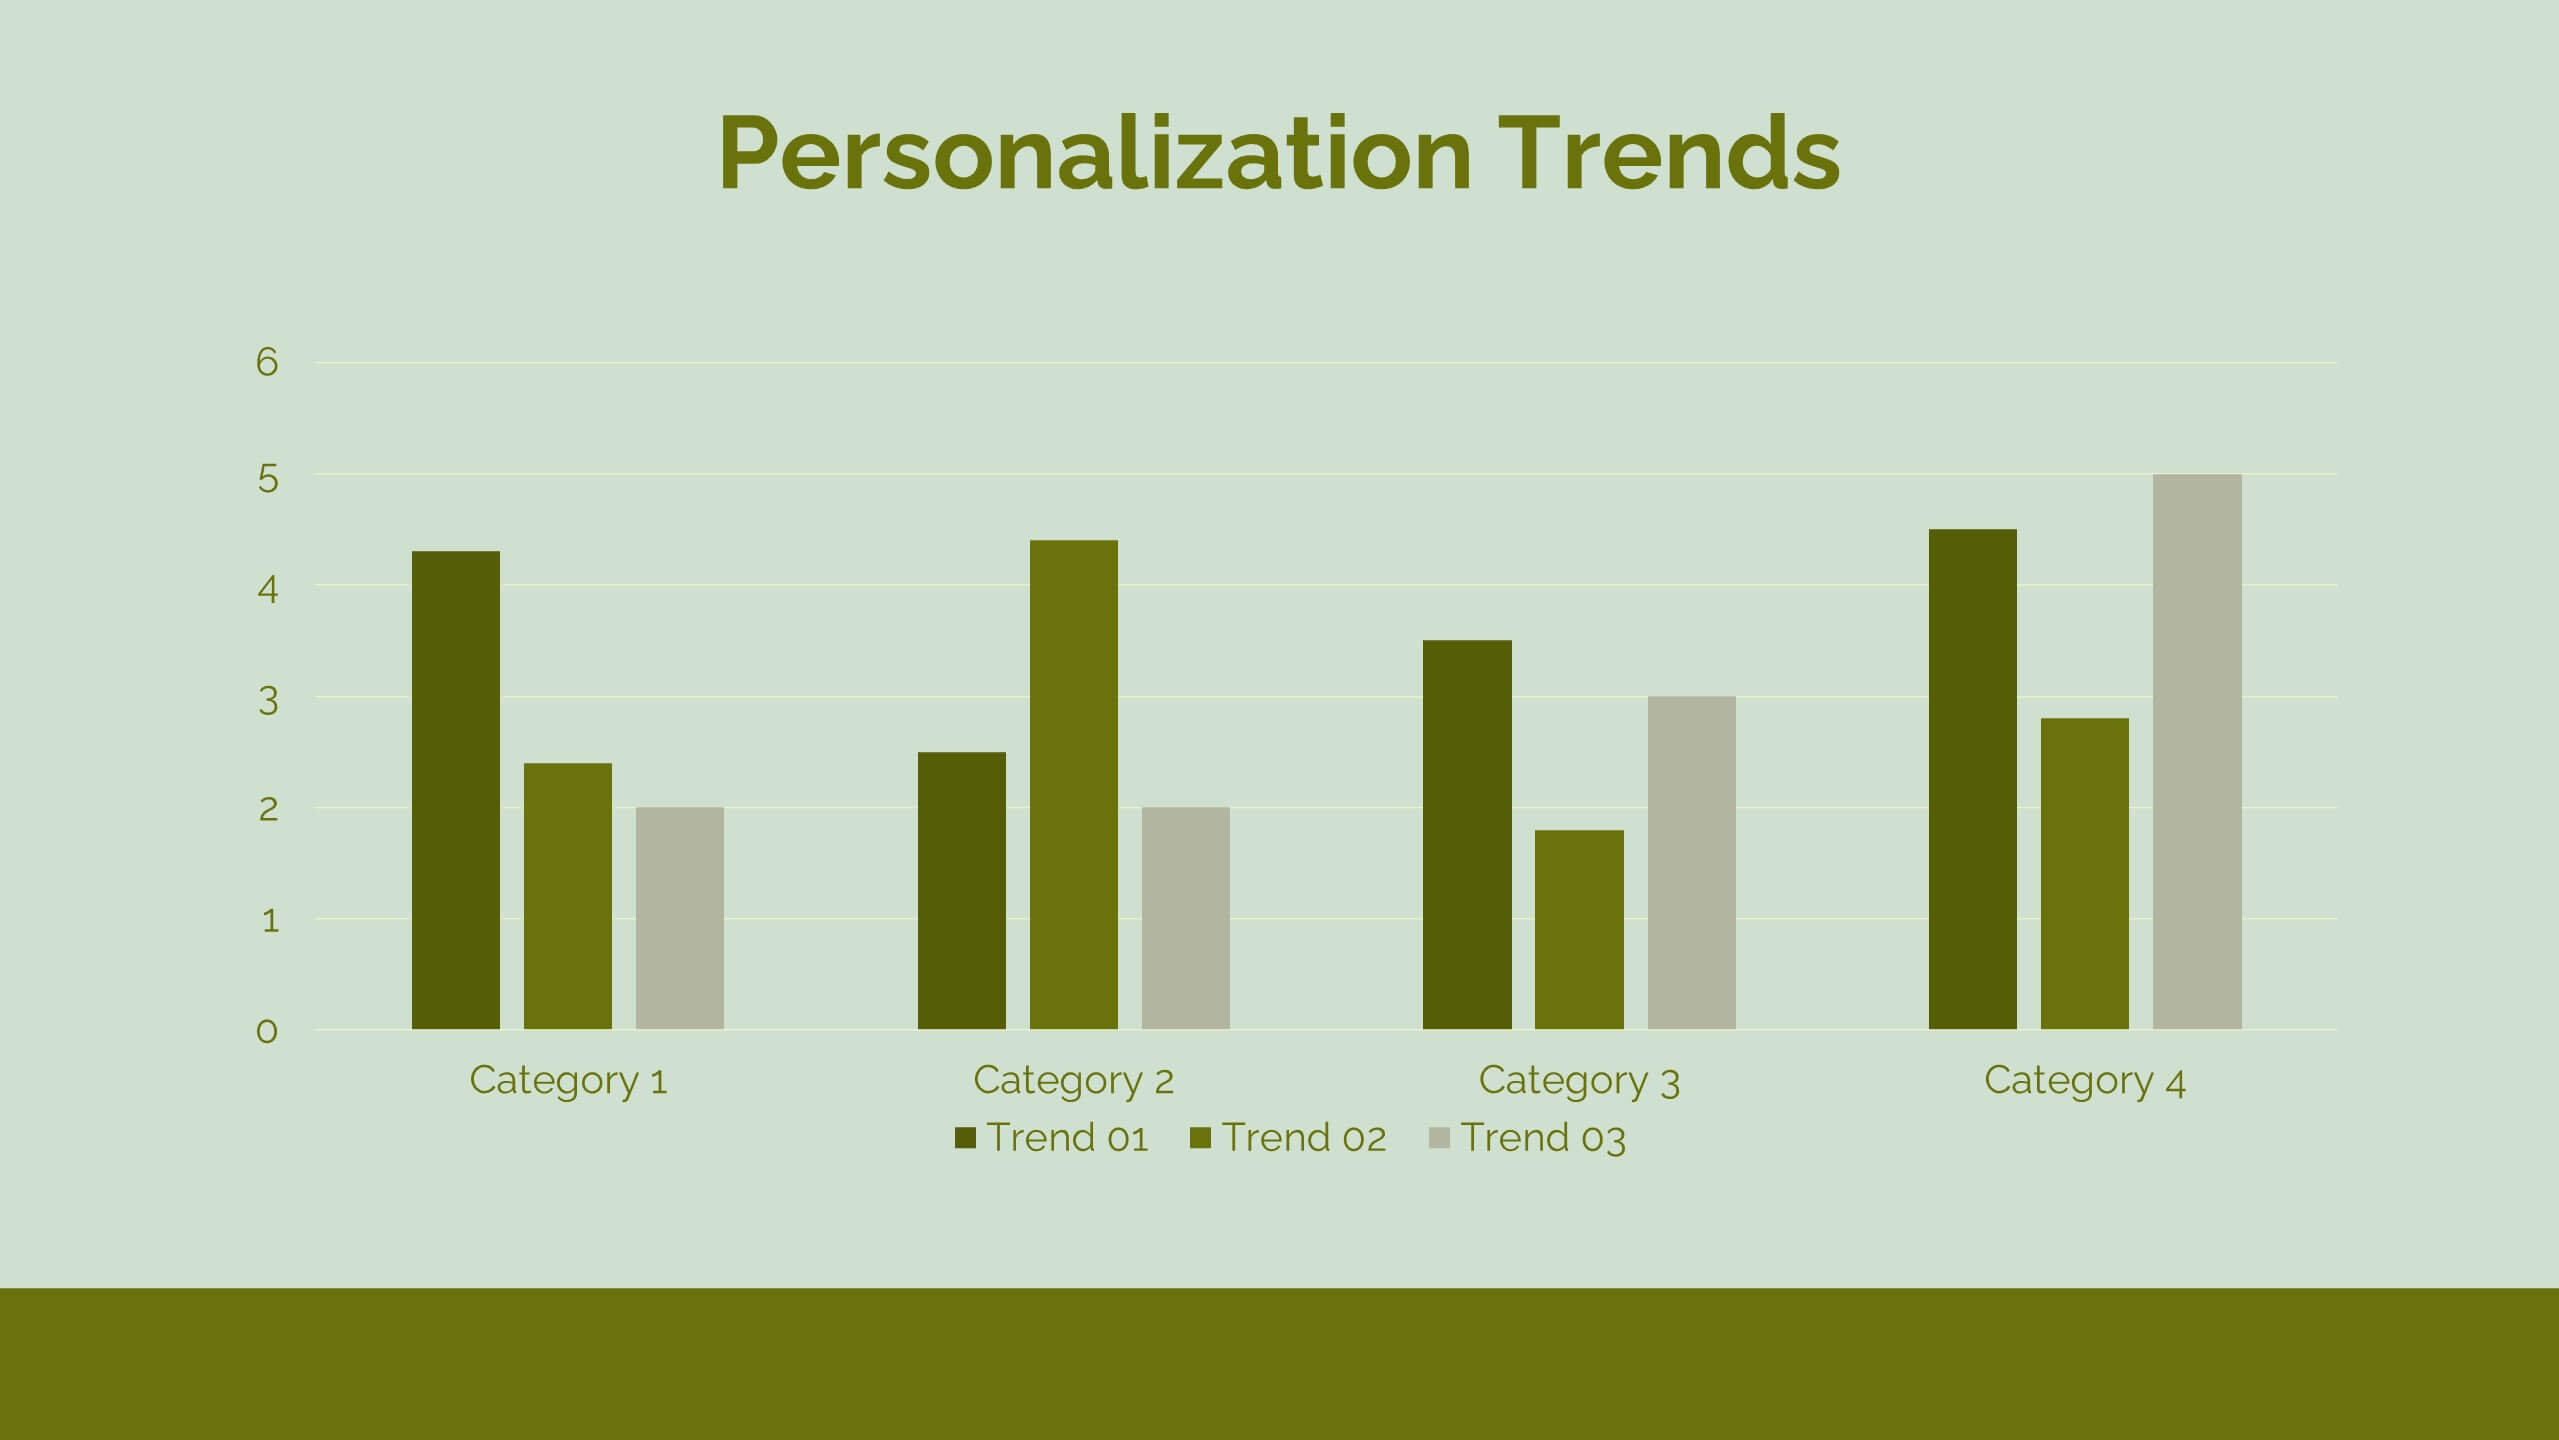
Trends and Forecast Through Data Analytics Presentation
Visualize growth trajectories and future performance with the Trends and Forecast Through Data Analytics Presentation. Featuring clean bar charts and segmented legends, this template is ideal for financial projections, sales trends, and business growth analysis. Fully editable in PowerPoint, Keynote, and Google Slides for seamless customization.


5 diapositivas
Scrum Methodology for Project Management Presentation
Visualize your team’s process with this Scrum Methodology for Project Management Template. Featuring dynamic arrow and gear illustrations, this slide helps convey product development cycles, sprint planning, reviews, and retrospectives in a clean, engaging format. Fully editable and ready for PowerPoint, Keynote, and Google Slides.


5 diapositivas
Operational Process Logic Map
Visualize how every function interconnects with the Operational Process Logic Map Presentation. This template uses a radial node structure to break down workflows, responsibilities, or systems into logical clusters, showing how different units or steps interact within an operational framework. Each node is color-coded and icon-marked for clarity, ideal for explaining process flows, department roles, or system dependencies. Fully editable in PowerPoint, Keynote, and Google Slides.


7 diapositivas
5G Advantages Infographic
Explore the power of 5G with this engaging infographic template, designed to clearly showcase the technology's many benefits. Ideal for educators, tech enthusiasts, and professionals, it highlights how 5G enhances connectivity, speeds up data transfer, and supports innovations like smart cities and IoT devices. With vibrant graphics and simple explanations, it makes complex concepts easy to understand. Use this tool in classrooms, workshops, or online to educate and inspire others about 5G's transformative impact on industries like healthcare, entertainment, and finance. Discover the future of technology and how 5G is making it happen today!


26 diapositivas
Navigating the Creative Industry Presentation
Unlock the secrets to success in the creative industry with this dynamic and visually engaging presentation. Covering essential topics like career pathways, industry trends, collaboration strategies, and personal branding, this template helps you present insights with clarity and impact. Fully customizable and compatible with PowerPoint, Keynote, and Google Slides for a seamless experience.


7 diapositivas
Bubble Map Infographics Presentation Template
Our Bubble Map Infographic is an easy-to-create, visually appealing way to display your data. This template is perfect for educators looking to engage their audience, and for anyone wanting to share information in an interesting way. The graphics are easy to customize by adding your own text or images and there are PowerPoint versions available. This template features a lot of animated bubbles that will help illustrate your points, making them easier to understand than ever before. The color-coded categories make it easy to navigate through the dots and find whatever you need with ease.


20 diapositivas
Axisflare Artist Portfolio Presentation
Showcase your creative journey with this vibrant artist portfolio template, featuring sections for project highlights, philosophy, style, and client testimonials. Ideal for presenting your work and artistic approach, this template is compatible with PowerPoint, Keynote, and Google Slides for seamless presentation across various platforms.


6 diapositivas
Creating Effective Buyer Persona Strategies Presentation
Present your audience research with clarity using this buyer persona strategy slide. Designed with a radial layout of five icons leading to a central profile, this template helps communicate key traits, behaviors, and preferences. Ideal for marketing teams, branding workshops, and product strategy sessions. Easily customizable in PowerPoint, Keynote, and Google Slides.


5 diapositivas
Educational Planning & Class Activities Presentation
Organize your lessons with this creative education-themed layout. Featuring a playful stack of books and apple illustration, this slide is ideal for outlining academic plans, class objectives, or weekly activities. Fully editable in PowerPoint, Keynote, and Google Slides—perfect for teachers, homeschoolers, and education professionals seeking clarity and visual appeal.


20 diapositivas
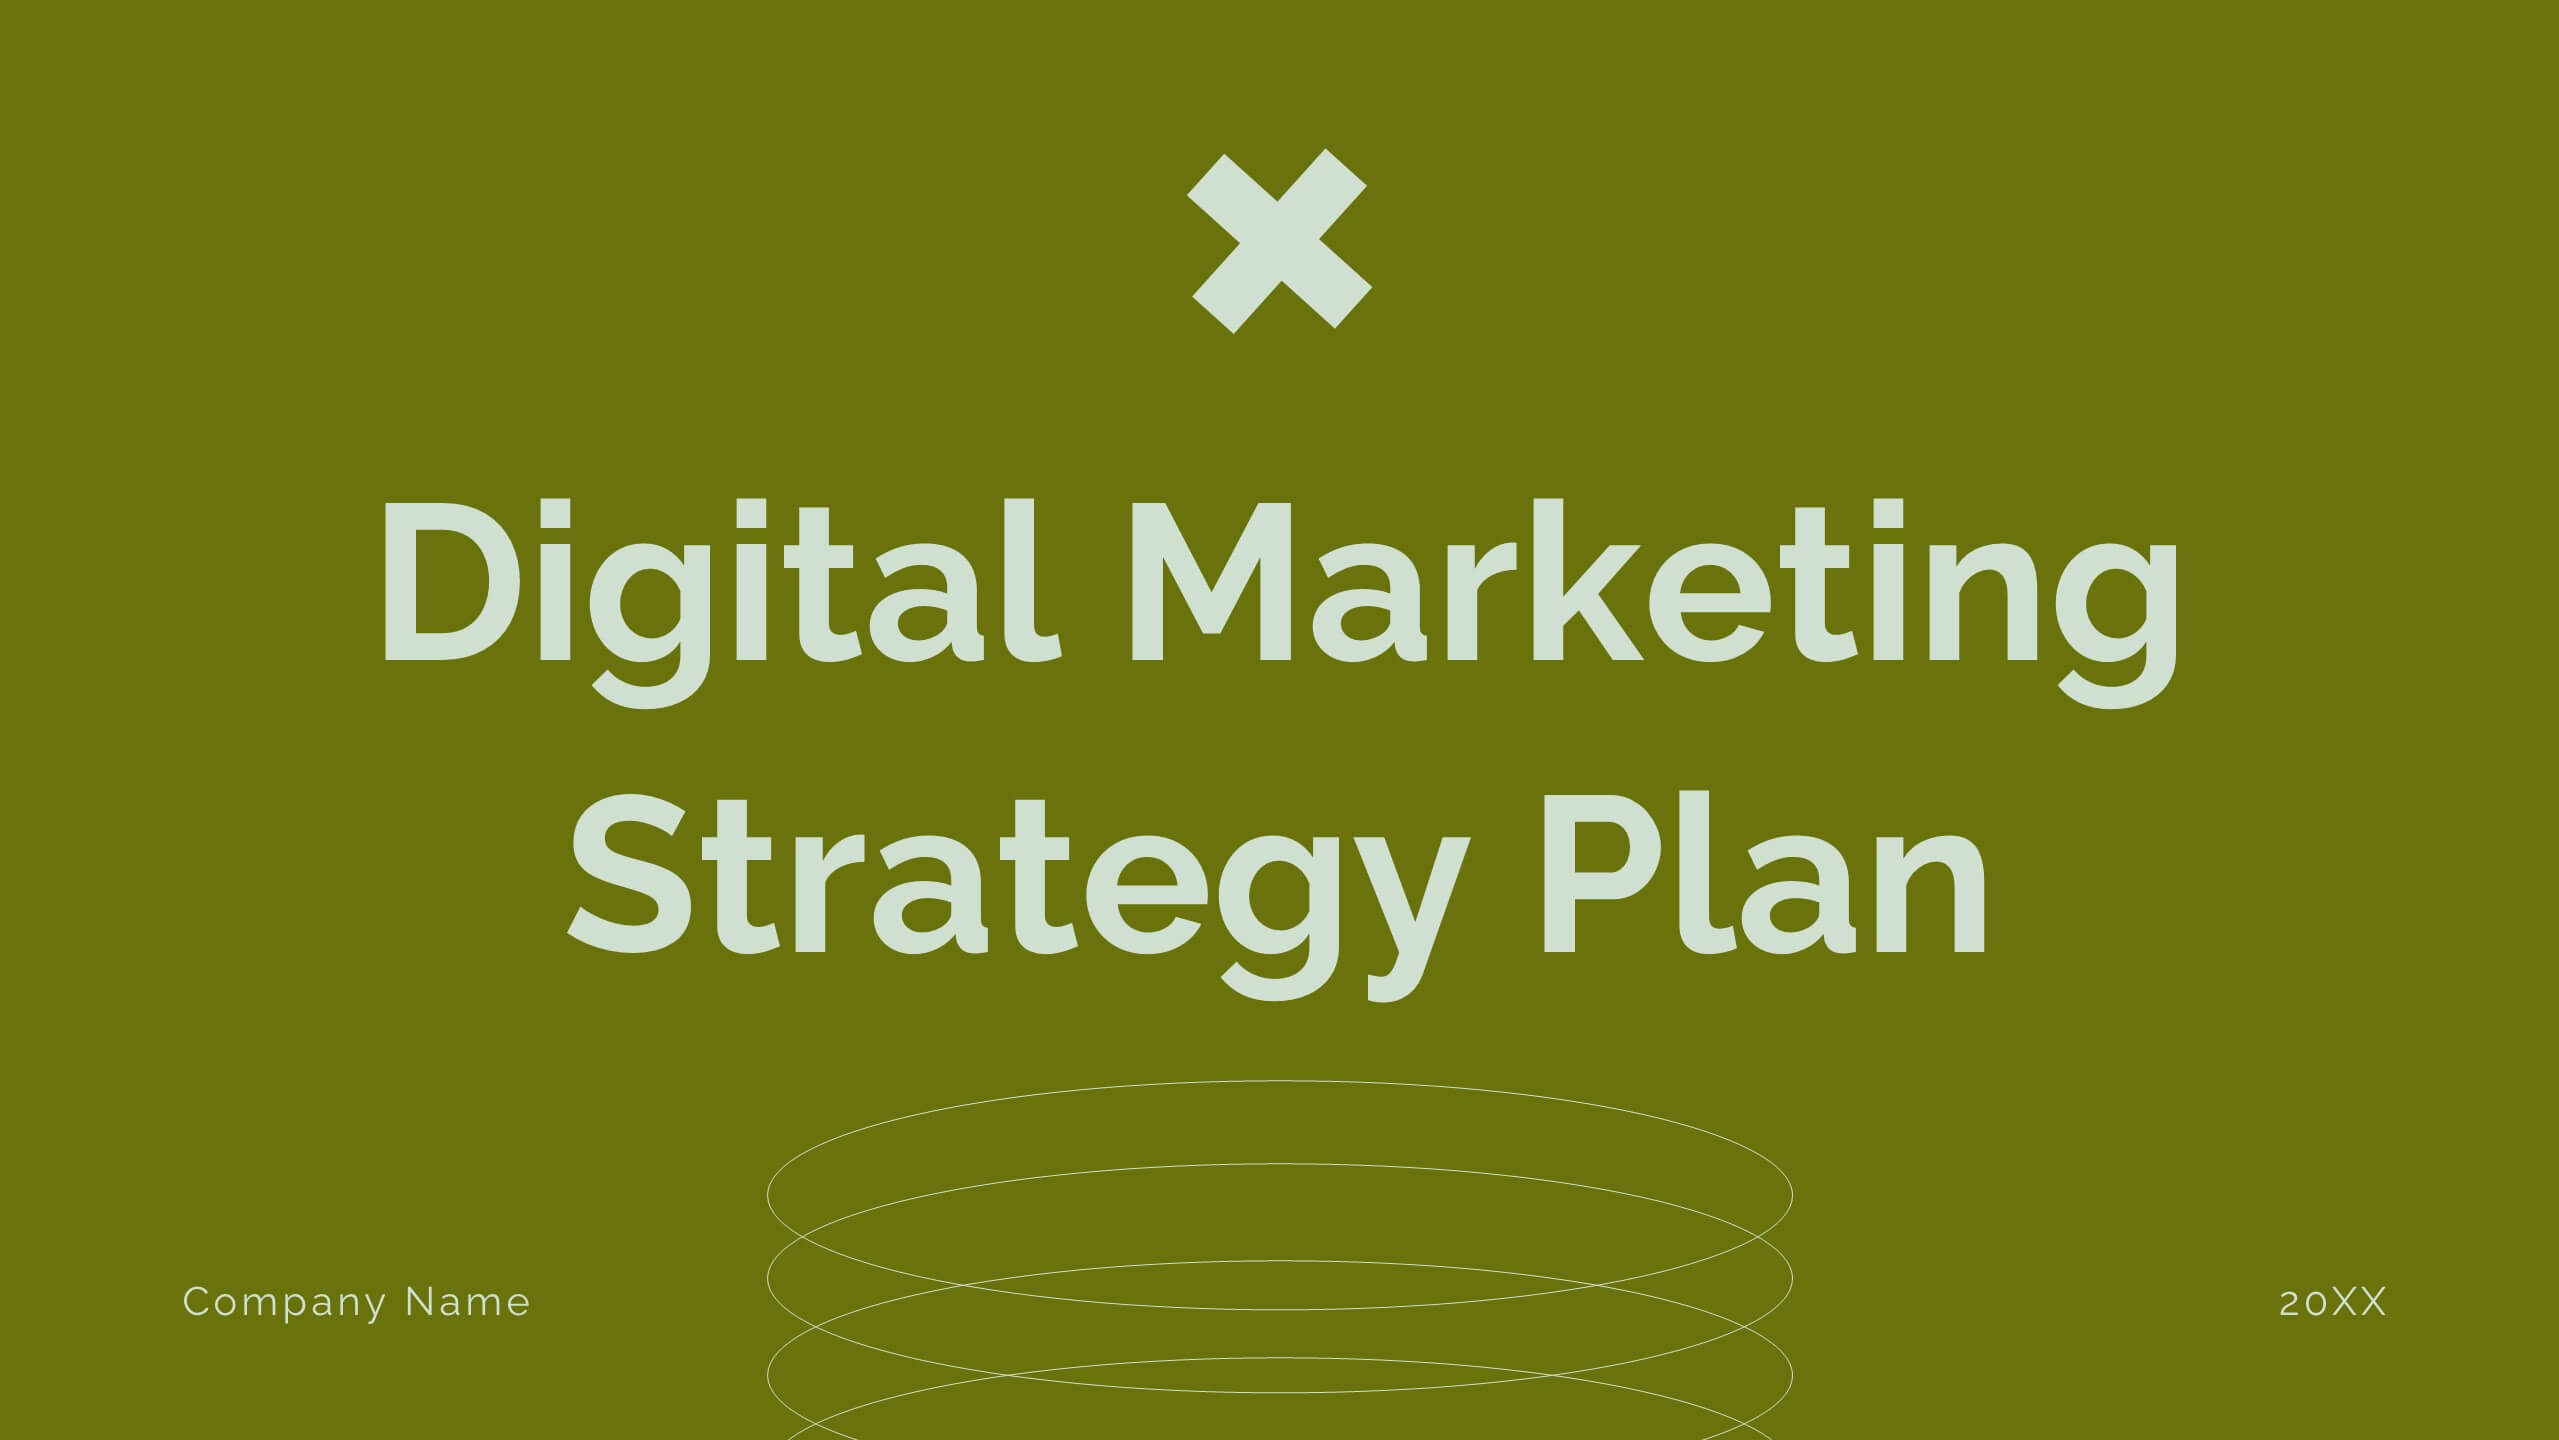
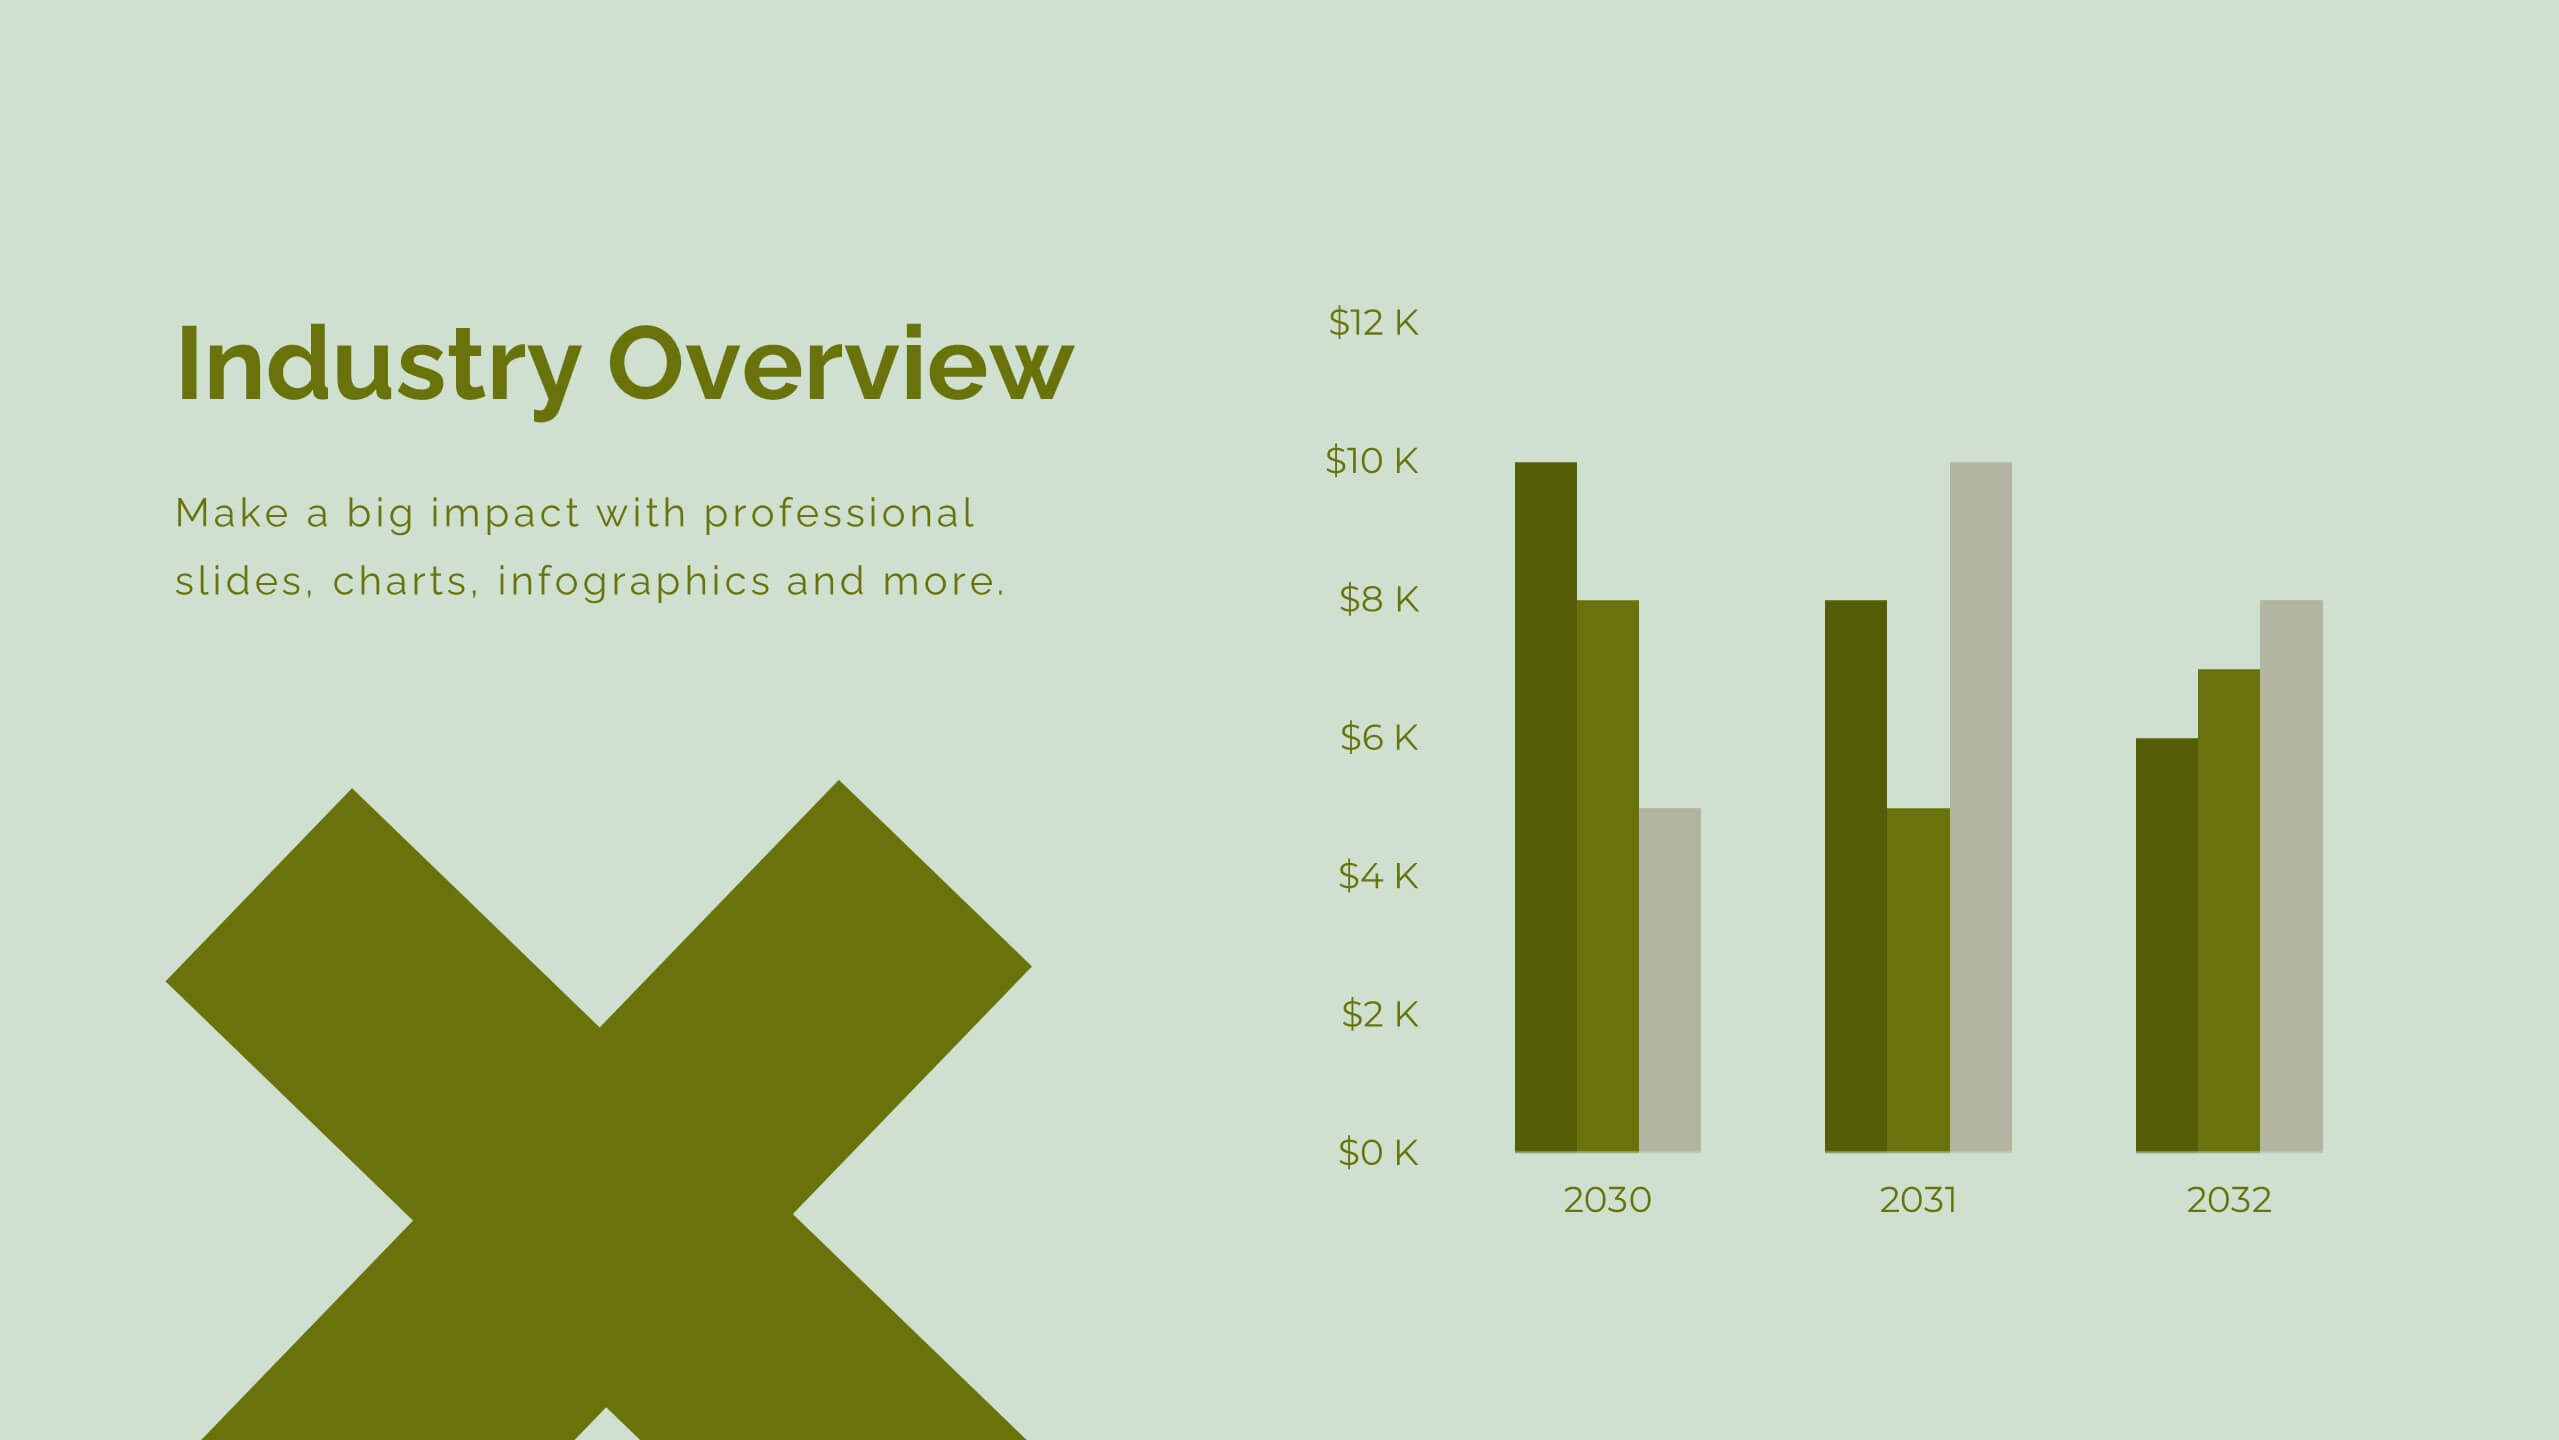
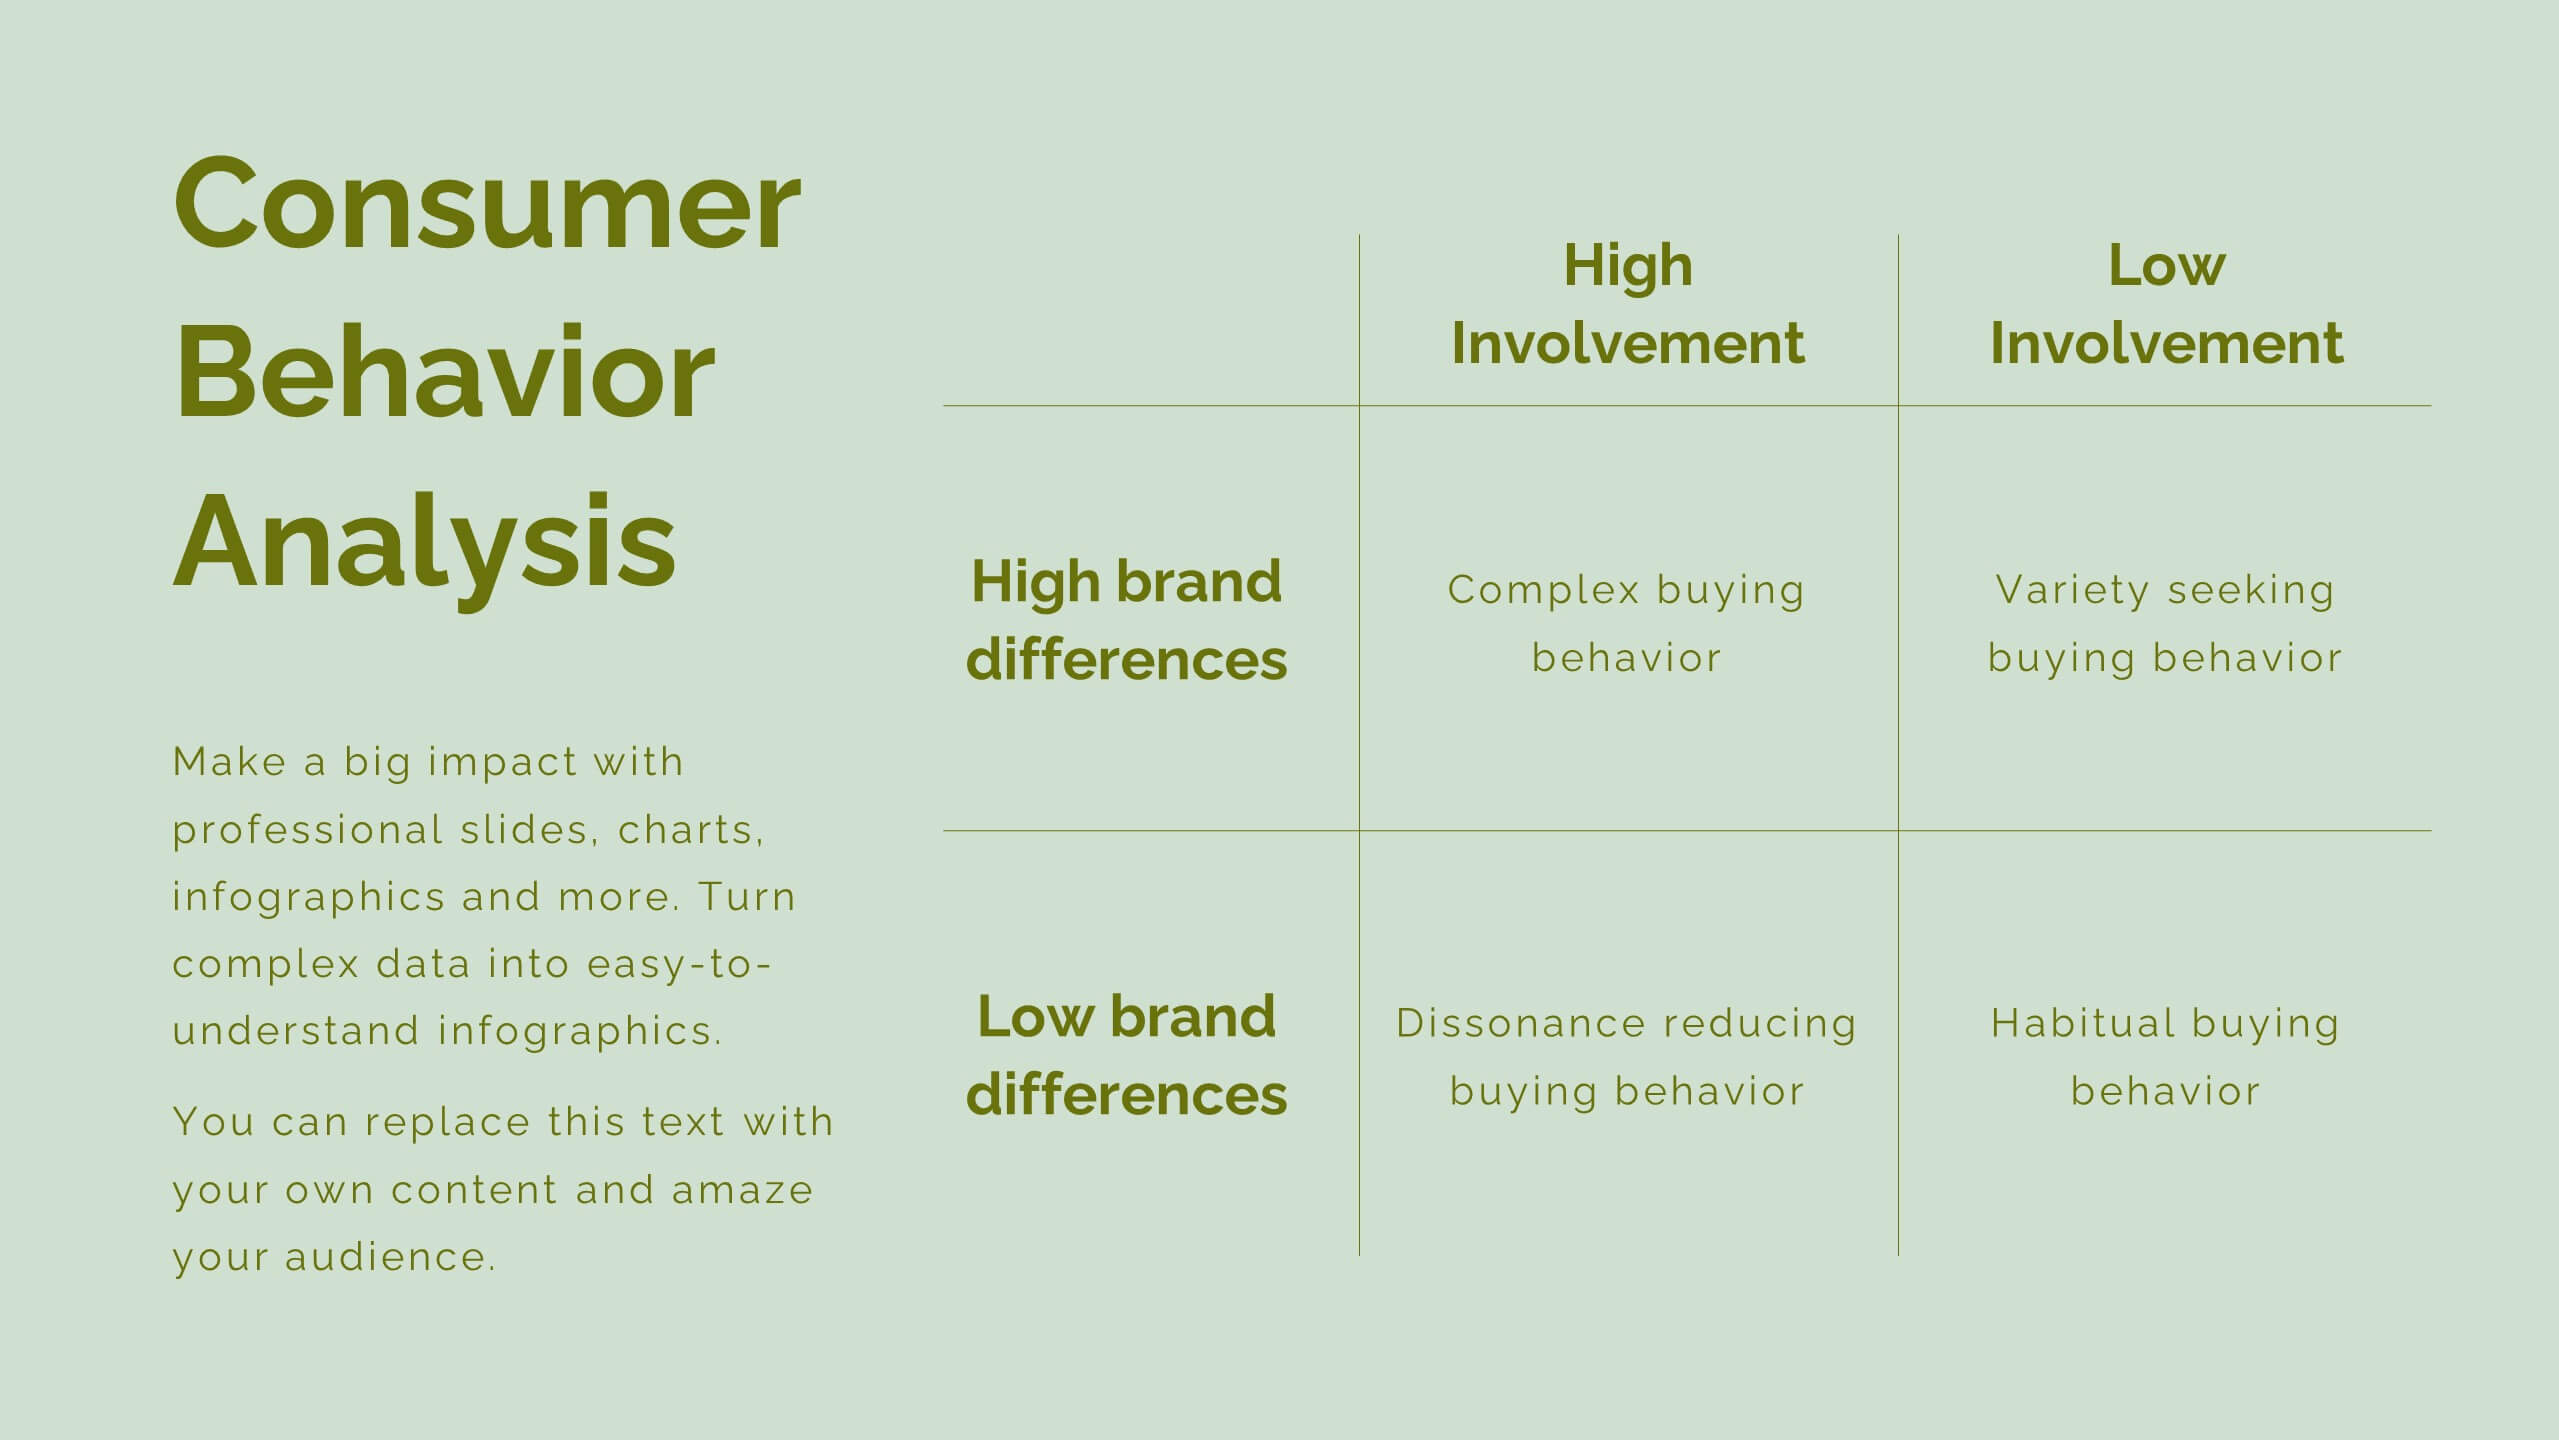
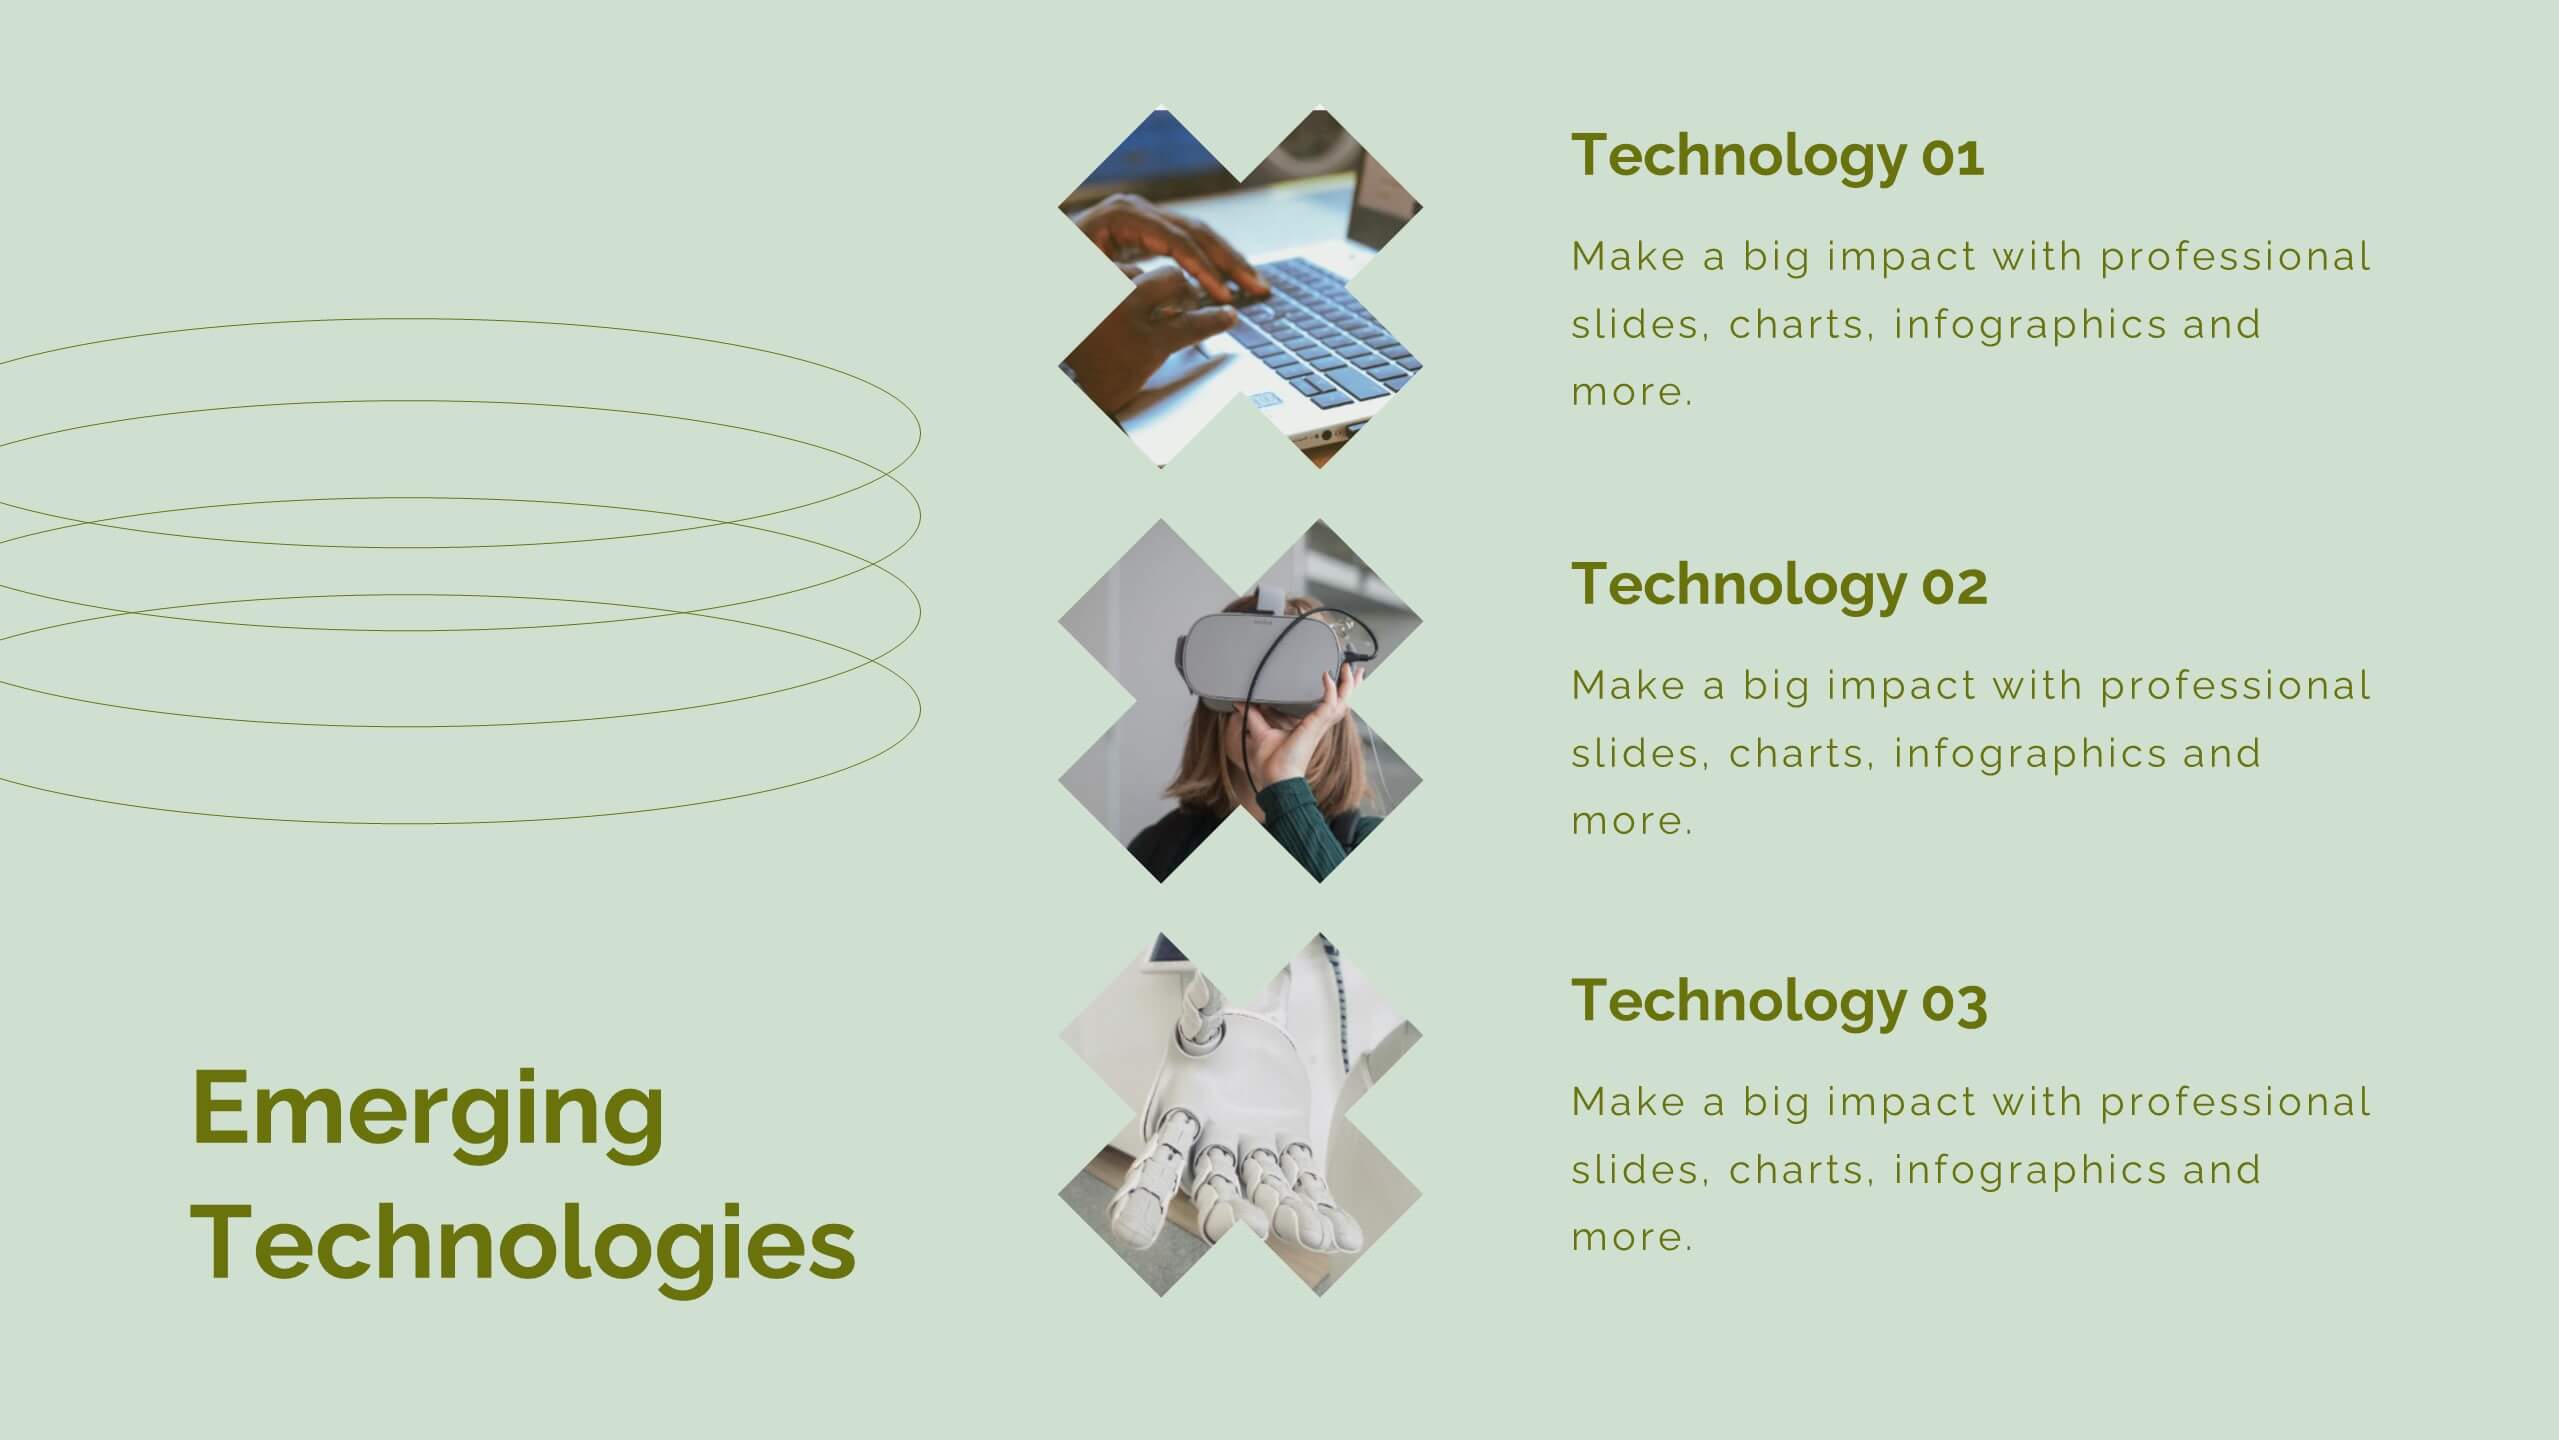
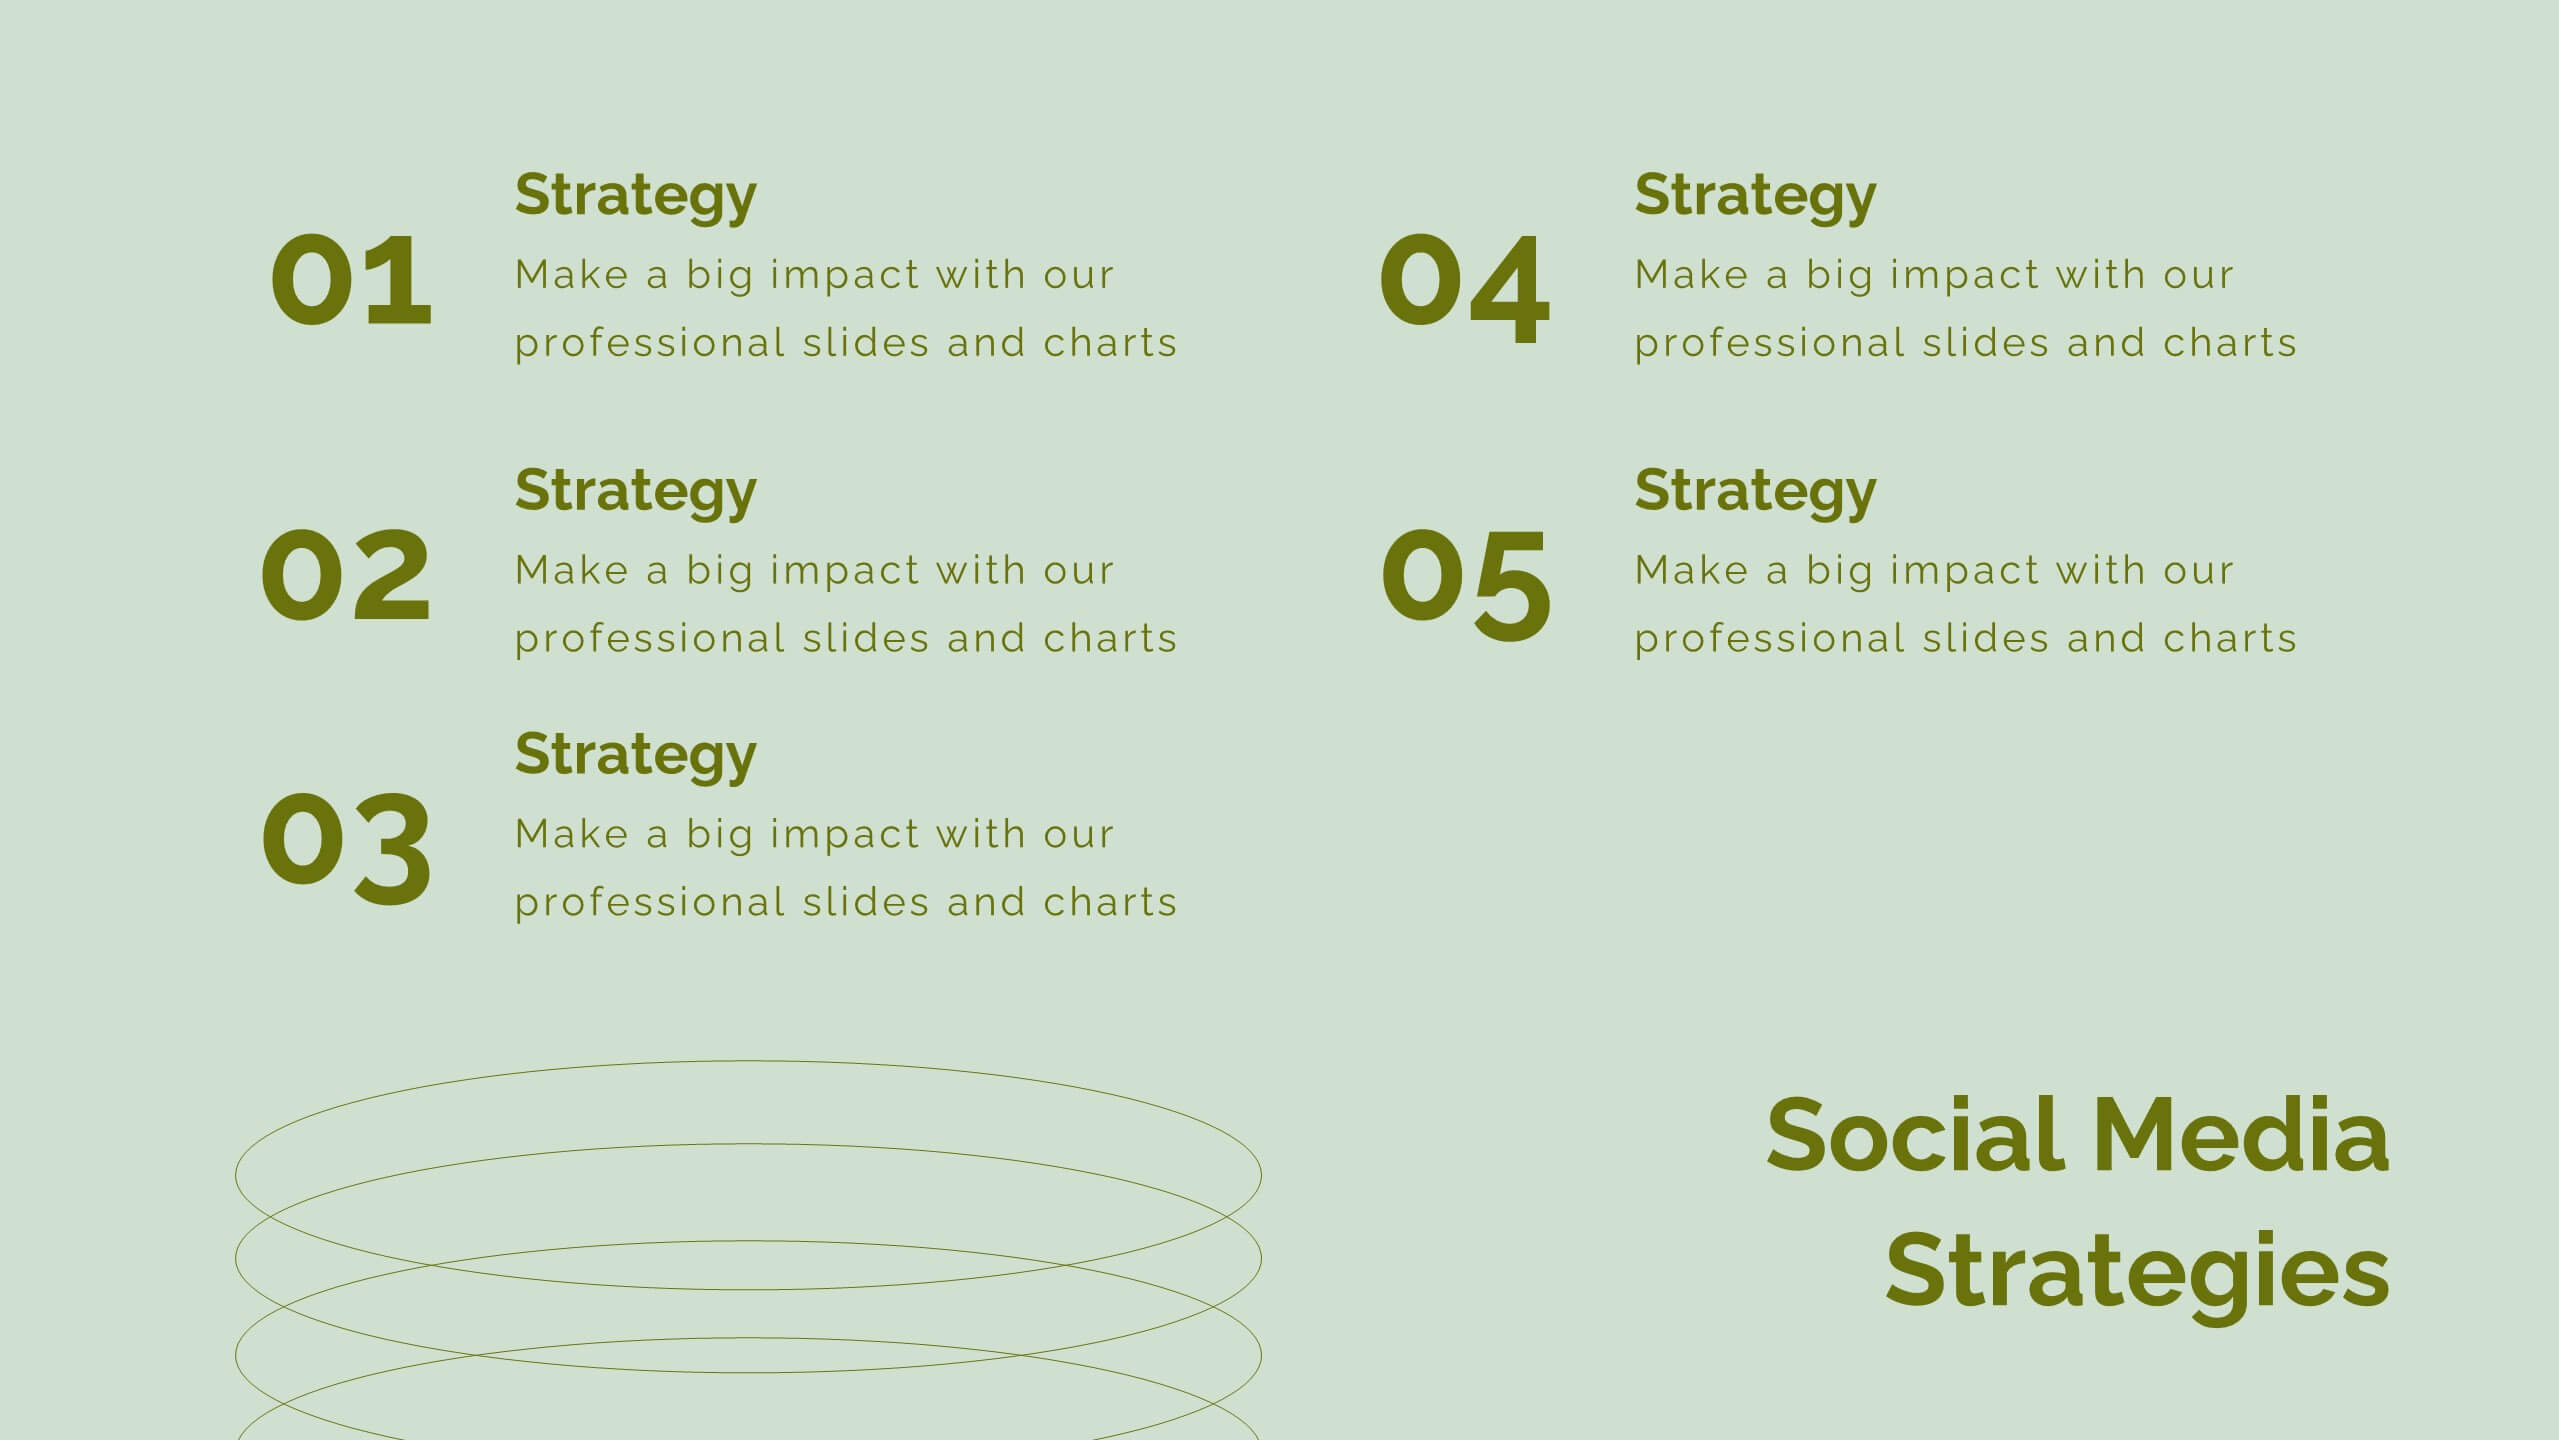
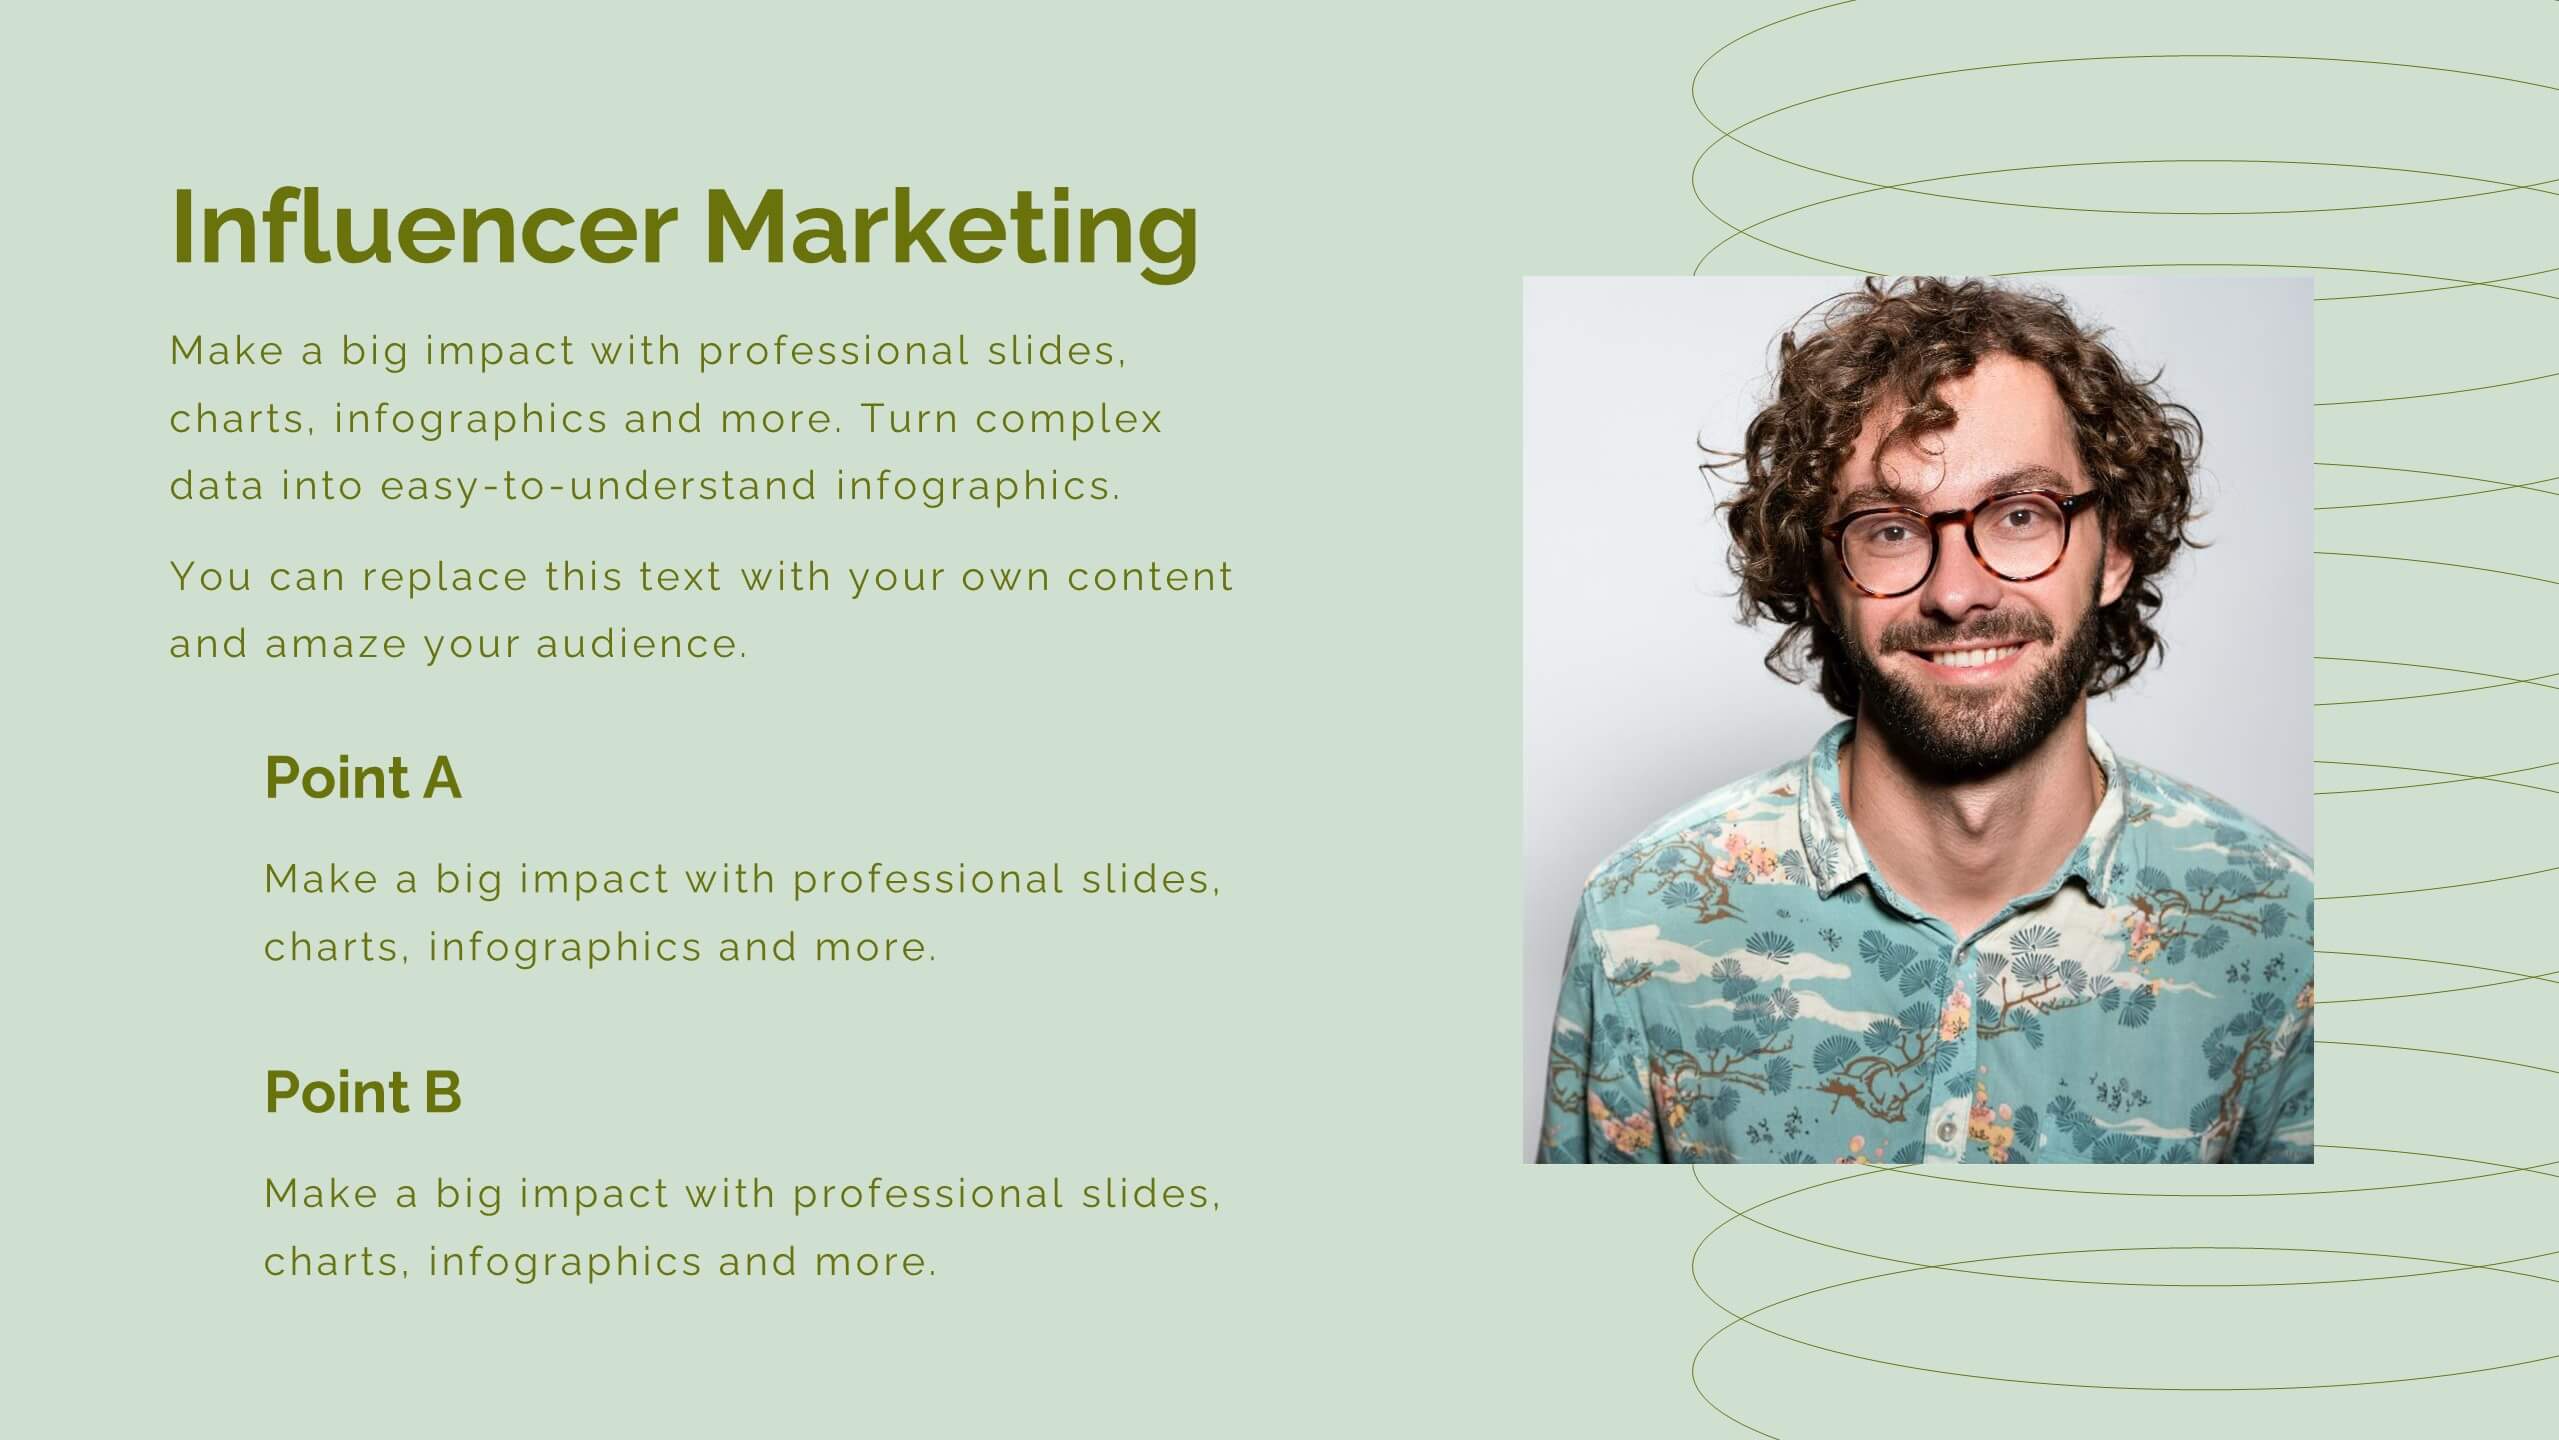
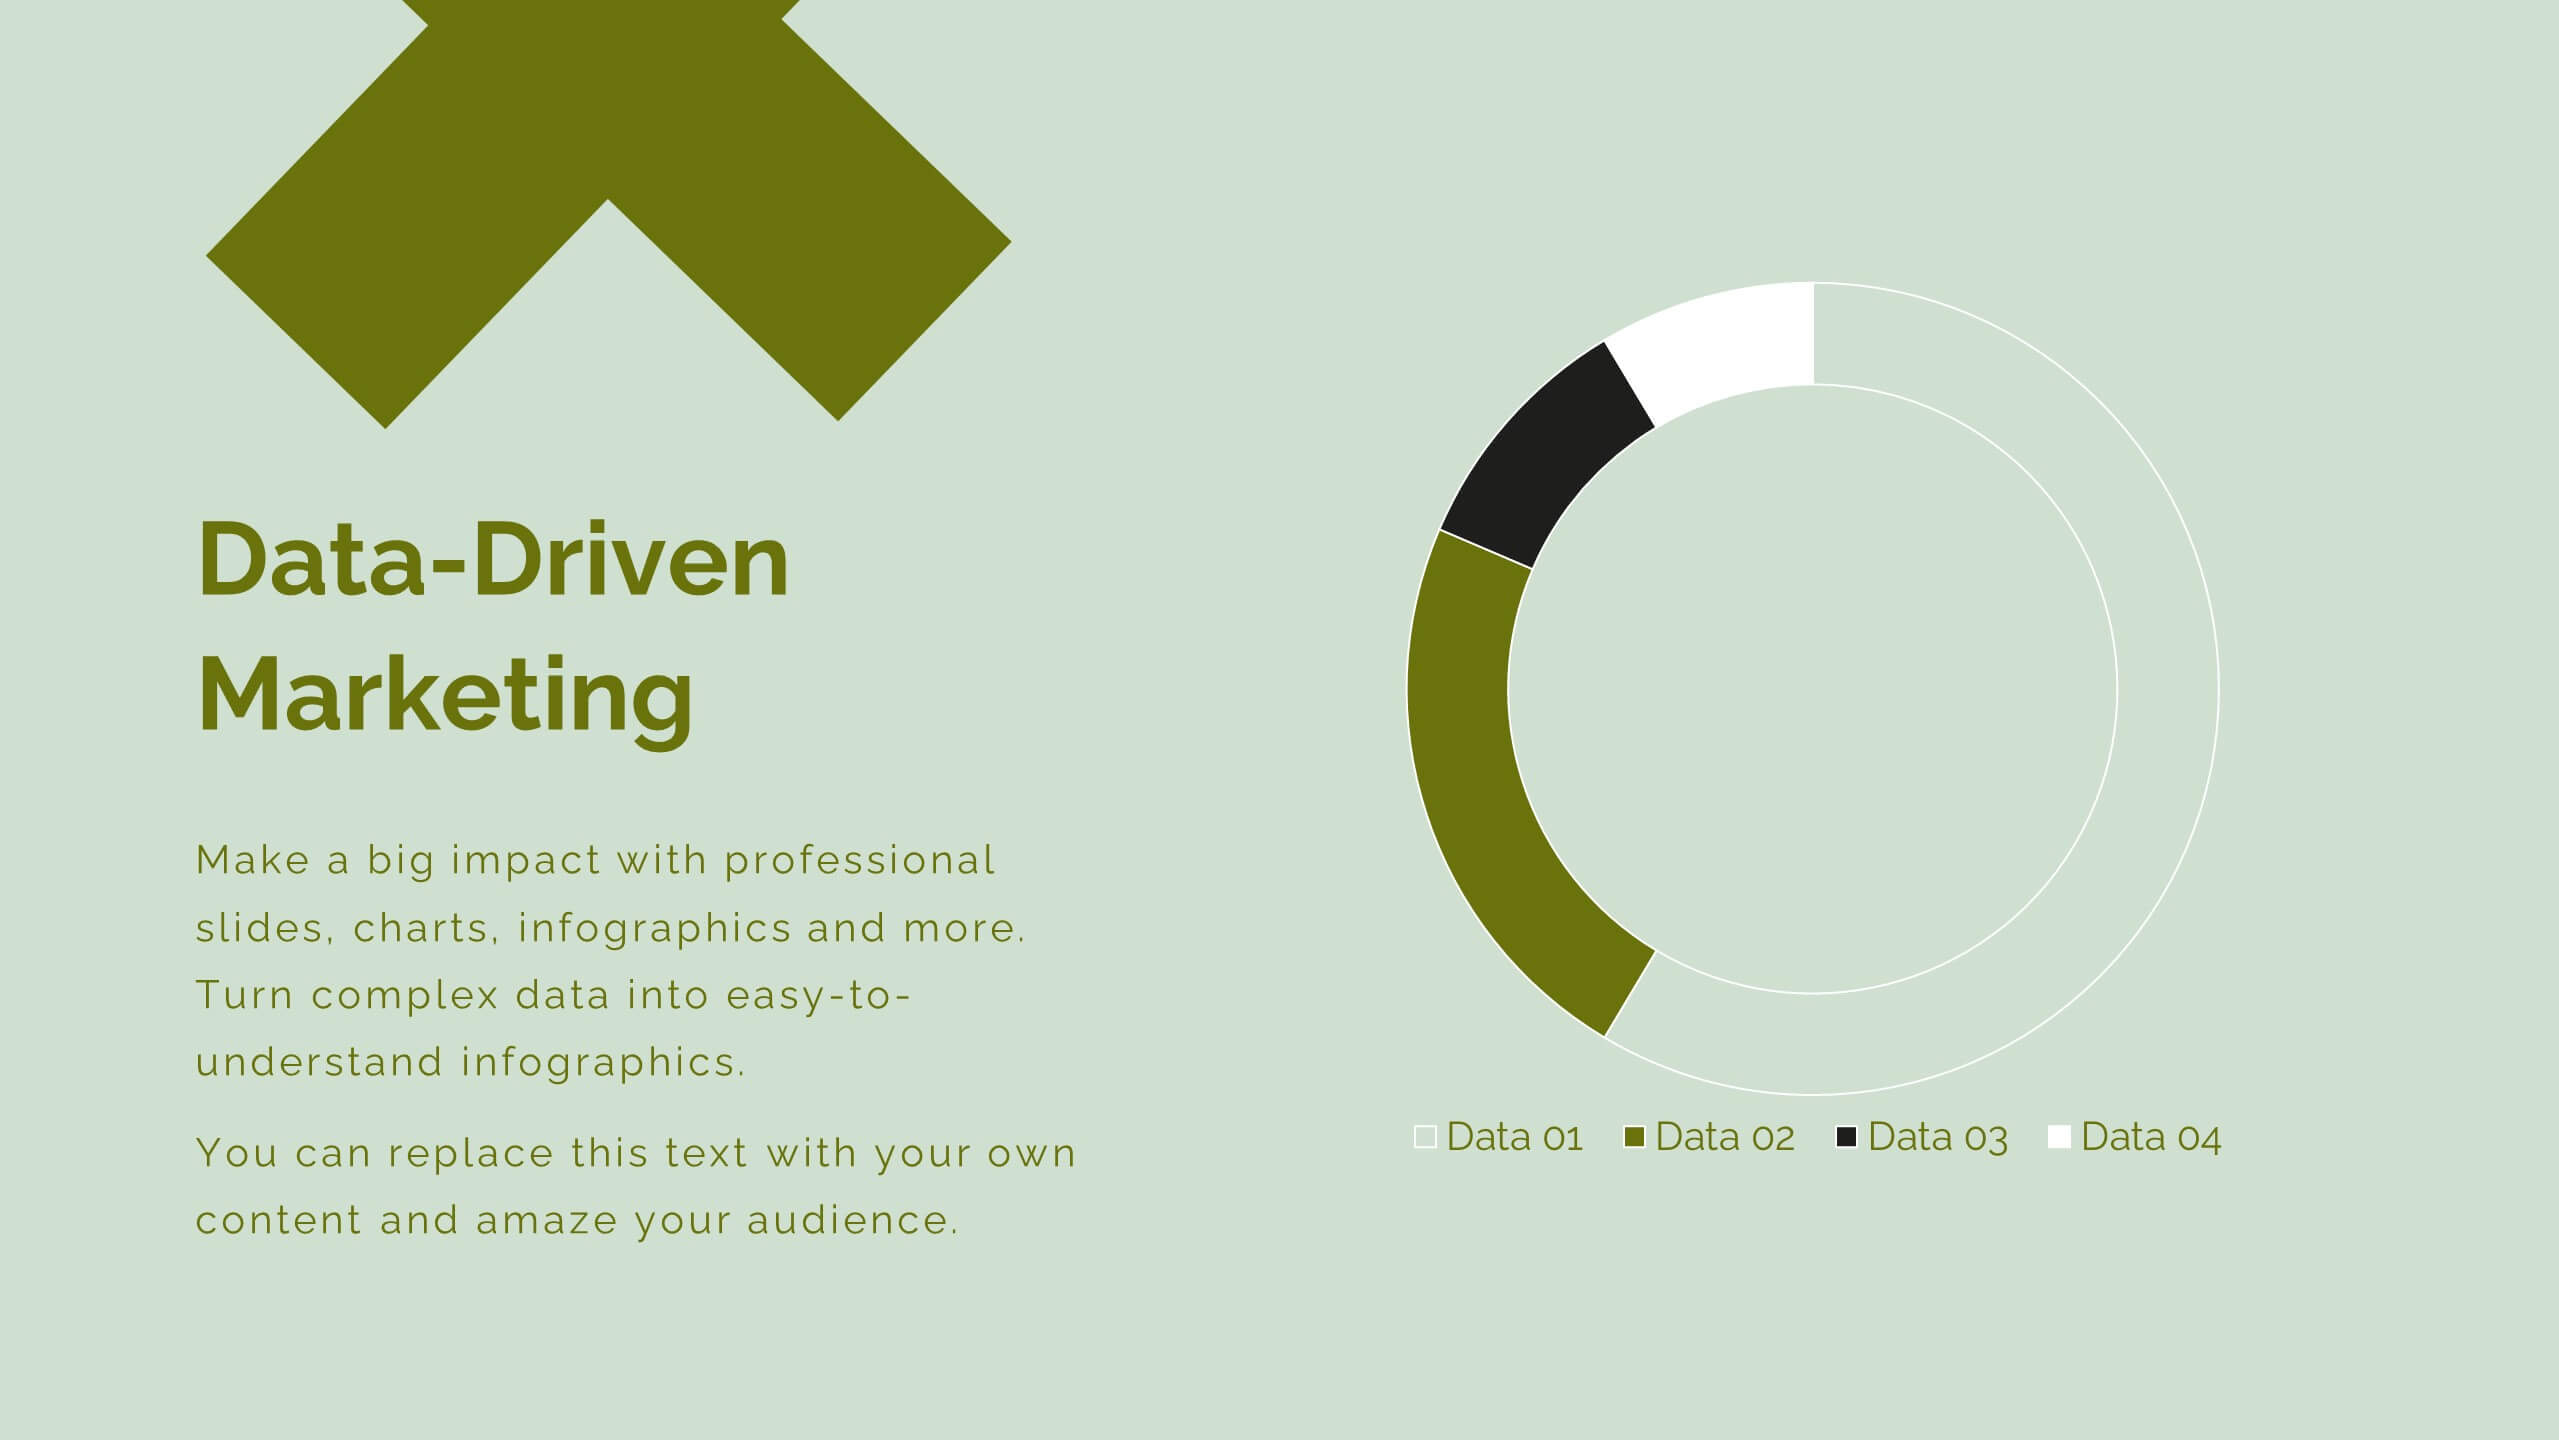
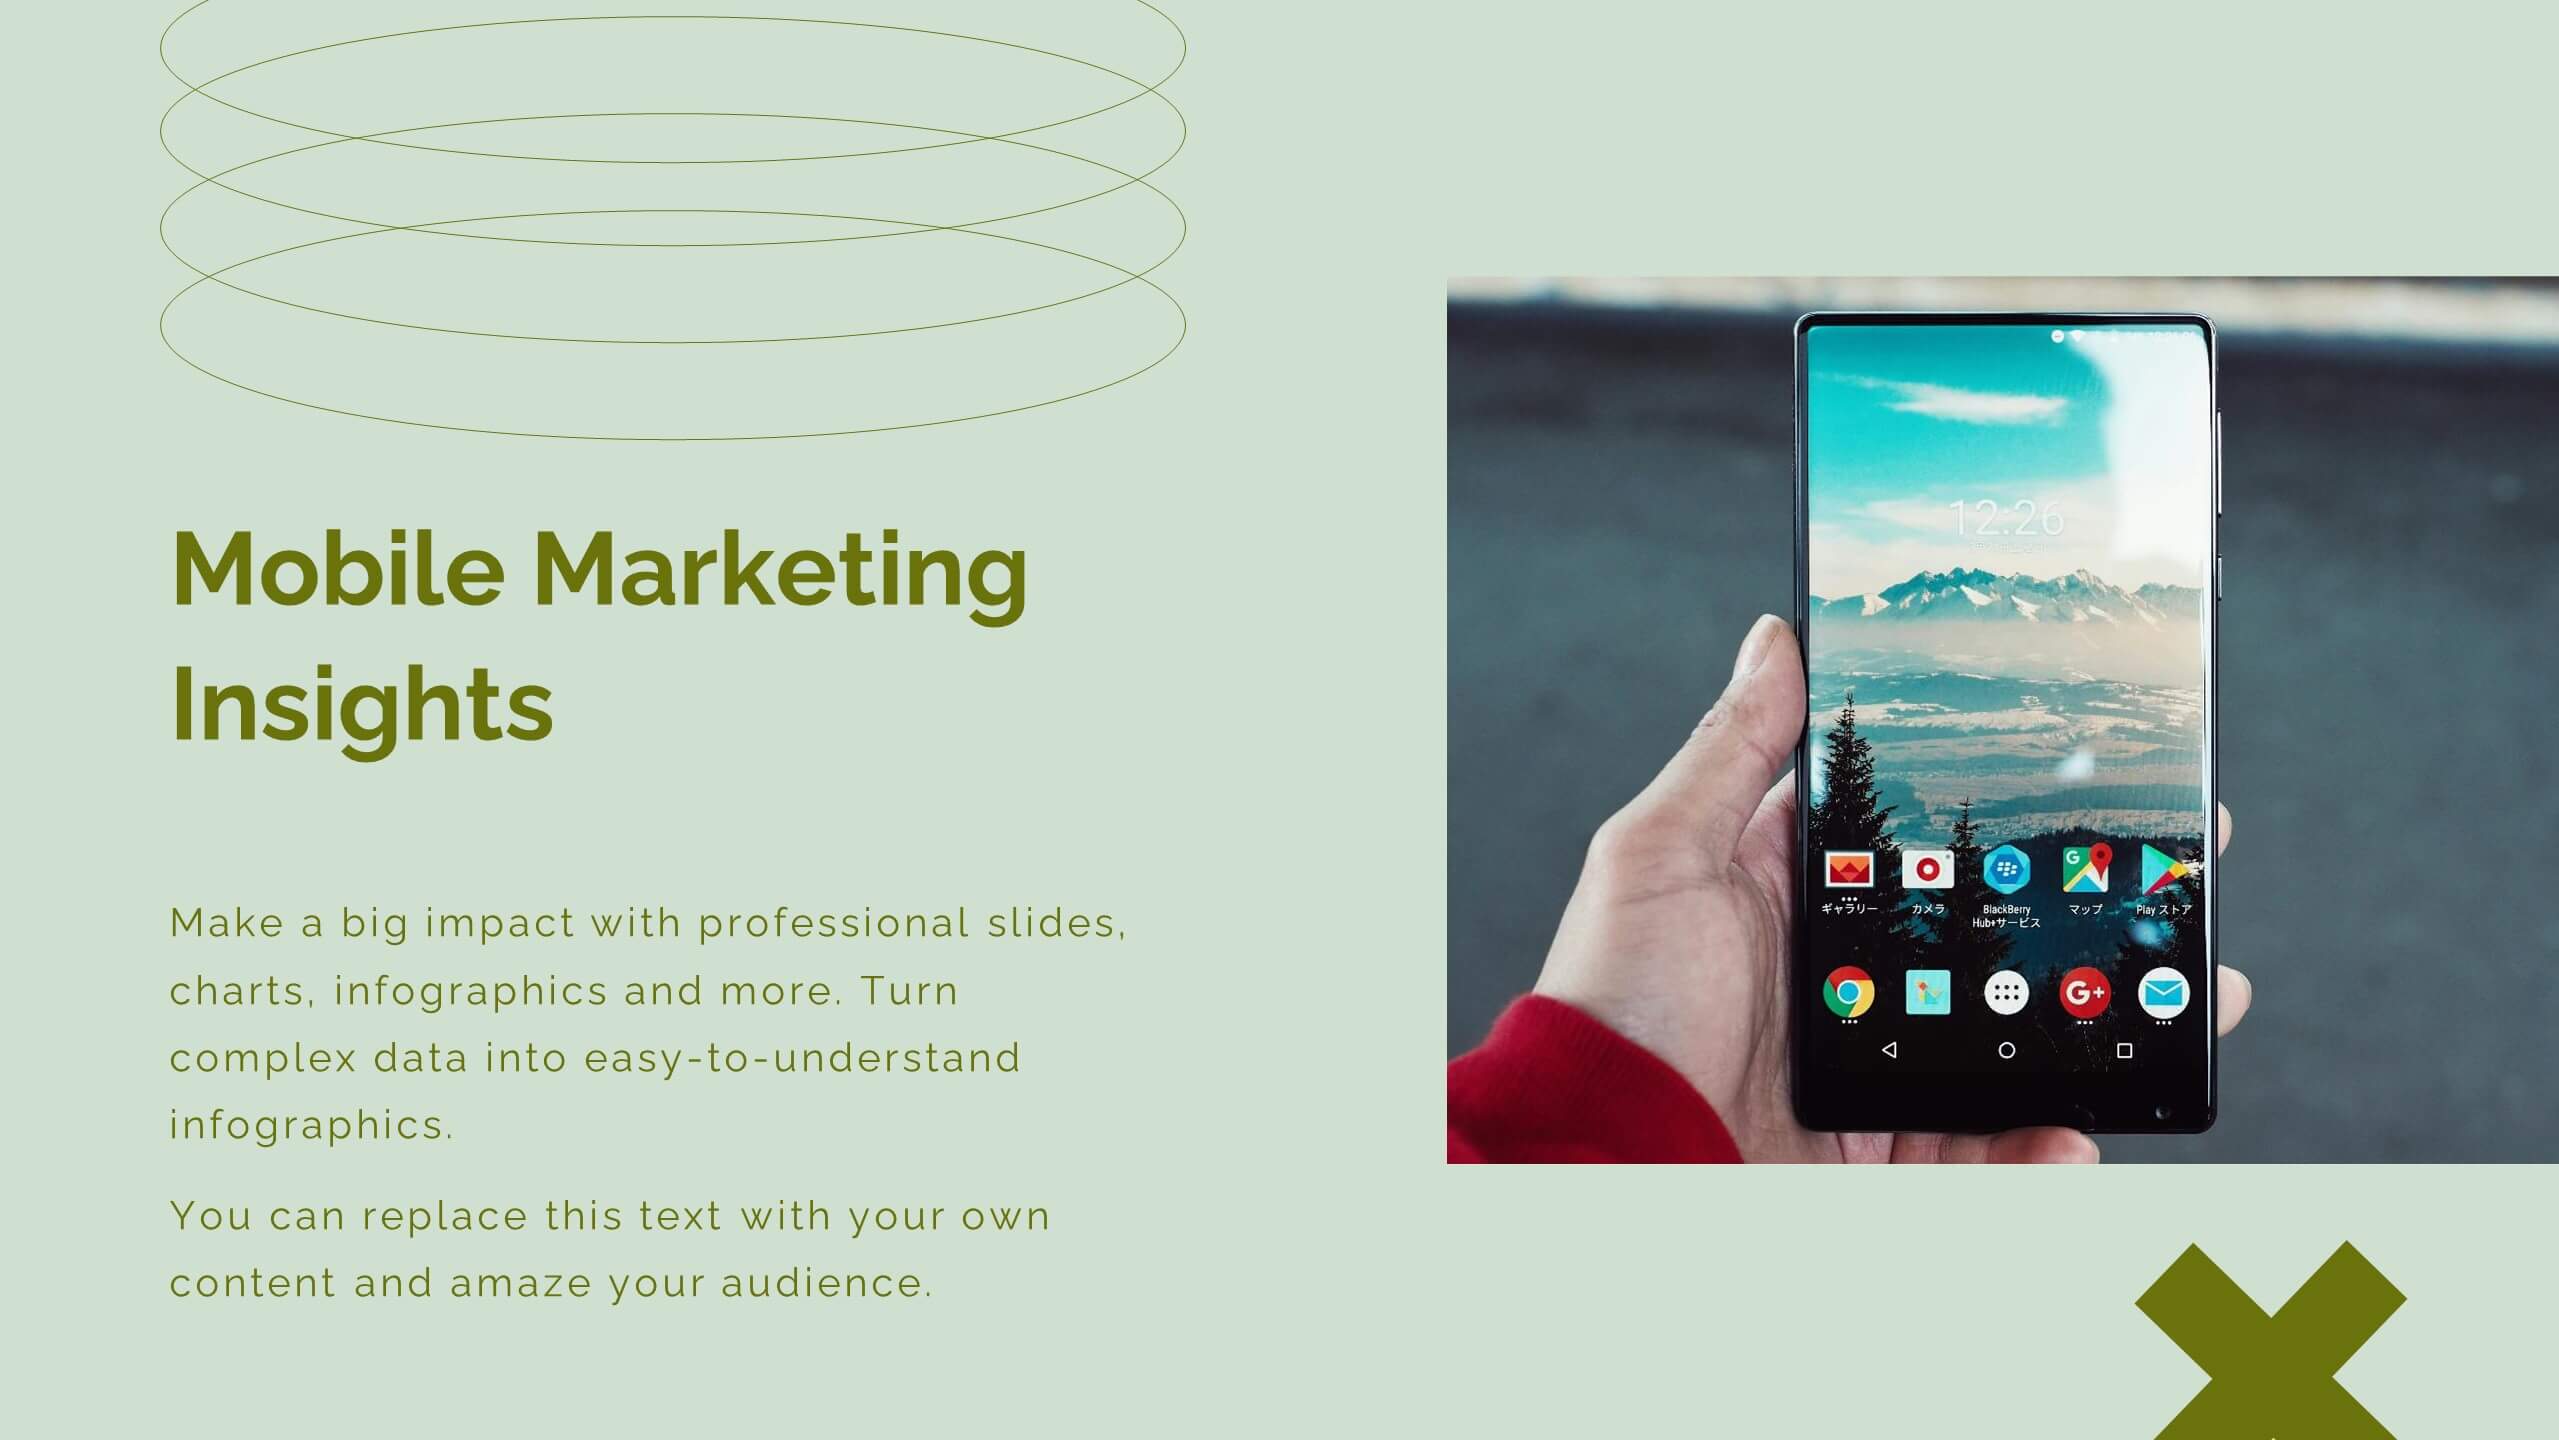
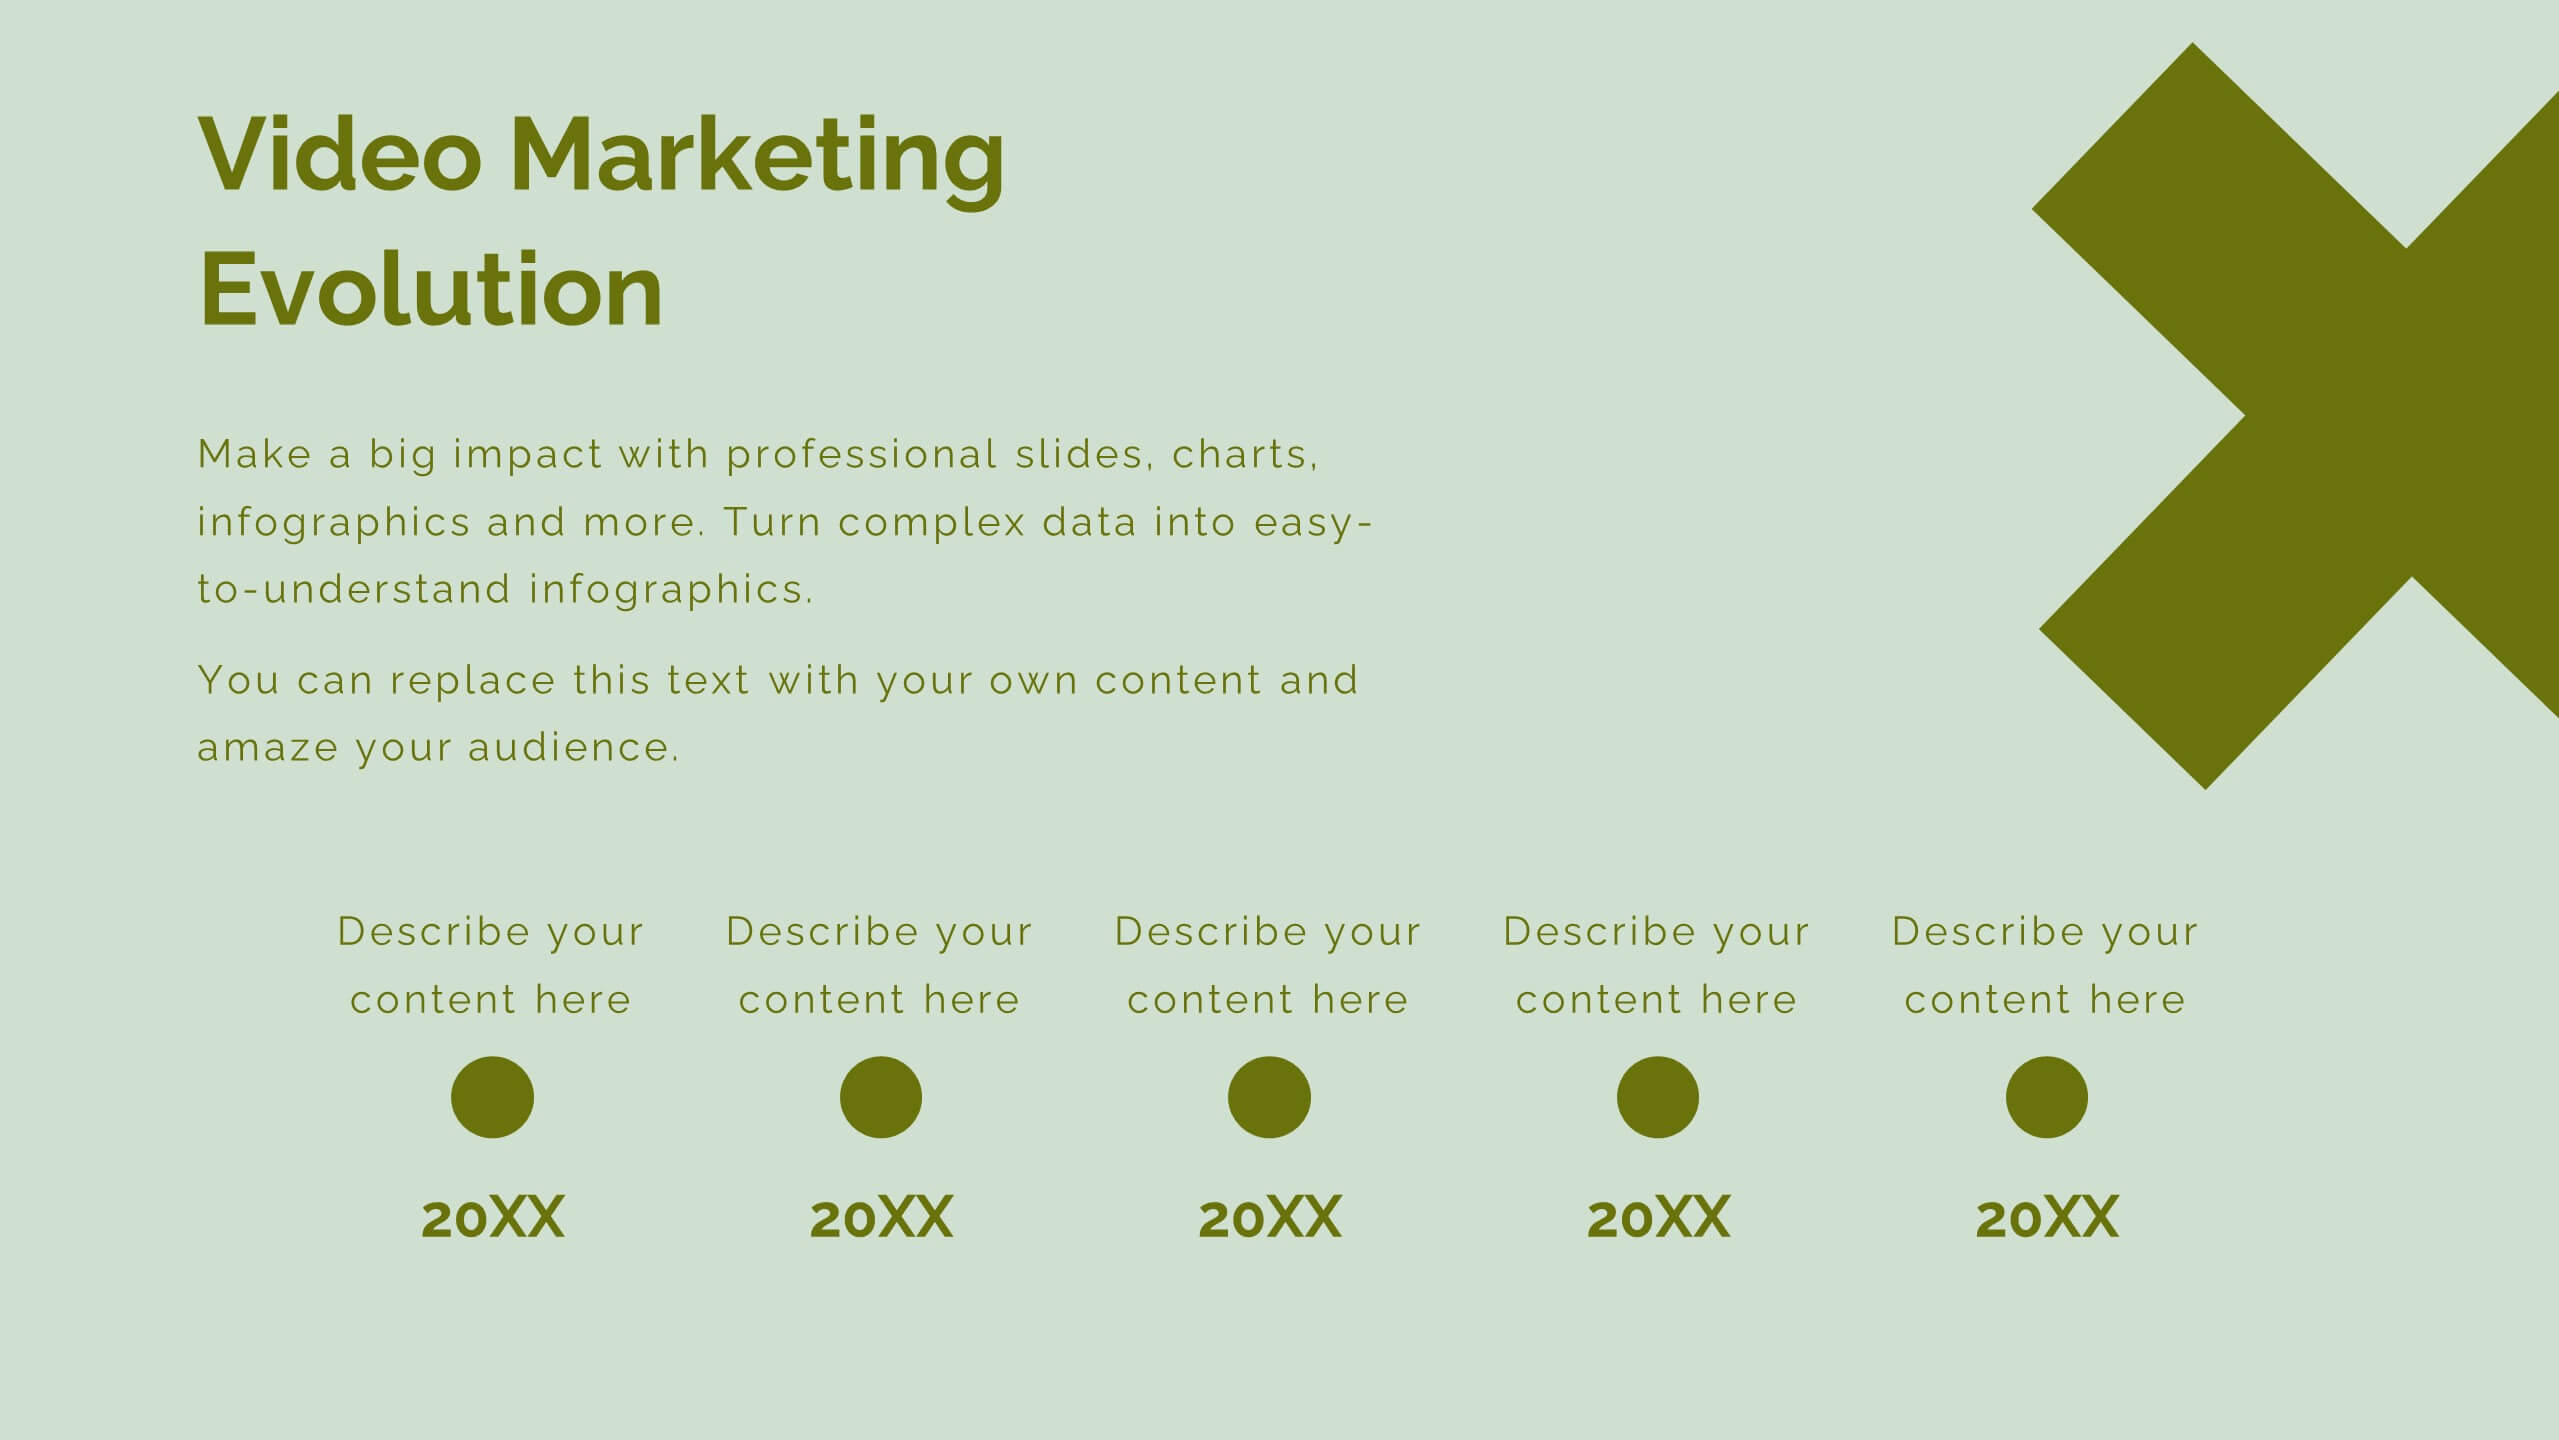
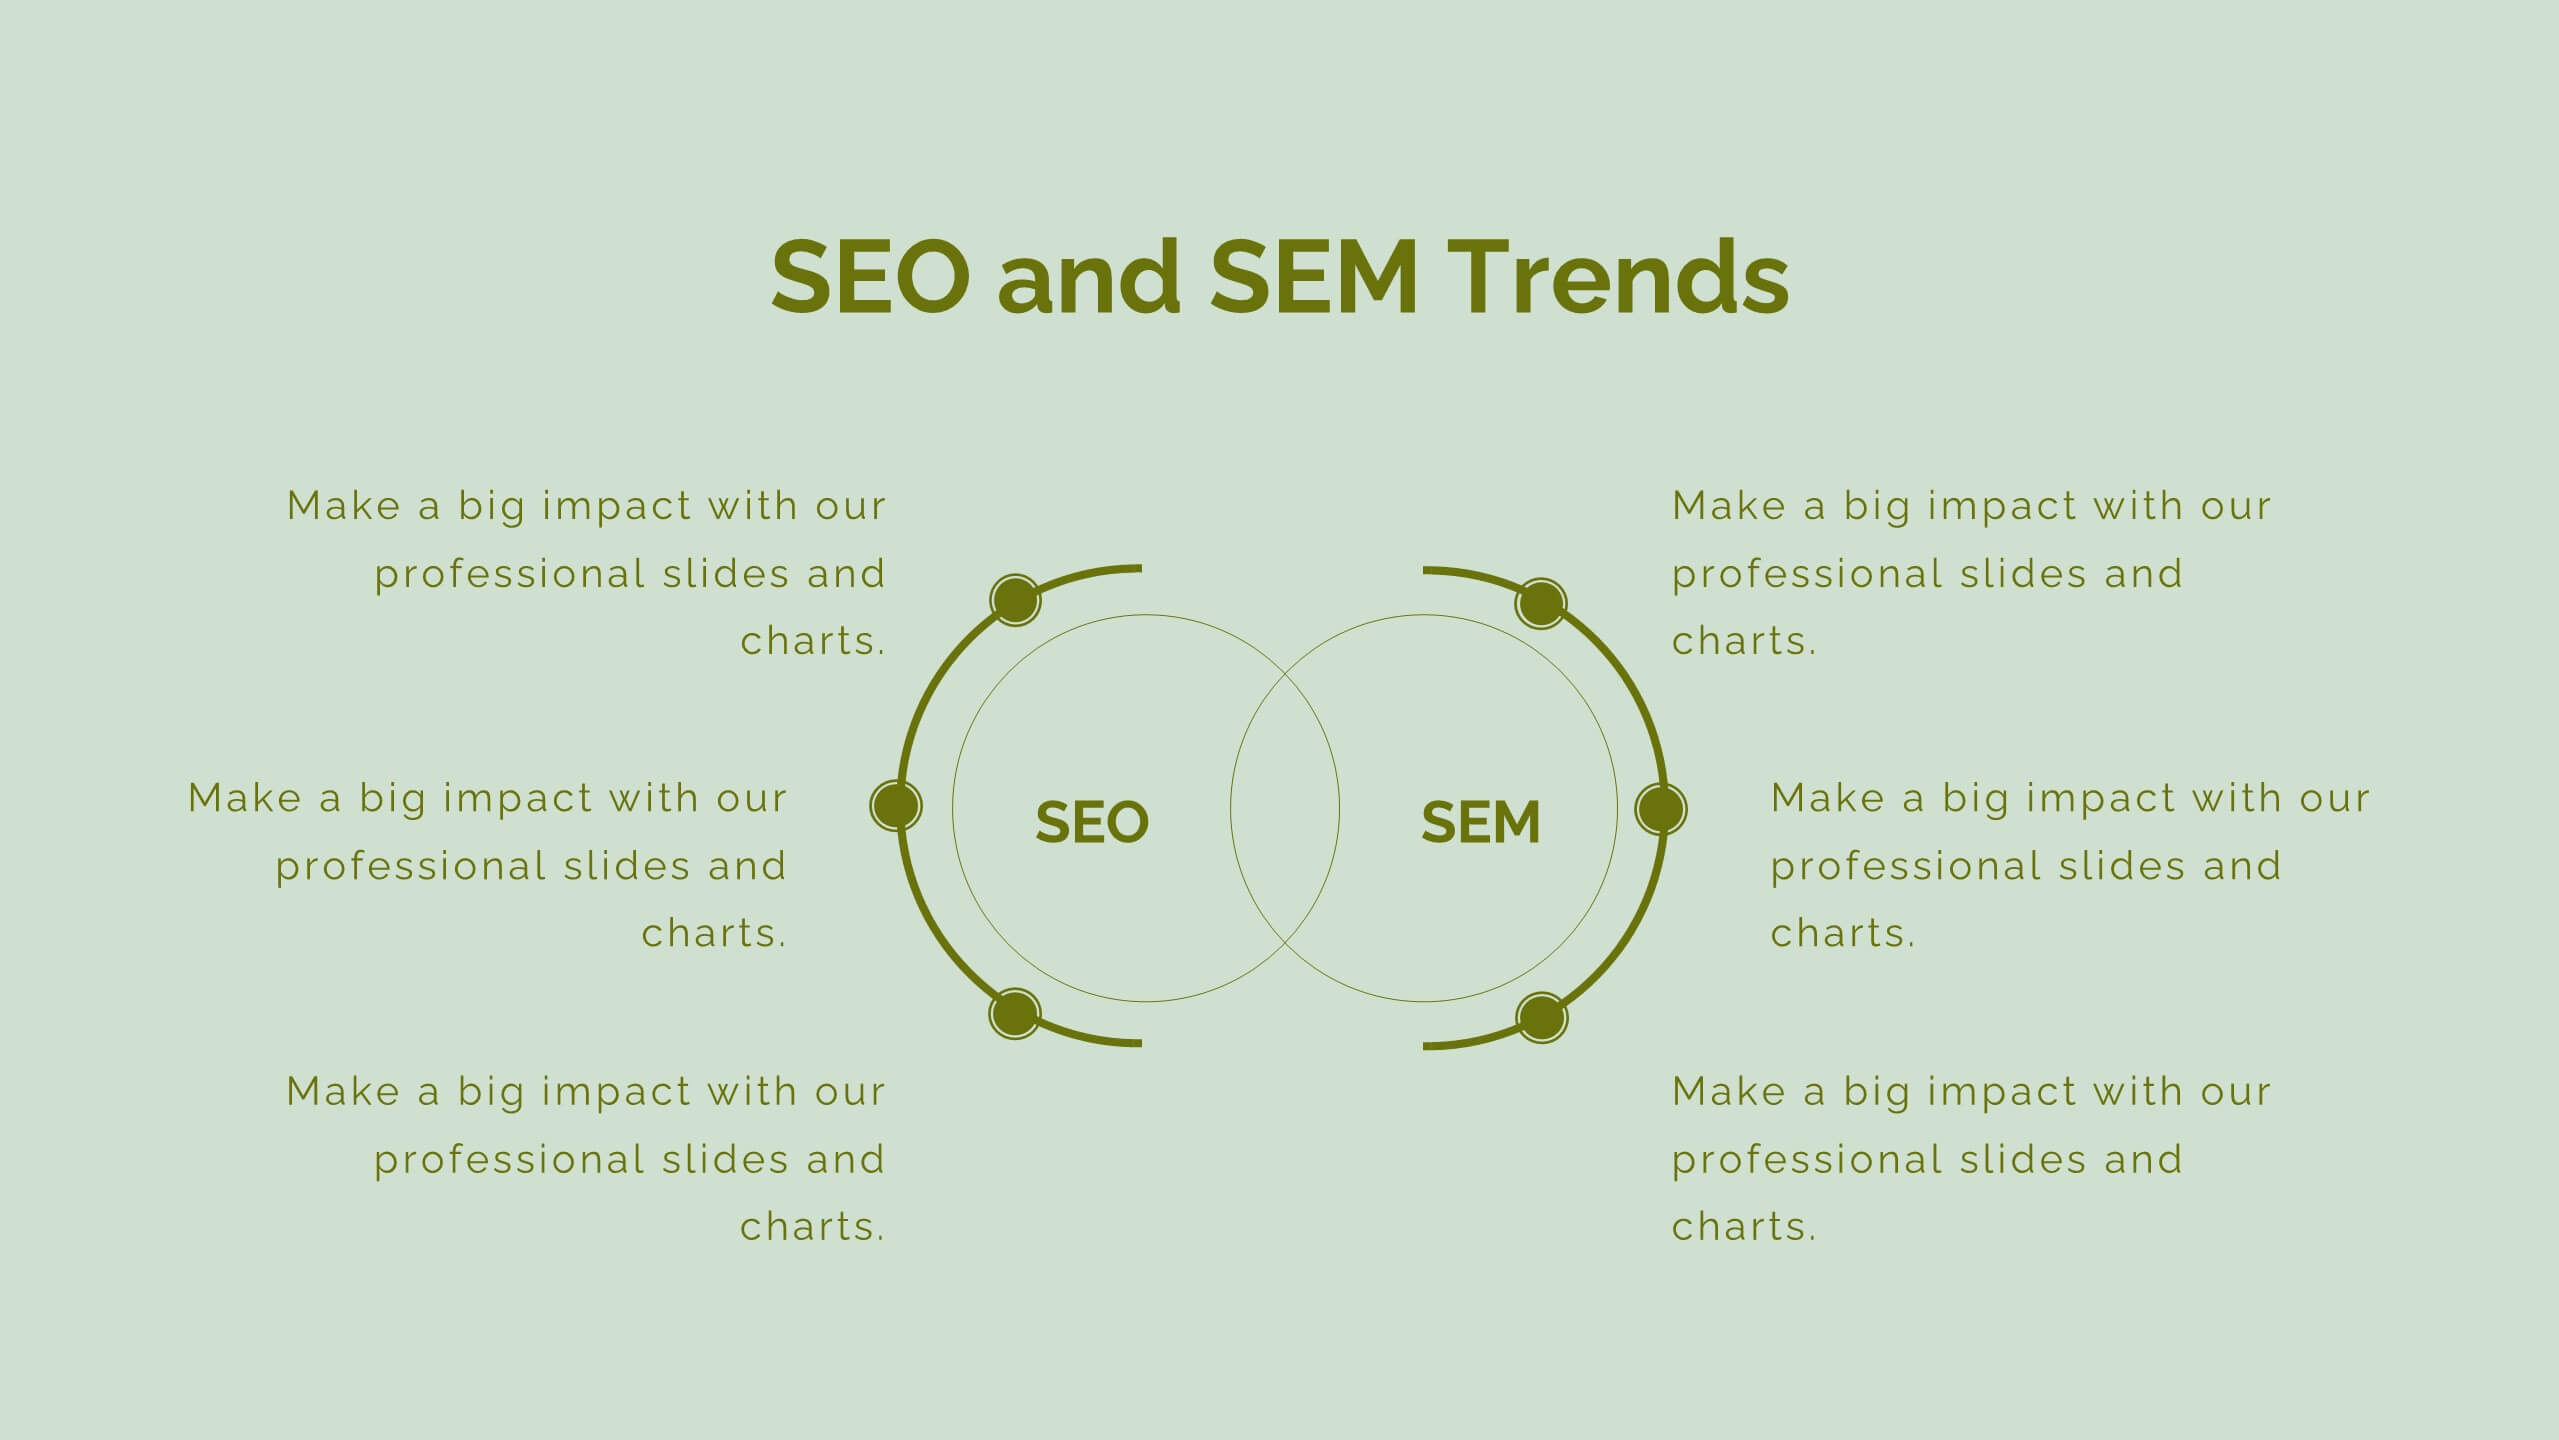
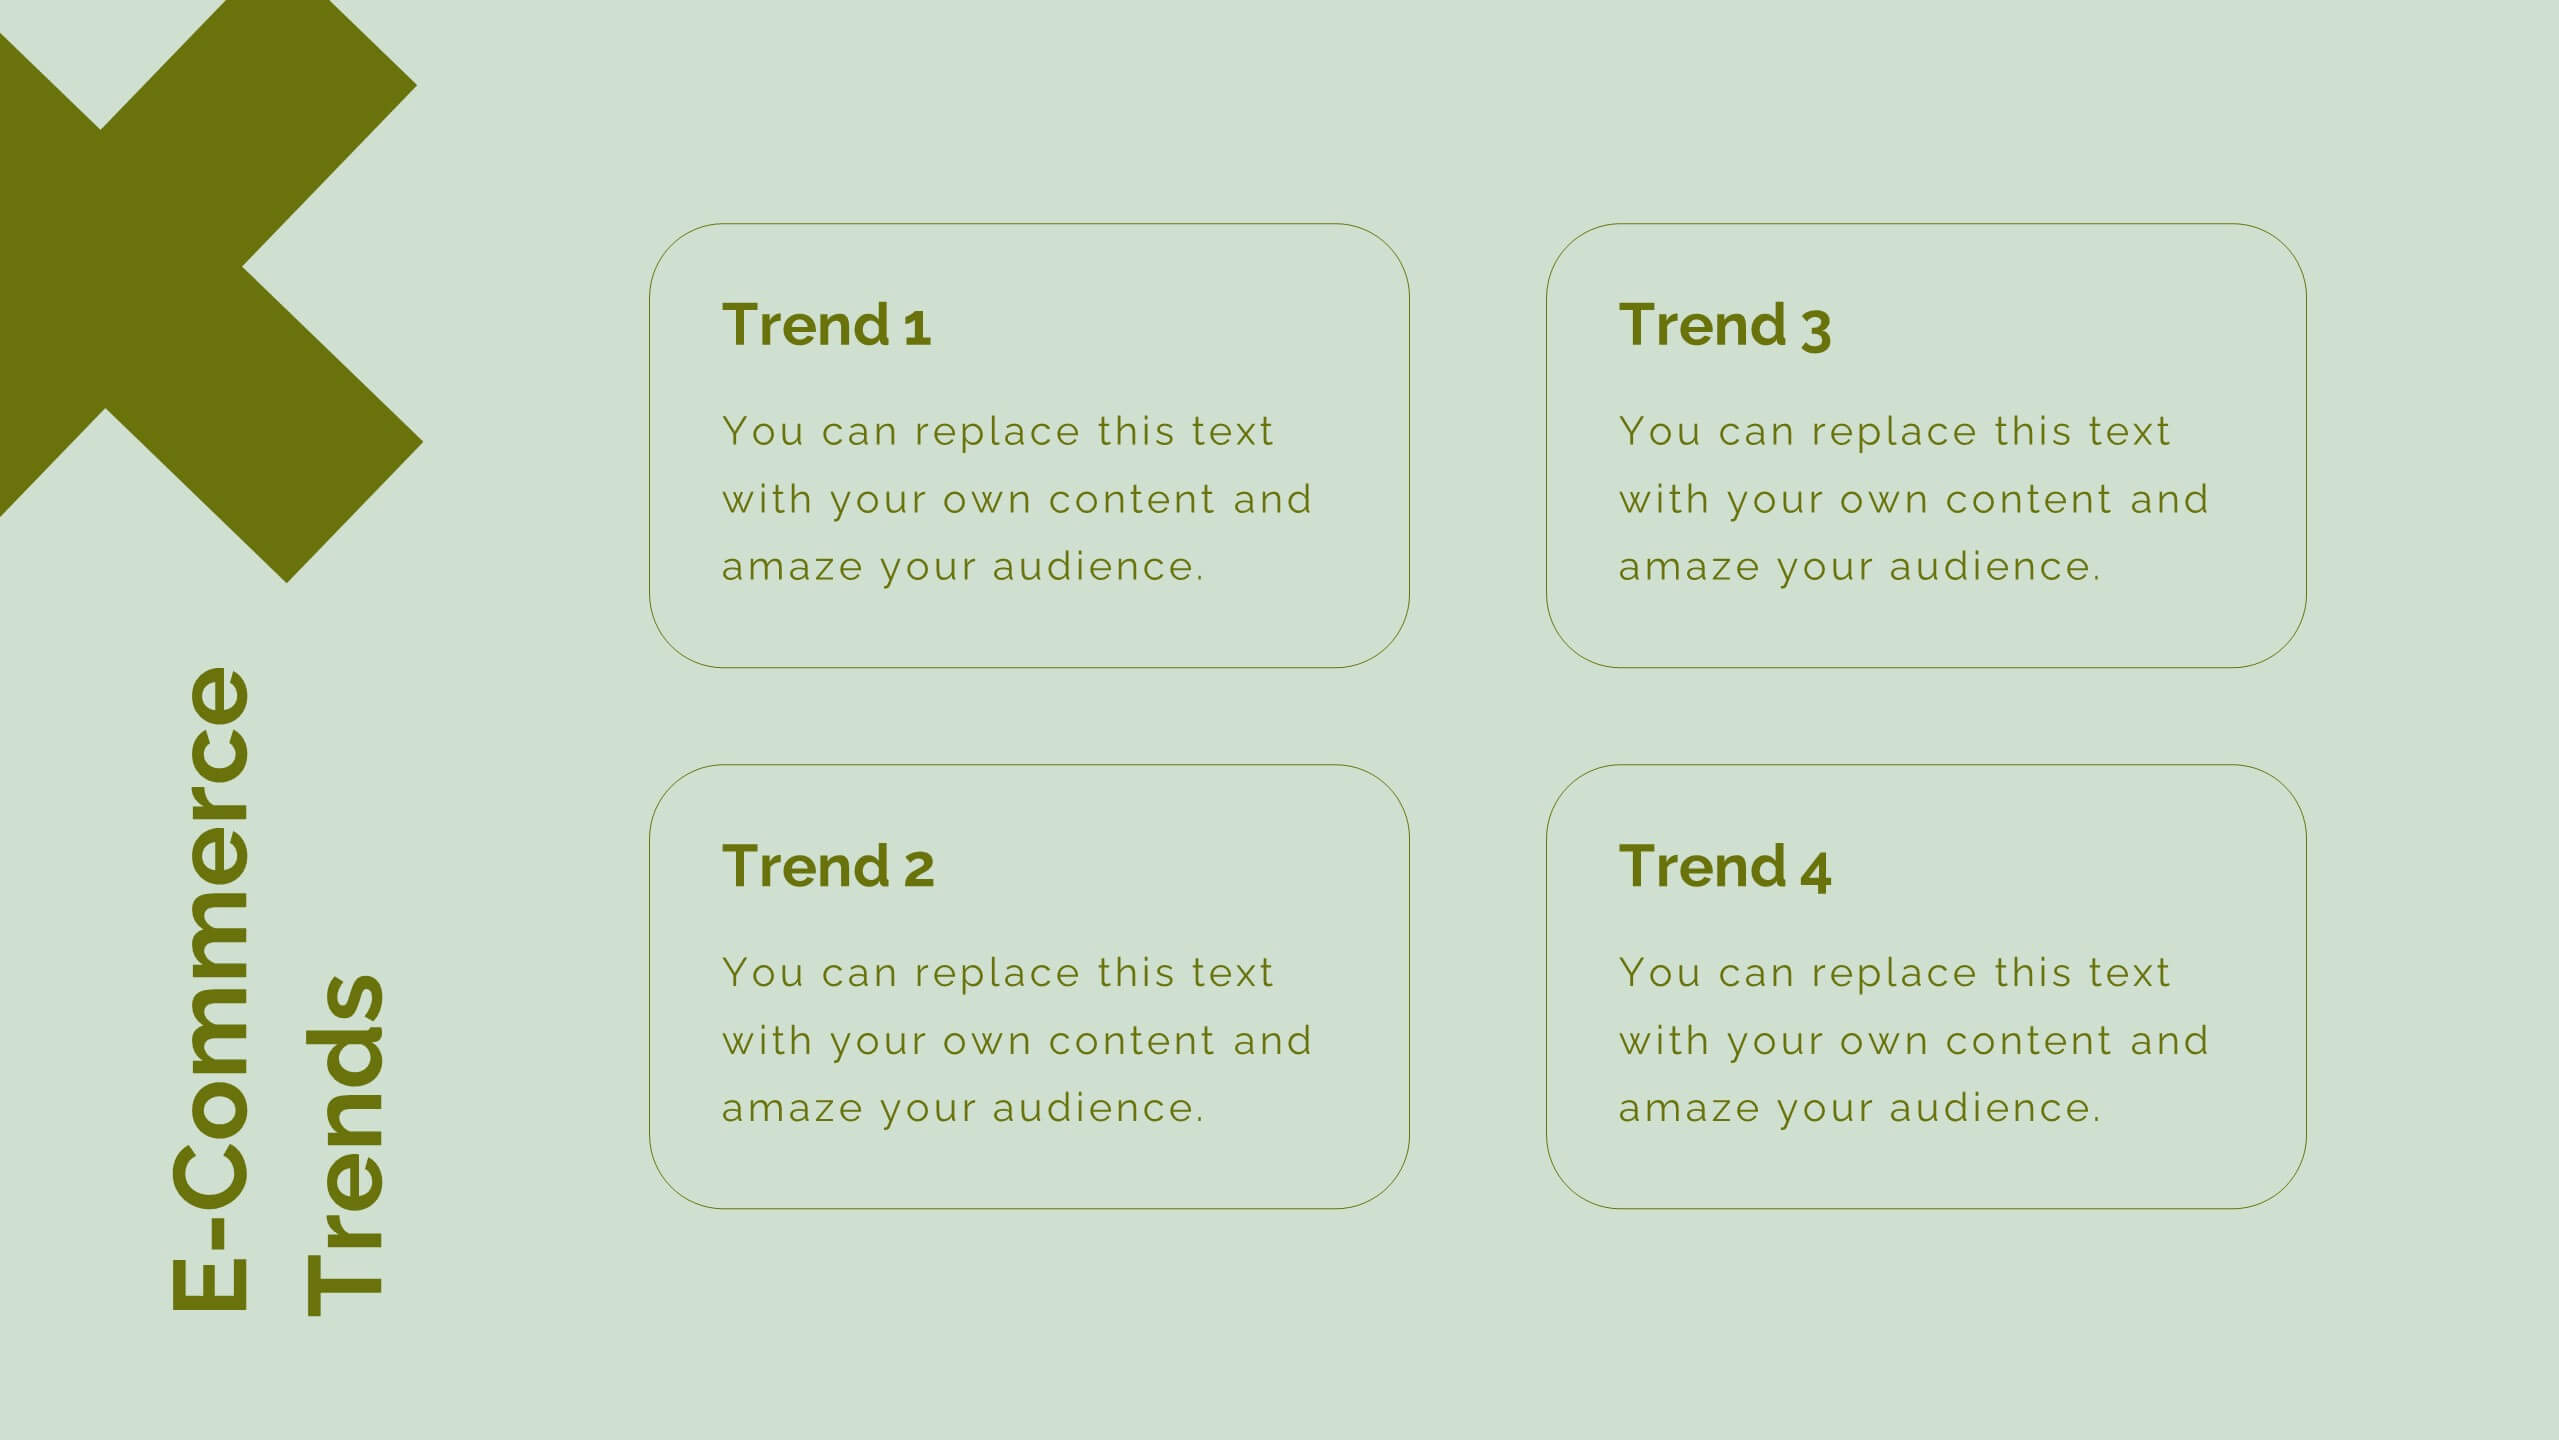
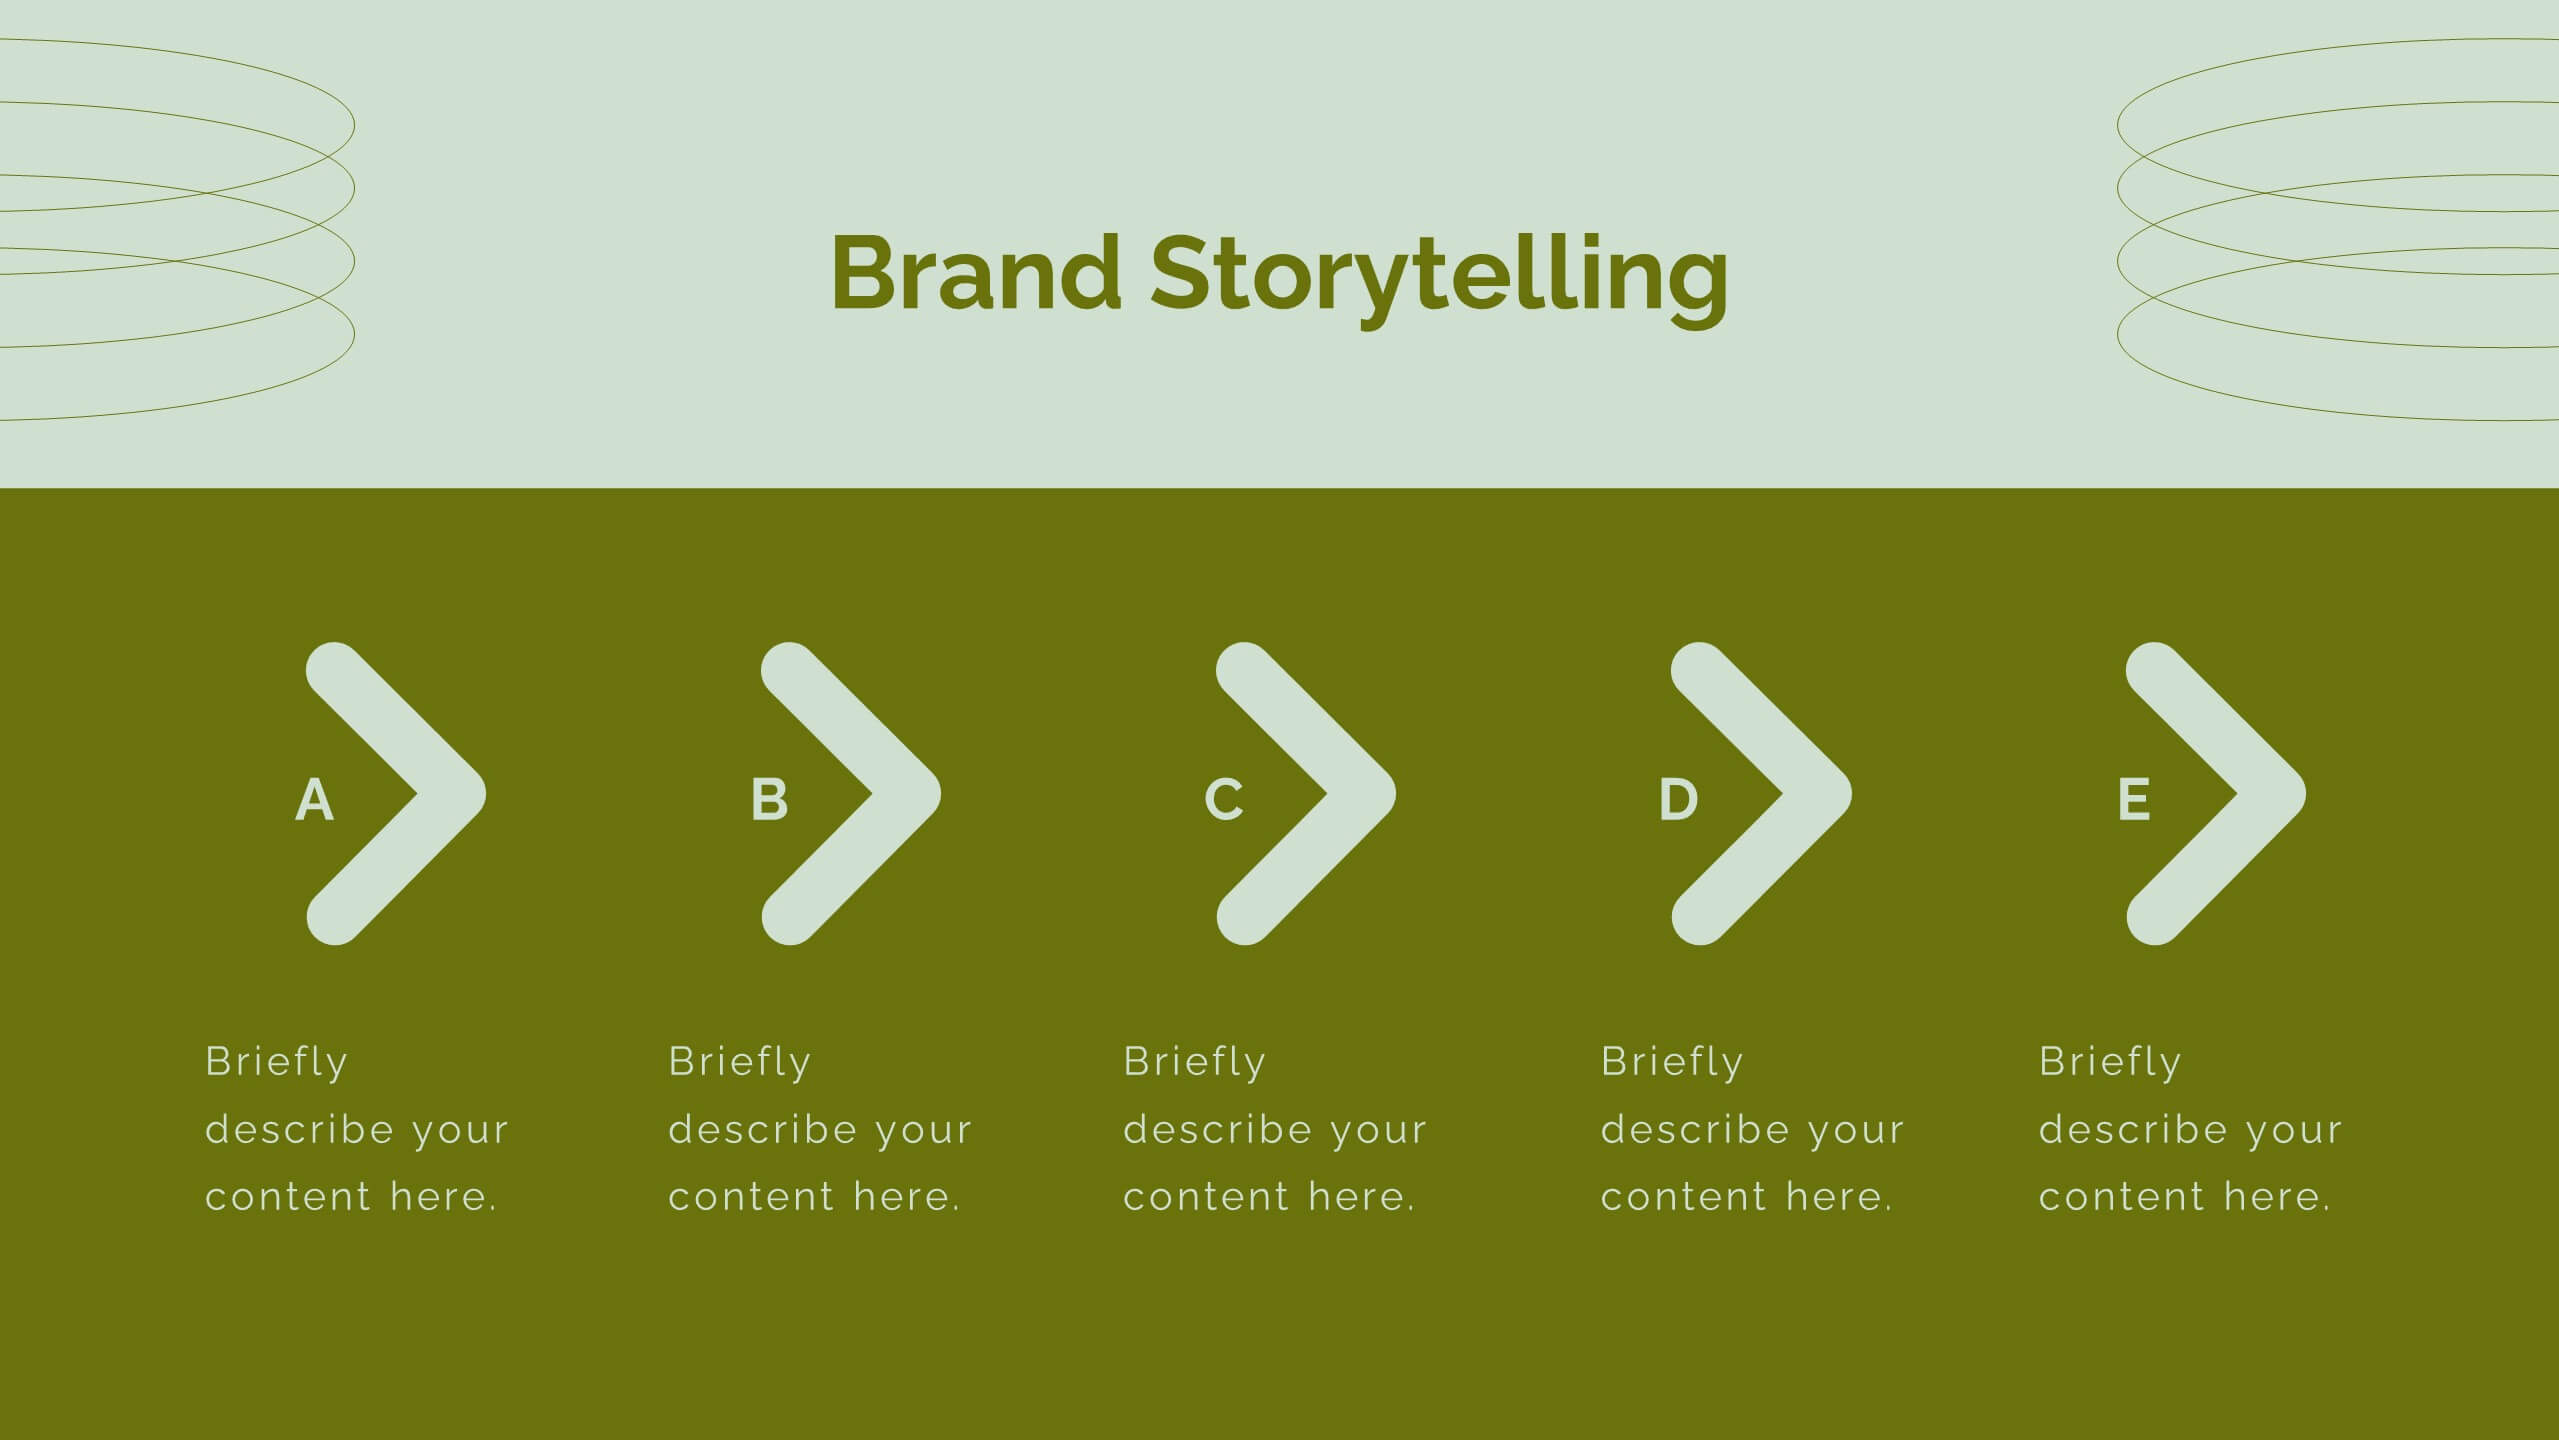
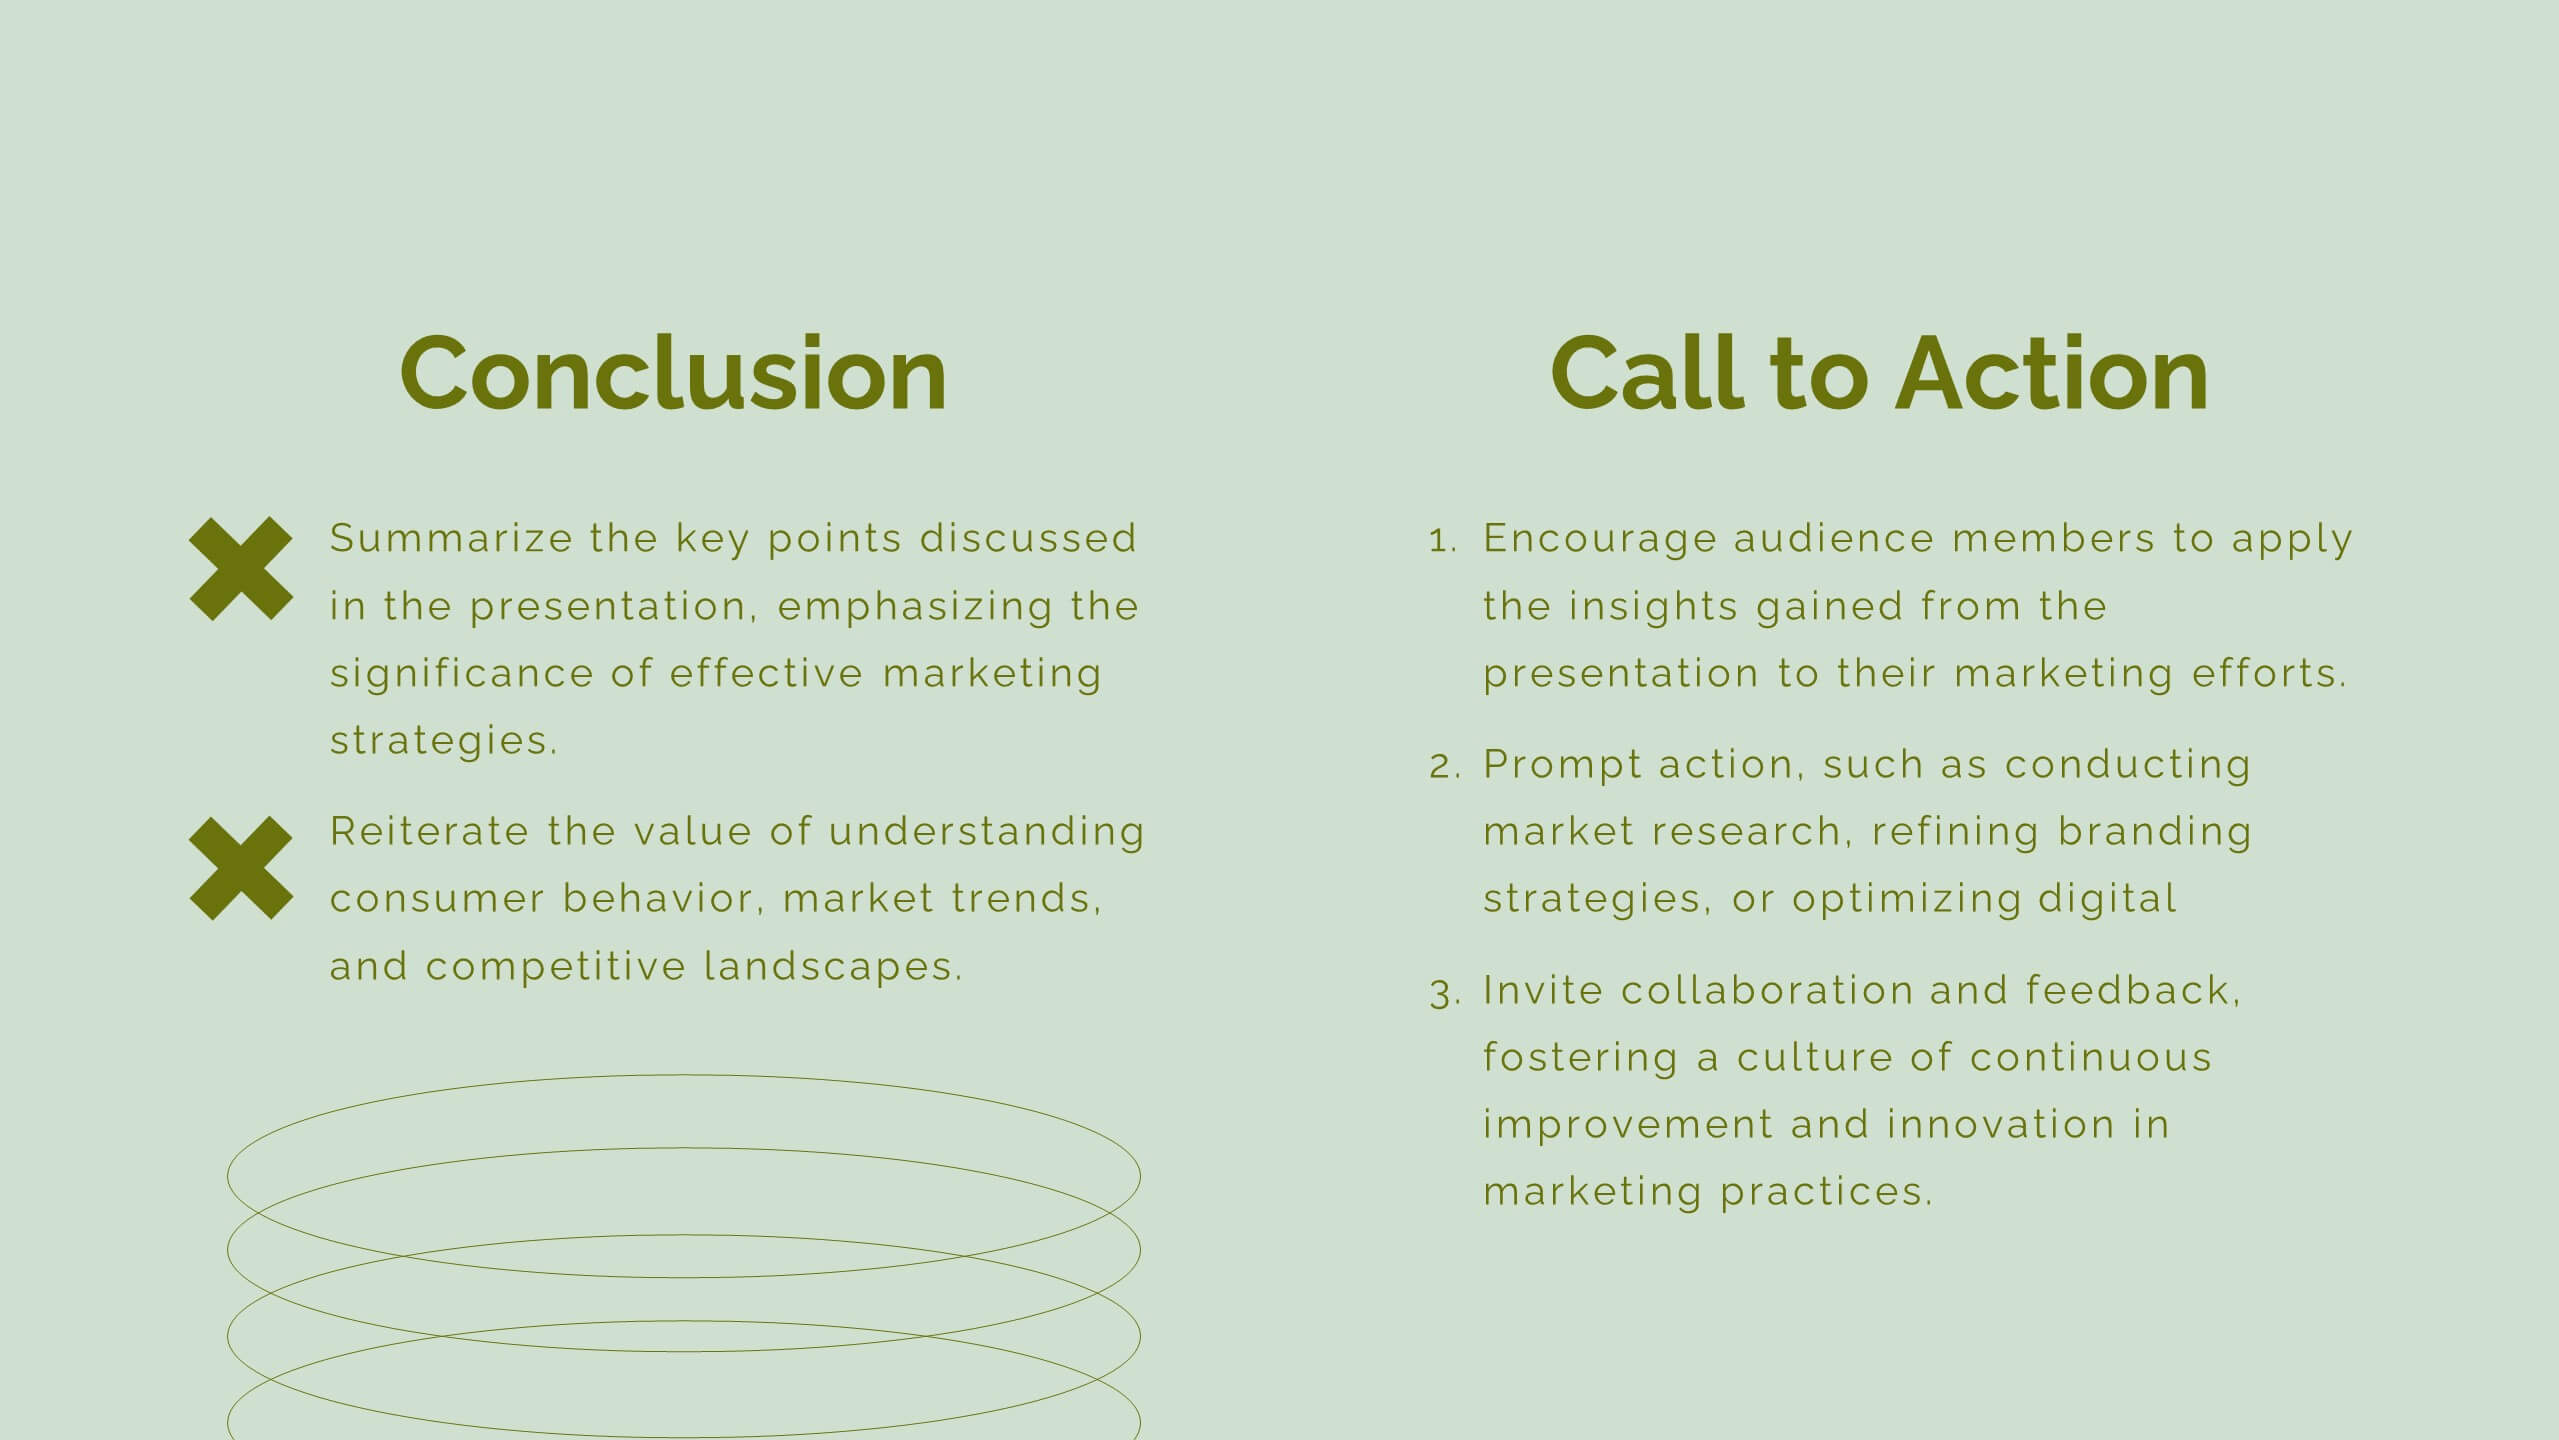
Aura Digital Marketing Strategy Plan Presentation
Revamp your digital marketing strategies with this dynamic template! Covering everything from industry overviews and consumer behavior analysis to emerging technologies and social media strategies, this template has it all. Perfect for creating compelling presentations that highlight data-driven marketing and brand storytelling. Compatible with PowerPoint, Keynote, and Google Slides.


6 diapositivas
Harvey Ball Assessment Infographics
Evaluate performance or satisfaction with our Harvey Ball Assessment infographic template. This template is fully compatible with popular presentation software like PowerPoint, Keynote, and Google Slides, allowing you to easily customize it to represent and communicate assessment results using Harvey Balls. The Harvey Ball Assessment infographic template offers a visually engaging platform to visually depict evaluations, ratings, or levels of satisfaction using Harvey Balls. Whether you're a manager, HR professional, or evaluator, this template provides a user-friendly canvas to create informative presentations and reports to convey assessment outcomes effectively. Enhance your assessment reporting with this SEO-optimized Harvey Ball Assessment infographic template, thoughtfully designed for clarity and ease of use. Customize it to showcase assessment data, ratings, and scores, making it a valuable tool for sharing performance or satisfaction levels with your audience. Start crafting your personalized infographic today to communicate your assessment results efficiently.