


Características


¿Tienes alguna pregunta?
Recomendar


5 diapositivas
New Hire Orientation Program
Welcome new employees with confidence using the New Hire Orientation Program Presentation. This step-by-step slide is designed to outline your company’s onboarding journey in five clear, structured stages. With labeled “Step 01” through “Step 05” banners, icon placeholders, and editable text boxes, this template is ideal for HR teams, managers, or team leads introducing company values, processes, or benefits. Available in both full-color and progressive highlight variations, it's fully customizable in PowerPoint, Keynote, and Google Slides.


7 diapositivas
Editable Gantt Timeline Presentation
Stay on top of your project deadlines with this Editable Gantt Timeline Presentation. Designed with a clean monthly layout and six task rows, it makes scheduling and tracking progress simple. Customize task names, durations, and icons easily. Perfect for PowerPoint, Keynote, or Google Slides for professional project planning.


7 diapositivas
Brainstorm Bubble Map Infographic
A brainstorm bubble map is a visual representation used to generate and organize ideas, concepts, or information around a central theme or topic. This infographic template is designed to be a versatile tool commonly utilized in brainstorming sessions, planning, problem-solving, or organizing thoughts. Compatible with Powerpoint, Keynote, and Google Slides. Fully customizable, visualize a multitude of colorful bubbles branching out from the central theme, each encapsulating a unique idea or concept. The vibrant and lively color palette adds an element of fun, reflecting the joy that comes from a successful brainstorming session.


7 diapositivas
Team Leadership and Management Presentation
Unlock the secrets of effective team leadership and management with our detailed presentation template. Designed for training sessions and workshops, it provides clear guidance on key leadership principles and team management tactics through engaging graphics and strategic layouts. Ideal for enhancing team dynamics and leadership skills.


6 diapositivas
Lean Business Canvas Framework
Simplify your business strategy with the Lean Business Canvas Framework Presentation. This slide offers a structured layout to map out key elements like partners, activities, value propositions, customer segments, and revenue streams—all in one view. Ideal for startups, business plans, or internal strategy sessions. Fully editable in PowerPoint, Keynote, and Google Slides.


5 diapositivas
Company Success Story Timeline Presentation
Highlight your journey with the Company Success Story Timeline Presentation. This modern, mountain-style layout helps you break down your company’s key milestones, phases, or achievements step by step. With five customizable stages and icons, it’s ideal for visual storytelling, growth metrics, or project retrospectives. Fully editable in Canva, PowerPoint, Keynote, and Google Slides.


12 diapositivas
Alphabet Learning and Education Presentation
Introduce concepts creatively with this bold "A"-shaped infographic designed for education topics. Each segment of the letter highlights a numbered point, making it ideal for step-by-step instructions, learning stages, or literacy development. Use it to simplify complex ideas visually. Fully editable in PowerPoint, Keynote, and Google Slides.


6 diapositivas
Project Timeline and Weekly Schedule Presentation
Plan smarter with the Project Timeline and Weekly Schedule Presentation—a clear, structured template for tracking tasks week by week across multiple projects. Ideal for managers, teams, or freelancers needing a bird’s-eye view of workload distribution. Fully editable for PowerPoint, Keynote, and Google Slides.


5 diapositivas
Business Performance Dashboard Presentation
Bring your data to life with a crisp, unified view of metrics that matter. This presentation helps you track performance, compare results, and visualize progress through charts and KPIs that keep teams aligned. Clean, modern, and easy to adapt. Fully compatible with PowerPoint, Keynote, and Google Slides.


4 diapositivas
Employee and Team Performance Analysis
Visualize individual and team contributions with this clear and structured performance analysis template. Showcase key metrics, employee growth, and team achievements using easy-to-read layouts and progress indicators. Ideal for HR reports, performance reviews, and team evaluations. Fully editable in PowerPoint, Keynote, and Google Slides.


4 diapositivas
Artistic Watercolor Background Presentation
Add a creative flair to your slides with this Artistic Watercolor Background template. Featuring soft gradients and fluid brushstroke visuals, it's perfect for showcasing concepts in a stylish, modern way. Fully editable in PowerPoint, Keynote, and Google Slides—ideal for design-driven pitches, personal projects, or creative business storytelling.


5 diapositivas
Pricing Strategy and Comparison Table Presentation
Present your pricing plans with clarity and impact using the Pricing Strategy and Comparison Table Presentation. This slide offers a structured layout to compare features, pricing tiers, and plan benefits side-by-side. Perfect for SaaS, services, or product pitches. Fully editable in Canva, PowerPoint, Google Slides, and Keynote.


4 diapositivas
Project Proposal Executive Summary Presentation
Optimize your project presentations with the 'Project Proposal Executive Summary' template. Crafted to clearly showcase your project’s most crucial elements, this template uses visuals and concise text to highlight objectives and deliverables effectively. Ideal for professionals preparing proposals in PowerPoint, Keynote, or Google Slides.


21 diapositivas
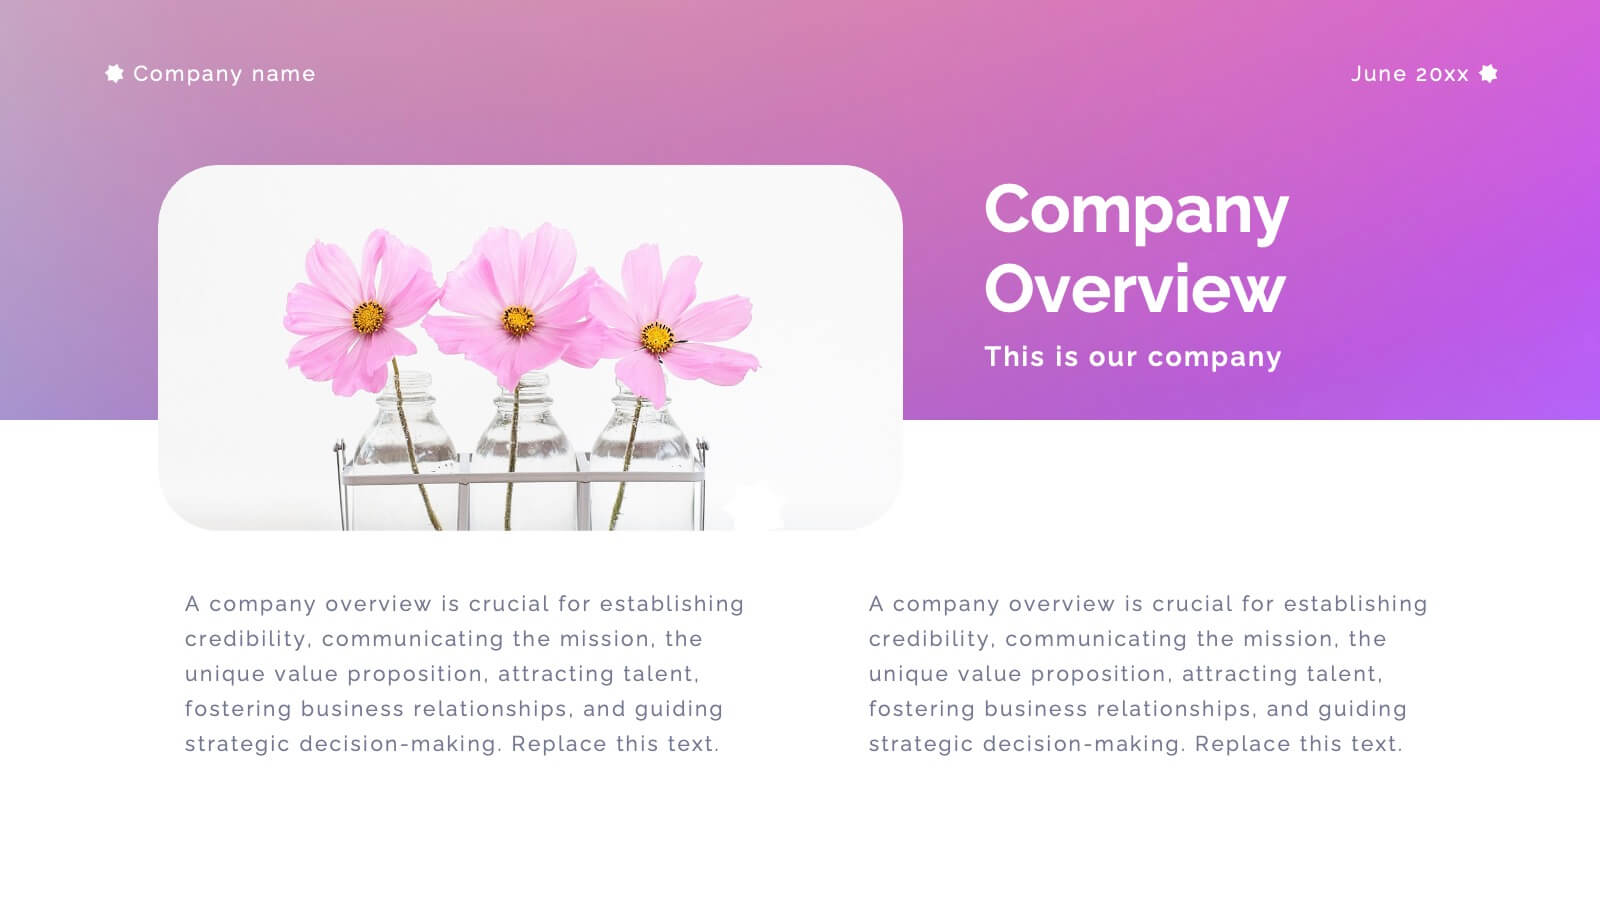
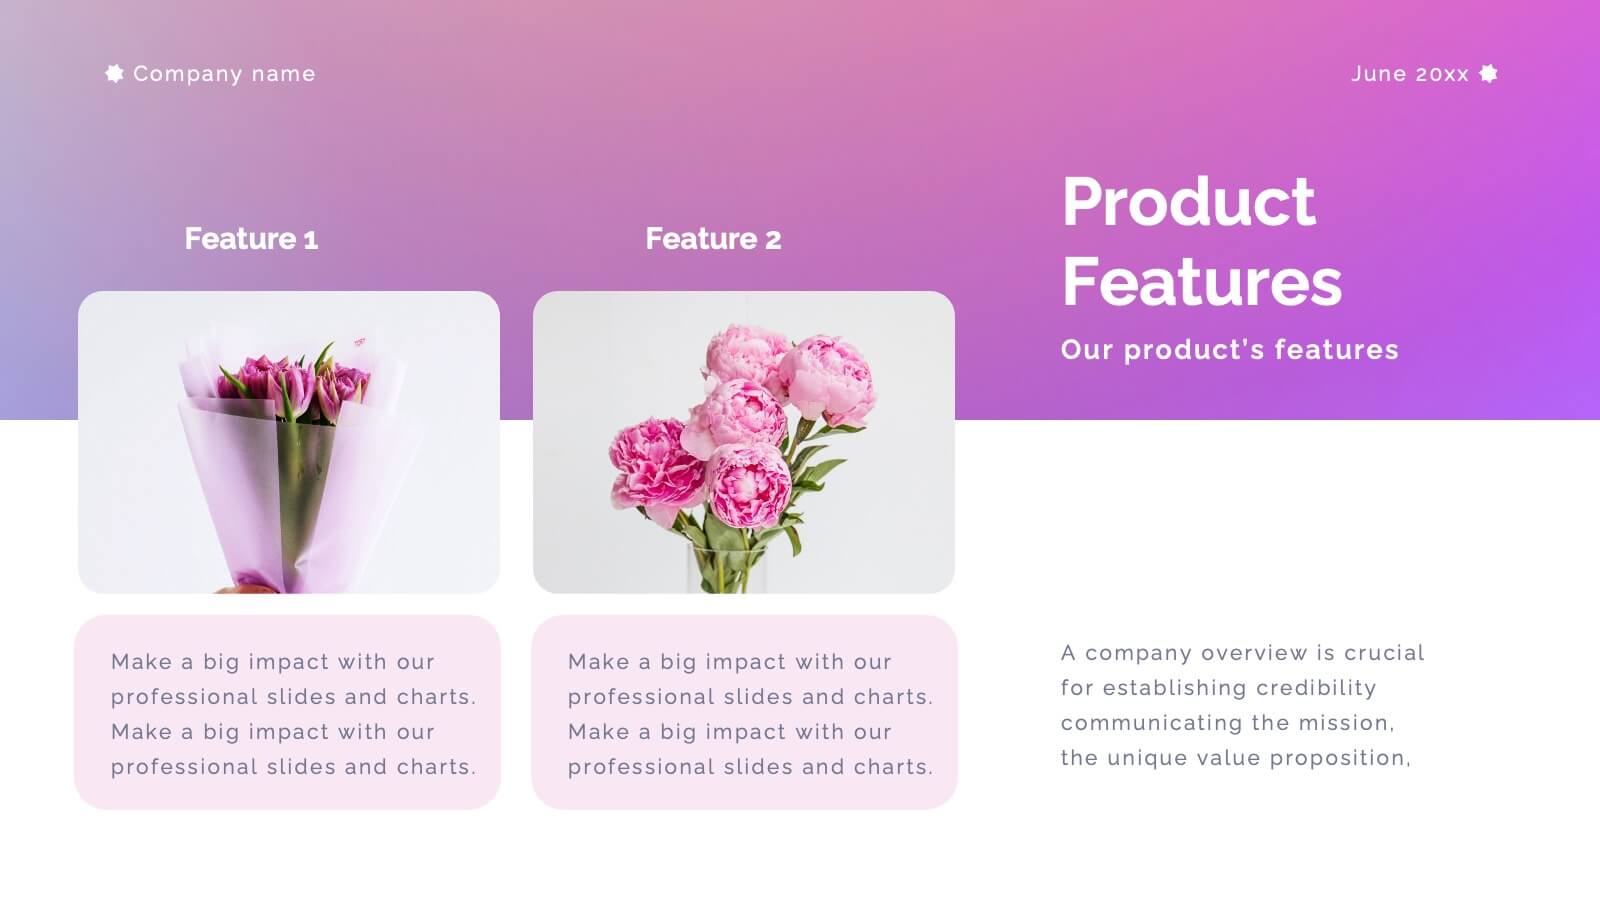
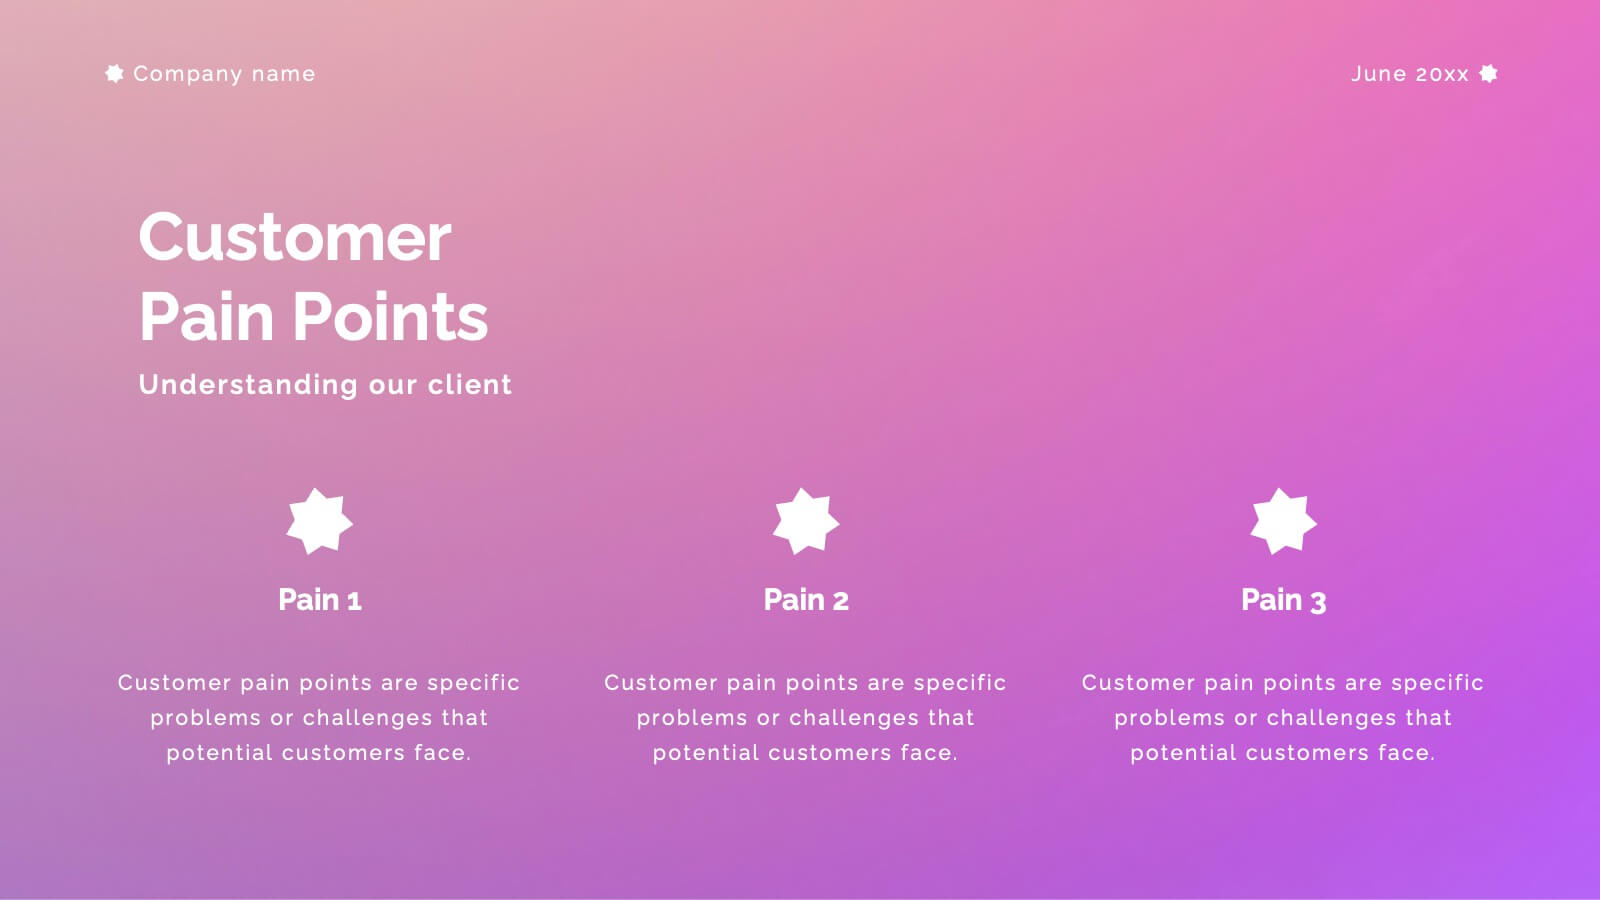
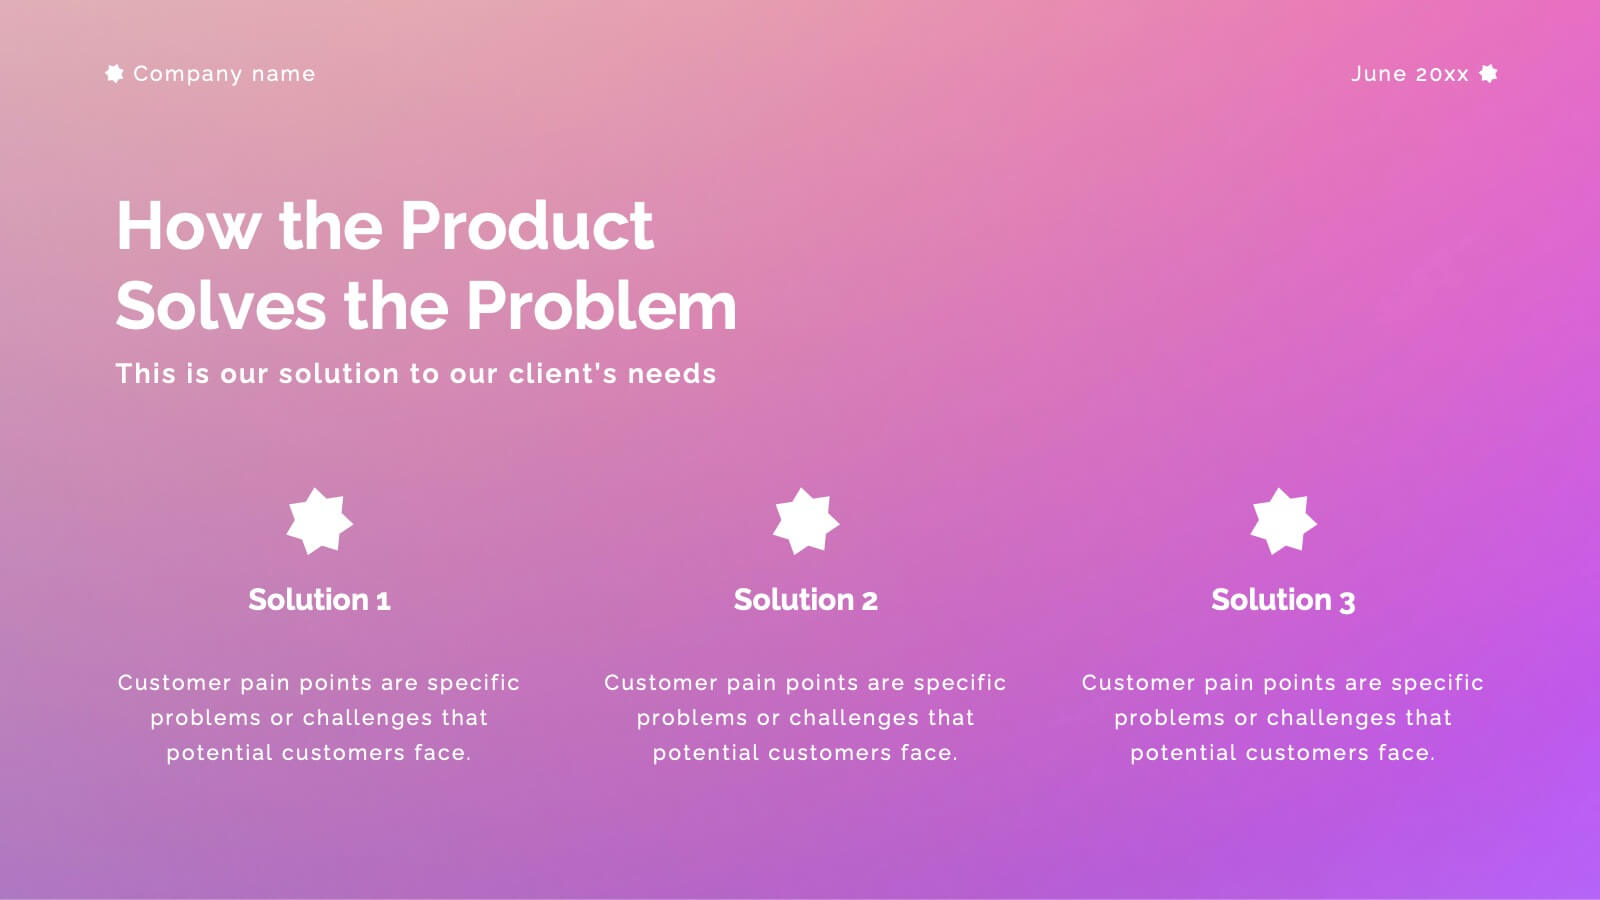
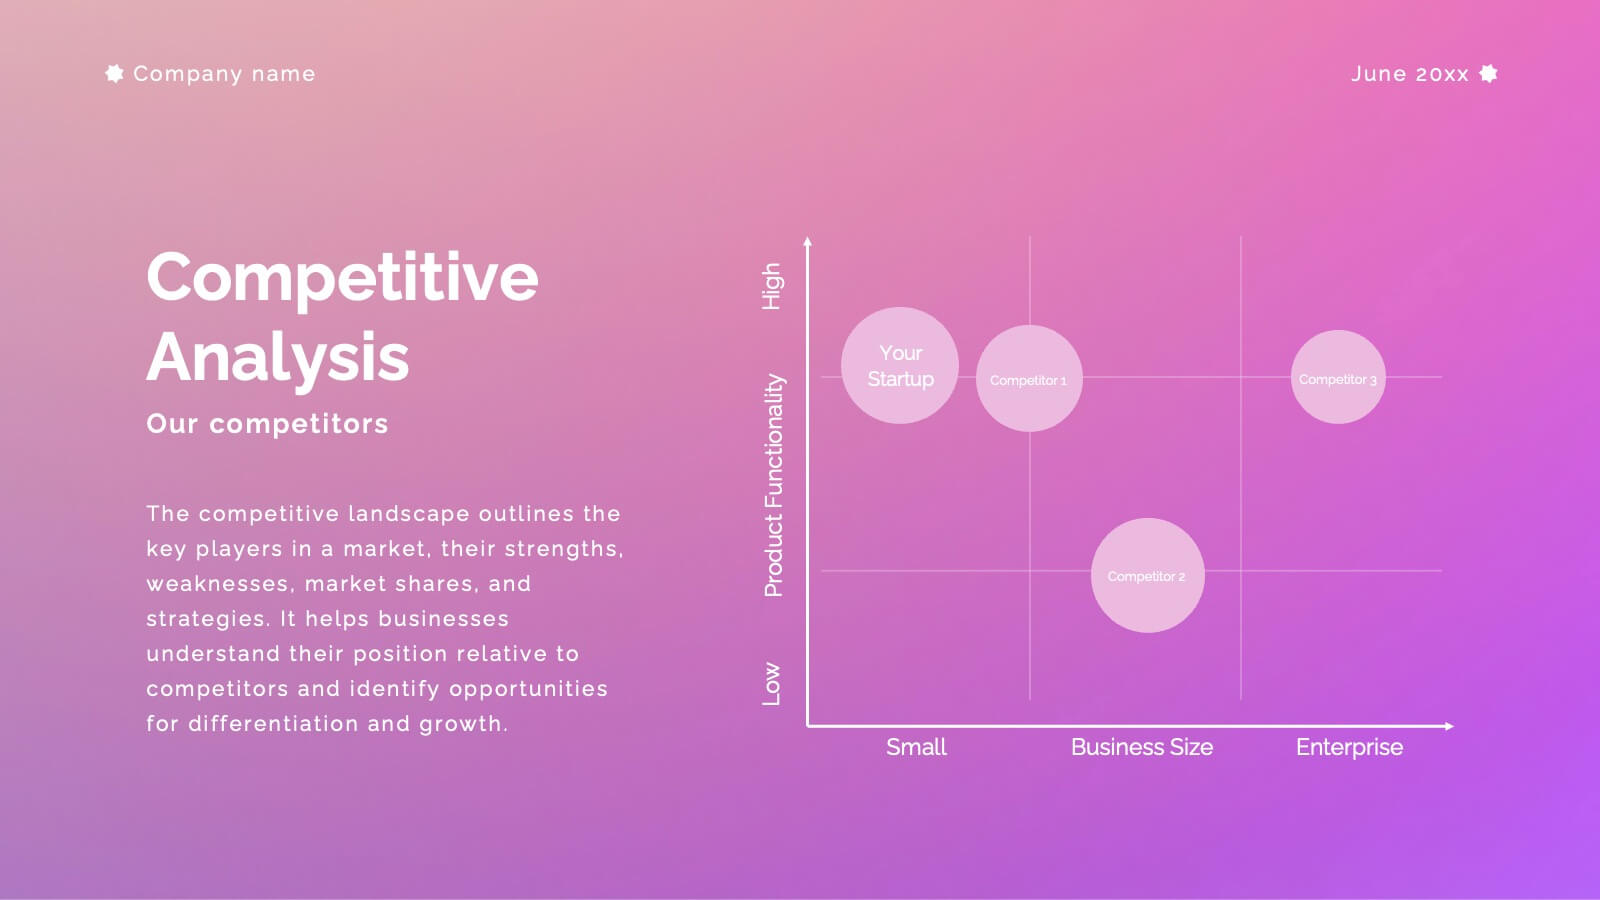
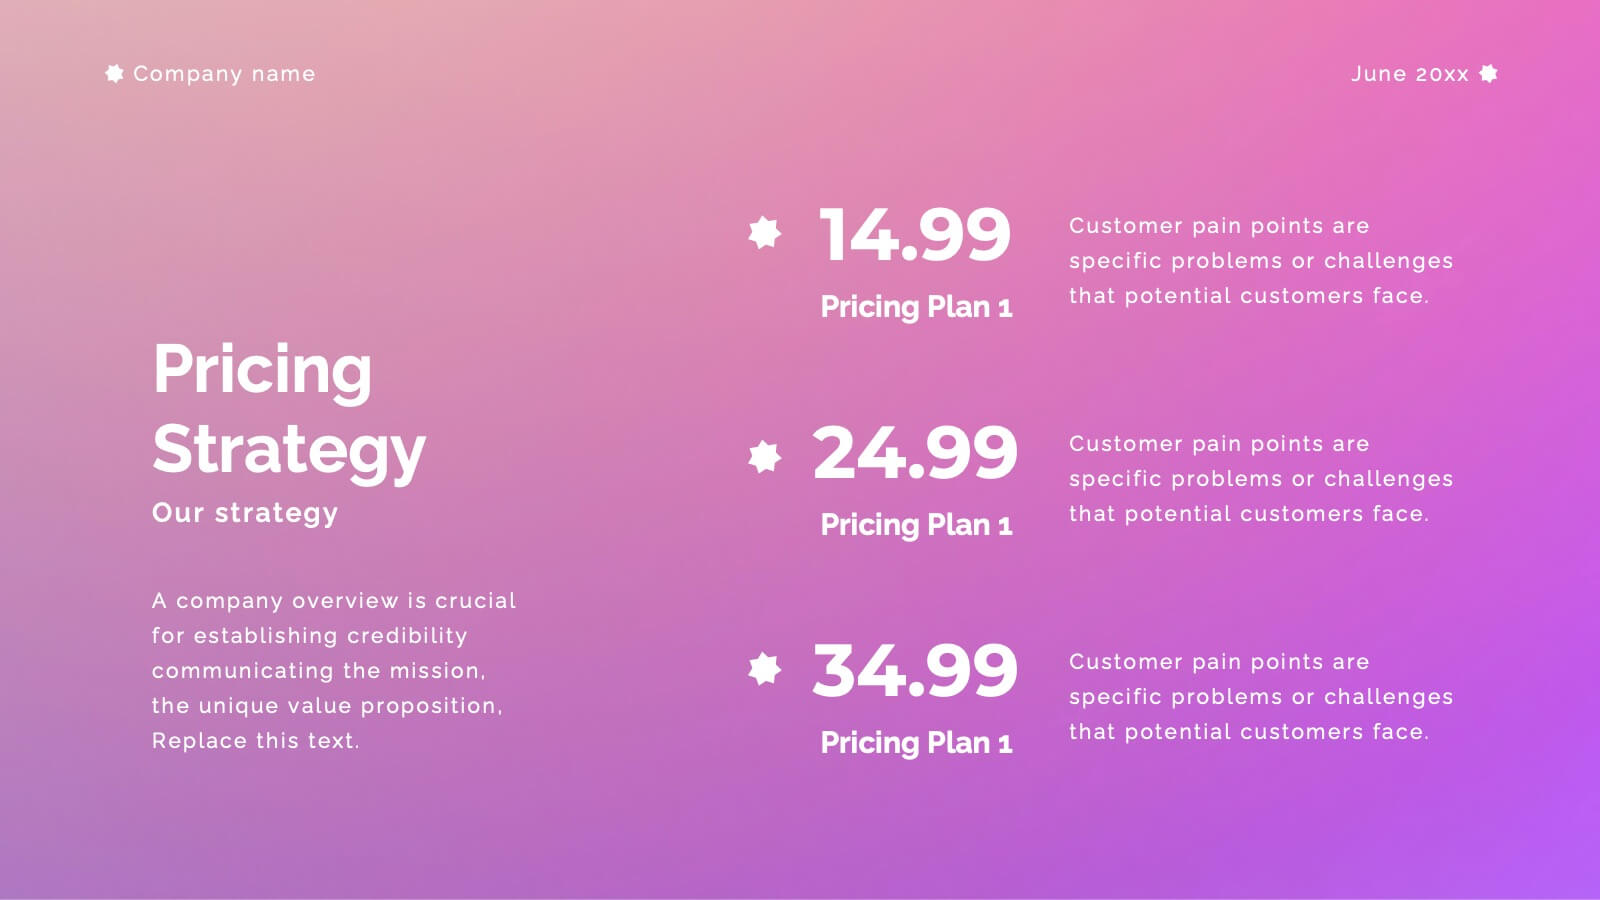
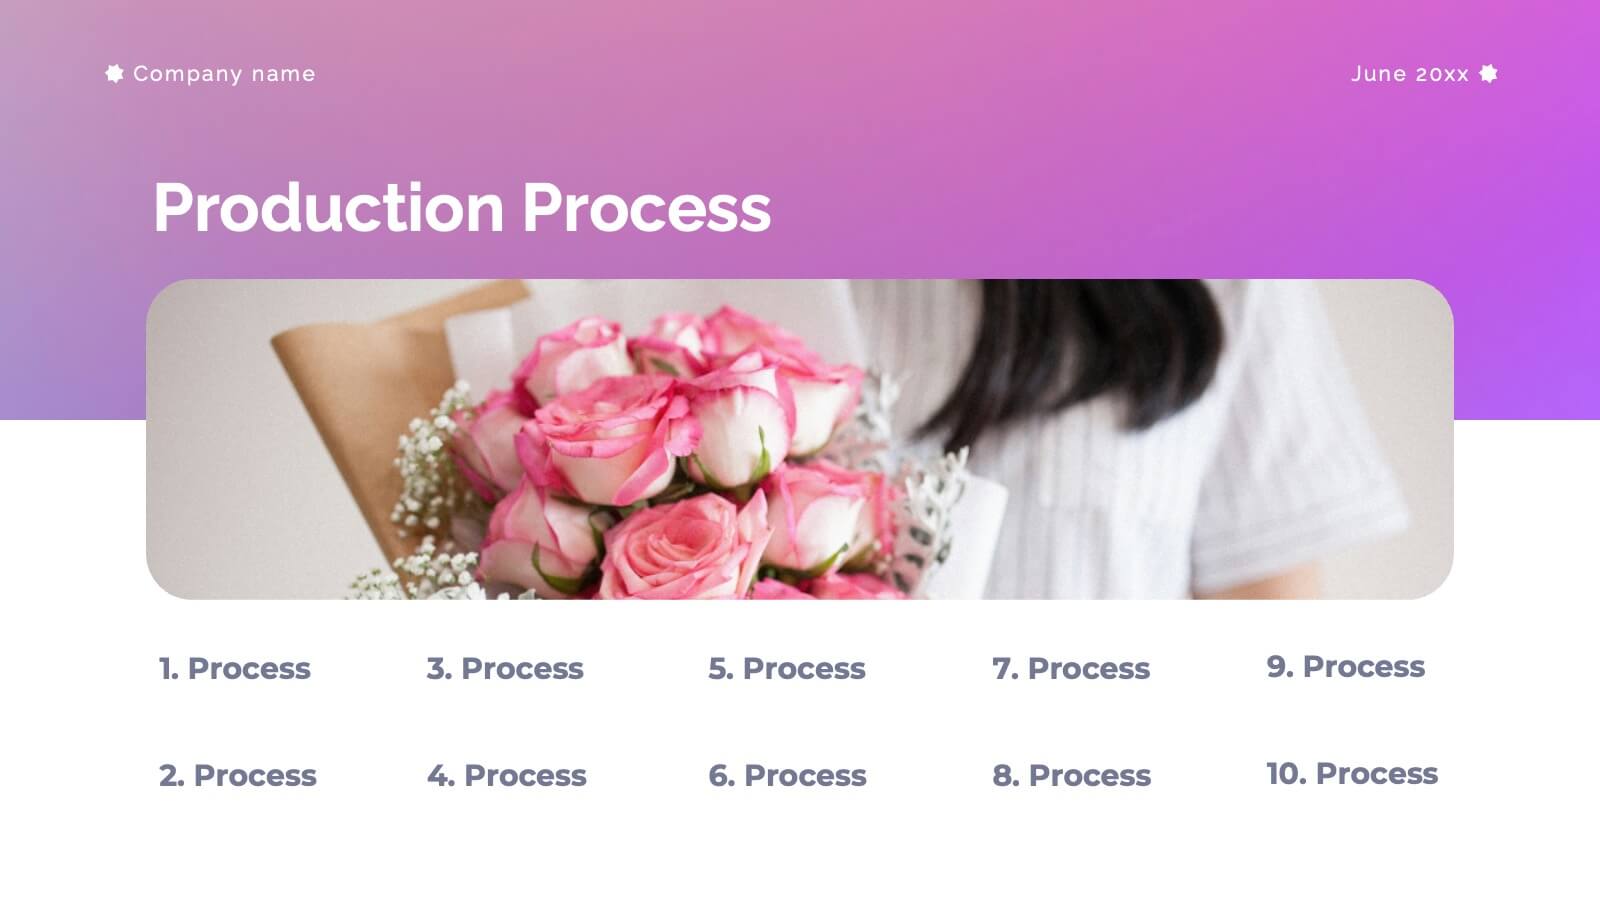
Aventurine New Product Proposal Presentation
Showcase your product in style with this vibrant and modern product proposal template! It covers everything from product features to target market, pricing strategy, and marketing plans. Designed for clarity and impact, it's perfect for pitching your product. Fully customizable, and compatible with PowerPoint, Keynote, and Google Slides for seamless presentations.


26 diapositivas
Workouts for Every Body Part Presentation
Achieve total-body fitness with this dynamic presentation on targeted workouts for every muscle group. Covering effective exercises, proper form, strength training techniques, and workout plans, this template helps simplify fitness routines for all levels. Fully customizable and compatible with PowerPoint, Keynote, and Google Slides for a seamless and engaging presentation experience.


6 diapositivas
Strategic Planning with Hexagon Diagram
Visualize complex plans with clarity using the Strategic Planning with Hexagon Diagram Presentation. This slide layout features six connected hexagons forming a cohesive structure around a central idea—perfect for mapping out strategic pillars, initiatives, or departmental functions. Each segment is color-coded and labeled A–F, making it easy to present interconnected elements such as goals, KPIs, resources, risks, and action plans. Fully editable in PowerPoint, Keynote, and Google Slides, you can customize the layout to fit your organizational strategy or project flow.


8 diapositivas
Leadership Training Workshop Presentation
Boost your team's leadership skills with our 'Leadership Training Workshop' template, perfect for structuring dynamic and effective training sessions. Designed to focus on core leadership competencies, this template supports organizations in cultivating influential leaders. It's fully compatible with PowerPoint, Keynote, and Google Slides, facilitating a seamless integration into your training curriculum.