


Características


¿Tienes alguna pregunta?
Recomendar


22 diapositivas
Event Agenda Presentation
Organize your event with precision using this Event Agenda presentation template. Designed for clarity and impact, it includes slides for conference overviews, speaker introductions, session descriptions, and networking opportunities. Perfect for business conferences or workshops, this template is compatible with PowerPoint, Keynote, and Google Slides, ensuring your event runs smoothly and professionally.


6 diapositivas
Big Data Insights Visual Presentation
Transform complex analytics into clear, engaging visuals that tell a compelling story. This modern layout is perfect for showcasing data connections, performance metrics, and analytical insights in a visually balanced way. Fully editable and compatible with PowerPoint, Keynote, and Google Slides for seamless customization and professional presentations.


25 diapositivas
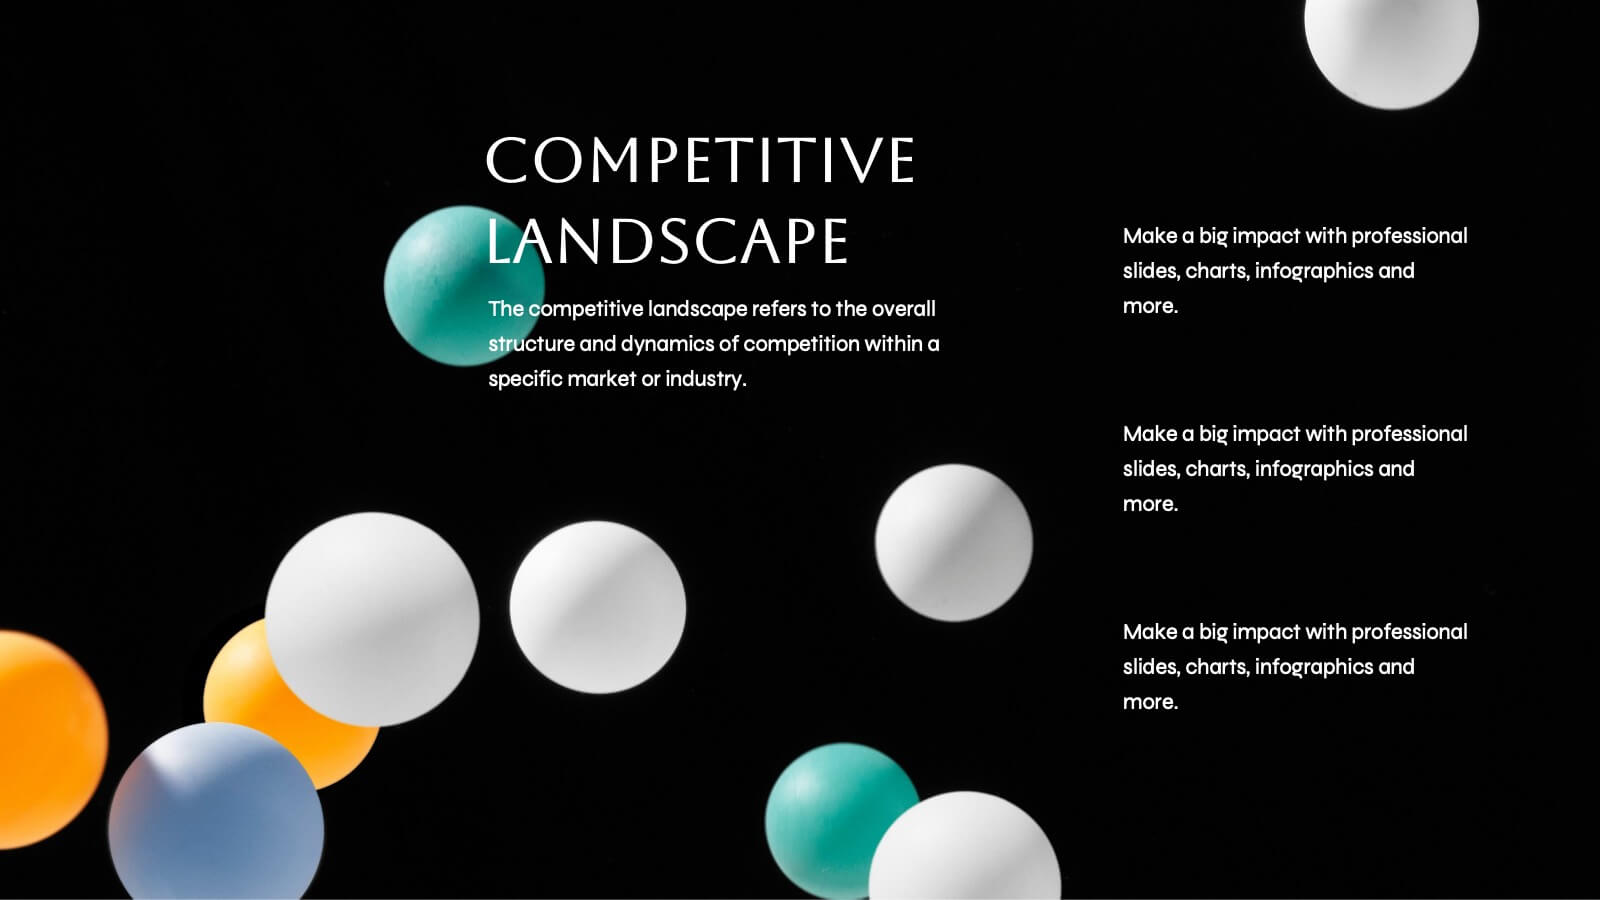
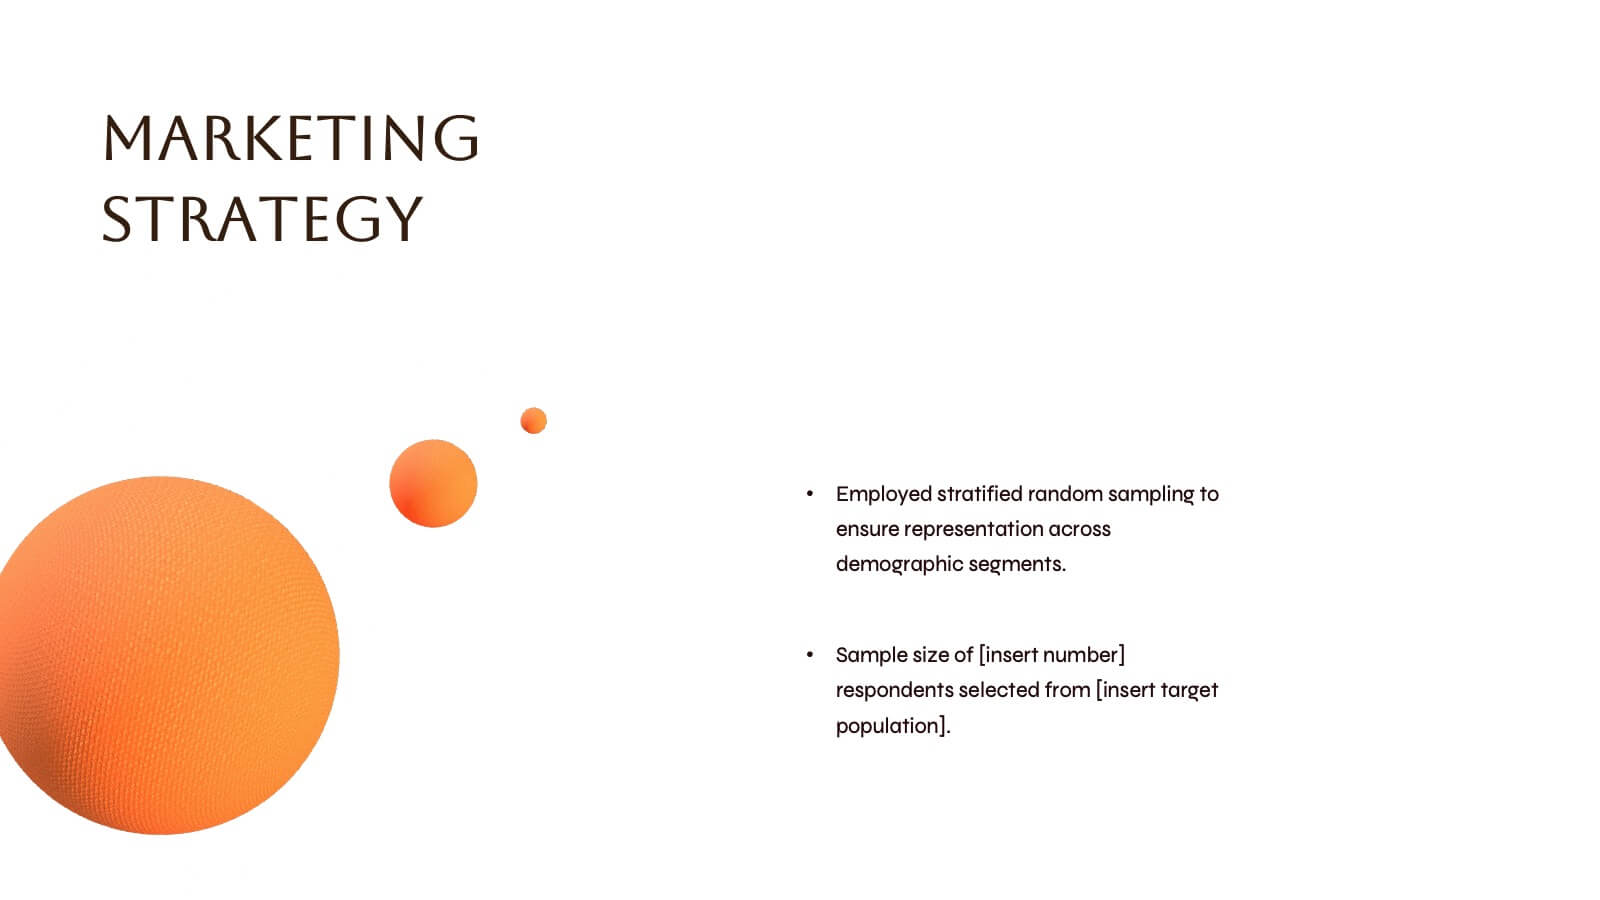
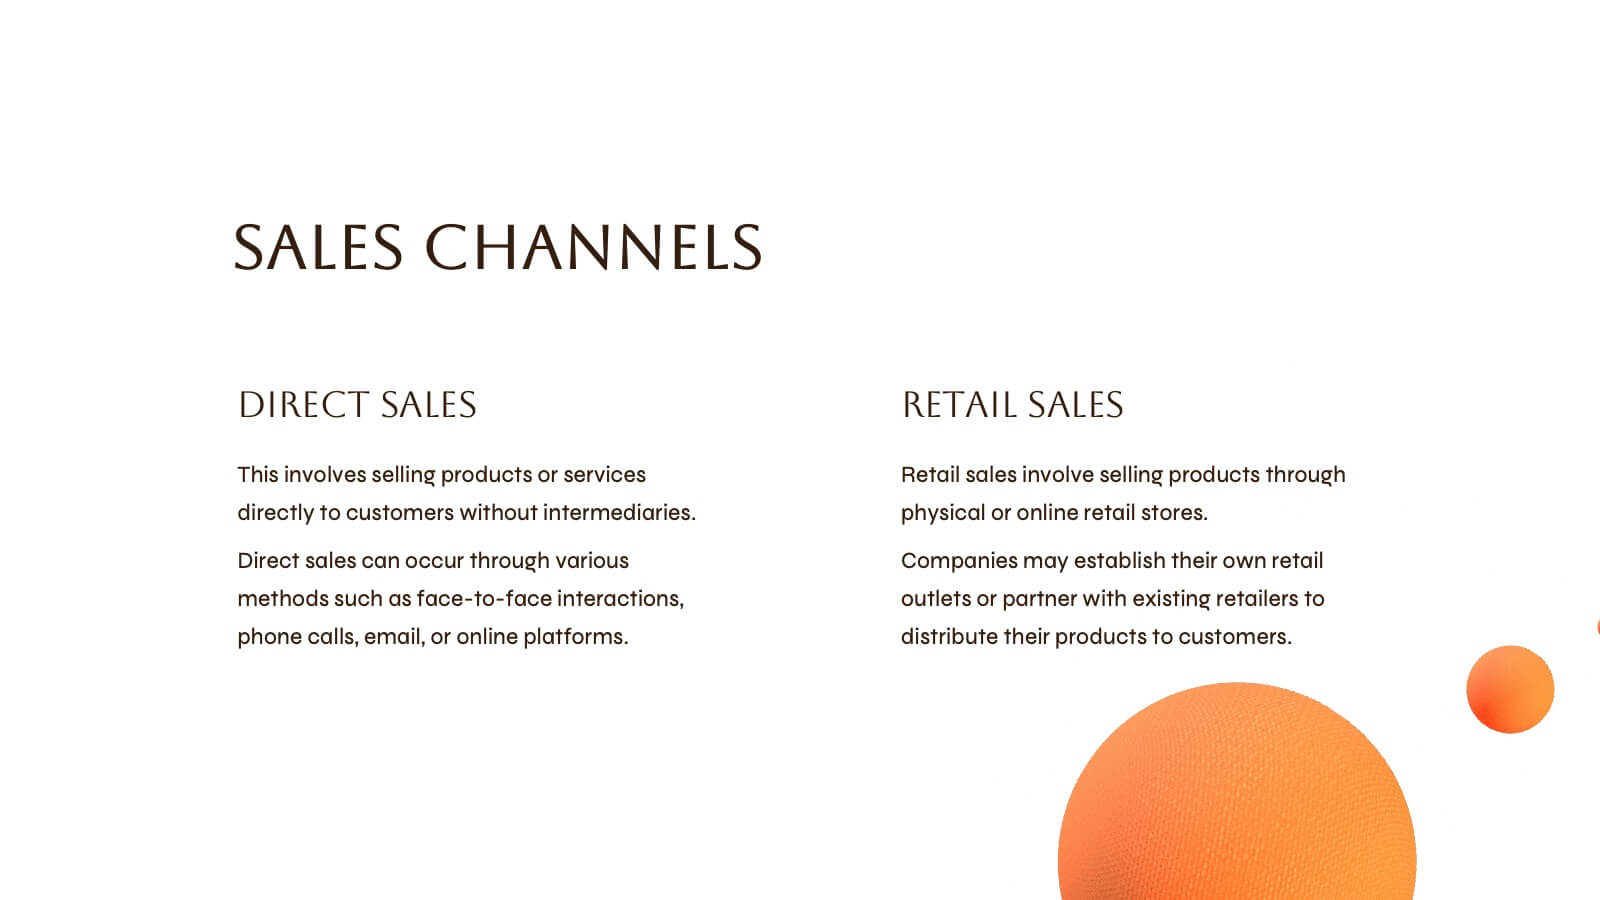
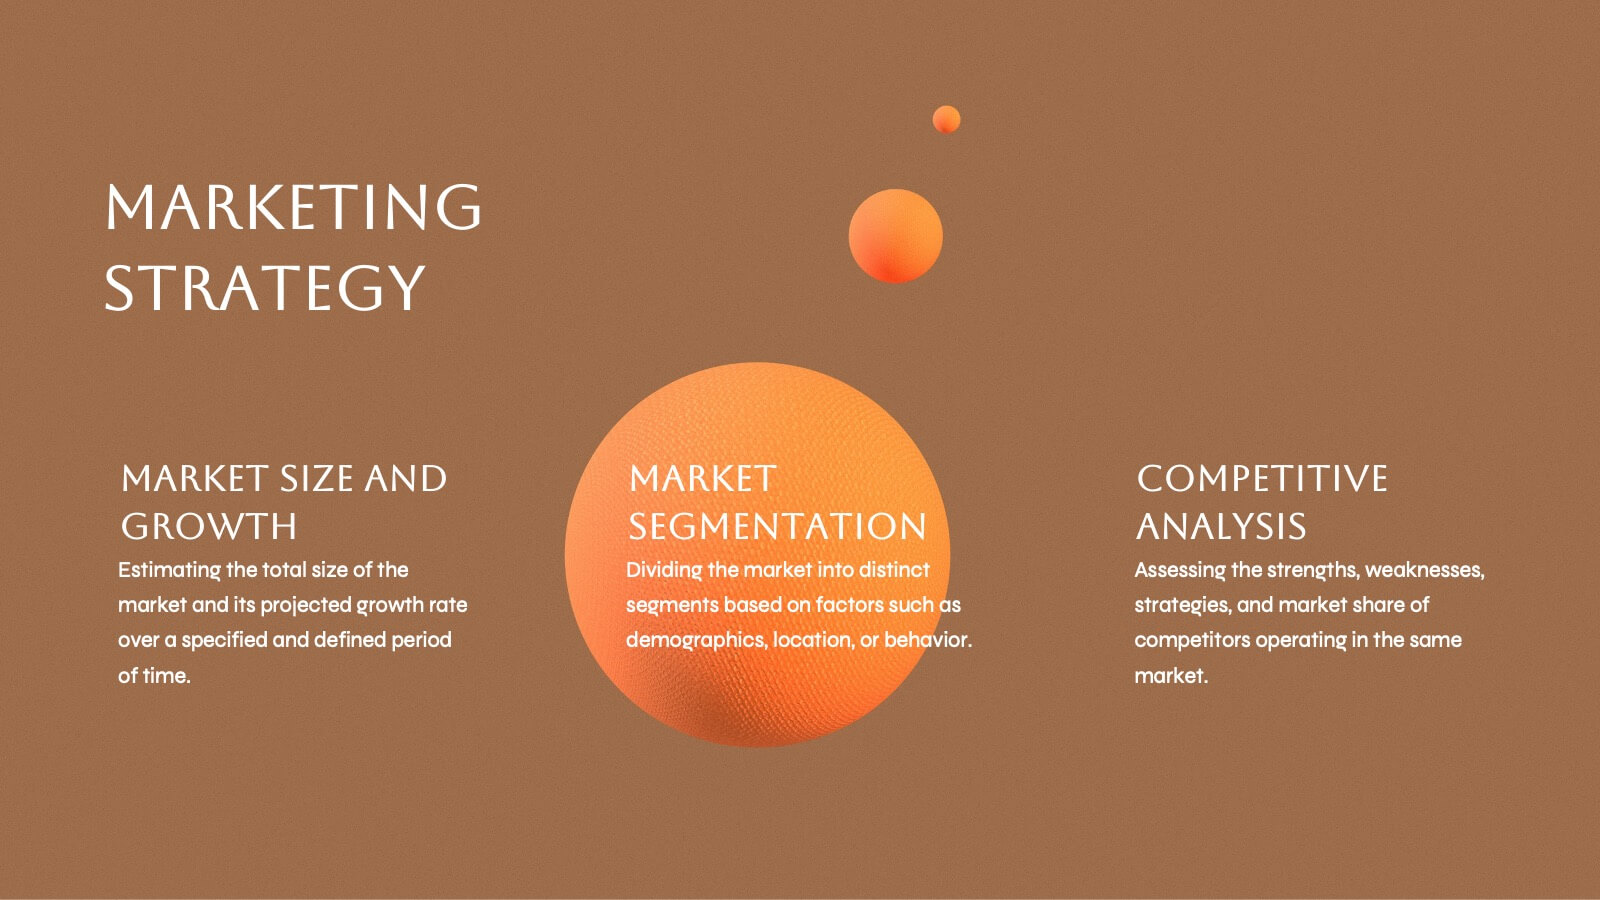
The Future of Retail Presentation Template
Step into the next generation of commerce with this sleek and modern presentation template exploring the future of retail! Designed to showcase trends, innovations, and strategies shaping the retail landscape, this template offers a perfect balance of visual appeal and clarity. With customizable charts, data-driven infographics, and professional layouts, it’s ideal for presenting market insights, technology integration, and consumer behavior shifts. Bold colors and contemporary design elements create a dynamic flow, keeping your audience engaged while emphasizing key points. Perfect for entrepreneurs, analysts, or educators, this template adapts to a variety of topics with ease. Fully compatible with PowerPoint, Keynote, and Google Slides, it ensures your presentation is as forward-thinking as the ideas you share


4 diapositivas
3-Level Tree Chart Presentation
Grow your ideas from concept to execution with this beautifully designed visual layout. Perfect for showcasing layered strategies, hierarchical processes, or business development stages, it balances clarity and creativity through a clean, tree-inspired design. Fully editable and compatible with PowerPoint, Keynote, and Google Slides for seamless professional use.


2 diapositivas
Professional Proposal for Project Approval Presentation
Impress stakeholders and decision-makers with the Professional Proposal for Project Approval Presentation. Designed to guide your audience through key objectives and visual justifications, this clean, image-rich layout is ideal for startups, teams, and consultants. Fully customizable in PowerPoint, Keynote, and Google Slides.


5 diapositivas
Music Eras Infographics
Music history is often divided into distinct eras or periods based on the characteristics and predominant styles of music during specific time periods. These infographic templates are designed to present a chronological overview of significant musical periods, highlighting their characteristics, key composers, notable genres, and major developments. These templates serves as a comprehensive visual guide to help audiences understand the evolution of music throughout history. This template provides a captivating overview of the major music eras, allowing viewers to appreciate the distinct characteristics and contributions of each period.


6 diapositivas
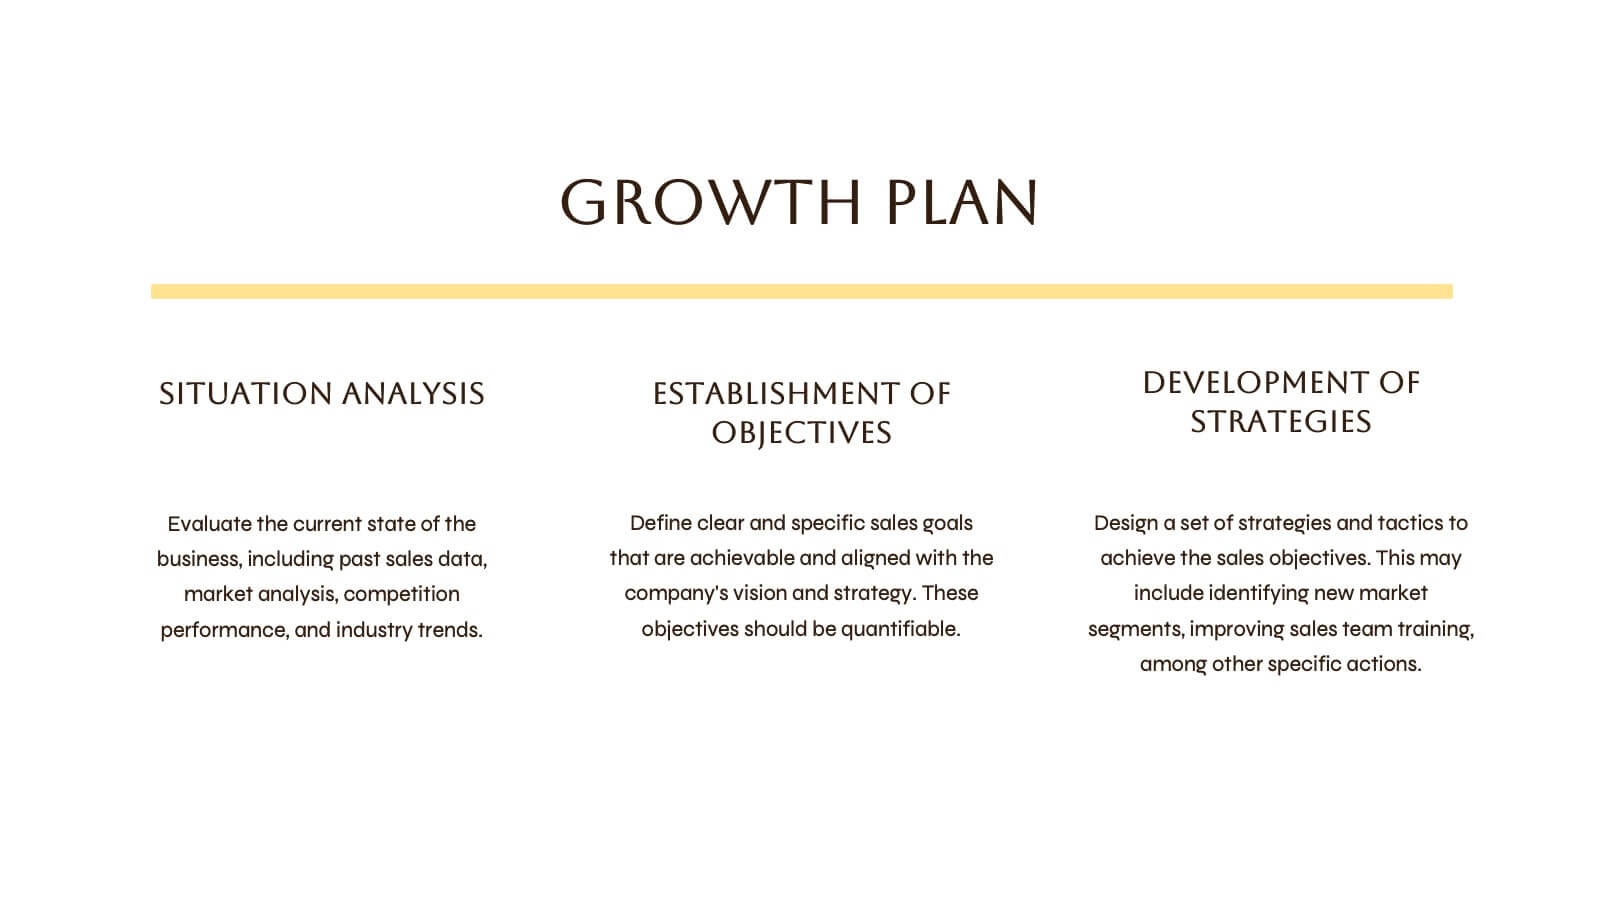
Strategic Solution Framework Presentation
Build your ideas step by step with this dynamic layout that turns strategies into a clear visual journey. Perfect for illustrating processes, growth plans, or solution pathways, it helps simplify complex frameworks into engaging visuals. Fully editable and compatible with PowerPoint, Keynote, and Google Slides for seamless customization.


20 diapositivas
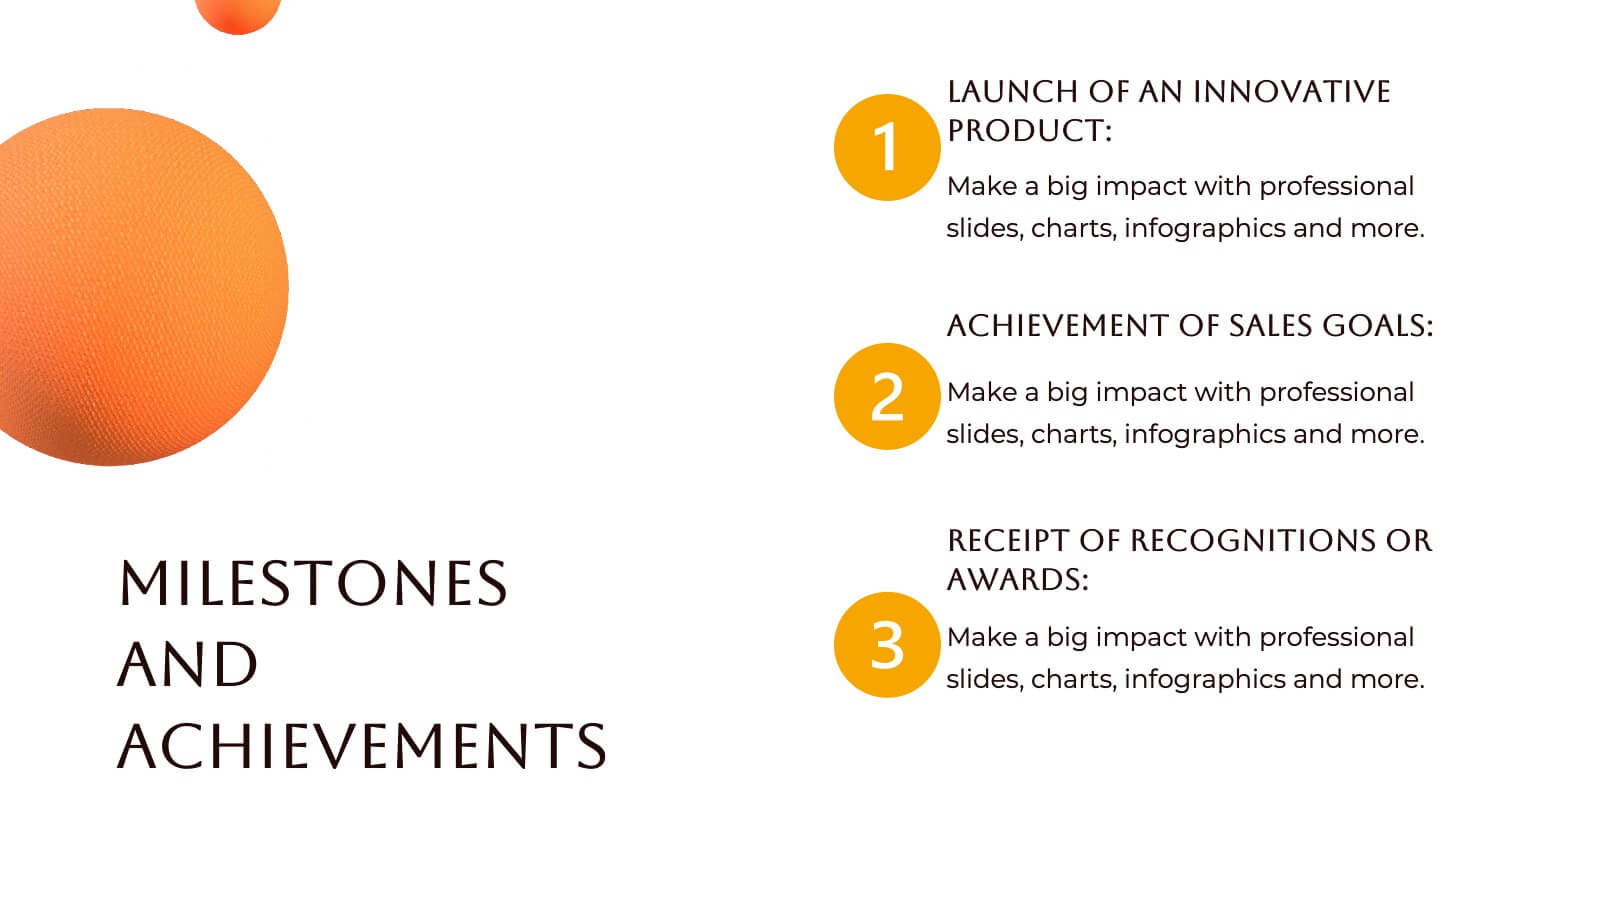
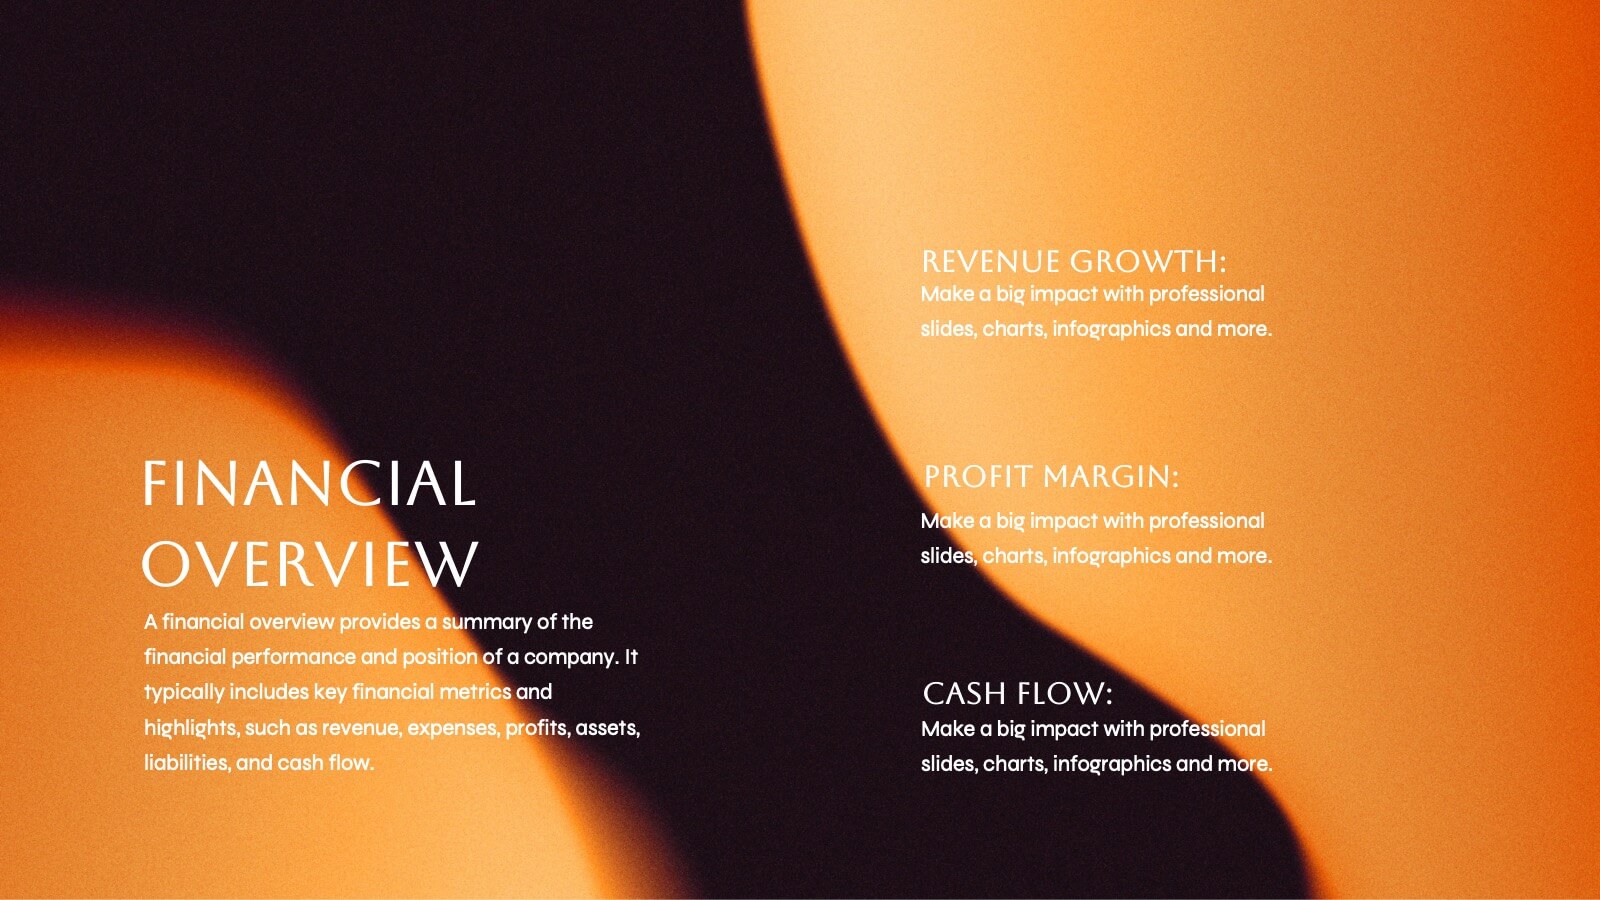
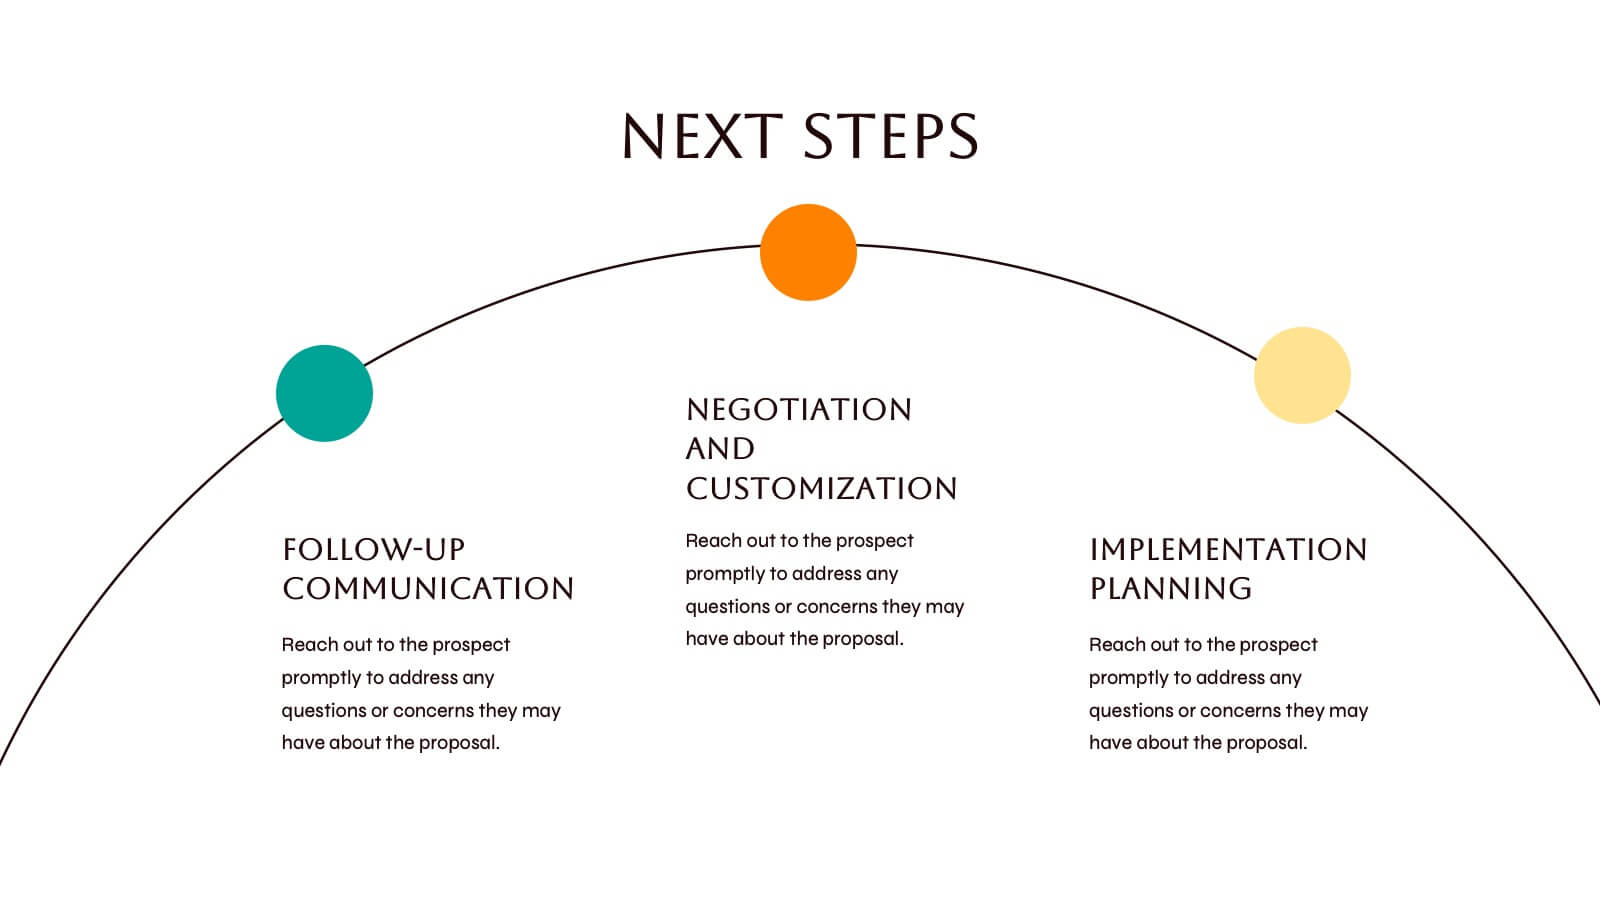
Fire Spin Startup Pitch Deck Presentation
Ignite your pitch with this bold, fire-inspired presentation template, perfect for showcasing your startup’s potential! This deck helps you present key business elements like market research, revenue models, and growth strategies in a dynamic, visually engaging format. Stand out from the competition. Compatible with PowerPoint, Keynote, and Google Slides.


3 diapositivas
Medical Report Summary and Review Deck Presentation
Present health data clearly with this Medical Report Summary and Review Deck. Designed for healthcare professionals, this layout features checklist icons, charts, and clinical visuals to highlight reports or patient insights. Fully editable in PowerPoint, Keynote, and Google Slides, it ensures your medical updates remain professional, concise, and easy to follow.


21 diapositivas
Aquamarine Creative Portfolio Presentation
Dive into creativity with this stunning aquamarine-inspired portfolio presentation! Perfect for showcasing your creative work, this template allows you to highlight your projects, skills, and achievements with a refreshing and modern design. Its clean and dynamic layout enhances your portfolio's impact. Compatible with PowerPoint, Keynote, and Google Slides.


5 diapositivas
South America Location Map Slide Presentation
Highlight your business reach or project data across South America with a clean, professional map layout. This design is perfect for showcasing key locations, regional metrics, or market insights in a visually engaging way. Fully compatible with PowerPoint, Keynote, and Google Slides for effortless customization and presentation.


4 diapositivas
Minimal Company Profile Deck Presentation
Make a bold first impression with this sleek, minimal layout designed to showcase your company’s vision, services, and team with clarity and style. Perfect for startups or established brands, it balances professionalism and creativity effortlessly. Fully editable and compatible with PowerPoint, Keynote, and Google Slides for seamless customization.


5 diapositivas
Company Success Story Timeline Presentation
Highlight your journey with the Company Success Story Timeline Presentation. This modern, mountain-style layout helps you break down your company’s key milestones, phases, or achievements step by step. With five customizable stages and icons, it’s ideal for visual storytelling, growth metrics, or project retrospectives. Fully editable in Canva, PowerPoint, Keynote, and Google Slides.


5 diapositivas
Business Growth and Expansion
Visually communicate each stage of business development with this Business Growth and Expansion diagram. Featuring a dynamic circular flow, this editable slide is perfect for showcasing progress, scaling strategies, or roadmap milestones. Fully compatible with PowerPoint, Keynote, and Google Slides—ideal for business plans and strategic presentations.


6 diapositivas
Product Pricing Table Comparison
Make your pricing pitch clear and compelling with this vibrant comparison table template designed for easy decision-making. Whether you're showcasing subscription plans, service tiers, or product bundles, this slide helps highlight key features and value differences at a glance. Fully editable in PowerPoint, Keynote, and Google Slides.


4 diapositivas
Problem-Solving Puzzle Diagram Presentation
The "Problem-Solving Puzzle Diagram Presentation" template effectively showcases a creative approach to illustrating complex problem-solving strategies. Each piece of the puzzle represents a unique aspect of the solution process, encouraging viewers to consider how different components fit together to achieve a successful outcome. The diagram uses contrasting colors to differentiate between the sections clearly, making it easy for the audience to follow along and understand the interconnections. This template is perfect for business analysts, project managers, or any professional involved in strategic planning and problem-solving. It's designed to facilitate discussions in workshops, meetings, or team collaborations where visual aids can enhance comprehension and engagement in developing solutions.


8 diapositivas
Effective Task Delegation with RACI Presentation
Streamline task ownership and team collaboration using this Effective Task Delegation with RACI template. Featuring a bold, visually segmented layout, this slide helps clearly define who is Responsible, Accountable, Consulted, and Informed for each step of your workflow. Perfect for project managers, HR leaders, and operations teams seeking to enhance clarity, reduce bottlenecks, and boost productivity. Fully customizable in PowerPoint, Keynote, and Google Slides to match your team structure and brand style.