


Características


¿Tienes alguna pregunta?
Recomendar


5 diapositivas
Understanding Customer Needs with Empathy Map Presentation
Gain deeper customer insights with the Understanding Customer Needs with Empathy Map Presentation. This template simplifies user research by visually organizing customer thoughts, behaviors, and emotions into a clear layout. Perfect for UX teams, product designers, and marketers aiming to craft user-centric strategies. Fully editable in PowerPoint, Keynote, Canva, and Google Slides.


5 diapositivas
Solution Building with Puzzle Framework Presentation
Present integrated strategies with the Solution Building with Puzzle Framework Presentation. This visually compelling layout uses a four-piece puzzle cross to represent interconnected ideas or components—perfect for mapping out project phases, strategic solutions, or department contributions. Fully customizable in Canva, PowerPoint, or Google Slides for easy content editing.


4 diapositivas
Editable Cause and Effect Diagram Presentation
Bring clarity to every insight with a bold visual layout that makes connections between actions and outcomes easy to follow. This presentation helps you explain root causes, outline impacts, and guide decision-making with clean, structured graphics. Ideal for reports, planning, and analysis. Fully compatible with PowerPoint, Keynote, and Google Slides.


4 diapositivas
IT Operations Management Presentation
Enhance your IT strategy with the IT Operations Management Presentation template. This clean, modern slide layout helps illustrate key operational processes, performance metrics, and strategic improvements with an easy-to-follow, upward trajectory design. Ideal for IT managers and business leaders looking to showcase efficiency, scalability, and innovation. Fully editable in PowerPoint, Keynote, and Google Slides for seamless customization.


6 diapositivas
School Goals and Administration Presentation
Visualize key academic priorities with this notebook-style layout, perfect for school administrators and teachers. Featuring colorful pushpin markers and a two-page spread, this template is great for outlining goals, responsibilities, or class guidelines. Fully editable in PowerPoint, Keynote, and Google Slides for customized, classroom-ready presentations.


10 diapositivas
Business Expansion and Growth Path Presentation
Illustrate your company’s strategic milestones with the Business Expansion and Growth Path Presentation. This step-by-step layout is perfect for showcasing phases of development, scaling goals, or startup growth trajectories. Fully customizable in PowerPoint, Keynote, and Google Slides—ideal for business plans, pitch decks, and strategic reviews.


5 diapositivas
Cognitive Psychology Framework Presentation
Unlock insights in the most visual way possible with this bold, brain-powered slide! This presentation template helps simplify complex ideas behind how we think, reason, and remember—perfect for research, education, or team workshops. Fully customizable and compatible with PowerPoint, Keynote, and Google Slides for seamless editing across platforms.


10 diapositivas
Healthcare Services Overview Presentation
Make your healthcare data shine with a presentation that communicates trust, precision, and clarity. Perfect for showcasing services, medical results, or research insights, this clean layout highlights each section with visual balance and professionalism. Fully customizable and compatible with PowerPoint, Keynote, and Google Slides for seamless editing.


6 diapositivas
Workforce Skills Gap Assessment Presentation
Identify, visualize, and address talent gaps with the Workforce Skills Gap Assessment Presentation. This template helps you clearly communicate current capabilities versus future needs across departments or teams. Perfect for HR leaders, L&D strategists, and organizational planners. Fully customizable in PowerPoint, Keynote, Canva, and Google Slides.


10 diapositivas
Corporate Business Plan Strategy Presentation
Present your strategy with professionalism using this Corporate Business Plan slide. Designed with a handshake graphic and clean icon-labeled sections, this layout is ideal for showcasing four key pillars—such as partnerships, operations, goals, and performance. Each title is fully editable, helping you keep your message clear and concise. Compatible with PowerPoint, Keynote, and Google Slides.


6 diapositivas
Startup Business Launch Framework Presentation
Showcase your startup journey with the Startup Business Launch Framework Presentation. This step-by-step visual illustrates four key stages in your business launch process—from ideation to execution—using ascending blocks and modern icons. Ideal for founders, incubators, and pitch decks. Fully customizable in PowerPoint, Keynote, Google Slides, and Canva.


22 diapositivas
Metaphor Advertising Agency Proposal Presentation
The Advertising Agency Proposal Presentation Template offers a polished structure to present your agency's expertise. With slides covering mission, case studies, services, and market analysis, it’s designed to leave a lasting impression. Perfect for securing new clients, it’s fully editable and works seamlessly with PowerPoint, Keynote, and Google Slides.


6 diapositivas
Modern Treatment Plans in Medicine Presentation
Highlight six key elements of your healthcare strategy with the Modern Treatment Plans in Medicine Presentation. This clean, grid-style layout uses pill-shaped icons and vibrant colors to present treatments, initiatives, or categories. Ideal for breaking down complex medical plans. Fully customizable in Canva, PowerPoint, Keynote, and Google Slides.


5 diapositivas
Cognitive Behavioral Therapy Overview Presentation
Help your audience connect the dots between thoughts, feelings, and behaviors with this clean, illustrated layout. Designed to simplify complex mental health concepts, this CBT infographic template is perfect for educators, coaches, or therapists. Fully editable and compatible with PowerPoint, Keynote, and Google Slides for effortless customization.


23 diapositivas
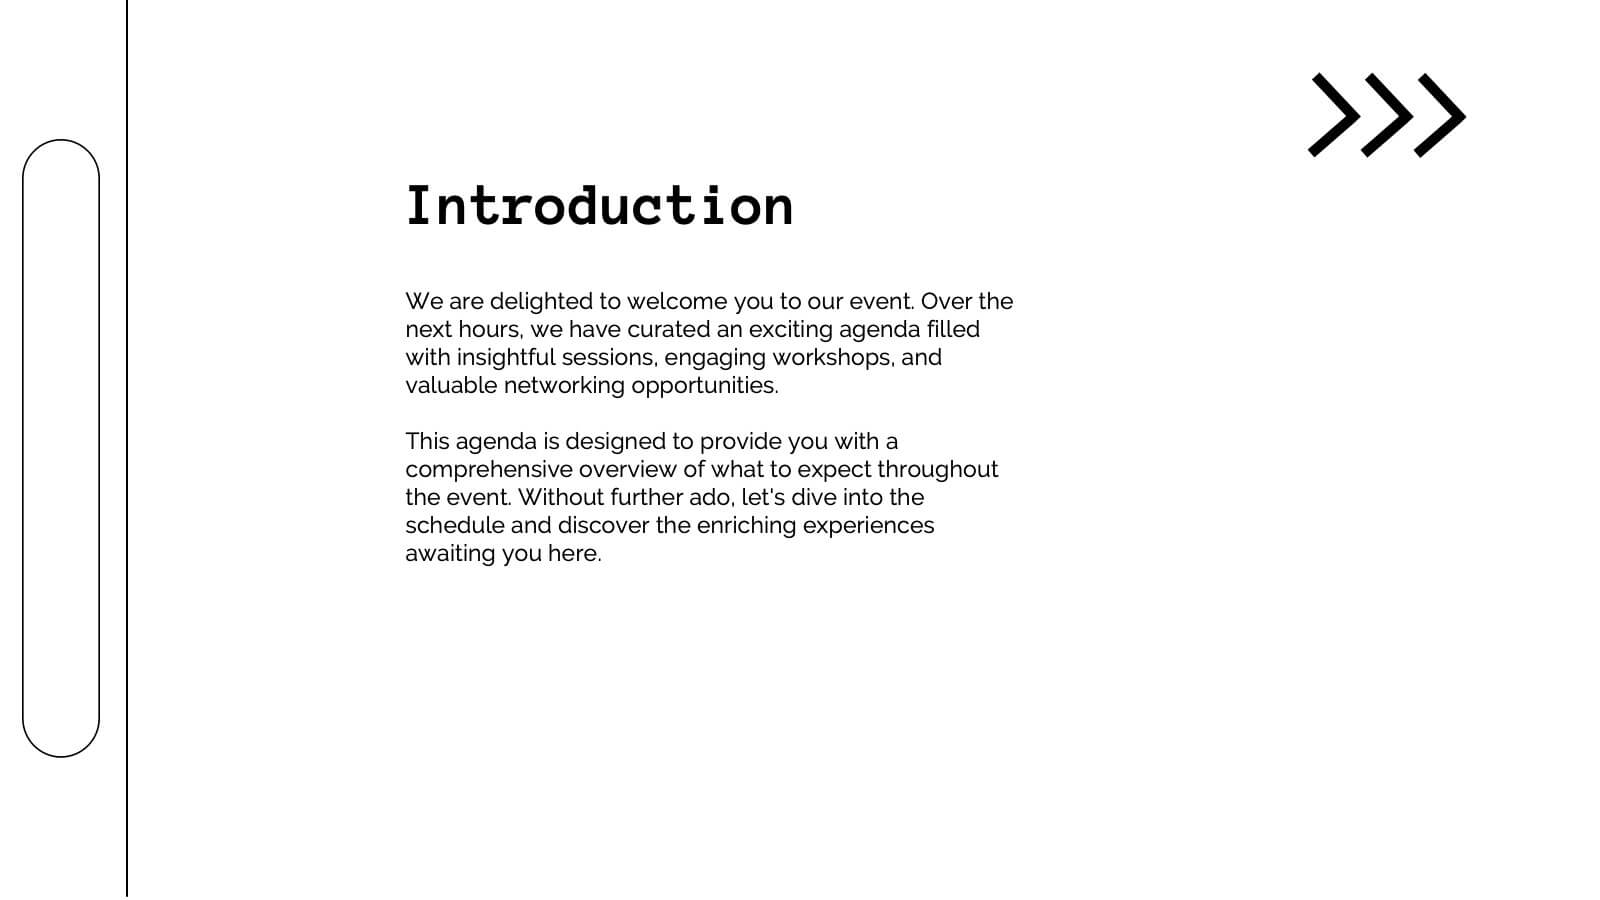
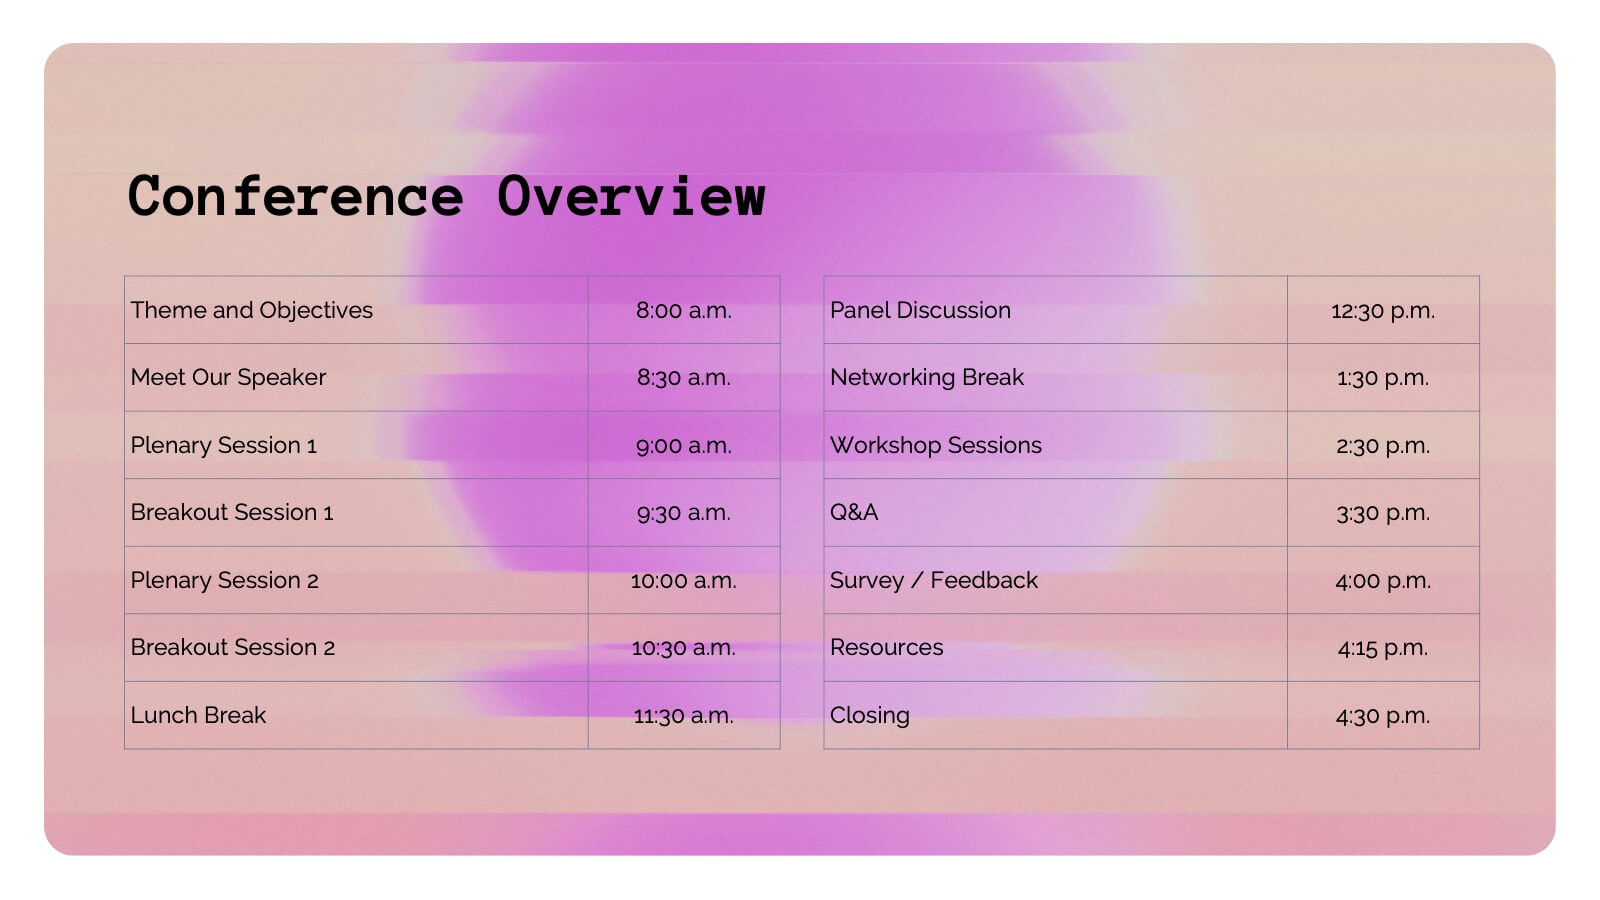
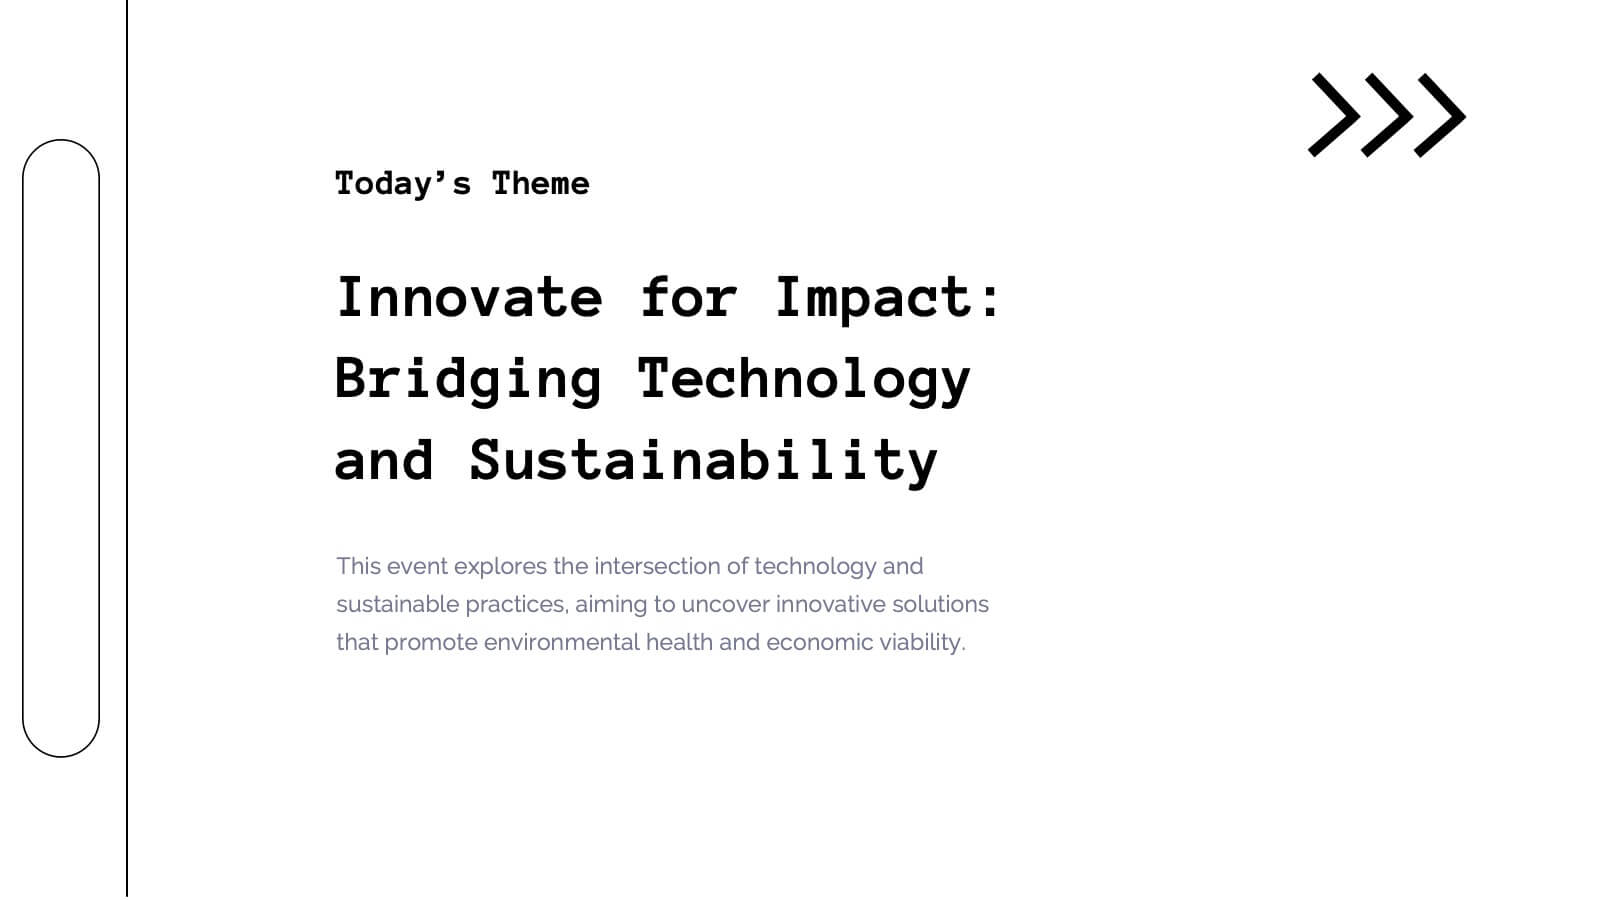
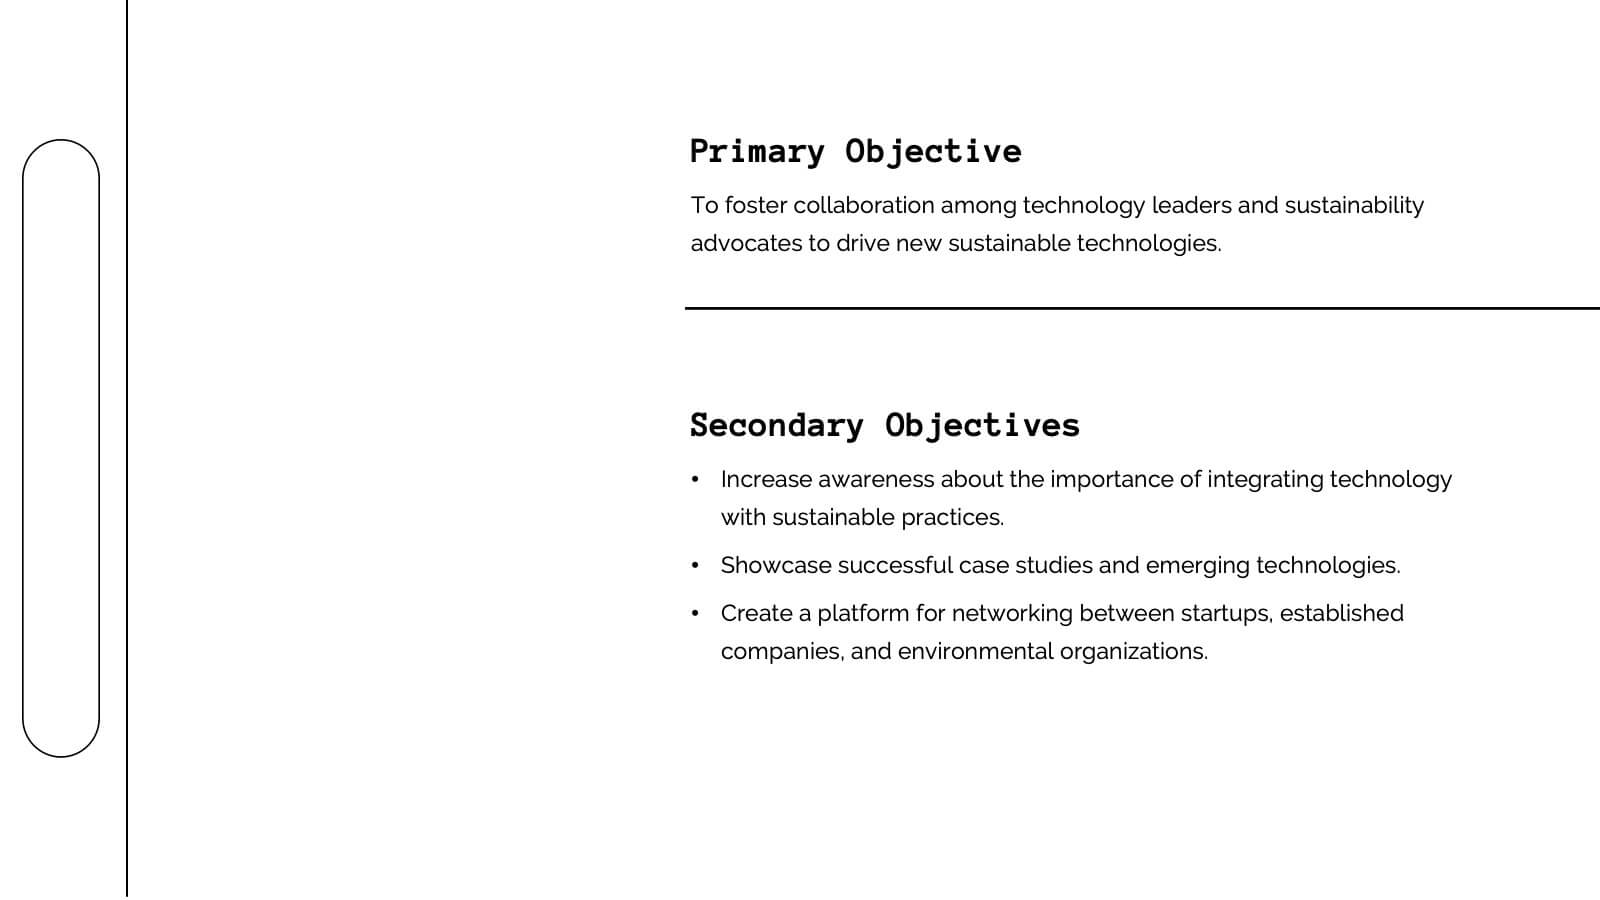
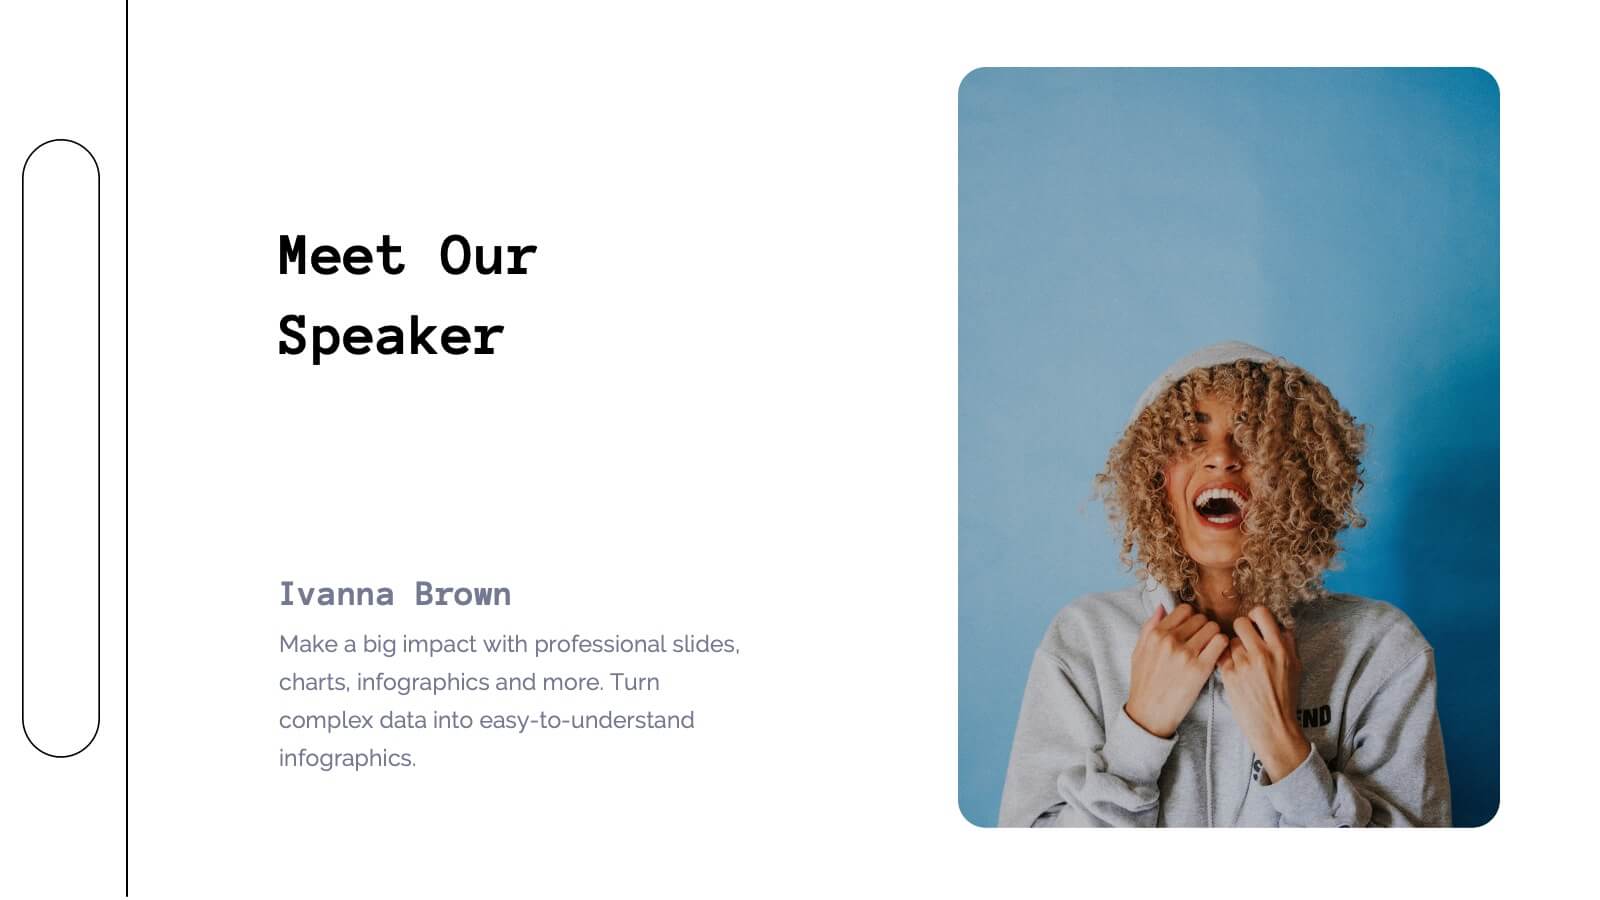
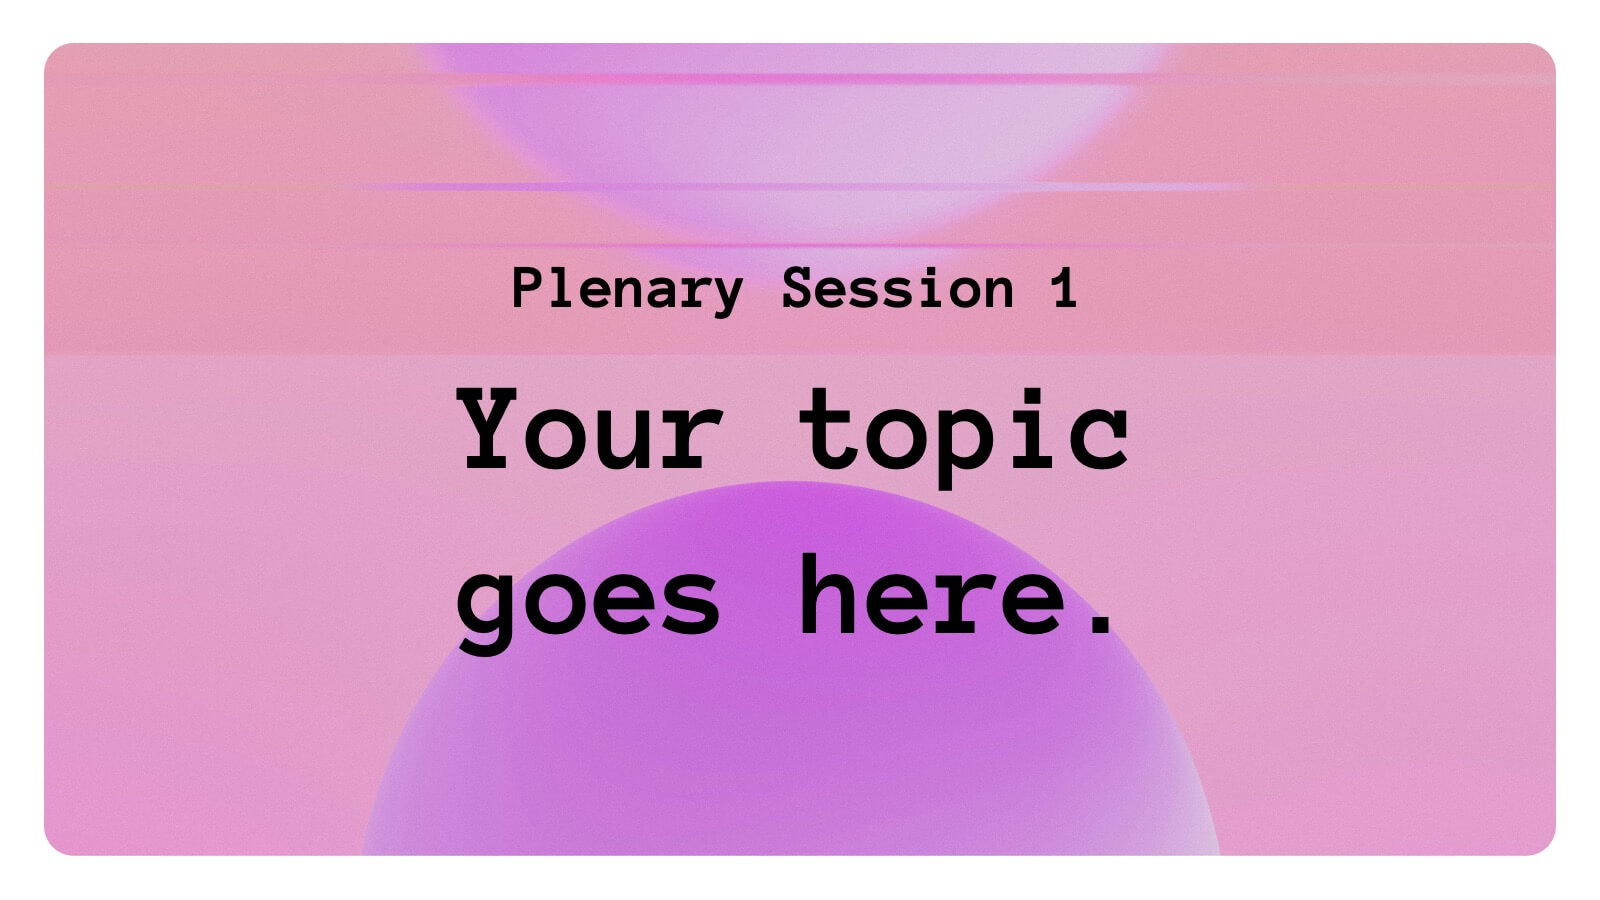
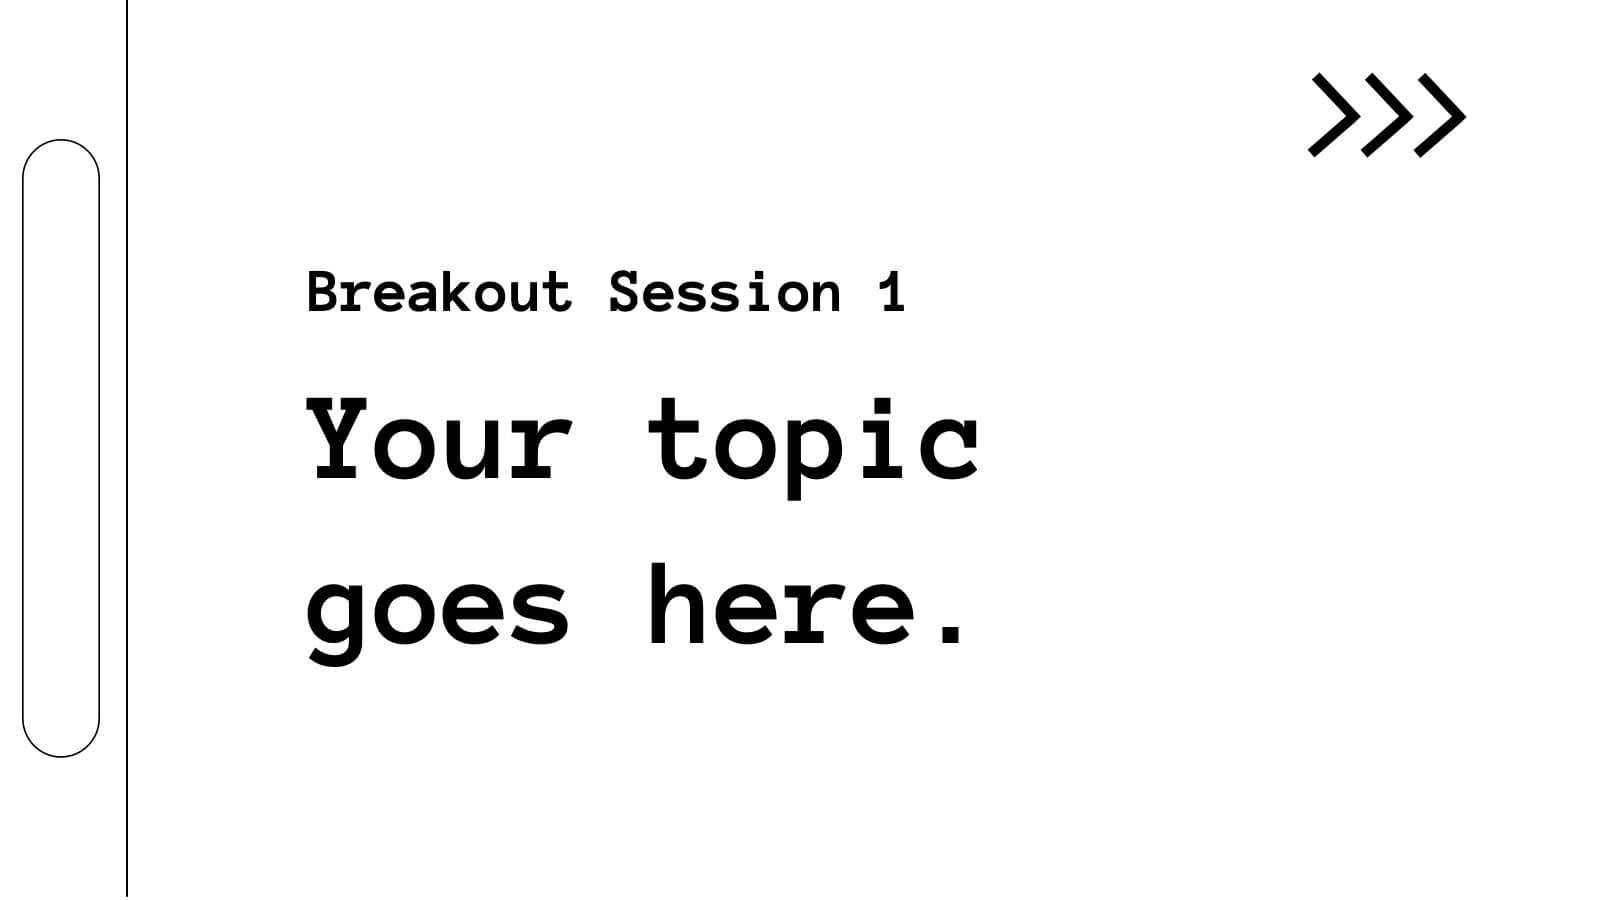
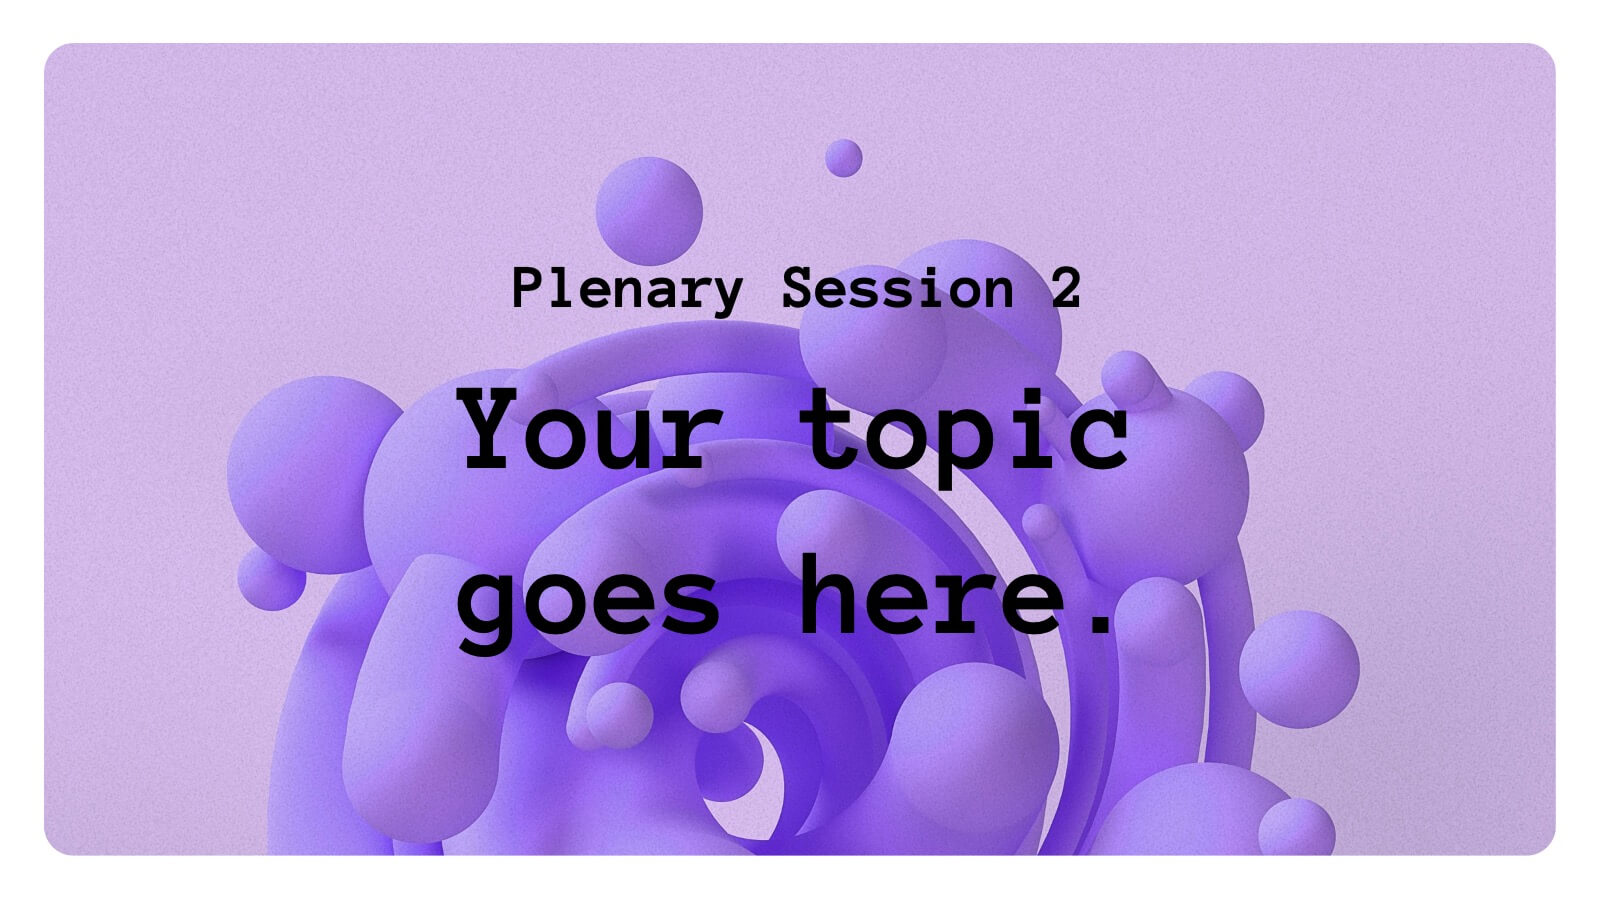
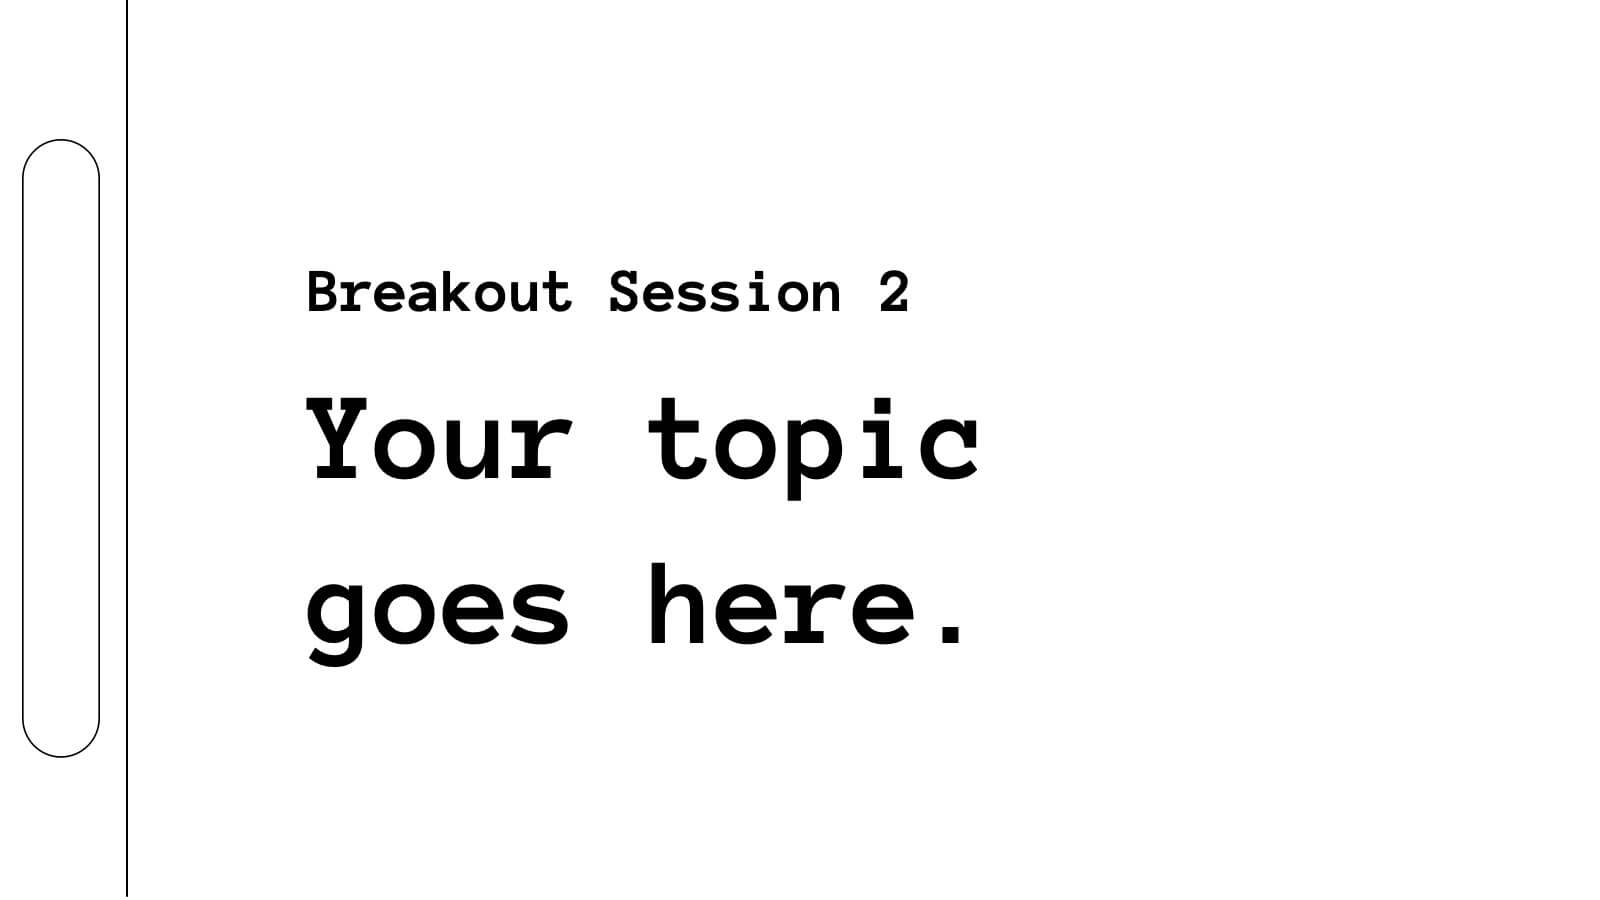
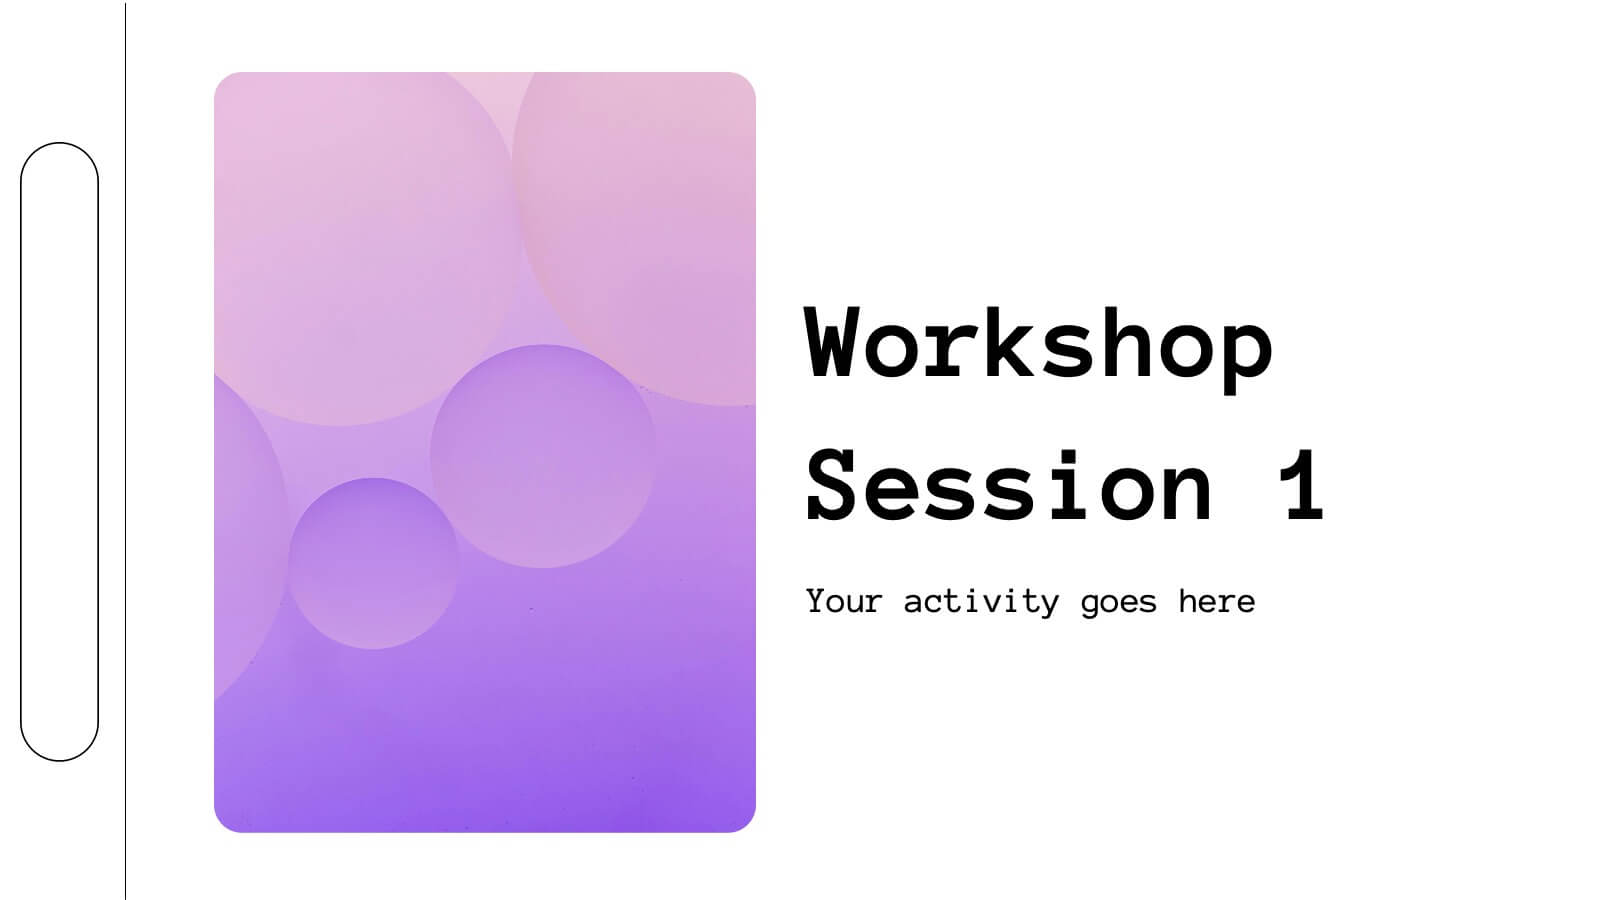
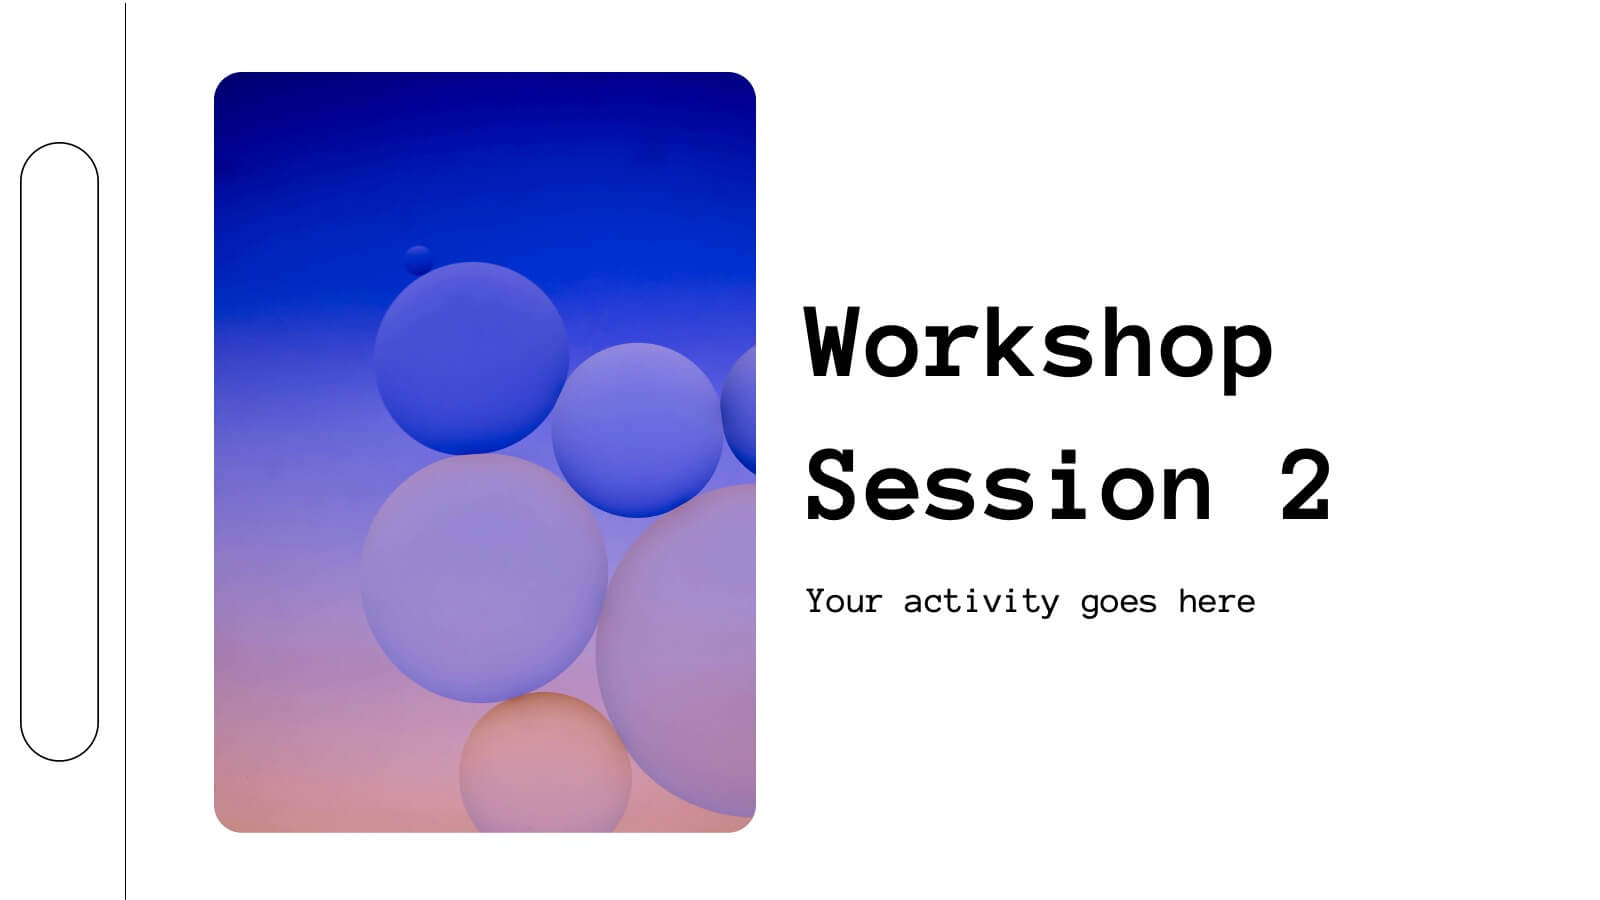
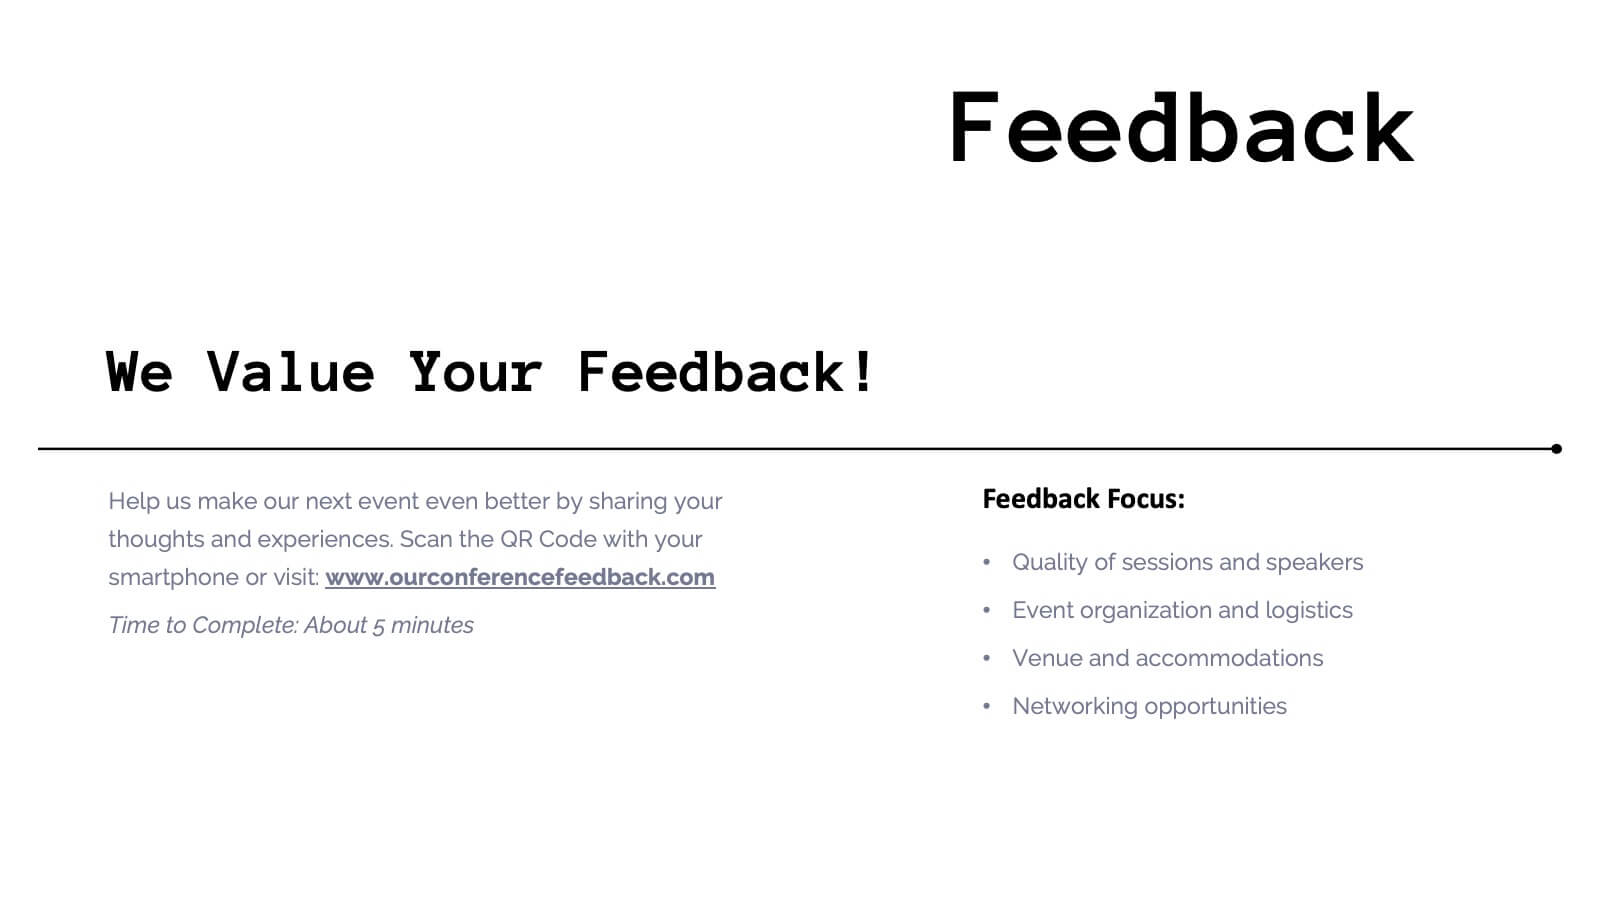
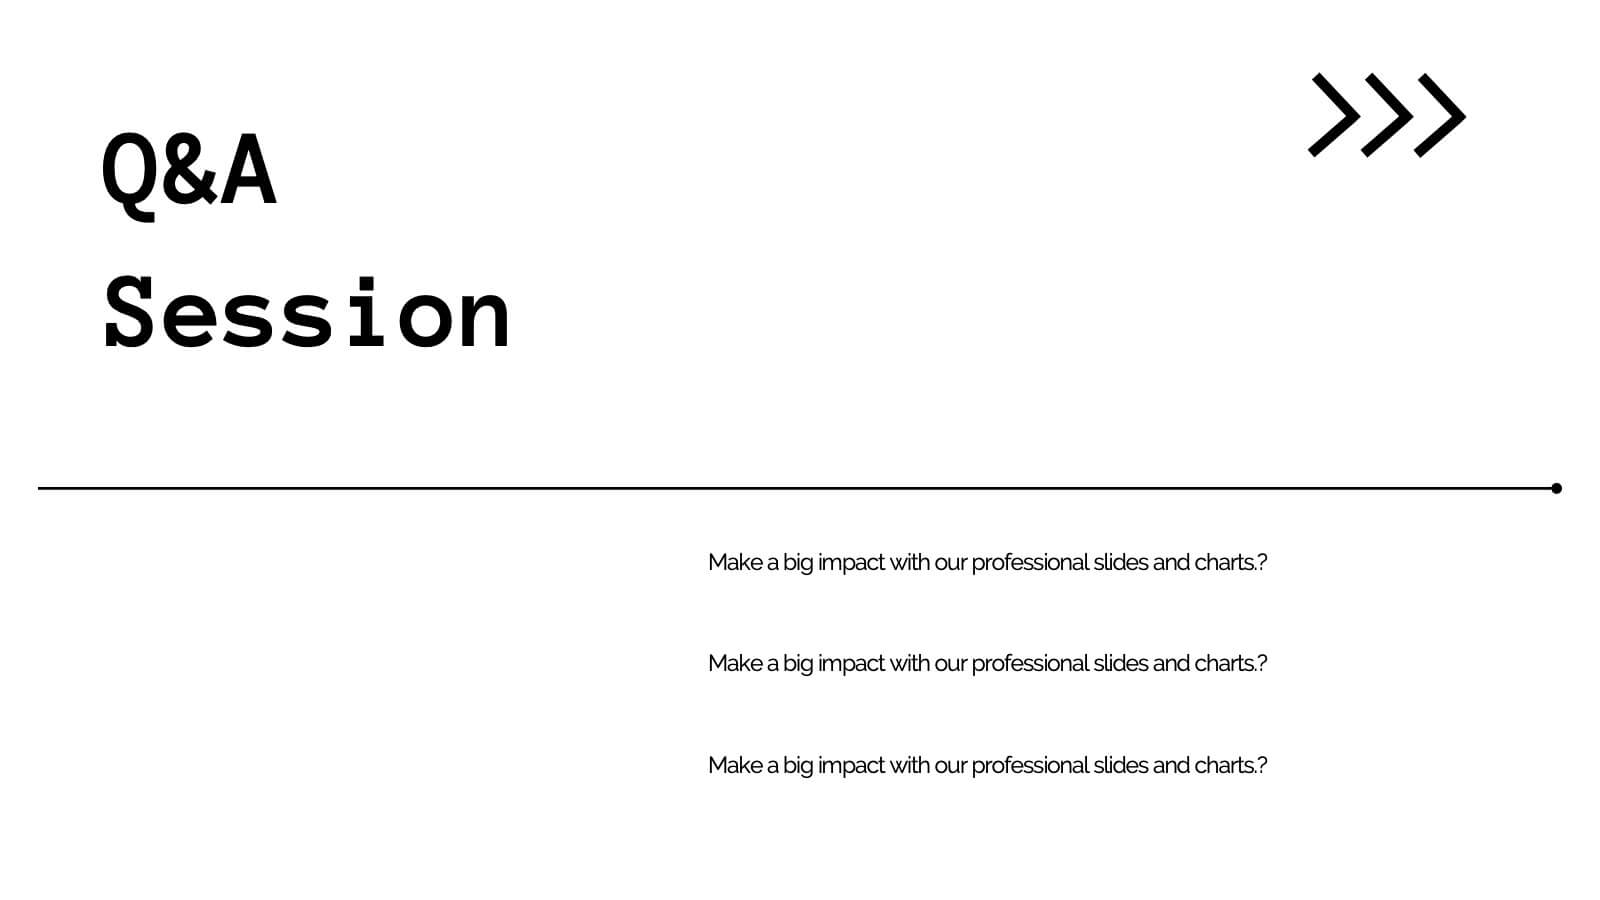
Pomona Business Plan Presentation
This vibrant and adaptable event agenda template is perfect for organizing your business conference or corporate event. It includes customizable sections for session details, speaker information, and key activities like networking breaks, workshops, and panel discussions. Compatible with PowerPoint, Keynote, and Google Slides, it ensures a smooth and engaging event presentation experience!


2 diapositivas
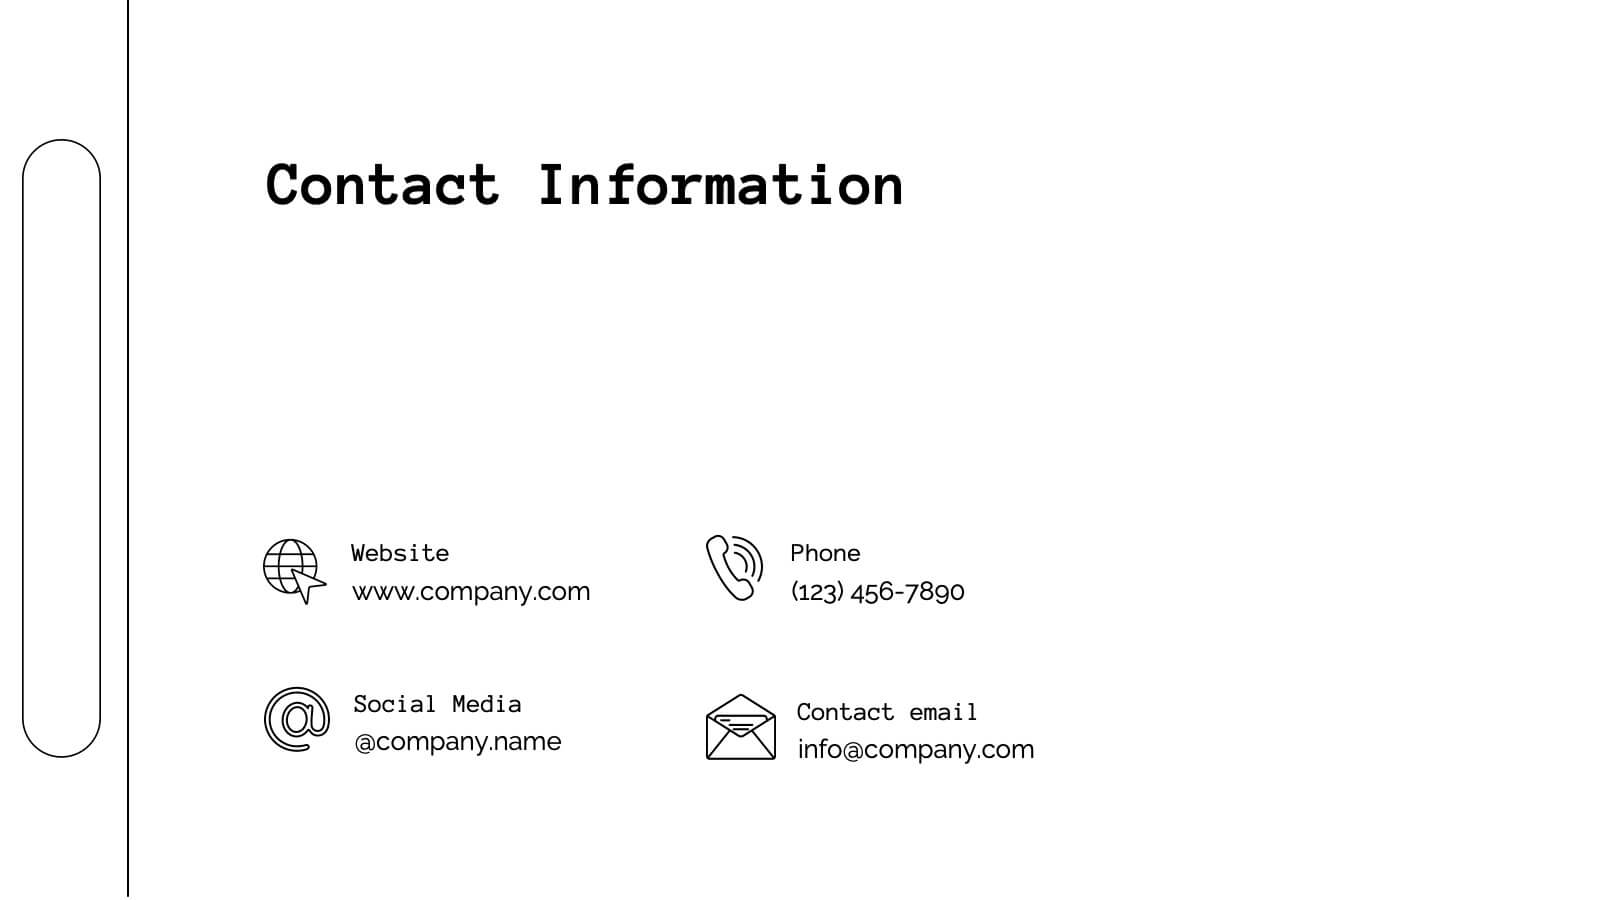
Thank You Message and Contact Info Presentation
End your presentation on a polished note with the Thank You Message and Contact Info Presentation slide. This clean, professional layout features space for your name, company details, and contact information—plus a photo to humanize your brand. Includes light and dark theme options. Fully editable in Canva, PowerPoint, Keynote, and Google Slides.


21 diapositivas
Creative Sales Pitch Presentation
Boost your sales presentations with this sleek, professional template designed to captivate and inform. With its modern design, clear layout, and strategic use of visuals, this template is perfect for showcasing sales strategies, performance metrics, and future opportunities. Compatible with PowerPoint, Keynote, and Google Slides, it's ideal for seamless use across all devices.